ICS🏛️ Institutional Confluence Suite (ICS) Indicator
The Institutional Confluence Suite is a powerful and highly customizable TradingView indicator built to help traders identify key institutional trading concepts across multiple timeframes. It visualizes essential market components like Market Structures (MS), Order Blocks (OB)/Breaker Blocks (BB), Liquidity Zones, and Volume Profile, providing a confluence of institutional price action data.
📈 Key Features & Components
1. Market Structures (MS)
Purpose: Automatically identifies and labels shifts in market trends (Market Structure Shift, MSS) and continuations (Break of Structure, BOS).
Timeframe Detection: You can select detection across Short Term, Intermediate Term, or Long Term swings to match your trading horizon.
Visualization: Plots colored lines (Bullish: Teal, Bearish: Red) to mark the structures and optional text labels (BOS/MSS) for clear identification.
2. Order & Breaker Blocks (OB/BB)
Purpose: Detects and projects potential Supply and Demand zones based on recent price action that led to a swing high or low.
Block Types: Distinguishes between standard Order Blocks and Breaker Blocks (OBs that fail to hold and are traded through, often serving as support/resistance in the opposite direction).
Customization:
Detection Term: Adjusts sensitivity (Short, Intermediate, Long Term).
Display Limit: Sets the maximum number of recent Bullish and Bearish blocks to display.
Price Reference: Option to use the Candle Body (Open/Close) or Candle Wicks (High/Low) to define the block boundaries.
Visualization: Displays blocks as colored boxes (Bullish: Green, Bearish: Red) extending into the future, with a dotted line marking the 50% equilibrium level. Breaker Blocks are indicated by a change in color/line style upon being broken.
3. Buyside & Sellside Liquidity (BSL/SSL)
Purpose: Highlights areas where retail stops/limit orders are likely clustered, often represented by a series of relatively equal highs (Buyside Liquidity) or lows (Sellside Liquidity).
Detection Term: Adjustable sensitivity (Short, Intermediate, Long Term).
Margin: Uses a margin (derived from ATR) to group similar swing points into a single liquidity zone.
Visualization: Plots a line and text label marking the swing point, and a box indicating the clustered liquidity zone.
4. Liquidity Voids (LV) / Fair Value Gaps (FVG)
Purpose: Identifies areas where price moved sharply and inefficiency was created, often referred to as Fair Value Gaps or Imbalances. These are price ranges where minimal trading volume occurred.
Threshold: Uses a multiplier applied to the 200-period ATR to filter for significant gaps.
Mode: Can be set to Present (only show voids near the current price) or Historical (show all detected voids).
Visualization: Fills the price gap with colored boxes (Bullish/Bearish zones), often segmented to represent the price delivery across the gap.
5. Enhanced Liquidity Detection
Purpose: A complementary feature that uses volume and price action to highlight areas of high liquidity turnover, potentially indicating stronger Support and Resistance zones.
Calculation: Utilizes a volume-weighted approach to color-grade liquidity zones based on their significance.
Visualization: Plots shaded boxes (gradient-colored) around swing highs/lows, with text displaying the normalized volume strength.
6. Swing Highs/Lows
Purpose: Directly marks the price points identified as Swing Highs and Swing Lows based on the lookback periods.
Timeframe Detection: Can be enabled for Short Term, Intermediate Term, or Long Term swings.
Visualization: Plots a small colored dot/label (e.g., "⦁") at the swing point.
This indicator is an invaluable tool for traders employing ICT (Inner Circle Trader), Smart Money Concepts (SMC), or general price action strategies, as it automatically aggregates and displays these critical structural and liquidity elements.
"Inner circle trader "に関するスクリプトを検索

Macro Range HighlighterThis Pine Script indicator creates visual boxes that highlight specific time-based price ranges throughout the trading day, operating in New York Eastern Time. It offers two distinct modes: a standard hourly range mode and a classic ICT (Inner Circle Trader) Macro mode.
Two Operating Modes
Mode 1: Standard Hourly 50-09 Ranges (Default)
This mode identifies and highlights the price range during the final 10 minutes of each hour (xx:50) through the first 9 minutes of the next hour (xx:09).
Examples of captured ranges:
08:50 - 09:09
09:50 - 10:09
10:50 - 11:09
11:50 - 12:09
12:50 - 13:09
13:50 - 14:09
14:50 - 15:09
And continues for each hour...
Excluded Time Periods:
The indicator excludes certain periods that cross into or occur during market close and the daily reset:
02:50 - 03:09 (excluded to avoid interference with overnight session)
15:50 - 18:09 (excluded to avoid end-of-regular-hours and the 18:00 ET trading day reset)
This means you will NOT see boxes during the 16:00 or 17:00 hours, as these fall within the excluded window.
Mode 2: Classic ICT Macro Times
When enabled, this mode shows ONLY four specific time windows that are significant in ICT methodology:
02:33 - 02:59 (London Midnight Macro)
04:03 - 04:29 (London Open Macro)
13:10 - 13:39 (New York Lunch Macro)
15:15 - 15:44 (New York Close Macro)
When this mode is active, all standard hourly ranges are disabled, including the 02:50-03:09 range.
Green Line - Open Price
Represents the open price of the first candle when the range begins
This line is static once set - it shows where price opened when entering the time window
Extends horizontally across the entire duration of the box
Example: If the range starts at 08:50 and that candle opens at 18,500, the green line will be drawn at 18,500
Blue Line - Evolving Midpoint
Represents the dynamic midpoint between the range high and range low
This line continuously recalculates as new highs or lows are made within the time window
Calculation: Midpoint = (Range High + Range Low) / 2
Evolution example:
At 08:50, range is 18,480 (low) to 18,520 (high), midpoint = 18,500
At 08:55, price makes new high of 18,540, midpoint updates to 18,510
At 09:02, price makes new low of 18,470, midpoint updates to 18,505
The line visually adjusts up and down as the range expands
Extension: The line extends horizontally from the start of the range to the current bar (or end of range)
This gives traders a visual reference for the "fair value" or equilibrium point of the range
Red Line - Close Price
Represents the close price of the most recent candle within the time window
This line updates continuously with each new bar's close price
Extends horizontally across the range
When the range completes (exits the time window), it shows the final close price of the last bar in the range
Example: As price moves from 08:50 to 09:09, the red line will track the close of each candle: 18,505 → 18,510 → 18,508 → 18,515, etc.
This indicator provides a sophisticated visual framework for analyzing specific time-based price behavior. The evolving midpoint (blue line and optional yellow plot) is particularly powerful because it gives you real-time feedback on where the "fair value" of the range is as it develops, allowing you to make informed decisions about whether price is extended or returning to equilibrium. The three-line system (open/mid/close) creates a complete picture of price action within each critical time window, whether you're using standard hourly analysis or focusing on ICT's specific macro times.

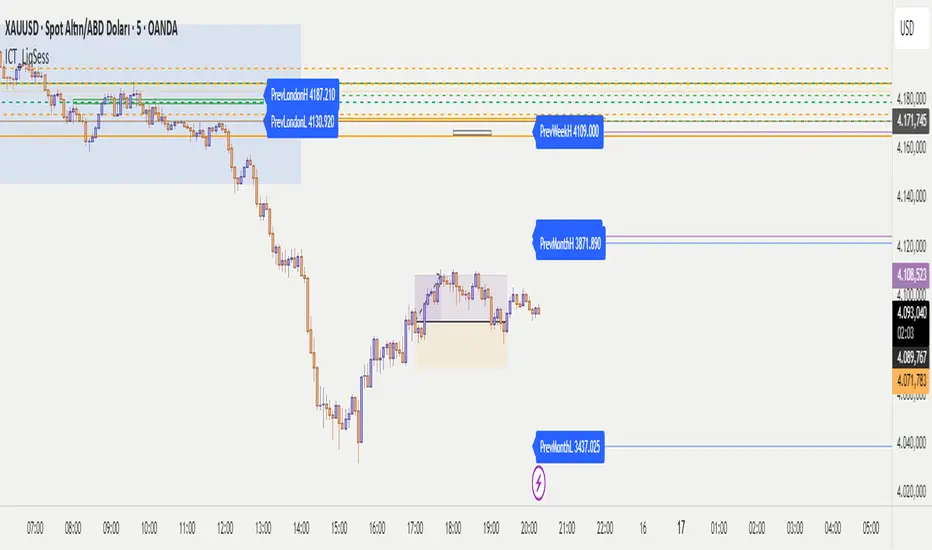
ICT - Liquidity & Sessions (Modular)ICT - Liquidity & Sessions (Modular)
A modular indicator for Inner Circle Trader (ICT) concepts, displaying liquidity zones, session levels, and key price levels.
Features:
Daily Levels:
Previous Day High/Low (PDH/PDL)
Previous Day Open/Close (PDO/PDC)
True Day Open (TDO) — NY 00:00
Current Day Open
Higher Timeframe Levels:
Previous Weekly High/Low
Previous Monthly High/Low
Session Analysis:
Session boxes: Asia, London, New York, Sydney, NY Lunch
Previous session High/Low for liquidity identification
Session open vertical lines
Session midlines (50% of session range)
Customization:
Toggle any level on/off
Customize colors, line styles, and widths
Adjustable session times (NY timezone)
Session box opacity control
Light mode option
Alerts:
Price crosses PDH/PDL
Price crosses Weekly/Monthly levels
Session open notifications
Performance:
Auto-cleanup of old lines/labels
Efficient drawing to prevent chart clutter
Modular design for easy customization
How to Use:
Add the indicator to your chart
Configure session times in the "Session Times (NY)" group
Enable/disable levels in the settings
Customize colors and styles to match your preference
Set up alerts for key level breaks
Perfect for:
ICT traders identifying liquidity zones
Session-based trading strategies
Multi-timeframe analysis
Identifying key support/resistance levels
Note: This indicator uses NY timezone for session calculations. Adjust session times in the settings to match your trading hours.
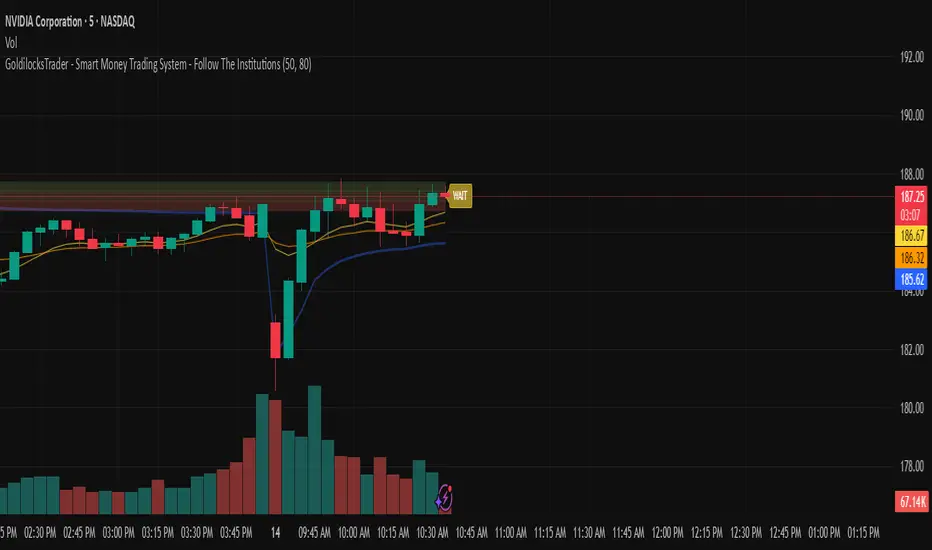
GoldilocksTrader – Institutional Zones + Smart Money Market ModeThe GoldilocksTrader – Smart Money Trading System is a powerful institutional-grade tool designed for traders who want to follow real liquidity, identify institutional zones, and accurately read Smart Money market structure.
This indicator automatically detects Supply & Demand Zones, plots Institutional Pivot Levels, builds dynamic fade-strength heatmaps, and labels the current Market Mode (ACCUMULATE, DISTRIBUTE, WAIT)—all powered by a clean, real-time algorithm that updates with every candle.
This system helps you understand where banks, hedge funds, and institutions are likely to defend price, accumulate positions, or engineer liquidity sweeps. It makes complex Smart Money concepts simple, visual, and trader-friendly.
🧠 Core Features
✔ Institutional Supply & Demand Zones (auto-detected from swing pivots)
✔ Smart Money fade-strength heatmap using multi-layered boxes
✔ Market Mode Detection:
• ACCUMULATE – Smart Money loading long positions
• DISTRIBUTE – Smart Money unloading into premium levels
• WAIT – Neutral / imbalance zones
✔ EMA 9/21 Trend Filters
✔ VWAP Institutional Bias Filter
✔ Nearest Above/Below Liquidity Zones with clean readability
✔ Adjustable Transparency & Zone Thickness
✔ Compact On-Chart Legend (optional)
✔ Extremely lightweight, low-lag, optimized for all markets/timeframes
✔ Works for Forex, Crypto, Stocks, Indices, Futures, Commodities
📈 Trading Concepts Covered
This indicator is built around world-class concepts used by top proprietary desks and Smart Money traders, including:
ICT (Inner Circle Trader) Supply/Demand
Liquidity Zones & Institutional Order Blocks
Wyckoff Accumulation / Distribution
Imbalance & Fair Value Behavior (FVG-style fades)
Market Maker Models (MMXM + Premium/Discount Zones)
Pivot-based liquidity mapping
VWAP Institutional Bias
Trend Continuation vs. Reversal Zones
If you trade SMC, ICT, Wyckoff, Smart Money, Algo-based models, or institutional liquidity, this indicator is a perfect companion.
🚀 How It Helps You Trade
🔹 Identify hidden institutional levels where real accumulation or distribution occurs
🔹 Avoid bad trades by staying out of “WAIT” zones where most of the retail market enters.
🔹 Time entries during premium vs. discount pricing
🔹 Understand where price is expected to react, reverse, or continue
🔹 Visualize institutional pressure with fade-strength heatmaps
🔹 Combine with your own strategy to increase precision and confidence
🎨 Clean, Professional Visualization
Zones auto-extend to the left for historical context
Fade opacity increases or decreases depending on zone strength
Market Mode label plotted dynamically near relevant price zones
Optional compact legend for fast reading
All elements can be toggled and customized to your style.
⭐ Created by GoldilocksTrader™
For more institutional-level tools—including the new and soon to be popular "GoldilocksTrader Buy-Sell Signals with Built-In Optimizer"—search:
👉 “GoldilocksTrader” on TradingView
👉 Visit GoldilocksTrader.com for premium systems & education
Follow the institutions.
Trade Smart.
Trade Goldilocks™..."it's just right"
ATHENS Gold ICT + Smart Money [Advanced Signals]🎯 ADVANCED ICT + SMART MONEY CONFLUENCE INDICATOR
This indicator combines Inner Circle Trader (ICT) concepts with Smart Money theory to deliver high-probability trading signals based on institutional order flow and market structure.
━━━━━━━━━━━━━━━━━━━━━━━━━━━━━━━━━━━━━━━━
⚡ KEY FEATURES:
✅ ICT CONFLUENCE SYSTEM (0-4 Score)
• Order Blocks (Institutional Entry Zones)
• Fair Value Gaps (Price Imbalances)
• Liquidity Sweeps (Stop Hunt Detection)
• Market Structure (BOS & ChoCh)
✅ SMART SIGNALS
• Signals only trigger with minimum confluence
• Customizable requirements (OB/FVG/Liquidity)
• Filters out low-quality setups
• Higher win rate potential (65-85%)
✅ VISUAL COMPONENTS
• Order Blocks (OB+ / OB-)
• Fair Value Gaps (FVG↑ / FVG↓)
• Liquidity Zones (💧 markers)
• Break of Structure (BOS)
• Change of Character (ChoCh)
✅ PERSISTENT TP/SL LINES
• Entry, Stop Loss, TP1, TP2
• Automatically calculated from OB levels
• Lines extend across chart canvas
• Clear risk:reward visualization
✅ SMART DASHBOARD
• Real-time confluence score
• Component status (OB/FVG/Liquidity)
• Trend direction & RSI
• Signal strength indicator
━━━━━━━━━━━━━━━━━━━━━━━━━━━━━━━━━━━━━━━━
🎯 HOW IT WORKS:
The indicator scores each setup based on 4 key components:
1️⃣ ORDER BLOCK PRESENCE
• Bullish OB = Last bearish candle before strong move up
• Bearish OB = Last bullish candle before strong move down
• Price must be in OB zone
2️⃣ FAIR VALUE GAP (FVG)
• Gap between 3 candles indicating imbalance
• Price tends to fill these gaps
• Bounce from FVG = high probability entry
3️⃣ LIQUIDITY SWEEP
• Price sweeps recent high/low
• Retail stop losses triggered
• Smart money enters opposite direction
4️⃣ MARKET STRUCTURE
• Bullish = HH + HL
• Bearish = LH + LL
• Confirms trend direction
CONFLUENCE SCORE:
- 4/4 = Excellent (75-85% win rate)
- 3/4 = Good (65-75% win rate)
- 2/4 = Moderate (55-65% win rate)
- 1/4 = Weak (avoid)
━━━━━━━━━━━━━━━━━━━━━━━━━━━━━━━━━━━━━━━━
⚙️ CUSTOMIZABLE SETTINGS:
SIGNAL REQUIREMENTS:
- Require Order Block (ON/OFF)
- Require FVG (ON/OFF)
- Require Liquidity Sweep (ON/OFF)
- Minimum Confluence (1-4)
VISUAL SETTINGS:
- Show/Hide OB, FVG, BOS, ChoCh
- Adjustable lookback periods
- Customizable colors
- Line extension length
RISK MANAGEMENT:
- Risk:Reward ratio (1:1 to 5:1)
- Stop Loss buffer (%)
- Auto TP/SL calculation
- Clear old lines option
━━━━━━━━━━━━━━━━━━━━━━━━━━━━━━━━━━━━━━━━
📈 RECOMMENDED SETTINGS:
CONSERVATIVE (High Quality):
- Require OB: ON
- Require FVG: ON
- Min Confluence: 3/4
- Result: 1-2 signals/day, 70-80% win rate
BALANCED (Recommended):
- Require OB: ON
- Require FVG: OFF
- Min Confluence: 2/4
- Result: 2-4 signals/day, 60-70% win rate
AGGRESSIVE (More Signals):
- Require OB: OFF
- Require FVG: OFF
- Min Confluence: 2/4
- Result: 3-6 signals/day, 55-65% win rate
━━━━━━━━━━━━━━━━━━━━━━━━━━━━━━━━━━━━━━━━
🎯 BEST PRACTICES:
✅ Trade 3/4 or 4/4 confluence signals only
✅ Confirm with higher timeframe (H4/Daily)
✅ Trade during kill zones (London/NY open)
✅ Use proper position sizing (1-2% risk)
✅ Wait for all components to align
✅ Respect stop losses
✅ Take partial profits at TP1
❌ Don't trade 1/4 confluence signals
❌ Don't ignore liquidity sweeps
❌ Don't trade against higher TF trend
❌ Don't overtrade (quality > quantity)
━━━━━━━━━━━━━━━━━━━━━━━━━━━━━━━━━━━━━━━━
⚡ SIGNAL TYPES:
🟢 BUY SIGNAL (Green Triangle)
- Appears when bullish confluence met
- Label shows "BUY ICT"
- Blue entry line + Red SL + Green/Lime TPs
- Long opportunity
🔴 SELL SIGNAL (Red Triangle)
- Appears when bearish confluence met
- Label shows "SELL ICT"
- Blue entry line + Red SL + Green/Lime TPs
- Short opportunity
━━━━━━━━━━━━━━━━━━━━━━━━━━━━━━━━━━━━━━━━
📊 SUITABLE FOR:
- Gold (XAUUSD) - Optimized
- Forex pairs (Major pairs)
- Indices (US30, NAS100, SPX500)
- Crypto (BTC, ETH - adjust settings)
Recommended Timeframes:
- 15M - Primary for scalping
- 5M - Entry refinement
- 1H - Swing trading
- H4/Daily - Trend confirmation
━━━━━━━━━━━━━━━━━━━━━━━━━━━━━━━━━━━━━━━━
⚠️ DISCLAIMER:
This indicator is for educational purposes only. Past performance does not guarantee future results. Always:
- Practice on demo account first
- Use proper risk management
- Never risk more than you can afford to lose
- Seek professional financial advice
- Understand that trading carries risk
━━━━━━━━━━━━━━━━━━━━━━━━━━━━━━━━━━━━━━━━
🎓 BASED ON:
- ICT (Inner Circle Trader) Concepts
- Smart Money Theory
- Order Flow Analysis
- Institutional Trading Zones
- Market Structure Theory
━━━━━━━━━━━━━━━━━━━━━━━━━━━━━━━━━━━━━━━━
📢 FEATURES SUMMARY:
✅ Confluence-based signals (not random)
✅ Order Blocks + FVG + Liquidity integration
✅ Persistent TP/SL lines (scroll-friendly)
✅ Smart dashboard (real-time info)
✅ Customizable requirements
✅ High-probability setups
✅ Professional trading approach
✅ Works on multiple assets
✅ Clean visual presentation
✅ Beginner to advanced friendly
━━━━━━━━━━━━━━━━━━━━━━━━━━━━━━━━━━━━━━━━
Trade smart. Trade with confluence. 🎯
#ICT #SmartMoney #OrderBlocks #FVG #Gold #Forex #TradingStrategy #Confluence

FVG Visual Super Clean (ticks)This is a robust and highly visual indicator designed for traders utilizing Smart Money Concepts (SMC) or Inner Circle Trader (ICT) methodologies.
Its core function is to automatically identify, visualize, and manage Fair Value Gaps (FVGs) or price inefficiencies, offering deep insight into institutional order flow.
Key Features & Capabilities
Advanced FVG Detection: Accurately identifies bullish and bearish Fair Value Gaps (FVGs) based on the 3-bar pattern.
Wick vs. Body Logic: Configurable option to use candle wicks (high/low) or bodies (open/close) for FVG calculation.
Displacement Confirmation: Includes an optional filter to require price displacement (a strong close) for higher conviction setups.
Mitigation Tracking & Management: The script actively tracks how much the price has filled or "mitigated" the FVG.
Threshold Auto-Removal: FVGs that reach a user-defined mitigation percentage (mitigation_pct) are automatically removed to keep the chart clean.
Mitigated Visibility: An optional setting allows mitigated FVGs to remain visible, repainting them with a distinct "Mitigated" color (blue by default) to show the exact point of rebalance.
Visual Efficiency:
Automatic Extension: Active, unmitigated FVGs are automatically extended forward in time until they are filled or pruned.
Equilibrium Line: Draws a dotted line at the 50% level (Equilibrium) of each FVG, a key reference point in SMC/ICT trading.
Tick-Based Filtering: Allows filtering gaps by a minimum size in ticks, reducing noise from insignificant micro-gaps.
Trend Context: Integrates a configurable Moving Average (EMA or SMA) for contextual trend analysis. The MA line changes color dynamically (green/red) to quickly signal momentum.
Optimized Performance: Implements a lookback window (lookback_days) and a cleanup routine to manage the number of drawing objects, ensuring smooth performance even on low timeframes.
Ideal For:
Traders focused on SMC/ICT Order Blocks, Imbalances, and Price Delivery.
Backtesting price action strategies around institutional liquidity.
Identifying high-probability entries (e.g., at the 50% line) and targets (e.g., unmitigated gaps).

coinbot_ICT_Unicorn(AUTOTRADE)1. 🎯 핵심 기능: 자동매매 신호 전송 (Webhook)
이 스크립트는 매매 신호가 발생할 때마다, 사용자가 '자동매매 설정(Autotrade Settings)'에 입력한 값들을 조합하여 구체적인 JSON 메시지를 생성하고 alert() 함수를 통해 웹훅으로 전송합니다.
입력 설정: user_id, exchange(거래소), leverage(레버리지), capital_percent(투입 시드 %), sl_percent(손절 %), 그리고 3단계 분할 익절(tp1_price_percent, tp1_qty_percent 등) 설정을 입력받습니다.
신호 종류:
ENTRY (진입): 매수(buy) 또는 매도(sell) 신호가 발생하면, 위 모든 설정값을 포함한 진입 명령을 보냅니다.
CLOSE (손절): 전략의 내부 로직에 의해 손절가에 도달하면(slAlertTick), 포지션을 종료하라는 신호를 보냅니다.
TAKE_PROFIT (익절): 목표가에 도달하면(tpAlertTick), 설정된 물량만큼 익절하라는 신호를 보냅니다.
2. 📈 작동 원리: "ICT 유니콘" 매매 전략
이 스크립트의 진입 로직은 ICT(Inner Circle Trader) 개념 중 하나인 **'유니콘 모델'**을 따릅니다.
구성 요소 식별:
Breaker Block (BB): '브레이커 블록'을 식별합니다. 이는 특정 고점/저점을 만든 후 그 방향으로 가지 못하고 반대 방향으로 돌파(Break)된 오더 블록(Order Block)입니다.
Fair Value Gap (FVG): '공정 가치 갭' (가격 불균형 영역)을 식별합니다.
핵심 진입 신호 (Unicorn): 이 전략의 핵심 진입 조건은 **Breaker Block(BB)과 Fair Value Gap(FVG)이 중첩(Overlap)**되는, 소위 '유니콘'이라 불리는 강력한 지지/저항 영역이 발생하는 것입니다.
Long (매수) 진입:
가격이 하락하며 **'하락형 브레이커 블록(Bearish Breaker Block)'**을 만듭니다.
이후 가격이 상승 돌파하며 이 브레이커 블록 영역과 중첩되는 **'상승형 FVG(Bullish FVG)'**를 생성합니다.
이 중첩 영역(FVG-BB Overlap)이 바로 매수 진입의 근거가 됩니다. (코드가 dbgRequireRetracement 설정에 따라 FVG로의 되돌림을 기다리거나 즉시 진입 신호를 보냅니다.)
Short (매도) 진입:
가격이 상승하며 **'상승형 브레이커 블록(Bullish Breaker Block)'**을 만듭니다.
이후 가격이 하락 돌파하며 이 브레이커 블록 영역과 중첩되는 **'하락형 FVG(Bearish FVG)'**를 생성합니다.
이 중첩 영역이 매도 진입의 근거가 됩니다.
3. 📊 부가 기능
시각화: 차트 상에 FVG 영역과 Breaker Block 영역을 박스로 그려주어(설정에 따라 표시/숨김 가능) 매매 근거를 시각적으로 확인할 수 있게 합니다.
백테스팅 대시보드: 차트 우측 상단(기본값)에 이 전략의 누적 성과(총 진입 횟수, 승/패, 승률, 총수익률)를 보여주는 대시보드를 표시합니다.
요약
이 스크립트는 **"Breaker Block과 FVG의 중첩(유니콘 모델)"**을 유일한 진입 조건으로 사용하는 매우 구체적인 ICT 전략입니다. 이 조건이 충족되면, 사용자가 미리 설정한 상세한 리스크 관리 값들을 담아 자동매매 봇으로 즉시 실행 가능한 주문 신호를 전송하는 '올인원(All-in-One)' 전략 스크립트입니다.
요청하신 대로, 해당 지표 요약본을 영어로 번역하여 제공합니다.
This script is an automated trading (Autotrade) strategy signal generator based on the ICT "Unicorn" trading model.
As the "AUTOTRADE" in its name implies, the core purpose of this indicator is to detect specific conditions on the chart and send JSON-formatted order signals (webhooks) to an external automated trading bot.
Here are the core mechanics and features of this script:
1. 🎯 Core Feature: Automated Signal Transmission (Webhook)
Whenever a trade signal occurs, this script generates a specific JSON message by combining the values entered by the user in the "Autotrade Settings" and sends it via webhook using the alert() function.
Input Settings: It takes inputs for user_id, exchange, leverage, capital_percent (equity %), sl_percent (stop loss %), and settings for 3-stage split take-profits (e.g., tp1_price_percent, tp1_qty_percent).
Signal Types:
ENTRY: When a "buy" or "sell" signal occurs, it sends an entry command including all the settings above.
CLOSE (Stop-Loss): If the price hits the stop loss according to the strategy's internal logic (slAlertTick), it sends a signal to close the position.
TAKE_PROFIT: When a profit target is reached (tpAlertTick), it sends a signal to take profit on the specified quantity.
2. 📈 How It Works: The "ICT Unicorn" Strategy
The script's entry logic follows the "Unicorn Model," one of the concepts from ICT (Inner Circle Trader).
Identifying Components:
Breaker Block (BB): It identifies a "Breaker Block." This is an Order Block that, after creating a specific high/low, fails to continue in that direction and is instead broken through in the opposite direction.
Fair Value Gap (FVG): It identifies a "Fair Value Gap" (a price imbalance area).
Core Entry Signal (The Unicorn): The core entry condition for this strategy is the overlap of a Breaker Block (BB) and a Fair Value Gap (FVG), which creates a powerful support/resistance zone known as the "Unicorn."
Long Entry:
Price moves down, creating a "Bearish Breaker Block."
Subsequently, price breaks upward, creating a "Bullish FVG" that overlaps with this Breaker Block area.
This overlapping area (FVG-BB Overlap) becomes the basis for the long entry. (Depending on the dbgRequireRetracement setting, the code either waits for a retracement to the FVG or sends an immediate entry signal.)
Short Entry:
Price moves up, creating a "Bullish Breaker Block."
Subsequently, price breaks downward, creating a "Bearish FVG" that overlaps with this Breaker Block area.
This overlapping area becomes the basis for the short entry.
3. 📊 Additional Features
Visualization: It draws the FVG and Breaker Block zones as boxes on the chart (can be toggled in settings), allowing for visual confirmation of the trade setup.
Backtesting Dashboard: It displays a dashboard in the top-right corner (by default) showing the strategy's cumulative performance (total entries, wins/losses, win rate, total profit).
Summary
This script is a highly specific ICT strategy that uses the "overlap of a Breaker Block and an FVG (the Unicorn Model)" as its sole entry condition. When this condition is met, it transmits an immediately executable order signal to an automated trading bot, complete with all the detailed risk management values preset by the user. It is an "all-in-one" strategy script.

IRONBULL FX AMD📌 Power Of 3 ICT 01 – AMD ICT & SMC Accumulations
Overview:
The Power Of 3 ICT 01 indicator by TradingFinder is designed to visually map out the classic Accumulation–Manipulation–Distribution (AMD) phases of price behavior, based on ICT (Inner Circle Trader) and Smart Money Concepts (SMC) principles. It helps traders recognize the underlying structure of the trading day using session-based detection aligned to the New York timezone.
🔍 Core Logic:
This script divides each trading day into three logical phases:
Accumulation (19:00–01:00 EST)
The period when institutions quietly build positions within a tight range.
Manipulation (01:00–07:00 EST)
False moves designed to induce retail participation in the wrong direction.
Distribution (07:00–13:00 EST)
The actual directional move after trapping liquidity.
These zones are visually marked on the chart using colored transparent boxes, with labels for clear identification.
🛠️ Key Features:
Session-Based Detection:
Uses Pine Script’s time() function to identify when the chart time falls within each of the defined AMD sessions.
Automatic High/Low Range Detection:
For each phase, the indicator tracks the highest high and lowest low within the session window to draw a price range box.
Visual Markers:
Distinct labels and shaded boxes are plotted for each zone:
🔹 Accumulation → Blue
🔸 Manipulation → Orange
🟢 Distribution → Cyan
Fully Customizable Settings:
Each phase’s visibility, session time, and color can be adjusted from the input panel.
📈 Ideal Use Case:
For traders following ICT/SMC methodology
For intraday structure mapping
To combine with other tools like Order Blocks, FVGs, or session breakouts
⚙️ Customization Options:
✅ Toggle visibility for each phase independently
🕒 Modify session start/end times
🎨 Choose custom colors for phase boxes and labels
⚠️ Note: Best used on intraday timeframes (60 min or lower). The indicator is optimized for charts set to the America/New_York timezone.

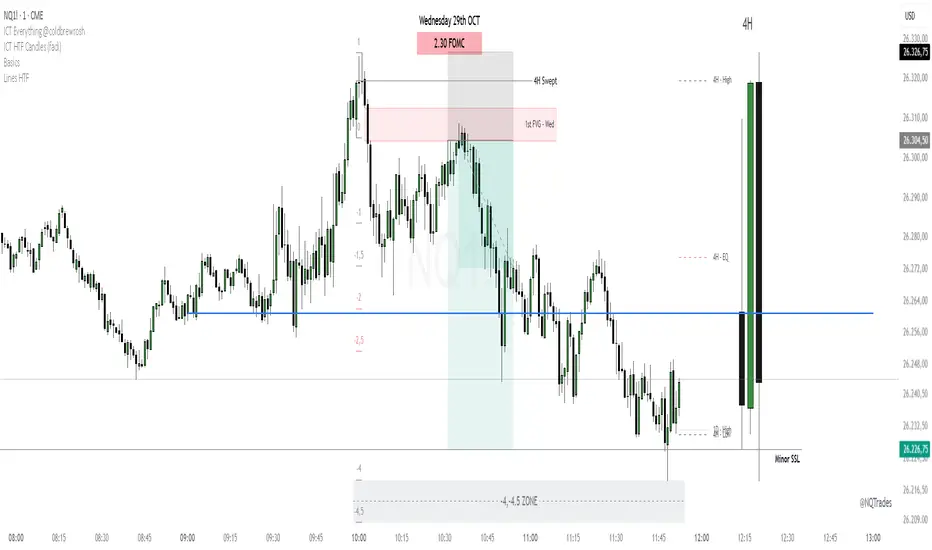
ICT 1st FVG + Date/News [NQTrades]🎯 Indicator Summary: ICT 1st FVG + Date/News
This indicator combines a core ICT (Inner Circle Trader) concept—the tracking of the first Fair Value Gap (FVG) of a session—with convenient on-screen information about the current date and scheduled economic news events.
🟢 Section 1: 1st FVG (Fair Value Gap) Tracker
This logic is dedicated to automatically detecting and visualizing the very first Fair Value Gap that forms at the start of the trading session.
Session-Specific: The indicator only searches for an FVG within the user-defined trading session (defaulting to 09:32 - 16:00 EST for the NY session).
First Only: It plots only the first valid FVG that meets the minimum distance requirement (Min FVG Distance) and ignores all subsequent FVGs for the remainder of that session.
Visual Tracking (Modified): The FVG is drawn as a transparent box that begins at the current bar and extends forward into the chart, allowing traders to monitor its fill or reaction in real-time without cluttering the historical chart data.
Customization: Allows setting distinct colors for bullish (up) and bearish (down) FVGs.
📰 Section 2: Date & News Display
This module provides an organized, persistent display on the chart for critical time and event information.
Date & Time: Displays the current weekday, date, and month in a customizable format.
Configurable News Events: Users can set up to three high-impact news events for the day (e.g., NFP, FOMC, CPI, etc.).
Visual Alert: Each news event is displayed with its own customizable background color, text size, and text color, providing a quick visual alert for upcoming market volatility drivers.
Positioning: The entire information box (Date + News) can be anchored to any of the chart's four corners (Top/Bottom and Left/Center/Right).
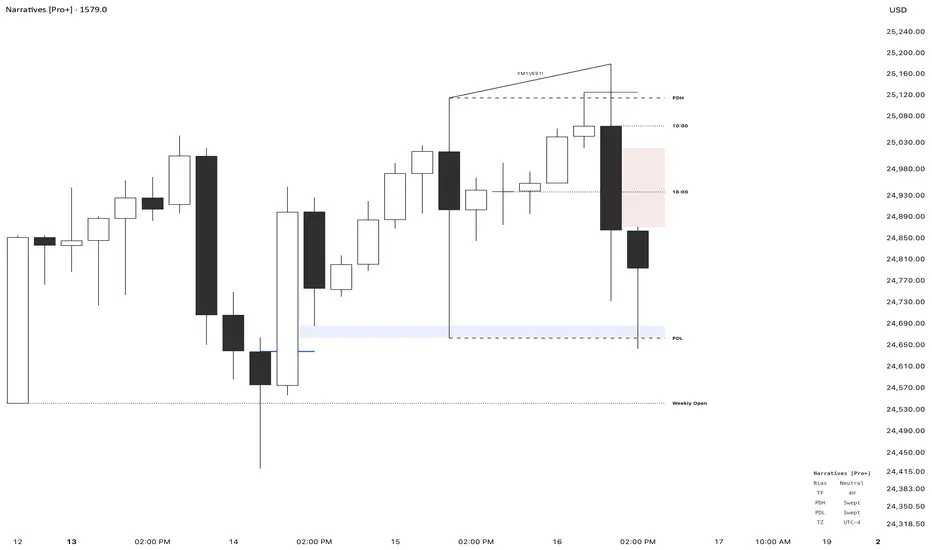
Narratives [Pro+]Narratives - Release
Narratives is a comprehensive trading indicator designed to help traders build a structured narrative around price action. Built on the concepts of Inner Circle Trader, GxT Profiling, and HTF Analysis, It integrates advanced Smart Money concepts such as Fair Value Gaps, SMT Divergence, Liquidity Sweeps, Precision Swing Points, and Session Levels — all within one cohesive and adaptive system. Explore the features below:
Fair Value Gaps (FVG)
- Automatically detects and displays bullish and bearish Fair Value Gaps with dynamic invalidation
- Customizable colors, box limits, and extension behavior until price closes through the gap
- Automatically removes invalidated gaps for a cleaner view
Smart Money Technique (SMT) Divergence
- Detects divergence between correlated assets at Previous Day High/Low levels
- Automatic preset detection for major markets including Indices, Forex, Metals, Energy, and Crypto
- Inversion SMT detection when correlated assets sweep levels while the primary asset does not
- Labels display which specific assets are in divergence
Candle Sweep Detection
- Identifies C2 sweep patterns where Candle 2 sweeps Candle 1’s high or low and closes back
- Detects C3 closure patterns
- Dynamic detection removes sweep lines if subsequent price action invalidates the pattern
- Configurable maximum sweeps and optional bias filtering
Precision Swing Point (PSP)
- Detects swing highs and lows that occur with correlated asset divergence
- Two display modes:
- PSP Only – shows confirmed swing points with divergence
- All Precision Candles – highlights every divergence candle
- Supports up to three correlated assets with both manual and automatic preset modes
Previous Day High/Low (PDH/PDL)
- Plots previous day’s high and low across all intraday timeframes
- Dynamic mitigation stops line extension when levels are swept
- Customizable line styles for active and mitigated states
- Status tracking shows Intact or Swept in the information table
Previous Week High/Low (PWH/PWL)
- Plots previous week’s high and low with automatic detection across all intraday timeframes
- Dynamic mitigation stops line extension when levels are swept
- Customizable line styles for active and mitigated states
- Status tracking shows Intact or Swept in the information table
Premium / Discount Zones
- Automatically calculates and displays Premium and Discount ranges based on current structure
- Helps visualize optimal trade zones within equilibrium
- Optional midpoint (Equilibrium) line
- Fully customizable colors and fill styles
Killzone Levels
- Tracks Asia and London session highs and lows with automatic timezone conversion
- Levels extend until mitigated with optional line removal
- Session-based detection resets daily
Timeline Markers
- Four customizable vertical lines mark key trading times
- Default setup includes major market opens in New York timezone
- Optional display on lower timeframes
Quarterly Theory
- Plots vertical lines marking quarterly cycles across multiple timeframes
- 15M charts: 90m quarters
- 30M charts: Daily quarters (6-hour cycles from 6PM)
- 1H charts: Weekly quarters
- 4H charts: Monthly quarters
- Daily charts: Yearly quarters
Information Table
- Displays current bias, timeframe, PDH/PDL status, and timezone
- Customizable position, colors, font size, and individual element toggles
- Includes Ticker and Timeframe for quick reference
FU Candle Detector (Smart Money Concept) En Anglais🧠 Overall concept: “FU Candle” in Smart Money logic
In the context of Smart Money Concepts (SMC) or ICT (Inner Circle Trader), an FU Candle (also known as a “Fakeout Candle” or “Manipulation Candle”) is a candle that:
Creates an imbalance or a break (often above a swing high or below a swing low),
Attracts liquidity by trapping retail traders (liquidity grab),
Then abruptly reverses direction, revealing the hand of “Smart Money” (large institutions).
It therefore often marks:
The point of manipulation before an impulsive movement (reversal),
An area of interest for entering in the institutional direction (after the liquidity grab).
---
⚙️ How the “FU Candle Detector” script works
The script identifies these candlesticks by observing several typical criteria:
1. Detection of the manipulative candle (FU Candle)
Search for a candlestick that breaks a previous swing (significant high or low),
But closes in the opposite direction, often below/above the broken zone,
Thus indicating a fakeout.
Examples:
Bullish FU Candle: breaks a previous low, but closes bullish.
Bearish FU Candle: breaks a previous high, but closes bearish.
---
2. Visualization on the chart
The script generally displays:
🔴 Red markers for bearish FUs (Fake Breakout upwards),
🟢 Green markers for bullish FUs (Fake Breakout downwards),
🟦 Rectangles of areas of interest (often around the FU Candle Open),
📏 Horizontal lines on areas of imbalance (OB/FVG if integrated).
---
3. Possible additions depending on the version
Depending on the version you have received, the script can also:
Detect Fair Value Gaps (FVG) around FU Candles,
Mark Order Blocks (OB) associated with manipulation,
Add alerts when new FU Candles are detected,
Calculate the distance between the manipulation point and the price return,
Filter according to candle size, volume, or market structure (MSB/CHoCH).
---
🎯 Practical use
FU Candles are often used:
As confirmation of an imminent reversal,
To identify institutional entry zones (hidden Order Block),
To anticipate the direction of the next impulse after the liquidity hunt.
Typical entry example:
> Wait for the formation of an FU Candle + price return within the candle body = entry in the opposite direction to the false breakout.
📈 Recommended combinations
This detector is often combined with:
Structure Break Indicator (CHoCH / BOS)
Liquidity Pool Zones
Fair Value Gap Finder
Order Block Detector
This gives you a complete Smart Money Concept system, capable of mapping:
1. Where liquidity has been taken,
2. Where the price is rebalancing,
3. Where Smart Money is repositioning its orders.

IPDA Ranges – ProIPDA Ranges – Pro
This indicator plots Institutional Price Delivery Algorithm (IPDA) ranges based on lookback periods of 20, 40, and 60 days, as taught by ICT (Inner Circle Trader). It visualizes premium and discount zones, equilibrium levels, quadrants, and sub-quadrants to help traders identify key price areas and potential market biases.
Key Features:
- Displays IPDA ranges as boxes or lines, with customizable colors for discount, equilibrium, and premium zones.
- Optionally shades the 25%-75% mid-zone for each range.
- Supports quadrants (25% steps) and sub-quadrants with lines and labels for detailed price segmentation.
- Includes a table displaying either discount/premium status or percentage from equilibrium for each range.
- Configurable alerts for entry/exit into the mid-zone.
- Visual options include line styles, label sizes, price display on labels, and buffers for zone extension.
Settings Overview:
- IPDA Intervals: Enable/disable IPDA20, IPDA40, IPDA60; toggle quadrants, sub-quadrants, mid-zone shading, and drawing with lines vs. boxes.
- Colors and Styles: Customize colors for zones, lines, labels; select solid/dotted/dashed styles for borders and lines.
- Appearance: Adjust label and table sizes, table position, and background opacity.
- Labels: Show/hide per-range labels and include prices.
- Alerts: Enable mid-zone entry/exit alerts.
Usage:
Add the indicator to your chart and select the desired IPDA intervals. The ranges update dynamically based on daily highs and lows. Use the table for quick reference to current positioning (discount/premium or percentage). The mid-zone shading helps identify consolidation areas, while quadrants and sub-quadrants assist in pinpointing potential support/resistance levels.
© MadMonkTrading

SMC FVG/IFVG (Multi-TF x 4) [ZAUTEC]SMC FVG/IFVG (Multi-TF x 4): Multi-Timeframe Fair Value Gap with Inversed FVG Detection
This powerful Pine Script indicator is designed to help traders identify, track, and manage Fair Value Gaps (FVGs) and their respective Inversed Fair Value Gaps (IFVGs) across up to four different timeframes simultaneously.
Key Features
Multi-Timeframe Analysis (4x): Analyze and display FVGs from four distinct timeframes alongside your current chart, offering a comprehensive view of market imbalances across various scales.
Fair Value Gap (FVG) Detection: Automatically identifies classic three-candle FVGs (market inefficiencies).
Customizable FVG Length: Set how many bars the FVG boxes should initially extend for.
Minimum Gap Size: Filter out minor, insignificant gaps using a tick-based minimum size threshold.
Optional Box Extension: Dynamically extend FVG boxes to the current bar index or use a fixed extension for a cleaner chart.
Inversed FVG (IFVG) Logic: Detects a high-probability reversal pattern where a previously filled FVG zone is immediately followed by the formation of a new, opposite FVG within or adjacent to the same area. This confirms the old FVG has "flipped roles" (e.g., from support to resistance).
Lookback Period: Defines how long the indicator searches for a corresponding FVG breach to confirm the IFVG.
IFVG Minimum Size: Customizable minimum size threshold for the IFVG.
Dynamic Box Management:
Automatic Fill Deletion: FVGs are automatically removed from the chart when price action fully trades through the gap, signifying the imbalance has been "filled."
IFVG Tracking: IFVGs are tracked and removed from the chart after the configurable lookback period.
Full Customization: Control the visibility, colors, border styles (solid, dashed, dotted), and width for FVG, Bearish FVG, Bullish FVG, and IFVG boxes independently for each of the four timeframes.
How to Use
Select Timeframes: Choose up to four desired timeframes in the settings (e.g., "15" for 15-minute, "4H" for 4-hour, "D" for Daily). Leave the field empty to use the chart's current timeframe.
Toggle Visibility: Use the Show FVG and Show IFVG toggles to focus on the imbalances you wish to see.
Adjust Extension: Set Extend Boxes to bar index to true to keep all open FVG boxes drawn all the way to the current live price bar.
Interpret the Gaps:
FVG (Bullish/Bearish): Potential areas for price to return to and find support/resistance.
IFVG (Inverse FVG): Stronger signals that a previous zone of imbalance has been violated and is likely to act as a significant flip zone for future price movements.
This indicator is an essential tool for traders utilizing concepts like ICT (Inner Circle Trader) and SMC (Smart Money Concepts), providing a clear visual representation of market structure and liquidity voids.

FVG and OB🧠 Concept Behind the “FVG and OB” Indicator
This indicator merges two core ICT (Inner Circle Trader) concepts — Fair Value Gaps (FVGs) and Order Blocks (OBs) — into one clean, dynamic visualization tool.
It is designed for professional price-action traders who want to track institutional imbalances and smart money footprints directly on the chart.
🟩 FAIR VALUE GAP (FVG)
An FVG represents an imbalance in price caused by aggressive buying or selling where the market fails to offer two-way liquidity.
It’s typically created when a strong candle leaves a visible “gap” between the previous candle’s high and the next candle’s low (for bullish FVG), or vice versa (for bearish FVG).
In this indicator:
🟢 Bullish FVGs are drawn when low > high
🔴 Bearish FVGs are drawn when high < low
Each gap box dynamically extends to the right until it is mitigated (partially or fully filled).
You can choose between two mitigation modes:
Boundary Touch (default): The FVG is considered mitigated once price touches the gap boundary.
Full Fill: The FVG remains active until the entire gap range is filled.
This gives you real-time awareness of whether liquidity has been rebalanced — a key ICT concept in identifying market turning points.
🟥 ORDER BLOCK (OB)
An Order Block represents the last opposing candle before a strong impulsive move.
It is where institutional traders likely executed large block orders, creating supply or demand zones that price often revisits.
In this script, an OB is automatically drawn:
🟥 Bearish OBs form after a strong down move (usually following a bearish FVG).
🟩 Bullish OBs form after a strong up move (usually following a bullish FVG).
Key features:
The indicator can detect OBs in two ways:
Only FVG’s First Candle: A stricter mode aligning OB formation directly with FVG events.
Classic (Last Opposite Color): A more traditional ICT-style detection that finds the last candle of the opposite color within a defined lookback range.
OBs auto-expand with the next candle’s wick, so any extra high/low beyond the original OB is included by default.
Each OB remains extended until mitigated — when price revisits and closes the imbalance.
⚙️ CONTROL & CUSTOMIZATION
You can control the entire behavior and visualization through the settings panel:
Display Mode: Show only FVGs, only OBs, or both simultaneously.
Mitigation Mode: Choose how strict the FVG closure logic should be.
Body-Only Option: Restrict OB calculation to candle bodies instead of wicks for cleaner structure.
Individual Color Settings: Customize border and fill colors for each block type.
Lookback Depth: Define how far back the system searches for valid OB structures.
The result is a clean, layered representation of institutional footprints — with automatic cleanup logic that prevents chart clutter and keeps only active zones visible.
📊 PRACTICAL APPLICATION
Use this indicator to:
Identify imbalances left by aggressive moves (potential retracement targets).
Confirm confluences between FVGs and OBs — the overlap areas often mark powerful reaction zones.
Track mitigation progress as price revisits those zones.
Refine entry timing when price reacts to unmitigated OBs or fills the last untested FVG.
🧩 TECHNICAL DESIGN
Built in Pine Script v5 with fully modular code architecture.
FVG and OB modules can be toggled or used independently.
Uses arrays for efficient management of multiple boxes.
Auto-updates in real-time and mitigates per-bar to minimize lag.
Designed for multi-timeframe backtesting compatibility.
💡 Summary
This tool visually bridges two of the most powerful Smart Money Concepts —
FVG = imbalance zones and OB = institutional origin blocks.
Together, they help traders map out liquidity flows, identify premium/discount zones, and anticipate where price is likely to react next.
🧑💻 Credits
Based on ICT & Smart Money Concepts, rewritten in modular PineScript with precision mitigation logic.
# For educational and analytical purposes only.

Previous Cycle Range + SMTs [bilal x shpat]Inspired by ICT (Inner Circle Trader) concepts
Description made by ChatGPT
Thank you shpat.a for making the SMT option
📝 Overview
The Previous Cycle Range + SMTs indicator is a multi-timeframe tool designed to visualize key market structure levels derived from the previous trading cycle’s range — a concept heavily utilized in ICT-style analysis.
In addition to the traditional range levels, this indicator adds Smart Money Tool (SMT) detection, allowing traders to identify bullish or bearish divergences across multiple correlated assets, giving an edge in spotting potential turning points and liquidity imbalances.
It helps traders identify equilibrium levels, liquidity zones, and potential premium/discount areas based on the prior day (or any chosen period) high and low — now with intermarket divergence insights.
⚙️ Features
Custom Cycle Length: Define your own cycle in minutes (e.g., 1440 = 1 day, 10080 = 1 week).
Previous High/Low: Automatically plots the previous cycle’s high and low levels.
Equilibrium (EQ): Optional 50% midpoint line to highlight the market’s equilibrium.
Quarter Levels: Adds 25% and 75% range lines for refined premium/discount analysis.
Extended Ranges: Optional extended levels (e.g., -100%, +200%) to identify continuation or retracement targets.
Fib Levels (1.272 & 1.618): Adds ICT-style Fibonacci extension levels for confluence zones.
Smart Money Tool (SMT) Detection:
Detects bullish or bearish divergences between your main asset and up to two comparison symbols.
Highlights potential SMT zones with optional text labels for quick visualization.
Optional SMT summary table displays divergence status for all three assets.
Custom Styling: Full control over colors, line width, label style, and extension distance.
💡 How It Helps
This indicator aligns with ICT principles by making the previous day’s range visible and actionable, now with SMT divergence insights:
The previous day’s high/low often act as liquidity pools.
The equilibrium (EQ) represents fair value — useful for spotting premium/discount zones.
Quarter levels and Fibonacci extensions add precision when mapping market structure and potential reaction points.
SMT detection helps traders identify early divergence signals that may indicate upcoming bullish or bearish moves across correlated markets.
🔍 Example Uses
Identify where price is trading relative to the previous session’s range.
Use EQ and quarter levels to gauge premium vs. discount conditions.
Spot intermarket divergences using SMTs to anticipate potential reversal or continuation points.
Combine with other ICT-based tools (e.g., PD arrays, dealing ranges, or kill zones) for refined trade setups.

ICT 1st Presented FVG After RTH OpenICT 1st Presented FVG After RTH Open
Overview
This indicator identifies and tracks the first Fair Value Gap (FVG) that forms after the Regular Trading Hours (RTH) open, based on Inner Circle Trader (ICT) concepts. It monitors price behavior and reaction to this initial FVG throughout the trading session.
Key Features
📊 Smart FVG Detection
• Automatically identifies the first valid FVG after RTH open (default: 9:30-10:00 AM ET)
• Filters noise using ATR-based minimum gap size validation
• Option to display all FVGs or just the first one
• Visual distinction between the first FVG and subsequent ones
⏰ Customizable Time Settings
• Adjustable RTH window (default: 9:30-10:00 AM)
• Multiple timezone support (New York, Chicago, London, Tokyo)
• Flexible tracking duration and sampling intervals
📈 Price Reaction Tracking
• Monitors price behavior relative to the first FVG over time
• Tracks whether price remains above, below, or inside the FVG zone
• Records price distance from FVG boundaries
• Displays real-time data in an easy-to-read table
• Volume tracking at each sample interval
🎨 Visual Elements
• Color-coded FVG boxes (green for bullish, red for bearish)
• Timestamp labels showing when each FVG formed
• Extendable boxes to track ongoing validity
• Optional background highlighting during RTH window
• Customizable table positions and display options
🔔 Alert System
• Visual markers on chart for easy backtesting
• Real-time programmatic alerts with detailed FVG information
• TradingView alert conditions for custom notifications
• Alerts include price range, gap size, and timestamp
Settings
Time Configuration:
• Timezone selection
• RTH start/end times
• Tracking duration (default: 120 minutes)
• Sample interval (default: 5 minutes)
FVG Validation:
• ATR length for gap size calculation
• Minimum gap size as ATR percentage
• Option to show all valid FVGs
Display Options:
• Custom colors for bullish/bearish FVGs
• Label visibility toggle
• Box extension options
• Maximum historical FVGs to display
• Info and reaction table positions
Use Cases
1. Entry Timing: Use the first FVG as a potential entry zone when price returns to fill the gap
2. Trend Confirmation: Monitor whether price respects or violates the first FVG
3. Session Analysis: Track how the first inefficiency of the session plays out over time
4. Backtesting: Visual markers allow easy historical analysis of FVG behavior
How It Works
The indicator waits for RTH to begin, then identifies the first three-candle pattern that creates a valid Fair Value Gap. Once detected, it:
1. Marks the FVG zone with a colored box
2. Begins tracking price position at regular intervals
3. Records data in a reaction table showing price behavior over time
4. Continues monitoring until the tracking duration expires or a new trading day begins
Notes
• Resets daily to track each session independently
• Works on any timeframe, though lower timeframes (1-5 min) are recommended for intraday FVG detection
• The "first presented" FVG concept emphasizes the importance of the initial inefficiency created after market open
• Historical FVGs are preserved up to the display limit for reference
This indicator is designed for traders familiar with ICT concepts and Fair Value Gap trading strategies. It combines automated detection with comprehensive tracking to help identify high-probability trading opportunities.

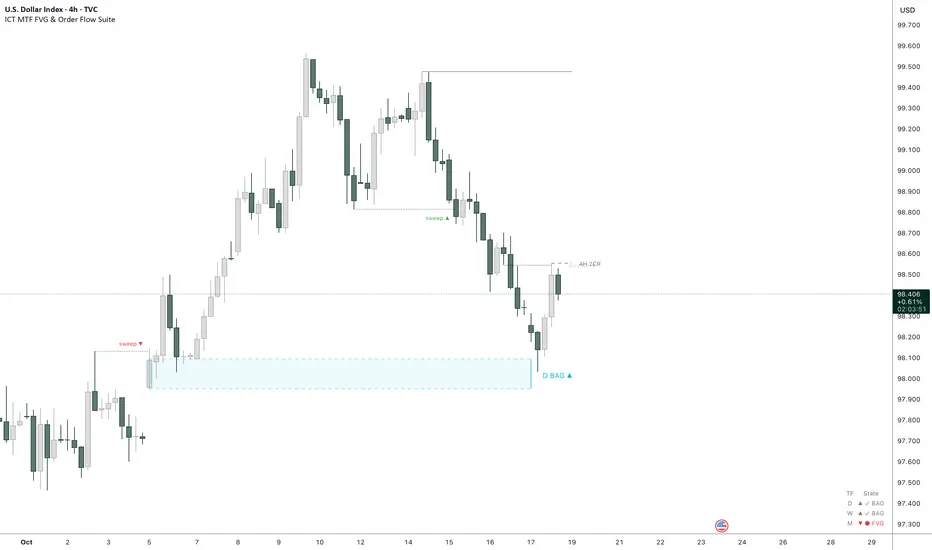
ICT Multi-Timeframe FVG & Order Flow SuiteICT Multi-Timeframe FVG & Order Flow Suite
A comprehensive Inner Circle Trader (ICT) analysis tool that combines multiple timeframes, Fair Value Gap detection, order flow tracking, and smart money concepts into one powerful indicator.
🎯 Key Features
Higher Timeframe FVG Detection
Simultaneously tracks FVGs across 4H, Daily, Weekly, and Monthly timeframes
Visual differentiation between active and mitigated HTF FVGs
BAG (Breaker And Gap) identification
Intelligent filtering system to align with HTF bias
Real-time status table showing current HTF FVG states
Current Timeframe Analysis
Automatic bullish/bearish FVG detection
2CR (2 Candle Reversal) tracking with visual markers
Mitigation monitoring with color-coded states
Customizable display limits and filtering options
Order Flow Legs
Dynamic order flow box highlighting price expansion
50% equilibrium level marking
Smart locking mechanism based on FVG mitigation
Real-time updates as price extends
ITH/ITL Pivot System
Intermediate Term High/Low detection
Run vs Sweep identification with directional labels
Mitigated and unmitigated level tracking
Visual distinction between respected and disrespected levels
Advanced Filtering
Hide opposing timeframe FVGs based on HTF bias
Filter current TF FVGs by type (bullish/bearish)
"Last Mitigated Only" mode to reduce chart clutter
Customizable maximum display limits per timeframe
📈 What Makes This Different?
Multi-Timeframe Integration: See how HTF FVGs align with your trading timeframe in real-time
Smart Bias Detection: Automatically determines market bias from highest to lowest enabled timeframe
Comprehensive Alerts: 12 distinct alert conditions covering FVG creation, mitigation, 2CR events, and pivot breaches
Professional Visualization: Clean, customizable colors and styles with minimal chart clutter
Status Dashboard: Quick-reference table showing the state of all tracked HTF FVGs
⚙️ Customization Options
Individual toggle controls for each HTF
Adjustable colors for bullish, bearish, active, and mitigated states
Boundary lines, origin markers, and mitigation lines
Configurable label sizes and positions
Line extension controls
Optional EMA overlay
🔔 Alert System
Set alerts for:
New FVG creation (bullish/bearish)
FVG mitigation events
2CR respect/disrespect
ITH/ITL runs and sweeps
💡 Best Practices
Start with Daily/Weekly HTF FVGs to identify overall bias
Use filtering to focus on trade direction aligned with HTF
Monitor 2CR events for confirmation of price acceptance/rejection
Combine with order flow legs to identify high-probability setups
Use the status table for quick multi-timeframe analysis
📚 Suitable For
ICT methodology traders
Smart Money Concept (SMC) practitioners
Multi-timeframe analysts
Swing and intraday traders
Anyone seeking institutional order flow insights
Note: This indicator is designed for educational purposes and works best when combined with proper risk management and additional confirmation methods. Understanding ICT concepts is recommended for optimal use.
ICT Complex[Iss2k]📘 ICT Complex — Smart Money Concepts Indicator
Overview
The ICT Complex indicator is a comprehensive Smart Money Concepts (SMC) and ICT-based analysis tool designed to visualize institutional trading concepts such as Order Blocks, Liquidity Voids, Swing Structure, and Market Direction.
It combines multiple elements from the Inner Circle Trader (ICT) methodology to help traders identify potential market reversals, liquidity grabs, and premium/discount trading zones.
🧩 Main Features
1. Order Blocks (OB)
Automatically detects bullish and bearish order blocks based on pivot highs and lows.
Displays order block zones as colored boxes (green for bullish, red for bearish).
Optional auto-deletion: an OB zone disappears once price breaks through it.
Zones are confirmed (locked) when retested, providing confluence for trade entries.
2. Swing Highs & Lows (Market Structure)
Detects swing highs (SH) and swing lows (SL) to visualize market structure shifts.
Draws horizontal lines at each confirmed swing point.
When price breaks above a swing high or below a swing low, the indicator signals potential bullish or bearish market structure shifts (MSS).
3. Liquidity Voids (Imbalances / Fair Value Gaps)
Identifies liquidity voids (imbalances) — areas where price moved too quickly and left inefficiency in the market.
Marks these zones with transparent colored boxes:
🟩 Green for bullish voids
🟥 Red for bearish voids
Can optionally label each void for better visualization.
4. Trend Confirmation (EMA 200)
Includes an EMA200 trend filter to identify overall market direction.
The EMA line changes color:
🟩 Green when trending up
🟥 Red when trending down
Used to filter signals in the direction of institutional order flow.
5. DI Strength & Candle Coloring
Uses a modified Directional Index (DI) to color candles based on strength and direction:
🟩 Green = bullish momentum
🟥 Red = bearish momentum
🟪 Purple = neutral
6. Range Filter Logic
A smoothed range filter helps confirm breakout conditions and trend continuation.
Generates Buy (A / A+) or Sell (A / A+) labels when market structure and filter direction align.
Displays real-time peak profit tracking, showing how far price has moved from the entry signal in percentage.
7. Alerts
Configurable Buy and Sell alerts when valid signals are confirmed on the bar close.
💡 How to Use
Apply the indicator to any timeframe (best results on 15m–4h).
Use Order Blocks and Liquidity Voids to identify institutional areas of interest.
Wait for structure shifts (SH/SL breaks) to confirm direction.
Filter trades with EMA200 and Range Filter signals.
Use Buy/Sell alerts as confirmations, not standalone signals.
⚙️ Customization Options
Toggle visibility for each feature: Order Blocks, Liquidity Voids, Swing Signals, Range Labels, etc.
Adjust sensitivity for swing detection and liquidity voids.
Change colors and maximum number of visual elements to suit your chart style.
📈 Summary
The ICT Complex indicator provides an all-in-one framework for Smart Money trading analysis.
It helps traders understand how institutional liquidity, order flow, and market structure interact — aligning your trades with the principles of ICT and Smart Money Concepts.

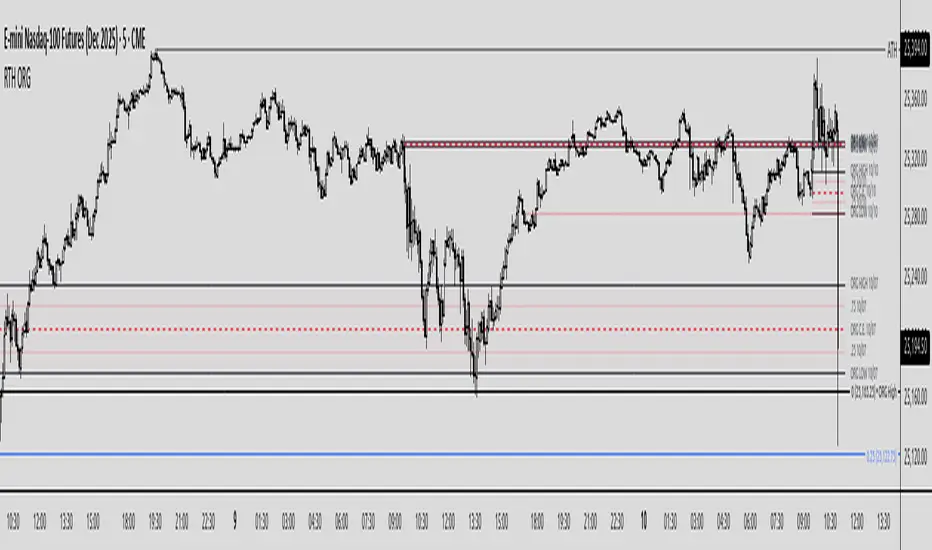
Regular Trading Hours Opening Range Gap (RTH ORG)### Regular Trading Hours (RTH) Gap Indicator with Quartile Levels
**Overview**
Discover overnight gaps in index futures like ES, YM, and NQ, or stocks like SPY, with this enhanced Pine Script v6 indicator. It visualizes the critical gap between the previous RTH close (4:15 PM ET for futures, 4:00 PM for SPY) and the next RTH open (9:30 AM ET), helping traders spot potential price sensitivity formed during after-hours trading.
**Key Features**
- **Standard Gap Boxes**: Semi-transparent boxes highlight the gap range, with optional text labels showing day-of-week and "RTH" identifier.
- **Midpoint Line**: A customizable dashed line at the 50% level, with price labels for quick reference.
- **New: Quartile Lines (25% & 75%)**: Dotted lines (default width 1) mark the quarter and three-quarter points within the gap, ideal for finer intraday analysis. Toggle on/off, adjust style/color/width, and add labels.
- **High-Low Gap Variant**: Optional boxes and midlines for gaps between the prior close's high/low and the open's high/low—perfect for wick-based overlaps on lower timeframes (5-min or below recommended).
- **RTH Close Lines**: Extend previous close levels with dotted lines and price tags.
- **Customization Galore**: Extend elements right, limit historical displays (default: 3 gaps), no-plot sessions (e.g., avoid weekends), and time offsets for non-US indices.
**How to Use**
Apply to 15-min or lower charts for best results. Toggle "extend right" for ongoing levels. SPY auto-adjusts for its 4 PM close.
Tested on major indices—enhance your gap trading strategy today! Questions? Drop a comment.
Thanks to twingall for supplying the original code.
Thanks to The Inner Circle Trader (ICT) for the logical and systematic application.
ICT Macros - CorrigéThis indicator is designed to help traders apply the concepts of ICT (Inner Circle Trader) by providing a clear and accurate visualization of market macros directly on the chart. Instead of manually drawing levels or constantly switching between timeframes, the indicator automatically highlights the key reference points that form the backbone of ICT analysis.
Key Features:
Automatic Macro Visualization: identifies and displays market macros as defined in ICT concepts, making it easier to recognize institutional levels.
Timeframe Flexibility: adapts to different chart periods, allowing traders to align intraday setups with higher timeframe structures.
Clean and Efficient Display: focuses only on the most relevant information, avoiding clutter and making the chart more readable.
Strategic Decision Support: provides essential context for ICT-based strategies, including identifying market direction, liquidity pools, and potential reversal zones.
Why Use It?
This indicator is built for traders who follow ICT methodology and want a reliable tool to instantly spot macro structure without wasting time on repetitive manual work. By combining precision with clarity, it enhances situational awareness and supports better decision-making in both intraday and swing trading.

ICT Multi-Timeframe Market Structure Tracker [SwissAlgo]ICT Multi-Timeframe Market Structure Tracker
Tracks the ICT market structure across three core timeframes (1-Week, 1-Day, 1-Hour) simultaneously.
----------------------------------------------------------------------
Why this Indicator?
You know market structure matters, whether you trade stocks, Forex, commodities, or crypto.
You've studied ICT concepts - " Change of Character ", " Break of Structure ", " Premium/discount zones ". You understand that multi-timeframe alignment is where the edge lives.
But here's what's probably happening while you apply the ICT concepts for your trading decisions:
You're manually drawing structural highs and lows across three timeframes
You're calculating Fibonacci retracements by hand for each timeframe
You're switching between weekly, daily, and hourly charts, trying to remember where each pivot was, trying to detect the critical events you're waiting for
By the time you've mapped it all out, the setup is gone. Or worse, you missed that the 1-hour just broke the structure while you were checking the weekly bias.
What about seeing all three timeframes at once instead? You need to know immediately when the price enters a premium or discount zone. You need alerts that fire when structure breaks or character changes - across all timeframes - without babysitting your screen.
----------------------------------------------------------------------
The Indicator, at a Glance
This indicator:
tracks ICT market structure across three core timeframes (1-Week, 1-Day, 1-Hour) simultaneously .
automatically plots Fibonacci retracement levels from your defined structural pivots
monitors price position (during retracements) in real-time
sends consolidated alerts when actionable events occur on any timeframe
The 1-Week View: Mid-Term Trend Bias for lower timeframes
The 1-Day View: Swings nested within the 1-Week Structure
The 1-Hour View: Swings nested within the 1-Day Structure
One glance tells you:
* Current trend direction per timeframe
* Exact Fib zone price is trading right now
* Whether the structure just broke or the character changed
* If you're in a potential long/short setup zone
The indicator helps you reduce chart-hopping, manual calculations, and minimize the missed structural shifts.
----------------------------------------------------------------------
Who is this for?
This tool is built for day traders who understand ICT concepts and need efficient multi-timeframe structure tracking. If you know what a Change of Character is, why 0.382-0.5 retracements matter in uptrends, and how to trade external structure, this indicator eliminates the manual structure tracking so you can focus on confirming and executing your trading tactics.
New to ICT? This indicator assumes foundational knowledge of the Inner Circle Trader methodology developed by Michael J. Huddleston. Before using this tool, familiarize yourself with concepts like market structure breaks, premium/discount arrays, and liquidity engineering. The ICT framework offers a unique perspective on institutional order flow and price action - but this indicator is designed for those already applying these concepts, not learning them for the first time.
Critical Skill Required : You must understand the difference between external structure (key swing highs/lows that define market direction) and internal structure (minor fluctuations within the range).
Selecting incorrect pivots - such as marking internal noise instead of true structural points - will generate false signals and undermine the entire analysis. This indicator tracks structure based on YOUR inputs. If those inputs are wrong, every Fibonacci level, alert, and bias signal will be wrong. Learn to identify clean structural breaks before using this tool.
Trading Experience Matters: This tool tracks structure and fires alerts, but interpreting those signals requires understanding context, confluences, and risk management. If you're early in your trading journey, consider this a professional-grade instrument that becomes powerful once you have the conceptual foundation to use it effectively.
----------------------------------------------------------------------
How It Works
Step 1: Define Your Structure
You, the ICT expert or student, define the structural high and low for each timeframe, with their exact dates. This empowers you to control the analysis.
Based on your entries, the indicator establishes trend direction by timeframe and calculates Fibonacci retracement levels automatically.
* Structural High/Low: Key swing points that define external structure per ICT methodology
* Auto-Validation: Built-in autoscan feature confirms your pivot entries match actual price extremes
* Deterministic Behavior: Date stamps ensure the indicator behaves consistently across all sessions
Step 2: Monitor The Tables
Two tables provide a structural context:
Multi-Timeframe Analysis Table (top-right):
Current close, high, low, and 0.5 Fib for all three timeframes
Trend direction (↑/↓)
Days since structure established (i.e., "age" or maturity)
Current Fibonacci zone
Real-time alerts: Trend changes, breakouts, and trade bias signals
Detailed Fibonacci Table (middle-right):
All nine Fib retracement levels (1.0 to 0.0) for the selected timeframe
Exact price at each level
Percentage distance from current price
Visual marker showing current position
Step 3: Monitor The Chart
Visual elements show structure at a glance:
Fibonacci Retracement Zones: Color-coded bands show premium (red), discount (green), and equilibrium (gray) areas based on trend direction
Structural Lines: Red (high) and green (low) horizontal lines mark your defined pivots with automatic fill showing the current range (based on higher timeframe pivots)
Pivot Dots: Optional small markers highlight potential structural turning points on your current timeframe (reference only - always validate pivots yourself)
Trend Indicator: Top-center banner displays the selected timeframe's current trend
Auto-pivot points
Step 4: Get Alerts and Decide the Way Forward
Set one alert on the 1-hour chart only (if you set the alert on other timeframes, you may get delayed feedback).
You'll receive notifications when ANY of these events occur on ANY timeframe:
* Change of Character (ChoC): Trend reversal confirmed by price breaking the opposite structural level
* Break of Structure (BoS): Continuation confirmed by price breaking the same-direction structural level
* Trade Bias Signals: Price entering key Fibonacci zones (0.382-0.5 for longs in uptrend, 0.5-0.618 for shorts in downtrend, with + and ++ variants for deeper retracements)
* Reversal Warnings: Price entering extreme zones (0.882-1.0 or 0.0-0.118), suggesting potential trend exhaustion and reversal towards the opposite direction
All alerts fire once per bar close with a consolidated message showing which timeframes triggered and what conditions were met.
----------------------------------------------------------------------
Understanding the 3 Timeframes Hierarchy
The three timeframes may be conceived as nested layers of structure:
* 1-Week (Macro Bias) : May help you determine your core directional bias (long/short) in a mid-term perspective. The 1-Week TF may operate as your highest-conviction filter and help you contextualize shorter-term market moves (which may align or misalign with the trend appearing on such a timeframe).
* 1-Day (Swing Structure) : Operates within the weekly range. The daily structure can contradict the weekly structure temporarily (due to retracements, consolidations). This is where you may identify intermediate swing opportunities.
* 1-Hour (Execution Structure) : Operates within the daily range. It may help you identify entry timing and short-term bias. Can show opposite trends during retracements, and some traders look for alignment with higher timeframes as part of their setup criteria.
Example: Weekly uptrend (bullish bias) → Daily pulls back into downtrend (retracement phase) → Hourly shows uptrend resumption (this may be interpreted as an entry signal). All three trends can differ simultaneously, but when all three align (in one direction or another), you may start evaluating your moves.
----------------------------------------------------------------------
Using the Tool effectively
When this indicator signals a potential setup (entering key Fibonacci zones, structure breaks, or bias shifts), treat it as a starting point for deeper analysis, not a direct entry signal.
Before executing, consider using additional tools to refine timing:
Fair Value Gaps (FVG) : Identify imbalances where the price moved too quickly, leaving potential fill zones
Order Blocks : Locate the last opposing candle before a strong move - often institutional entry points
Liquidity Zones : Map where stop losses likely cluster (equal highs/lows, round numbers)
Premium/Discount Confirmation: Verify you're buying at a discount or selling at a premium relative to the current range
Session Timing/Kill Zones : Align entries with high-liquidity sessions (London/New York opens)
This indicator shows you where the structure sits and when it shifts. Your job is to combine that context with precise entry models. The alerts narrow your focus to high-probability zones - then you apply your edge within those zones.
----------------------------------------------------------------------
How to Set Up Alerts
This indicator monitors all three timeframes simultaneously and fires consolidated alerts when any condition triggers. Follow these steps to configure alerts properly:
Step 1: Set Your Chart to the 1-Hour Timeframe
Alerts must be created on the 1-hour chart for optimal timing
Do not use higher timeframes (4H, 1D, 1W) or alerts may be delayed
Lower timeframes (15M, 5M) will work but may generate more frequent notifications
Step 2: Open the Alert Menu
Click the "Alert" button (clock icon) in the top toolbar
Or use keyboard shortcut: Alt+A (Windows) / Option+A (Mac)
Step 3: Configure Alert Settings
Condition: Select "ICT Multi-Timeframe Market Structure Tracker "
Alert Type: Choose "Any alert() function call"
Options: Select "Once Per Bar Close"
Expiration: Set to "Open-ended alert" (no expiration)
Alert Name: Choose a descriptive name (e.g., "BTC Market Structure Alerts")
Step 4: Configure Notifications
Notification Methods: Check your preferred channels (app notification, email, webhook, etc.)
Sound: Optional — choose alert sound if desired
Step 5: Create Alert
Click the "Create" button
Alert is now active and will monitor all three timeframes
Important Notes:
You only need ONE alert setup total — it monitors 1W, 1D, and 1H simultaneously
Alert messages show which timeframe(s) triggered and what conditions were met
Alerts fire once per bar close to avoid mid-bar noise
If you change your structural pivot inputs, the alert continues working with new parameters
Example Alert Message:
BTC Market Structure Alert:
🟢 1D Bullish BoS
📈 1H Long Setup (0.382-0.5)
This tells you the 1-Day broke structure bullishly AND the 1-Hour entered a long setup zone — both events happened on the same bar close.
----------------------------------------------------------------------
Key Features
* Tracks 1-Week, 1-Day, and 1-Hour structure simultaneously
* Automatic Fibonacci retracement calculation (9 levels + extensions up or down, depending on timeframe trend)
* Real-time Change of Character and Break of Structure detection
* Color-coded premium/discount zone visualization
* Multi-condition alerts across all timeframes (single alert setup required)
* Autoscan validation to confirm manual pivot entry accuracy
* Timezone-adjustable for global markets
----------------------------------------------------------------------
Important Notes
* Requires ICT Knowledge: This is not a plug-and-play system. Understanding market structure, liquidity concepts, and Fibonacci confluence is essential for effective use.
* Manual Structure Definition: You define the structural pivots. The indicator tracks and alerts - it doesn't make trading decisions.
* Chart Timeframe: Set alerts on the 1-hour chart for optimal timing across all three monitored timeframes.
----------------------------------------------------------------------
Disclaimer
This indicator is for educational and informational purposes only. It does not constitute financial, investment, or trading advice.
The indicator:
* Makes no guarantees about future market performance
* Cannot predict market movements with certainty
* May generate false indications
* Relies on historical patterns that may not repeat
* Should not be used as the sole basis for trading decisions
Users are responsible for:
* Conducting independent research and analysis
* Understanding the risks of trading
* Making their own investment/divestment decisions
* Managing position sizes and risk exposure appropriately
Trading involves substantial risk and may not be suitable for all investors. Past performance does not guarantee future results. Users should only invest what they can afford to lose and consult qualified professionals before making financial decisions. The indicator’s assumptions may be invalidated by changing market conditions.
By using this tool, users acknowledge these limitations and accept full responsibility for their trading decisions.

ICT 369 Sniper MSS Indicator (HTF Bias) - H2LThis script is an ICT (Inner Circle Trader) concept-based trading indicator designed to identify high-probability reversal or continuation setups, primarily focusing on intraday trading using a Higher Timeframe (HTF) directional bias.
Here are the four core components of the indicator:
Higher Timeframe (HTF) Bias Filter (Market Structure Shift - MSS): It determines the overall trend by checking if the current price has broken the most recent high or low swing point of a larger timeframe (e.g., 4H). This establishes a Bullish or Bearish bias, ensuring trades align with the dominant trend.
Fair Value Gap (FVG) and OTE: It identifies price imbalances (FVGs) and calculates the Optimal Trade Entry (OTE) levels (50%, 62%, 70.5%, etc.) within those gaps, looking for price to retrace into these specific areas.
Kill Zones (Timing): It incorporates specific time windows (London and New York Kill Zones, based on NY Time) where institutional trading activity is high, only allowing entry signals during these defined periods.
Signal and Targets: It triggers a Long or Short signal when all criteria are met (HTF Bias, FVG, OTE retracement, and Kill Zone timing). It then calculates and plots suggested trade levels, including a Stop Loss (SL) and three Take Profit targets (TP1, TP2, and a dynamic Runner Target based on the weekly Average True Range or ATR).
In summary, it's a comprehensive tool for traders following ICT principles, automating the confluence check across trend, structure, liquidity, and timing.

ICT Turtle Soup (Riz)The ICT Turtle Soup Complete System is an advanced implementation of the Inner Circle Trader's interpretation of the classic Turtle Soup pattern, designed to identify and trade liquidity sweeps at key market levels. This strategy capitalizes on the systematic stop-loss hunting behavior of institutional traders by detecting when price temporarily breaches significant support/resistance levels to trigger retail stop-losses, then quickly reverses direction.
Core Trading Logic
Liquidity Sweep Detection Method
The strategy monitors five critical liquidity pools where retail traders commonly place stop-loss orders:
⦁ Yesterday's High/Low: Previous daily session extremes
⦁ Daily High/Low: Rolling 20-day period extremes
⦁ 4-Hour High/Low: 30-period extremes on 4H timeframe
⦁ 1-Hour High/Low: 50-period extremes on hourly timeframe
⦁ Recent High/Low: Current timeframe extremes (20-40 bars based on trading mode)
Entry Signal Generation Process
Buy Signal (Sell-Side Liquidity Sweep):
1. Price penetrates below a key support level by a minimum threshold (5-15 ticks depending on signal quality settings)
2. The penetration bar must show strong rejection with at least 30-50% of the candle's range closing back above the swept level
3. Multi-timeframe confirmation checks for structure shift on lower timeframe (break of recent swing high)
4. Confluence scoring system evaluates 7 factors, requiring minimum 3 confirmations:
⦁ Liquidity sweep detected (weighted 2x)
⦁ Higher timeframe bullish market structure
⦁ Lower timeframe bullish break of structure
⦁ Bullish Fair Value Gap presence
⦁ Bullish Order Block formation
⦁ ICT Kill Zone timing alignment
Sell Signal (Buy-Side Liquidity Sweep):
Mirror opposite of buy signal logic, detecting sweeps above resistance levels with bearish rejection.
Risk Management & Position Sizing
Stop Loss Placement:
⦁ Calculated using ATR (Average True Range) multiplied by an adaptive factor
⦁ Base multipliers: Scalping (1.0x), Day Trading (1.5x), Swing Trading (2.0x)
⦁ Further adjusted by signal quality: Conservative (-20%), Balanced (0%), Aggressive (+20%)
⦁ Positioned beyond the liquidity sweep point to avoid re-sweeping
Take Profit Targets:
⦁ TP1: 2.0R (Risk-Reward ratio)
⦁ TP2: 3.5R
⦁ TP3: 5.0R
⦁ All levels rounded to tick precision for accurate order placement
Advanced Features & Filters
Multi-Timeframe Structure Analysis
The system performs top-down analysis across three timeframes:
⦁ Higher Timeframe (HTF): Determines primary trend bias
⦁ Medium Timeframe (MTF): Confirms intermediate structure
⦁ Lower Timeframe (LTF): Identifies precise entry triggers
ICT Kill Zones
Incorporates time-based filtering for optimal trading sessions:
⦁ Asian Session (8PM-12AM UTC)
⦁ London Session (2AM-5AM UTC)
⦁ New York Session (7AM-10AM UTC)
⦁ London Close (10AM-12PM UTC)
Smart Money Concepts Integration
⦁ Fair Value Gaps (FVG): Identifies and displays price inefficiencies that act as magnets
⦁ Order Blocks: Marks institutional accumulation/distribution zones
⦁ Mitigation Detection: Automatically removes FVGs and Order Blocks when price fills them
⦁ Duplicate Sweep Prevention: 10-bar lookback prevents multiple signals at same level
Adaptive Trading Modes
Three pre-configured modes automatically adjust all parameters:
⦁ Scalping: Tight stops, quick targets, 15-minute to 1-hour focus
⦁ Day Trading: Balanced approach, 4-hour to daily analysis
⦁ Swing Trading: Wide stops, extended targets, daily to weekly perspective
⦁ Custom Mode: Full manual control of all parameters
Signal Quality Management
⦁ Conservative: Requires 5/7 confluence factors, tighter sweep threshold (5 ticks), 50% minimum rejection
⦁ Balanced: Standard 3/7 confluence, moderate threshold (10 ticks), 30% rejection
⦁ Aggressive: Only 2/7 confluence needed, wider threshold (15 ticks), 20% rejection
Visual Components & Dashboard
Real-Time Information Panel
Displays current market conditions including:
⦁ Active trading mode and quality settings
⦁ Timeframe configuration (HTF/MTF/LTF)
⦁ Market bias from higher timeframes
⦁ Current kill zone status
⦁ Liquidity sweep detection status
⦁ Confluence scoring for both directions
⦁ Risk parameters and targets
Trade Visualization
⦁ Entry, stop-loss, and three take-profit levels with precise price labels
⦁ Automatic cleanup when targets are hit or new signals appear
⦁ Maximum of one active setup displayed for chart clarity
⦁ Color-coded boxes for Fair Value Gaps and Order Blocks
How to Use This Indicator
Recommended Timeframes
⦁ Scalping Mode: 1-minute to 5-minute charts
⦁ Day Trading Mode: 5-minute to 15-minute charts
⦁ Swing Trading Mode: 1-hour to 4-hour charts
Optimal Market Conditions
⦁ Works best in ranging or trending markets with clear support/resistance levels
⦁ Most effective during high-liquidity sessions (London/New York overlap)
⦁ Avoid using during major news events unless specifically targeting news-driven sweeps
Signal Interpretation
1. Wait for triangle signal (up/down) with confluence score
2. Verify the swept level shown in the dashboard
3. Confirm risk-reward ratios match your trading plan
4. Enter at market or set limit order at indicated entry level
5. Place stop-loss and take-profit orders at displayed levels
Customization Tips
⦁ Adjust Signal Quality based on market volatility (Conservative for volatile, Aggressive for quiet)
⦁ Modify sweep threshold if getting too many/few signals
⦁ Toggle individual liquidity levels based on their relevance to your timeframe
⦁ Use Kill Zone filter for session-specific trading
Risk Disclaimer
This indicator identifies potential trade setups based on liquidity sweep patterns but does not guarantee profitable outcomes. Past performance does not indicate future results. Always use proper risk management and never risk more than you can afford to lose. The indicator should be used as part of a comprehensive trading plan that includes your own analysis and risk tolerance assessment.
