Two MA Signal IndicatorThis Signal Indicator that emits a signal based on two MAs crossover/crossunder. It is designed to be used as an External Input for "Template Trailing Strategy" to verify the correctness of the External Deal Condition Mode of the aforementioned script and the Internal Strategy logic. Also, this script is a simple example on how to create custom signal indicators that can be "pugged" to the "Template Trailing Strategy" and get all the features this strategy script can provide!
"MA Cross"に関するスクリプトを検索
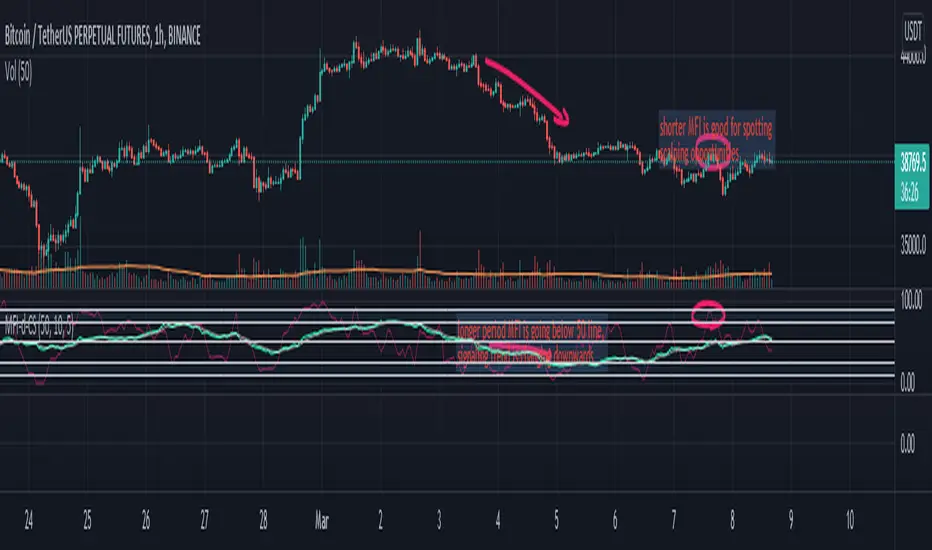
Money Flow Index (double) by CoinStaghey Piners community,
this is an iteration of inbuilt MFI script, with two MFIs of different lengths and one Moving Average which is dependent on MFI 1.
I find it useful to see the trend of longer MFI period, which tells me what direction to trade. On shorter period MFI I'm looking at Oversold or Overbought zones - while quicker MFI index is there, I'm looking to Buy/Sell, depending on trend.
Alternatively, you can use also MFI1 and MA crossovers to spot potential entries.
It seems like a good tool for crypto markets on any timeframes - from 5min, to 4h.
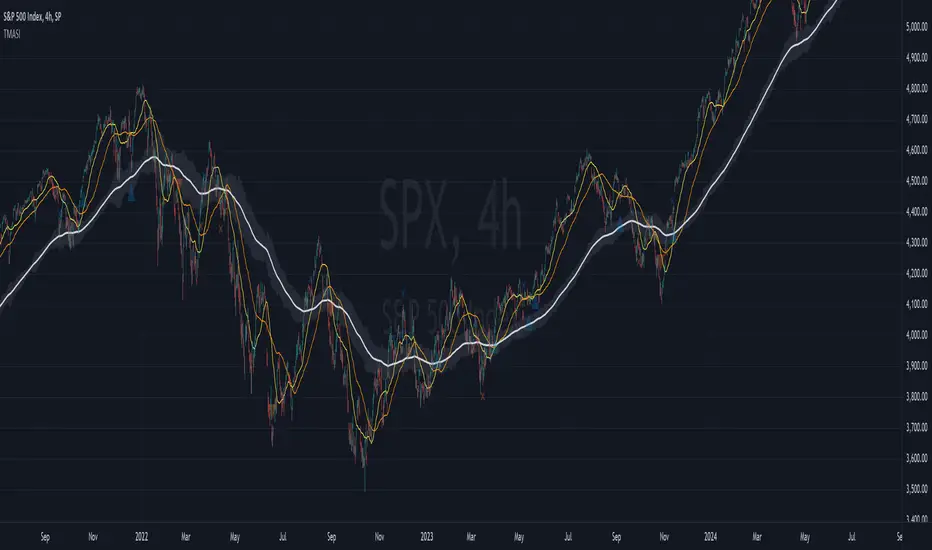
RedK Compound Ratio Moving Average (CoRa_Wave)
Compound Ratio Weighted Average (CoRa_Wave) is a moving average where the weights increase in a "logarithmically linear" way - from the furthest point in the data to the current point - the formula to calculate these weights work in a similar way to how "compound ratio" works - you start with an initial amount, then add a consistent "ratio of the cumulative prior sum" each period until you reach the end amount. The result is, the "step ratio" between the weights is consistent - This is not the case with linear-weights moving average (WMA), or EMA
- for example, if you consider a Weighted Moving Average (WMA) of length 5, the weights will be (from the furthest point towards the most current) 1, 2, 3, 4, 5 -- we can see that the ratio between these weights are inconsistent. in fact, the ratio between the 2 furthest points is 2:1, but the ratio between the most recent points is 5:4 -- the ratio is inconsistent, and in fact, more recent points are not getting the best weights they should/can get to counter-act the lag effect. Using the Compound ratio approach addresses that point.
a key advantage here is that we can significantly reduce the "tail weight" - which is "relatively" large in other MAs and would be main cause for lag - giving more weights to the most recent data points - and in a way that is consistent, reliable and easy to "code"
- the outcome is, a moving average line that suffers very little lag regardless of the length, and that can be relied on to track the price movements and swings closely.
other features:
===============
- An accelerator, or multiplier, has been added to further increase the "aggressiveness" of the moving average line, giving even more weights to the more recent points - the multiplier will have more effect between 1 and 5, then will have a diminishing effect after that - note that a multiplier of 0 (which effectively causes a comp. ratio of 0 to be applied) will produce a Simple Moving Average line :)
- We also added the ability to use an "automatic smoothing" mechanism, that user can over-ride by manually choosing how much smoothing is used. This gives more flexibility to how we can leverage this Moving Average in our charting.
- User can also select the Resolution and Source price for the CoRa_Wave. by default, they will be set to "same as chart" and hlc3
here are the formulas for our Compound Ratio moving average:
Compound Weight ratio r = (A/P)^1/t - 1
Weight at time t A = P(1 + r)^t
= Start_val * (1 + r) ^ index
index in the above formula is 0 for the furthest point out
Here's how CoRa_Wave compares to other common moving averages all set to the same length (20)
Proposed Usage
- CoRa_Wave can be used for any scenarios where we need a moving average that closely tracks the price, trend, swings with high responsiveness and little lag
- MA Cross-over scenarios - against another CoRa_Wave or any other MA
- below is a quick example scenario for how to utilize 2 CoRa_Wave lines of same length (one for open and one for closing price) to track swings and trends
- get as creative as you need :)
Code is commented - please feel free to leverage or customize further as you need.
👉 if you are interested in other moving averages i posted before, please check out the FiMA and the v_Wave ...

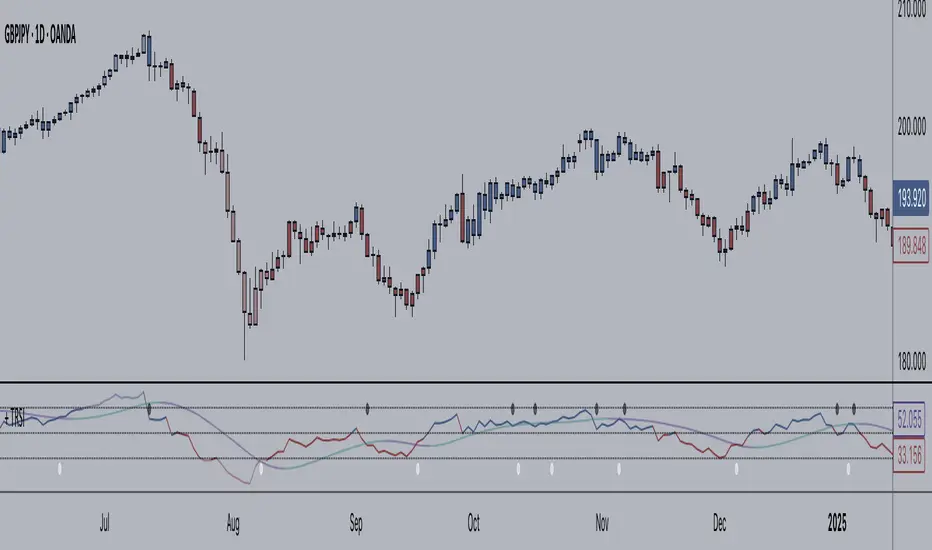
+ True RSIThis is a better, cleaner version (in my opinion) of an part of an indicator I was using that was coded up by cI8DH. I reached out to him about cleaning up the code (things weren't working) for Pinescript v4, but he no longer seems to be active, so I thought I might take it upon myself to at least work out this portion of the indicator.
Much credit goes to him. Below is the indicator that he coded, of which only one part have I made additions to.
So, he calls this the True RSI. I was using it as part of the USI, which I posted above (it's the MA Percent indicator type). To my eyes it's not far different from the standard RSI, so I probably could have just made a version of that, but I like this one, and I was excited to add a few things (like candle coloring, which no longer works with his version!).
So, what's different?
I added two different background fills.
I made the lines types for the extremities and midline more appropriate for the indicator.
I added bullish, bearish, overbought, and oversold candle coloring.
I added a multitude of moving averages as well.
If this looks like my '+ %B' indicator, that is because I basically just moved the MA's and candle coloring code over. One could probably do this with many different indicators.
In the future I will probably add alerts, and maybe MA cross candles as well. Or not. Well, almost certainly alerts. Please enjoy!
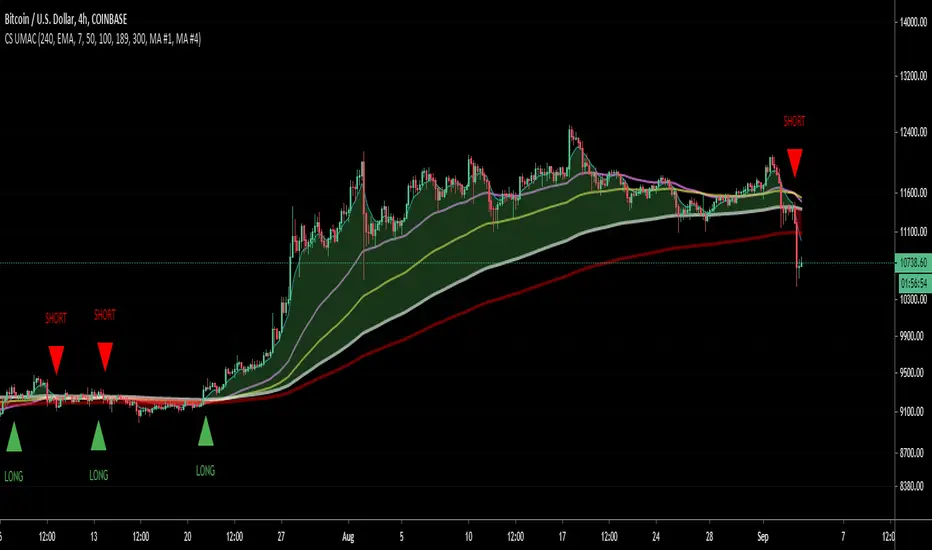
CS Ultimate MA CrossThis indicator adds 5 Moving Averages on your chart. You can select the MA Type: SMA, EMA, RMA or VWMA.
By selecting a Fast MA and a Slow MA you can also draw a cloud to make the Bull or Bear bias more visual. Possibility to add on the chart Long/Short signal.
MTF possible by changing the range which is particularly useful for HTF analysis while looking a LTF price action.
Gastitan MA-cross/RSI/PSARThis script gives
moving average cross alert
RSI alert when change from bull to bear, and viceverse
Parabolic sar indicator
Also you have a panel with the current price and RSI values.

E_SMACD_And_Pine_TutorialI wrote this script to both be a Pine Script tutorial and a useable indicator. I use it for trading crypto based on trends I see in the ma crossovers, highs/lows, and volatility spikes.

eha MA CrossIn the study of time series, and specifically technical analysis of the stock market, a moving-average cross occurs when, the traces of plotting of two moving averages each based on different degrees of smoothing cross each other. Although it does not predict future direction but at least shows trends.
This indicator uses two moving averages, a slower moving average and a faster-moving average. The faster moving average is a short term moving average. A short term moving average is faster because it only considers prices over a short period of time and is thus more reactive to daily price changes.
On the other hand, a long term moving average is deemed slower as it encapsulates prices over a longer period and is more passive. However, it tends to smooth out price noises which are often reflected in short term moving averages.
There are a bunch of parameters that you can set on this indicator based on your needs.
Moving Averages Algorithm
You can choose between three types provided of Algorithms
Simple Moving Average
Exponential Moving Average
Weighted Moving Average
I will update this study with more educational materials in the near future so be informed by following the study and let me know what you think about it.
Please hit the like button if this study is useful for you.

SVAMA - A Non Parametric Adaptive Moving Average Based On VolumeIntroduction
Technical indicators often have parameters settings that the user must enter, those are inconvenient when the user must design a strategy because such settings must be optimized, it must also been noted that the optimal settings at time t could change at time t+n , this is why non parametric indicators are more efficient. Today i propose a moving average adapting to the market volume without using parameters affecting the smoothing.
The Indicator
The volume is rescaled in a range of (1,0) by using max or min normalization. Exponential averaging is used to provide the moving average.
When using max normalization the moving average react faster when the volume is closer to its all time high, when using min normalization the moving average react faster when the volume is closer to its all time low. You can select the method (max or min) from the "Method" parameter.
Volume tend to be higher and more periodic with higher time-frames, this is why lower time-frames might return smoother results when using the Max method. It is recommended to use the Max method when we want a faster moving average while the Min method is more suited to get a slower moving average.
Both methods can provide an interesting MA-Cross system when used on higher time frames.
Conclusion
There should be more non parametric indicators, this would allow for faster and easier optimization processes when creating a strategy, in theory any indicator using a moving average or highest/lowest could be made non parametric by using a running mean or running max/min but the indicator might loose important information.
This is one of my main focus right now since such indicators could also allow for improvements when used with artificial intelligence. I hope you find an use to it, don't hesitate to send me your suggestions.
Thanks for reading !

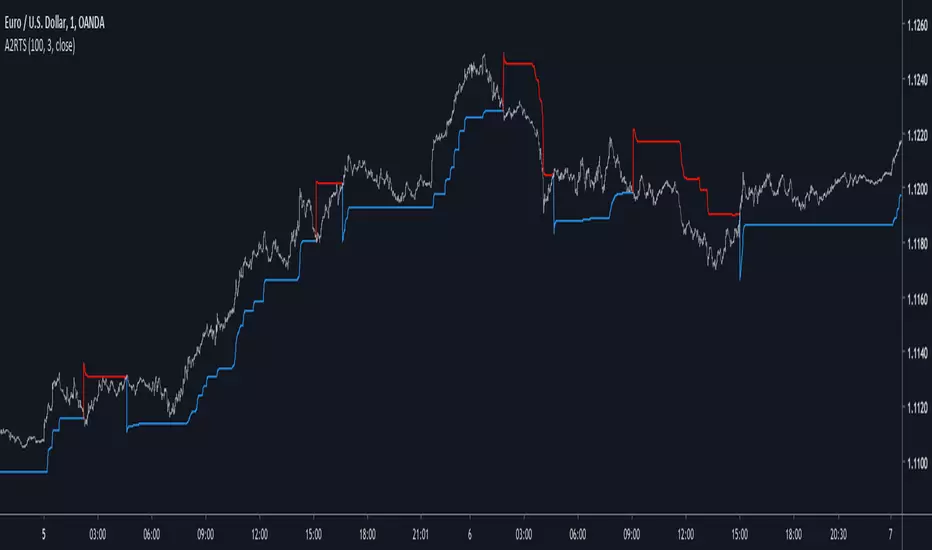
Adaptive Autonomous Recursive Trailing StopIntroduction
Trailing stop are important indicators in technical analysis, today i propose a new trailing stop A2RTS based on my last published indicator A2RMA (1), this last indicator directly used an error measurement thus providing a way to create enveloppes, which provide a direct way to create trailing stops based on highest/lowest rules.
The Indicator
If you need a more detailed explanation of this indicator i encourage you to check the A2RMA indicator post i made, parameters does not differ from the supertrend, thus having a length parameter and a factor parameter who is here described as gamma , gamma control how far away are the bands from each others thus spotting longer terms trends when gamma is higher.
On BTCUSD
Something worth mentioning is that the indicator sometimes behave like my MTA trailing stop indicator (2) who is closer to the price when a trend persist thus providing early exit points, however A2RTS behave a bit better.
Price can sometimes break the trailing stop, this can be interpreted as a support/resistance or just as an exit point, the support resistance methodology on trailing stop is not the most recommended.
Sometimes it is recommended to have an higher length rather than an high gamma like in this case for INTEL CORP, below gamma = 3 and length = 20
The microprocessor market like to use higher length's instead of higher gamma's , A2RMA is a non-linear filter, this would explain such behaviour.
Conclusion
Trailing stops might not suffer as much from whipsaw trades than MA crossovers but they still remain inefficient when market is not trending, results of the proposed indicator on major forex pairs are more than disappointing, but i hope this will serve as basis for other trailing stops that might act a little bit better. I conclude this post by thanking everyone who support my work and i encourage you to modify this indicator and share it with the community.
Thanks for reading !
Cited Articles
The Scale Of Sacred SoundsBased on the Sacred Sound Scale
How to use it:
This indicator is designed to capture the inferred behavior of traders and investors by using two groups of averages.
Meant for longer trades and trend indicator.
Used on any timescale as needed.
Can trade on long or short where the slow MA crosses fast Ma or where the Slow MA compresses and flips open again.
Follow the trend to the end - pot of gold at the end of the rainbow :-)
References:
Based on Daryl Guppy GMMA and
www.guppytraders.com
Read more at:
whatmusicreallyis.com
There is one tuning in which the frequencies 432, 528, 424 and 440 Hz can peacefully coexist. The scale has 32+1 pure harmonic tones and the reference frequency of 256 Hz. It comes from the Natural Ascending Series of Harmonics 32 to 64 of the 8 Hz Fundamental Tone, and represents its 6th double. I call this tuning The Scale of Sacred Sounds.
Representation using ancient Sumerian/Babylonian/Vedic math:
32; 33; 34; 35; 36; 37; 38; 39; 40; 41; 42; 43; 44; 45; 46; 47; 48; 49; 50; 51; 52; 53; 54; 55; 56; 57; 58; 59; 60; 61; 62; 63; 64
Representation using musical ratios:
1/1; 33/32; 17/16; 35/32; 9/8; 37/32; 19/16; 39/32; 5/4; 41/32; 21/16; 43/32; 11/8; 45/32; 23/16; 47/32; 3/2; 49/32; 25/16; 51/32; 13/8; 53/32; 27/16; 55/32; 7/4; 57/32; 29/16; 59/32; 15/8; 61/32; 31/16; 63/32; 2/1
The math for deriving one of the above series from the other is simple. Divide all numbers from the ancient series by the first, then simplify the fractions. Conversely, the series of ratios can be turned into the series of integers by calculating their least common denominator (the smallest whole number that is a multiple of all numbers under the fraction bar) and discarding it.
Logarithmic representation using musical constants (definition given further down):
0,000; 30,772; 60,625; 89,612; 117,783; 145,182; 171,850; 197,826; 223,144; 247,836; 271,934; 295,464; 318,454; 340,927; 362,905; 384,412; 405,465; 426,084; 446,287; 466,090; 485,508; 504,556; 523,248; 541,597; 559,616; 577,315; 594,707; 611,802; 628,609; 645,138; 661,398; 677,399; 693,147


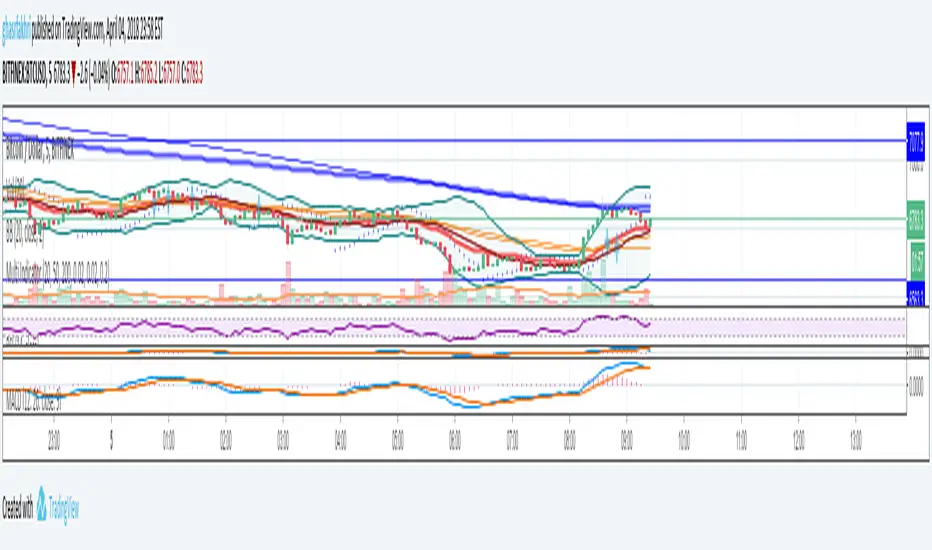
Multi Indicators- MA, EMA, MA Cross, Parabolic SarMulti Indicators
- 3 Simple Moving Average
- 3 Exp Moving Average
- Cross of Moving Averages
- Parabolic SAR
On-Balance Volume MA CrossoversVolume-based momentum tracker. Look for divergences in price & volume momentum

Moving Average Range Channels [DW]This study is an experiment based off the concept used in my Dynamic Range Channel indicator.
Rather than using a McGinley Dynamic, a moving average of your choice is used in this calculation.
There are eight different moving average types to choose from in this script:
- Kaufman's Adaptive Moving Average
- Geometric Moving Average
- Hull Moving Average
- Volume Weighted Moving Average
- Least Squares Moving Average
- Arnaud Legoux Moving Average
- Exponential Moving Average
- Simple Moving Average
For a more refined picture of volatility, I've added upper and lower extension channels. They are calculated by adding the upper half range to the channel high, and subtracting the lower half range from the channel low.
The new custom bar color scheme indicates trends, midline crosses, MA crosses, and overbought and oversold conditions.

Moving Average Cross & Bollinger BandsPut this together for users using the free version of tradingview. Combines MA Cross and Bollinger Bands into one indicator.
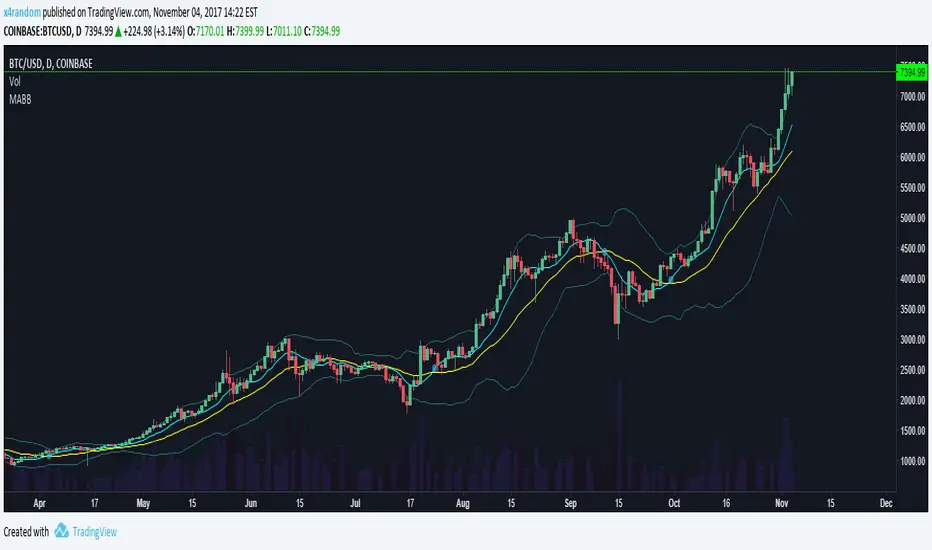
Donchian Channel Alerts R1 by JustUncleLThis idea is based on the Donchain Channel centre line Price action. When price moves from the highest/lowest point, the price will move to the center line first. At this point, the center line acts as dynamic support/resistance and often price will bounce back up. However, if price successfully breaks the centre line (primary entry condition), then prices will tend to catch up to the bottom channel line, many times making further moves in that direction (secondary entry condition).
This script alert idea is designed to be used with Renko (10pip brick recommended) Renko or Heikin Ashi (1 hour recommended) charts. It combines the Donchian Channel centre line price action with a directional coloured EMA (default length 8) to provide entry and exit signals.
There are three options to exit trade:
MA Cross (default exit) = exit occur when price breaks EMA in opposite direction.
Centre Cross = exit occurs when price breaks back passed the centre line in opposite direction.
Brick Colour = exit when a brick/bar paints in the opposite colour to trade direction.
Each Entry and Exit signal creates an Alertcondition that can be picked up by the TradingView Alarm system.
TIPS:
This type of Trading technique only works well in a trending market. Do not try to trade this technique in a ranging/flat market, wait for market to return to trend or pick another pair.
To get 10pip Bricks set Renko to "Traditional" type bricks and 0.001 for non-JPY currency pairs and 0.1 for JPY currency pairs. Also set chart Time frame to 5min or 15mins.
Renko chart:

Candlestick Trend Indicator v0.5 by JustUncleLRequested Update to this Indicator alert project. In this update I have added the option to be able select which Price Action candles you want included in the display and the generated alarm Alert. Other changes also included in this update:
Also added a Price Action candle for "Last Fractal S/R Break", this also a good continuation indication.
Added option to select a different moving average types for directional MA line.
Modified some default settings, using HullMA instead of Zero Lag EMA and standard MACD settings(12,26,9).
Description:
This is a trend following indicator and alert for Binary Options based on Candlestick patterns and trend line -
NOTE: original system was a forex trading system.
This code combines a number of indicators to create an overall trading strategy.
The indicator recognises and displays some useful candle named defined patterns that are used to support trend continuation:
Bearish + Bullish PinBars
Dark Cloud Cover
Piecing Line
Bullish + Bearish Harami
Bullish + Bearish Engulfing Candle
Bullish + Bearish Last Fractal S/R break
Also recognises main Price Action candles from ChrisMoody (CM), the four(4) price action patterns are colored coded bars:
Yellow = Inside Bar - breakout/continuance
Orange = Outside Bar - breakout/continuance
Aqua/Fuschia = Up/Down Shaved Bars - Buying/Selling pressure
Red/Green = Possible reversal PinBars - Reverse Down / reverse Up
The highlighted candles (maroon and darker green) represent the defined PA patterns that have been confirmed following the current trend direction that is indicated by the Hull MA(20) line (can select a different type of MA, or even disable) and confirmed by MACD direction (can be disabled). The confirmed Alerts are indication by green (buy) and red (sell) dots at the bottom of the chart. An alert is generated from this selection for the alert condition of the alarming system.
The fractal upper/lower break lines are also draw, if the (optional) last fractal break line is broken by a highlighted bar then this indicates a stronger trend conformation.
The MACD indicator MACD DEUTER 2 colour(12,26,9) you can visually see the MACD histogram colours with MACD direction - needs "MACD DEUTER 2 colour" indicator.
This multi-indicator set up is suitable for 1hr, 4hr and daily charts with 1-4 candle expiry.
References and Inspiration from:
Fractal Levels by RicardoSantos
Almost Zero Lag EMA
Candlestick Patterns With EMA by rmwaddelljr
CM_Price-Action-Bars by ChrisMoody
www.forexstrategiesresources.com
"Scalp Jockey - MTF MA Cross Visual Strategizer by JayRogers"

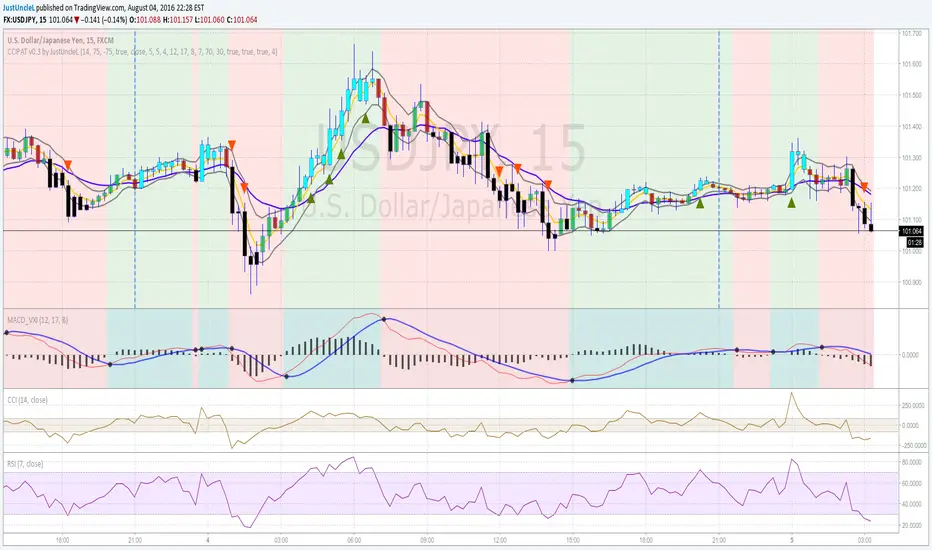
Price Action Trading System v0.3 by JustUncleLThis is an updated and improved version of my "Price Action Trading strategy". I have added two extra optional filters, one is a trend direction filter based on the MACD slow EMA(17), blue line, and the other is a RSI(7) filter which works similarly to CCI(14) but slightly different dynamics (thank you to gianfranco60 for the suggestion). Also made a couple of corrections:
- input for lenLower minval=1 should be maxval=-1
- one bar pullback did not reset trigger, missing some alerts
Some Notes about usage:
- this is an alert indicator not a signal generator, each alert is a strong trend continuance candidate,
but should be treated on it's own merits by looking at chart dynamics and market conditions.
- will work well on trending markets only.
- works best on the first alert after MACD cross over.
- don't take trades when MACD and signal are close together.
- don't trade when channel and slow MA are flat or close together or
chopper (yellow and blue MA cross over quickly over short period).
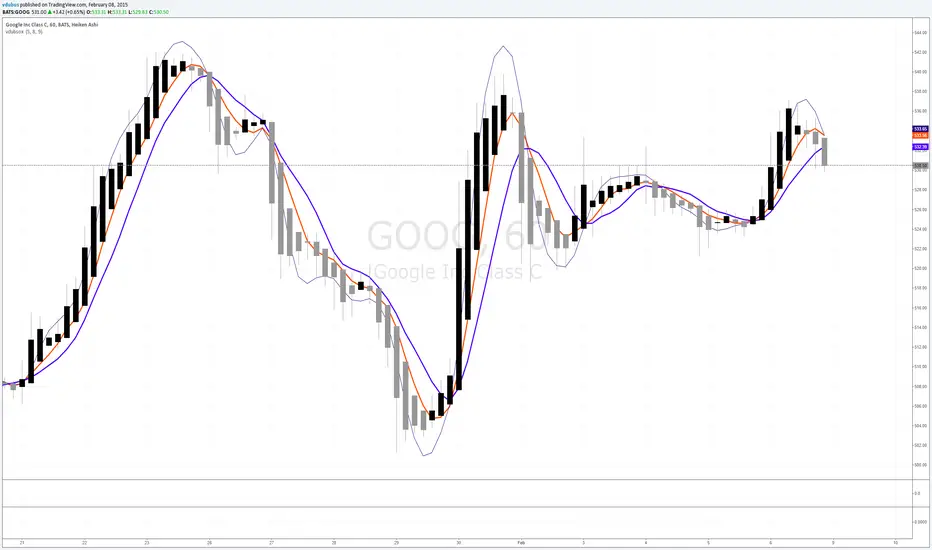
vdubsoxI've been asking for this concept for a while, a simple MA that rides the top side of the trend instead of the bottom, and by accident came across the 'Hull ma' on a TV blog post. I've added another two simple Moving averages to act as strength indicator with close proximity to the price.
The strategy is simple MA cross over but with the early indication using Hull ma gives you a heads up on trend / price reversal.
I'm using this in conjunction with BB set at 34. on a 1/3/5 min charts & Heiken Ashi to smooth out the noise with awesome success trading Binary options.
Dominance Signal Apex [CHE]]Dominance Signal Apex — Triple-confirmed entry markers with stateful guardrails
Summary
This indicator focuses on entry timing by plotting markers only when three conditions align: a closed-bar Heikin-Ashi bias, a monotonic stack of super-smoother filters, and the current HMA slope. A compact state machine provides guardrails: it starts a directional state on closed-bar Heikin-Ashi bias, maintains it only while the smoother stack remains ordered, and renders a marker only if HMA slope agrees. This design aims for selective signals and reduces isolated prints during mixed conditions. Markers fade over time to visualize the age and persistence of the current state.
Motivation: Why this design?
Common triggers flip frequently in noise or react late when regimes shift. The core idea is to gate entry markers through a closed-bar state plus independent filter alignment. The state machine limits premature prints, removes markers when alignment breaks, and uses the HMA as a final directional gate. The result is fewer mixed-context entries and clearer clusters during sustained trends.
What’s different vs. standard approaches?
Reference baseline: Single moving-average slope or classic MA cross signals.
Architecture differences:
Multi-length two-pole super-smoother stack with strict ordering checks.
Closed-bar Heikin-Ashi bias to start a directional state.
HMA slope as a final gate for rendering markers.
Time-based alpha fade to surface state age.
Practical effect: Entry markers appear in clusters during aligned regimes and are suppressed when conditions diverge, improving selectivity.
How it works (technical)
Measurements: Four recursive super-smoother series on price at short to medium horizons. Up regime means each shorter smoother sits below the next longer one; down regime is the inverse.
State machine: On bar close, positive Heikin-Ashi bias starts a bull state and negative bias starts a bear state. The state terminates the moment the smoother ordering breaks relative to the prior bar.
Rendering gate: A marker prints only if the active state agrees with the current HMA slope. The HMA is plotted and colored by slope for context.
Normalization and clamping: Marker transparency transitions from a starting to an ending alpha across a fixed number of bars, clamped within the allowed range.
Initialization: Persistent variables track state and bar-count since state start; Heikin-Ashi open is seeded on the first valid bar.
HTF/security: None used. State updates are closed-bar, which reduces repaint paths.
Bands: Smoothed high, low, centerline, and offset bands are computed but not rendered.
Parameter Guide
Show Markers — Toggle rendering — Default: true — Hides markers without changing logic.
Bull Color / Bear Color — Visual colors — Defaults: bright green / red — Aesthetic only.
Start Alpha / End Alpha — Transparency range — Defaults: one hundred / fifty, within zero to one hundred — Controls initial visibility and fade endpoint.
Steps — Fade length in bars — Default: eight, minimum one — Longer values extend the visual memory of a state.
Smoother Length — Internal band smoothing — Default: twenty-one, minimum two — Affects computed bands only; not drawn.
Band Multiplier — Internal band offset — Default: one point zero — No impact on markers.
Source — Input for HMA — Default: close — Align with your workflow.
Length — HMA length — Default: fifty, minimum one — Larger values reduce flips; smaller values react faster.
Reading & Interpretation
Entry markers:
Bull marker (below bar): Closed-bar Heikin-Ashi bias is positive, smoother stack remains aligned for up regime, and HMA slope is rising.
Bear marker (above bar): Closed-bar Heikin-Ashi bias is negative, smoother stack remains aligned for down regime, and HMA slope is falling.
Fade: Transparency progresses over the configured steps, indicating how long the current state has persisted.
Practical Workflows & Combinations
Trend following: Focus on marker clusters aligned with HMA color. Add structure filters such as higher highs and higher lows or lower highs and lower lows to avoid counter-trend entries.
Exits/Stops: Consider exiting or reducing risk when smoother ordering breaks, when HMA color flips, or when marker cadence thins out.
Multi-asset/Multi-TF: Suitable for liquid crypto, FX, indices, and equities. On lower timeframes, shorten HMA length and fade steps for faster response.
Behavior, Constraints & Performance
Repaint/confirmation: State transitions and marker eligibility are decided on closed bars; live bars do not commit state changes until close.
security()/HTF: Not used.
Resources: Declared max bars back of one thousand five hundred; recursive filters and persistent states; no explicit loops.
Known limits: Some delay around sharp turns; brief states may start in noisy phases but are quickly revoked when alignment fails; HMA gating can miss very early reversals.
Sensible Defaults & Quick Tuning
Start here: Keep defaults.
Too many flips: Increase HMA length and raise fade steps.
Too sluggish: Decrease HMA length and reduce fade steps.
Markers too faint/bold: Adjust start and end alpha toward lower or higher opacity.
What this indicator is—and isn’t
A selective entry-marker layer that prints only under triple confirmation with stateful guardrails. It is not a full system, not predictive, and does not handle risk. Combine with market structure, risk controls, and position management.
Disclaimer
The content provided, including all code and materials, is strictly for educational and informational purposes only. It is not intended as, and should not be interpreted as, financial advice, a recommendation to buy or sell any financial instrument, or an offer of any financial product or service. All strategies, tools, and examples discussed are provided for illustrative purposes to demonstrate coding techniques and the functionality of Pine Script within a trading context.
Any results from strategies or tools provided are hypothetical, and past performance is not indicative of future results. Trading and investing involve high risk, including the potential loss of principal, and may not be suitable for all individuals. Before making any trading decisions, please consult with a qualified financial professional to understand the risks involved.
By using this script, you acknowledge and agree that any trading decisions are made solely at your discretion and risk.
Best regards and happy trading
Chervolino
