5m Exit AlertsThese can help a lot with Daytrading if you don't have a price target in mind when there's no clear resistance / support nearby, and you don't trust the market enough to hold it as a swing trade.
Keep in mind that its main purpose is to give you a "warning" that it might be good to look at your screen, instead of guaranteeing you "now is the best time to exit". You won't reach high winning stats by blindly following this alert.
"A Exit LONG":
(I'm using letters instead of numbers for all Exit alerts to make sure I don't accidentally confuse Enter and Exit alerts).
There are 4 conditions that might trigger it. The reasons show up in the exit alert message (unfortunately only as a number, since alert messages can't have "dynamic text" in TradingView), and can also be displayed as symbols in the chart (see image above - make sure to enable "Show Signals" in the indicator settings first though).
Here are the conditions sorted from best to worst:
Technical reversal: Bearish Hammer candle with Volume > 2 * avg volume (of last 30 candles), when 5m candle closed. Reversal very likely. This is usually the best time to take your gains for the rest of the day.
EMA 3/8 cross: standard 5m EMA 3/8 cross, indicating a trend reversal, or at least a pullback. Can also be helpful to detect double tops / double bottoms.
Trailing Stop Loss: Crossed below 30m EMA 8, 5m candle closed. This is a "fallback" alert in case EMA 3 was already below EMA 8 before you set up the alert. It's not unlikely that the stock might go further down to VWAP, so depending on the chart and market this might be a good opportunity to save the gains you have left.
"Final" Stop Loss: Crossed below VWAP. Usually not a good sign. If you entered around VWAP your losses shouldn't be big yet, but if you plan on holding the stock the Daily chart and market outlook should better be quite convincing, and you wouldn't have needed to use this alert in the first place.
Keep in mind these work of course best if you picked a "good" stock: clear movement, tidy price action, high volume. Otherwise alerts are more likely to be triggered redundantly.
Always consider how the market and stock looks like, then decide whether to exit or not! Usually it makes sense to wait a bit to see f. e. whether the stock bounces off the 30m EMA 8, and it's just a pullback.
"B Enter SHORT":
Similar, but for shorts...
"C 1m Scalp LONG" + "D 1m Scalp SHORT":
Simple Scalping alert for EMA 3/8 cross on a 1m chart - but without needing to use a 1m chart to set it up!
Unfortunately it's not as accurate as manually setting this alert up on a 1m chart. It might be an advantage though that it sometimes is triggered 1-2 min later, since this means there are less redundant triggerings.
It can be useful esp. on high momentum trades, but I honestly haven't used it in a looong while.
"X Candle Close":
same as in 5m Entry indicator: triggered when 5m candle is confirmed
"Z Trend Change: UP" + "Z Trend Change: DOWN":
This one is meant to be used only on SPY: It alerts you when SPY is changing its trending direction, which might mean entering or closing existing trades.
I have therefore set it up to never end (by setting it to "Once Per Bar Close" in the alert settings).
It's based on DMI positive or negative being > 25. I had it based on VWAP at the beginning, but there were days where it was triggered every 5 minutes...
More infos: www.reddit.com
"Trailing stop"に関するスクリプトを検索

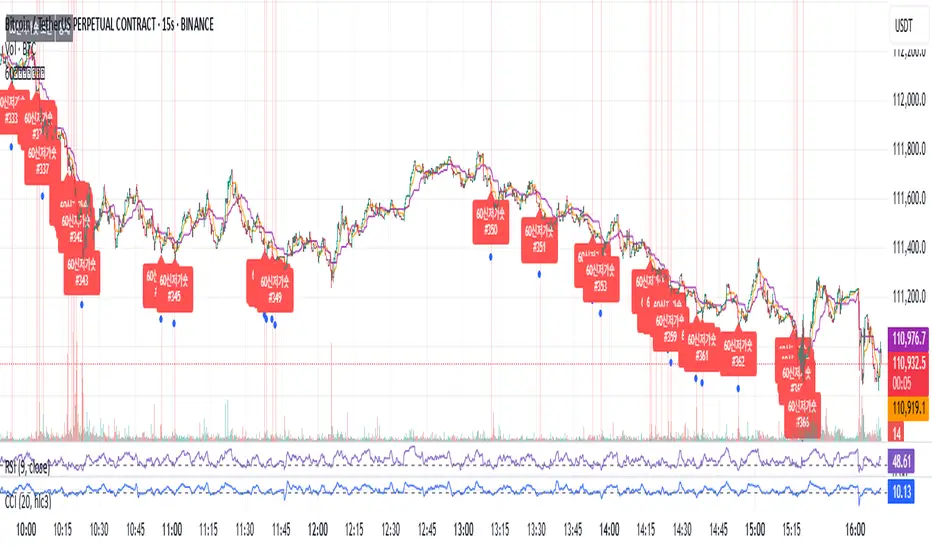
60 신저가 숏_신저가“60-Day New Low Short (New Low)” is a momentum breakdown setup that sells short when price prints a fresh 60-day low, aiming to ride continued weakness after support fails.
Enter on the breakdown close (or next open) with confirmation such as expanding volume, relative weakness vs. a benchmark, and price below the 50/200-day MAs.
Manage risk with a stop above the recent swing high or 20-day high; take profits via ATR-based targets or a trailing stop, and be cautious around earnings/news catalysts.
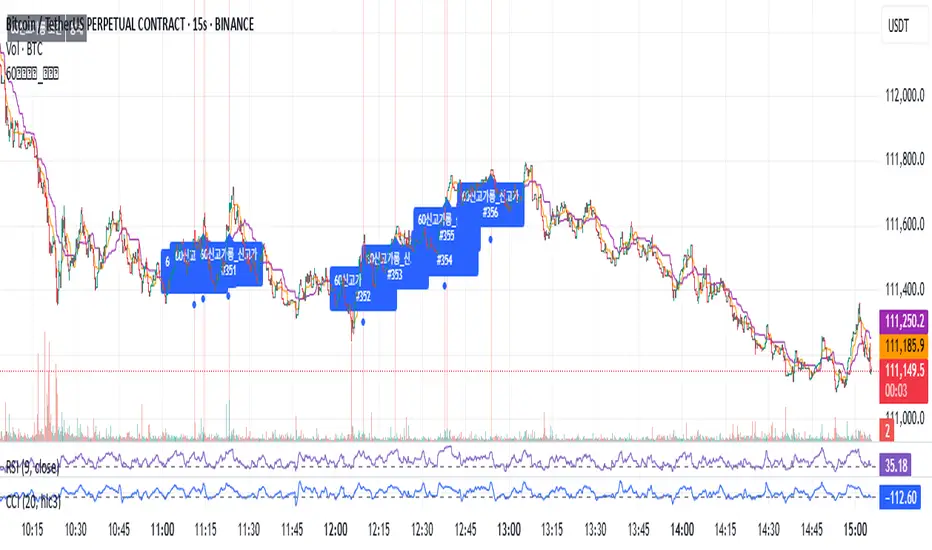
60 신고가 롱_신고가“60-Day New High Long (New High)” is a momentum breakout setup that buys when price prints a fresh 60-day high, expecting continuation once resistance gives way.
Enter on the breakout close (or next open) with confirmation such as expanding volume, relative strength vs. a benchmark, and price above the 50/200-day MAs.
Manage risk with a stop below the recent swing low or 20-day low; take profits via ATR-based targets or a trailing stop, and be cautious around earnings/news catalysts.
60 신저가 숏_신저가“60-Day New Low Short (New Low)” is a momentum breakdown setup that sells short when price prints a fresh 60-day low, aiming to ride continued weakness after support fails.
Enter on the breakdown close (or next open) with confirmation such as expanding volume, relative weakness vs. a benchmark, and price below the 50/200-day MAs.
Manage risk with a stop above the recent swing high or 20-day high; take profits via ATR-based targets or a trailing stop, and be cautious around earnings/news catalysts.

60 신고가 롱“60-Day New High Long” is a momentum breakout strategy that buys when price makes a fresh 60-day high, expecting continuation after resistance gives way.
Enter on the breakout close (or next open) with confirmation such as expanding volume, relative strength vs. a benchmark, and price above the 50/200-day MAs.
Manage risk with a stop below the recent swing low or 20-day low; take profits via ATR-based targets or a trailing stop, and be cautious around binary catalysts (earnings/news).

60 신저가 숏“60-Day New Low Short” is a momentum breakdown setup that sells short when price prints a fresh 60-day low, betting that failed support will extend the downtrend.
Entries are usually taken on the breakdown close (or next open) with confirmation like rising volume, relative weakness, and price below the 50/200-day MAs.
Manage risk with a stop above the recent swing high or 20-day high; take profits via ATR-based targets or a trailing stop, and avoid trades near major catalysts (earnings/news).

Trading Rules Panel BJTRADESFXA Simple Panel for Your Trading Rules
Trading can quickly get overwhelming if you’re juggling multiple strategies, indicators, and market conditions. A simple Trading Rules Panel on your chart helps you stay disciplined by keeping your strategy visible at all times. Instead of relying on memory or flipping through notes, the panel displays your personal trading checklist right where you need it — on your screen.
The panel can be customized to show:
✅ Entry conditions (e.g., trend direction, candle patterns, breakout levels)
✅ Exit rules (take profit, stop loss, or trailing stop logic)
✅ Risk management (lot size, max risk %, reward-to-risk ratio)
✅ Trading session reminders (only trade London/New York overlap, etc.)
✅ Personal rules (no revenge trading, stop after 2 losses, follow your plan)
This kind of panel doesn’t place trades for you; rather, it acts as a visual reminder to keep you consistent and accountable. It prevents emotional decisions and reinforces your discipline, especially during high-pressure moments.
A well-placed panel can also:
Reduce mistakes caused by forgetting steps
Keep your focus on the bigger picture
Improve backtesting and journaling since your rules are clearly visible
Help new traders stick to structure instead of chasing trades

Angle Market Structure [BigBeluga]🔵 OVERVIEW
Angle Market Structure is a smart pivot-based tool that dynamically adapts to price action by accelerating breakout and breakdown detection. It draws market structure levels based on pivot highs/lows and gradually adjusts those levels closer to price using an angle threshold. Upon breakout, the indicator projects deviation zones with labeled levels (+1, +2, +3 or −1, −2, −3) to track price extension beyond structure.
🔵 CONCEPTS
Adaptive Market Structure: Uses pivots to define structure levels, which dynamically angle closer to price over time to capture breakouts sooner.
Breakout Acceleration: Pivot high levels decrease and pivot low levels increase each bar using a user-defined angle (based on ATR), improving reactivity.
Deviation Zones: Once a breakout or breakdown occurs, 3 deviation levels are projected to show how far price extends beyond the breakout point.
Count Labels: Each successful structure break is numbered sequentially, giving traders insight into momentum and trend persistence.
Visual Clarity: The script uses colored pivot points, trend lines, and extension labels for easy structural interpretation.
🔵 FEATURES
Calculates pivot highs and lows using a customizable length.
Applies an angle modifier (ATR-based) to gradually pull levels closer to price.
Plots breakout and breakdown lines in distinct colors with automatic extension.
Shows deviation zones (+1, +2, +3 or −1, −2, −3) after breakout with customizable size.
Color-coded labels for trend break count (bullish or bearish).
Dynamic label sizing and theme-aware colors.
Smart label positioning to avoid chart clutter.
Built-in limit for deviation zones to maintain clarity and performance.
🔵 HOW TO USE
Use pivot-based market structure to identify breakout and breakdown zones.
Watch for crossover (up) or crossunder (down) events as trend continuation or reversal signals.
Observe +1/+2/+3 or -1/-2/-3 levels for overextension opportunities or trailing stop ideas.
Use breakout count as a proxy for trend strength—multiple counts suggest momentum.
Combine with volume or order flow tools for higher confidence entries at breakout points.
Adjust the angle setting to fine-tune sensitivity based on market volatility.
🔵 CONCLUSION
Angle Market Structure enhances traditional pivot-based analysis by introducing breakout acceleration and structured deviation tracking. It’s a powerful tool for traders seeking a cleaner, faster read on market structure and momentum strength—especially during impulsive price moves or structural transitions.

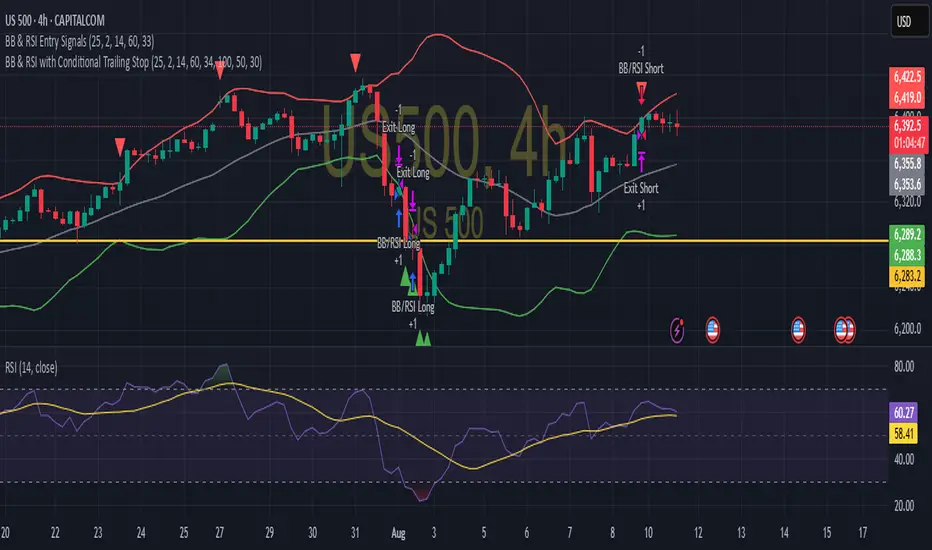
BB & RSI Trailing Stop StrategySimple BB & RSI generated using AI, gets 60% on S&P 500 with the right settings
VHX EMA 135/315📈 EMA 135/315 Cross Strategy – Your Trend Compass with Smart Confirmations
🔍 Core Idea
The EMA 135/315 Cross strategy is a trend-following system.
It tracks two moving averages:
EMA 135 → the “fast” line that reacts to short-term price moves
EMA 315 → the “slow” line that reacts to the bigger trend
When the fast EMA crosses above the slow EMA → market momentum is turning up → BUY signal 🟢
When the fast EMA crosses below the slow EMA → momentum is turning down → SELL signal 🔴
This gives you a clear entry trigger — no guessing, no overcomplication.
✨ On Your Chart
BUY/SELL Arrows
🟢 Green arrow = bullish cross → trend turning up
🔴 Red arrow = bearish cross → trend turning down
Trend Info Panel (Top Left)
Current Trend: BUY / SELL / Neutral
Last Cross: how many bars ago it happened
EMA Gap in %: measures the strength of the trend
Status: “Approaching” if EMAs are getting close → possible cross soon
Automatic TP/SL Levels
📈 TP line (+2% from entry)
📉 SL line (–0.5% from entry)
Saves time — you instantly see your target and protection
EMA Distance Meter
Big % gap = strong trend momentum 🚀
Small % gap = weak or sideways market ⚠️
Real-Time Alerts
You get notified when a cross happens, even if you’re away from the screen
🧠 The Logic Behind It
The EMA 135 reacts faster → it reflects short-term momentum
The EMA 315 moves slower → it reflects the main trend
When the fast EMA overtakes the slow EMA: short-term strength now aligns with the long-term trend → higher probability of a sustained move
The gap % tells you how strong the alignment is — large gap = cleaner moves, small gap = market in transition
“Approaching” status warns that the EMAs are converging, which often happens before a reversal
📊 Boosting the Strategy with Volume Analysis
The EMA cross is a strong trigger, but volume confirms the quality of the move:
High Volume + Cross → more reliable signal, as strong market participation is pushing the trend
Low Volume + Cross → caution, the move might be weak or a false breakout
💡 Tip:
Check the volume histogram or a volume-based indicator (e.g., Volume Profile, OBV).
On a BUY signal: volume should spike above the recent average.
On a SELL signal: watch for strong selling volume bars.
📍 Adding Support & Resistance for Precision
Support and resistance levels help filter out bad trades and optimize entries:
Best BUY setups:
EMA 135 crosses above EMA 315 near a known support zone
Bonus if volume confirms the move
Avoid buying directly into a strong resistance
Best SELL setups:
EMA 135 crosses below EMA 315 near a known resistance zone
Bonus if selling volume is strong
Avoid selling directly into a major support
💡 Use tools like horizontal lines, previous highs/lows, and Volume Profile nodes to spot these zones.
📈 Best Usage Practices
Timeframes
Lower timeframes (1m–5m) → more signals, but more noise → best for scalping with extra filters
Always Combine With Confirmation
EMA Cross = Trigger
Volume spike = Confirmation
S/R zone in your favor = High-probability setup
Manage Risk
Start with the built-in TP/SL
Adjust SL if volatility is higher than usual
Consider trailing stop once price moves in your favor
Avoid Sideways Markets
If EMA gap % is very small and crosses happen often → stand aside until a clear direction forms
Use Alerts
Set alerts for BUY & SELL crosses so you never miss a setup
In short:
This isn’t just an EMA cross indicator — it’s a trend system with built-in risk management, strength measurement, and pre-trade preparation. Combine it with volume confirmation and smart use of support/resistance, and you turn a simple signal into a high-probability trading edge.

SuperTrend Strategy with Trend-Based Exits🟩 SuperTrend Strategy with Trend-Based Exits
This is a fully automated trend-following strategy based on the popular SuperTrend indicator, enhanced with a position sizing algorithm tied to stop-loss distance and dynamic entry/exit rules. The strategy is designed for futures trading with an emphasis on sustainable risk, realistic backtesting, and transparent logic.
🧠 Concept and Methodology
The strategy uses the SuperTrend indicator, which is derived from ATR (Average True Range) and is widely used to capture medium- to long-term market trends.
Key features:
✅ Entries are triggered only when the SuperTrend direction changes (trend reversal).
✅ Exits are performed using a dynamic stop-loss placed at the SuperTrend line.
✅ Position size is automatically calculated based on the trader’s fixed dollar risk per trade and the current distance to the stop-loss.
✅ Rounding logic is included to ensure quantity is valid for the exchange’s lot size.
This strategy does not use any take-profit or classic trailing stop — the position is only closed when the trend reverses or the stop is hit by touching the SuperTrend line.
⚙️ Default Parameters
ATR Length: 300
Factor: 7.5
Risk per trade: $90 (3% of the default $3,000 capital)
Lot step: 10
Commission: 0.05%
These default parameters are not universal. They were optimized specifically for STXUSDT swap at 15M timeframe at Bybit and may not produce viable results on other pairs and timeframes.
Users are encouraged to customize the settings according to specific asset’s volatility, timeframe and other characteristics.
❗ These default settings yield meaningful backtesting results on STXUSDT with a reasonable number of trades (105+) over 7-month period. If applied to other assets, results may vary significantly.
📈 Position Sizing Logic
The strategy uses a dynamic position sizing formula:
Pine Script®
position_size = floor((risk_per_trade / stop_loss_distance) / lot_step) * lot_step
This ensures the trader always risks a fixed dollar amount per trade and never exceeds a sustainable equity exposure (recommended 2% or less).
✅ Realism in Backtesting
To ensure realistic and non-misleading backtest results, this strategy includes:
— Slippage and commission settings matching average exchange conditions (commission = 0.05%, slippage 5 ticks).
— Position sizing based on stop-loss distance (not fixed contract quantity).*
— A fixed risk-per-trade model that adheres to responsible capital management principles.
— This is in compliance with TradingView's Script publishing rules and House Rules.
📌 How to Use
Apply the strategy to a clean chart (preferably 15M for STXUSDT by default).
If using another asset, adjust:
- ATR Length
- Factor
- Risk per trade
- Qty step (lot precision for the symbol)
Avoid using with other indicators unless you understand their purpose.
Use the Strategy Tester to evaluate performance and optimize parameters.
⚠️ Disclaimer
This is not financial advice. Always perform forward testing and assess risk before deploying any strategy on live capital. The strategy is designed for educational and experimental use.

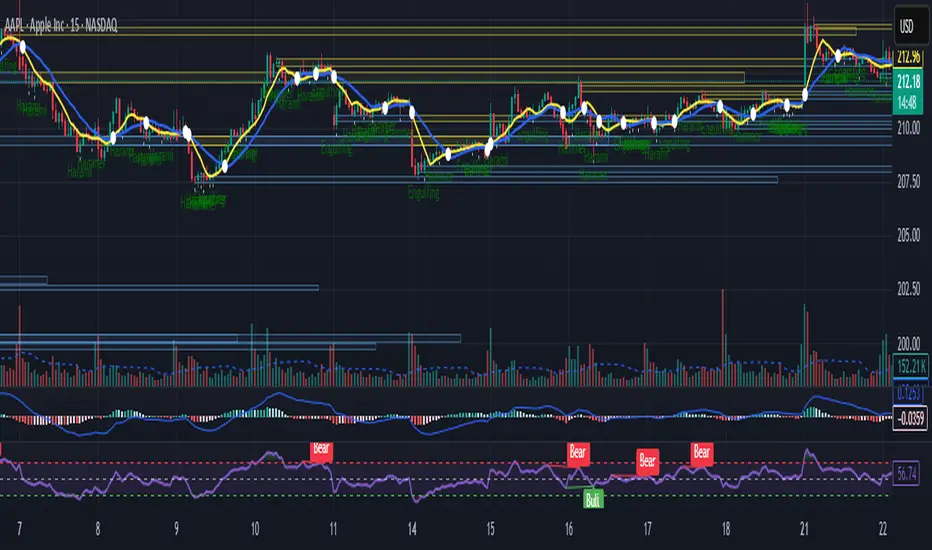
Intraday Bullish Scanner - Profit Ping📊 Intraday Bullish Scanner – Profit Ping Only
This custom-built TradingView script identifies high-probability intraday BUY signals on the 15-minute chart, confirmed by volume, momentum, and price action. It uses:
✅ EMA 7/14 crossovers
✅ Bullish candlestick patterns (Engulfing, Piercing, etc.)
✅ Volume spikes above 20-MA
✅ RSI between 55–65
✅ MACD histogram flip from red to green
✅ Cross-confirmation with the 30-minute trend
Once in a trade, it activates a dynamic trailing stop (starting at 2%, tightening to 1% as profit and volume increase). SELL signals are confirmed only with:
❌ MACD turning red
❌ Bearish RSI movement or drop below 50
❌ EMA 7 crossing below EMA 14
❌ A bearish candlestick (Engulfing or Piercing)
❌ Volume spike on a red candle
💰 When all SELL conditions align, a yellow triangle appears. BUYs are marked with a white triangle. Alerts can be connected directly to Python/webhook systems for full automation with IBKR.
ORB Scalp setup by UnenbatDescription
ORB Scalp Setup by Unenbat is a precise breakout scalping tool that identifies short-term price ranges at the transition between hourly sessions.
📌 Core Features:
Draws a dynamic box using the price range from the last 3 minutes of the previous hour and the first 3 minutes of the new hour (total 5m59s range).
Automatically plots:
Box representing the selected range.
Opening Price Line at the start of the hour.
TP Lines (Take Profit) above and below the box at customizable distances.
BE Lines (Break-Even) above and below the box at customizable distances.
Box and line lengths are user-defined (default: 60 minutes).
Works across historical data (up to the last 100 days).
Fully customizable visuals (colors, offsets, visibility toggles).
🎯 How to Use:
Ideal for scalp traders using breakout strategies.
Enter trades when price breaks above or below the box range.
Use TP and BE lines as clear reference levels for exits or trailing stop logic.
⚙️ Custom Settings:
Enable/disable each component (box, open line, TP line, BE line).
Set your own offset in pips for TP/BE lines.
Adjust the box duration to match your trading style.
Modify start and end times of the range as needed.

PRO Investing - Apex EnginePRO Investing - Apex Engine
1. Core Concept: Why Does This Indicator Exist?
Traditional momentum oscillators like RSI or Stochastic use a fixed "lookback period" (e.g., 14). This creates a fundamental problem: a 14-period setting that works well in a fast, trending market will generate constant false signals in a slow, choppy market, and vice-versa. The market's character is dynamic, but most tools are static.
The Apex Engine was built to solve this problem. Its primary innovation is a self-optimizing core that continuously adapts to changing market conditions. Instead of relying on one fixed setting, it actively tests three different momentum profiles (Fast, Mid, and Slow) in real-time and selects the one that is most synchronized with the current price action.
This is not just a random combination of indicators; it's a deliberate synthesis designed to create a more robust momentum tool. It combines:
Volatility analysis (ATR) to generate adaptive lookback periods.
Momentum measurement (ROC) to gauge the speed of price changes.
Statistical analysis (Correlation) to validate which momentum measurement is most effective right now.
Classic trend filters (Moving Average, ADX) to ensure signals are only taken in favorable market conditions.
The result is an oscillator that aims to be more responsive in volatile trends and more stable in quiet periods, providing a more intelligent and adaptive signal.
2. How It Works: The Engine's Three-Stage Process
To be transparent, it's important to understand the step-by-step logic the indicator follows on every bar. It's a process of Adapt -> Validate -> Signal.
Stage 1: Adapt (Dynamic Length Calculation)
The engine first measures market volatility using the Average True Range (ATR) relative to its own long-term average. This creates a volatility_factor. In high-volatility environments, this factor causes the base calculation lengths to shorten. In low-volatility, they lengthen. This produces three potential Rate of Change (ROC) lengths: dynamic_fast_len, dynamic_mid_len, and dynamic_slow_len.
Stage 2: Validate (Self-Optimizing Mode Selection)
This is the core of the engine. It calculates the ROC for all three dynamic lengths. To determine which is best, it uses the ta.correlation() function to measure how well each ROC's movement has correlated with the actual bar-to-bar price changes over the "Optimization Lookback" period. The ROC length with the highest correlation score is chosen as the most effective profile for the current moment. This "active" mode is reflected in the oscillator's color and the dashboard.
Stage 3: Signal (Normalized Velocity Oscillator)
The winning ROC series is then normalized into a consistent oscillator (the Velocity line) that ranges from -100 (extreme oversold) to +100 (extreme overbought). This ensures signals are comparable across any asset or timeframe. Signals are only generated when this Velocity line crosses its signal line and the trend filters (explained below) give a green light.
3. How to Use the Indicator: A Practical Guide
Reading the Visuals:
Velocity Line (Blue/Yellow/Pink): The main oscillator line. Its color indicates which mode is active (Fast, Mid, or Slow).
Signal Line (White): A moving average of the Velocity line. Crossovers generate potential signals.
Buy/Sell Triangles (▲ / ▼): These are your primary entry signals. They are intentionally strict and only appear when momentum, trend, and price action align.
Background Color (Green/Red/Gray): This is your trend context.
Green: Bullish trend confirmed (e.g., price above a rising 200 EMA and ADX > 20). Only Buy signals (▲) can appear.
Red: Bearish trend confirmed. Only Sell signals (▼) can appear.
Gray: No clear trend. The market is likely choppy or consolidating. No signals will appear; it is best to stay out.
Trading Strategy Example:
Wait for a colored background. A green or red background indicates the market is in a tradable trend.
Look for a signal. For a green background, wait for a lime Buy triangle (▲) to appear.
Confirm the trade. Before entering, confirm the signal aligns with your own analysis (e.g., support/resistance levels, chart patterns).
Manage the trade. Set a stop-loss according to your risk management rules. An exit can be considered on a fixed target, a trailing stop, or when an opposing signal appears.
4. Settings and Customization
This script is open-source, and its settings are transparent. You are encouraged to understand them.
Synaptic Engine Group:
Volatility Period: The master control for the adaptive engine. Higher values are slower and more stable.
Optimization Lookback: How many bars to use for the correlation check.
Switch Sensitivity: A buffer to prevent frantic switching between modes.
Advanced Configuration & Filters Group:
Price Source: The data source for momentum calculation (default close).
Trend Filter MA Type & Length: Define your long-term trend.
Filter by MA Slope: A key feature. If ON, allows for "buy the dip" entries below a rising MA. If OFF, it's stricter, requiring price to be above the MA.
ADX Length & Threshold: Filters out non-trending, choppy markets. Signals will not fire if the ADX is below this threshold.
5. Important Disclaimer
This indicator is a decision-support tool for discretionary traders, not an automated trading system or financial advice. Past performance is not indicative of future results. All trading involves substantial risk. You should always use proper risk management, including setting stop-losses, and never risk more than you are prepared to lose. The signals generated by this script should be used as one component of a broader trading plan.

50/100 EMA Crossover with Candle Confirmation📘 **50/100 EMA Crossover with Candle Confirmation – Strategy Description**
The **50/100 EMA Crossover with Candle Confirmation** is a trend-following strategy designed to filter high-probability entries by combining exponential moving average (EMA) crossovers with strong price action confirmation. This strategy aims to reduce false signals commonly associated with EMA-only systems by requiring a **candle close confirmation in the direction of the trend**, making it more reliable for intraday or swing trading across Forex, crypto, and stock markets.
---
### 🔍 **Core Logic**
* The strategy is based on the interaction of the **50 EMA** (fast-moving average) and the **100 EMA** (slow-moving average).
* **Trend direction** is determined by the crossover:
* **Bullish Trend**: When the 50 EMA crosses **above** the 100 EMA.
* **Bearish Trend**: When the 50 EMA crosses **below** the 100 EMA.
* To **filter out false breakouts**, a **candle confirmation** is used:
* For a **Buy signal**: After a bullish crossover, wait for a strong bullish candle (e.g., full-body green candle) to **close above both EMAs**.
* For a **Sell signal**: After a bearish crossover, wait for a strong bearish candle to **close below both EMAs**.
---
### ✅ **Entry Conditions**
**Buy Entry:**
* 50 EMA crosses above 100 EMA.
* Latest candle closes **above both EMAs**.
* Candle must be bullish (green/full body preferred).
**Sell Entry:**
* 50 EMA crosses below 100 EMA.
* Latest candle closes **below both EMAs**.
* Candle must be bearish (red/full body preferred).
---
### 🛑 **Exit or Take-Profit Options**
* **Fixed TP/SL**: 1:2 or 1:3 risk-reward.
* **Trailing Stop**: Based on recent swing highs/lows or ATR.
* **EMA Exit**: Exit trade when the candle closes on the opposite side of 50 EMA.
---
### ⚙️ **Best Settings**
* **Timeframes**: 5M, 15M, 1H, 4H (works well on most).
* **Markets**: Forex, Crypto (e.g., BTC/ETH), Indices (e.g., NASDAQ, NIFTY50).
* **Recommended filters**:
* Use with RSI divergence or volume confirmation.
* Avoid using during high-impact news (especially on lower timeframes).
---
### 🧠 **Why This Works**
The 50/100 EMA crossover provides a **medium-term trend signal**, reducing noise seen in fast EMAs (like 9 or 21). The candle confirmation adds a **momentum filter**, ensuring price supports the directional bias. This makes it suitable for traders who want a balance of trend and entry precision without overcomplicating with too many indicators.
---
### 📈 **Advantages**
* Simple yet effective for identifying trends.
* Filters out fakeouts using candle confirmation.
* Easy to automate in Pine Script or other trading bots.
* Can be combined with support/resistance or SMC zones for better confluence.
---
### ⚠️ **Limitations**
* May lag slightly in ranging markets.
* Late entries possible due to confirmation candle.
* Works best with additional volume or volatility filter.

Trimmed ATR🧠 **Brief Description**:
Trimmed ATR is a modified volatility indicator that removes extreme values from the ATR calculation. This makes it more reliable for analyzing market conditions and filters out "noise" spikes. It is particularly useful for setting stop-losses and in strategies sensitive to false volatility.
🧾 **How Does Trimmed ATR Work?**
📌 For each bar:
- True Range (TR) is calculated.
- A sliding window of the last N TR values (where N = length) is stored.
- The TR list is sorted, and trimPercent % is cut off from each side:
- The smallest and largest values are removed.
- The remaining values are averaged → Trimmed ATR.
🔍 **Why Is This Important?**
Regular ATR can be distorted by outliers:
- A single spike can sharply inflate the ATR.
- This creates a false impression of market volatility.
🎯 Trimmed ATR solves this by eliminating the impact of anomalies, providing a more stable and accurate volatility measure.
📈 **What Does It Mean If Trimmed ATR Is Higher or Lower Than Regular ATR?**
🔵 **Trimmed ATR is lower than ATR** — this is normal:
- There are isolated TR spikes (high volatility on 1–2 bars).
- ATR increases, including these outliers.
- Trimmed ATR discards them → reflects the true average market background.
🧠 This is the most common case, indicating: a spike occurred, but the market is generally calm.
🟠 **Trimmed ATR is higher than ATR** — a rare but important signal:
- There were artificially low TR values (very small movements).
- ATR becomes too low.
- Trimmed ATR discards these "quiet" periods → provides a more realistic volatility estimate.
⚠️ This may indicate:
- Hidden pressure.
- Preparation for a breakout from a tight range.
- Underestimated volatility.
💡 **Applications**:
- **Trailing Stop**: Trimmed ATR helps avoid stop triggers due to noise.
- **Trend Filter**: Better reflects the "true" market dynamics.
- **Strategy Backtesting**: Eliminates distortions in volatility calculations.
Info TableOverview
The Info Table V1 is a versatile TradingView indicator tailored for intraday futures traders, particularly those focusing on MESM2 (Micro E-mini S&P 500 futures) on 1-minute charts. It presents essential market insights through two customizable tables: the Main Table for predictive and macro metrics, and the New Metrics Table for momentum and volatility indicators. Designed for high-activity sessions like 9:30 AM–11:00 AM CDT, this tool helps traders assess price alignment, sentiment, and risk in real-time. Metrics update dynamically (except weekly COT data), with optional alerts for key conditions like volatility spikes or momentum shifts.
This indicator builds on foundational concepts like linear regression for predictions and adapts open-source elements for enhanced functionality. Gradient code is adapted from TradingView's Color Library. QQE logic is adapted from LuxAlgo's QQE Weighted Oscillator, licensed under CC BY-NC-SA 4.0. The script is released under the Mozilla Public License 2.0.
Key Features
Two Customizable Tables: Positioned independently (e.g., top-right for Main, bottom-right for New Metrics) with toggle options to show/hide for a clutter-free chart.
Gradient Coloring: User-defined high/low colors (default green/red) for quick visual interpretation of extremes, such as overbought/oversold or high volatility.
Arrows for Directional Bias: In the New Metrics Table, up (↑) or down (↓) arrows appear in value cells based on metric thresholds (top/bottom 25% of range), indicating bullish/high or bearish/low conditions.
Consensus Highlighting: The New Metrics Table's title cells ("Metric" and "Value") turn green if all arrows are ↑ (strong bullish consensus), red if all are ↓ (strong bearish consensus), or gray otherwise.
Predicted Price Plot: Optional line (default blue) overlaying the ML-predicted price for visual comparison with actual price action.
Alerts: Notifications for high/low Frahm Volatility (≥8 or ≤3) and QQE Bias crosses (bullish/bearish momentum shifts).
Main Table Metrics
This table focuses on predictive, positional, and macro insights:
ML-Predicted Price: A linear regression forecast using normalized price, volume, and RSI over a customizable lookback (default 500 bars). Gradient scales from low (red) to high (green) relative to the current price ± threshold (default 100 points).
Deviation %: Percentage difference between current price and predicted price. Gradient highlights extremes (±0.5% default threshold), signaling potential overextensions.
VWAP Deviation %: Percentage difference from Volume Weighted Average Price (VWAP). Gradient indicates if price is above (green) or below (red) fair value (±0.5% default).
FRED UNRATE % Change: Percentage change in U.S. unemployment rate (via FRED data). Cell turns red for increases (economic weakness), green for decreases (strength), gray if zero or disabled.
Open Interest: Total open MESM2 futures contracts. Gradient scales from low (red) to high (green) up to a hardcoded 300,000 threshold, reflecting market participation.
COT Commercial Long/Short: Weekly Commitment of Traders data for commercial positions. Long cell green if longs > shorts (bullish institutional sentiment); Short cell red if shorts > longs (bearish); gray otherwise.
New Metrics Table Metrics
This table emphasizes technical momentum and volatility, with arrows for quick bias assessment:
QQE Bias: Smoothed RSI vs. trailing stop (default length 14, factor 4.236, smooth 5). Green for bullish (RSI > stop, ↑ arrow), red for bearish (RSI < stop, ↓ arrow), gray for neutral.
RSI: Relative Strength Index (default period 14). Gradient from oversold (red, <30 + threshold offset, ↓ arrow if ≤40) to overbought (green, >70 - offset, ↑ arrow if ≥60).
ATR Volatility: Score (1–20) based on Average True Range (default period 14, lookback 50). High scores (green, ↑ if ≥15) signal swings; low (red, ↓ if ≤5) indicate calm.
ADX Trend: Average Directional Index (default period 14). Gradient from weak (red, ↓ if ≤0.25×25 threshold) to strong trends (green, ↑ if ≥0.75×25).
Volume Momentum: Score (1–20) comparing current to historical volume (lookback 50). High (green, ↑ if ≥15) suggests pressure; low (red, ↓ if ≤5) implies weakness.
Frahm Volatility: Score (1–20) from true range over a window (default 24 hours, multiplier 9). Dynamic gradient (green/red/yellow); ↑ if ≥7.5, ↓ if ≤2.5.
Frahm Avg Candle (Ticks): Average candle size in ticks over the window. Blue gradient (or dynamic green/red/yellow); ↑ if ≥0.75 percentile, ↓ if ≤0.25.
Arrows trigger on metric-specific logic (e.g., RSI ≥60 for ↑), providing directional cues without strict color ties.
Customization Options
Adapt the indicator to your strategy:
ML Inputs: Lookback (10–5000 bars) and RSI period (2+) for prediction sensitivity—shorter for volatility, longer for trends.
Timeframes: Individual per metric (e.g., 1H for QQE Bias to match higher frames; blank for chart timeframe).
Thresholds: Adjust gradients and arrows (e.g., Deviation 0.1–5%, ADX 0–100, RSI overbought/oversold).
QQE Settings: Length, factor, and smooth for fine-tuned momentum.
Data Toggles: Enable/disable FRED, Open Interest, COT for focus (e.g., disable macro for pure intraday).
Frahm Options: Window hours (1+), scale multiplier (1–10), dynamic colors for avg candle.
Plot/Table: Line color, positions, gradients, and visibility.
Ideal Use Case
Perfect for MESM2 scalpers and trend traders. Use the Main Table for entry confirmation via predicted deviations and institutional positioning. Leverage the New Metrics Table arrows for short-term signals—enter bullish on green consensus (all ↑), avoid chop on low volatility. Set alerts to catch shifts without constant monitoring.
Why It's Valuable
Info Table V1 consolidates diverse metrics into actionable visuals, answering critical questions: Is price mispriced? Is momentum aligning? Is volatility manageable? With real-time updates, consensus highlights, and extensive customization, it enhances precision in fast markets, reducing guesswork for confident trades.
Note: Optimized for futures; some metrics (OI, COT) unavailable on non-futures symbols. Test on demo accounts. No financial advice—use at your own risk.
The provided script reuses open-source elements from TradingView's Color Library and LuxAlgo's QQE Weighted Oscillator, as noted in the script comments and description. Credits are appropriately given in both the description and code comments, satisfying the requirement for attribution.
Regarding significant improvements and proportion:
The QQE logic comprises approximately 15 lines of code in a script exceeding 400 lines, representing a small proportion (<5%).
Adaptations include integration with multi-timeframe support via request.security, user-customizable inputs for length, factor, and smooth, and application within a broader table-based indicator for momentum bias display (with color gradients, arrows, and alerts). This extends the original QQE beyond standalone oscillator use, incorporating it as one of seven metrics in the New Metrics Table for confluence analysis (e.g., consensus highlighting when all metrics align). These are functional enhancements, not mere stylistic or variable changes.
The Color Library usage is via official import (import TradingView/Color/1 as Color), leveraging built-in gradient functions without copying code, and applied to enhance visual interpretation across multiple metrics.
The script complies with the rules: reused code is minimal, significantly improved through integration and expansion, and properly credited. It qualifies for open-source publication under the Mozilla Public License 2.0, as stated.

Golden Ratio Trend Persistence [EWT]Golden Ratio Trend Persistence
~~~~~~~~~~~~~~~~~~~~~~~~~~~~~~~~~~~~~~~~~~~~
Overview
The Golden Ratio Trend Persistence is a dynamic tool designed to identify the strength and persistence of market trends. It operates on a simple yet powerful premise: a trend is likely to continue as long as it doesn't retrace beyond the key Fibonacci golden ratio of 61.8%.
This indicator automatically identifies the most significant swing high or low and plots a single, dynamic line representing the 61.8% retracement level of the current move. This line acts as a "line in the sand" for the prevailing trend. The background color also changes to provide an immediate visual cue of the current market direction.
~~~~~~~~~~~~~~~~~~~~~~~~~~~~~~~~~~~~~~~~~~~~
The Power of the Golden Ratio (61.8%)
The golden ratio (ϕ≈1.618) and its inverse (0.618, or 61.8%) are fundamental mathematical constants that appear throughout nature, art, and science, often representing harmony and structure. In financial markets, this ratio is a cornerstone of Fibonacci analysis and is considered one of the most critical levels for price retracements.
Market movements are not linear; they progress in waves of impulse and correction. The 61.8% level often acts as the ultimate point of support or resistance. A trend that can hold this level demonstrates underlying strength and is likely to persist. A breach of this level, however, suggests a fundamental shift in market sentiment and a potential reversal.
~~~~~~~~~~~~~~~~~~~~~~~~~~~~~~~~~~~~~~~~~~~~
How to Use This Indicator
This indicator is designed for clarity and ease of use.
Identifying the Trend : The visual cues make the current trend instantly recognizable.
A teal line with a teal background signifies a bullish trend. The line acts as dynamic support.
A maroon line with a maroon background signifies a bearish trend. The line acts as dynamic resistance.
Confirming Trend Persistence : As long as the price respects the plotted level, the trend is considered intact.
In an uptrend, prices should remain above the teal line. The indicator will automatically adjust its anchor to new, higher lows, causing the support line to trail the price.
In a downtrend, prices should remain below the maroon line.
Spotting Trend Reversals : The primary signal is a trend reversal, which occurs when the price closes decisively beyond the plotted level.
Potential Sell Signal : When the price closes below the teal support line, it indicates that buying pressure has failed, and the uptrend is likely over.
Potential Buy Signal : When the price closes above the maroon resistance line, it indicates that selling pressure has subsided, and a new uptrend may be starting.
Think of this tool as an intelligent, adaptive trailing stop that is based on market structure and the time-tested principles of Fibonacci analysis.
~~~~~~~~~~~~~~~~~~~~~~~~~~~~~~~~~~~~~~~~~~~~
Input Parameters
You can customize the indicator's sensitivity through the following inputs in the settings menu:
Pivot Lookback Left : This number defines how many bars to the left of a candle must be lower (for a pivot high) or higher (for a pivot low) to identify a potential swing point. A higher value will result in fewer, but more significant, pivots being detected.
Pivot Lookback Right : This defines the number of bars that must close to the right before a swing point is confirmed. This parameter prevents the indicator from repainting. A higher value increases confirmation strength but also adds a slight lag.
Fibonacci Ratio : While the default is the golden ratio (0.618), you can adjust this to other key Fibonacci levels, such as 0.5 (50%) or 0.382 (38.2%), to test for different levels of trend persistence.
Adjusting these parameters allows you to fine-tune the indicator for different assets, timeframes, and trading styles, from short-term scalping to long-term trend following.
Fibonacci Extension Distance Table## 🧾 **Script Name**: Fibonacci Extension Distance Table
### 🎯 Purpose:
This script helps traders visually track **key Fibonacci extension levels** on any chart and immediately see:
* The **price target** at each extension
* The **distance in percentage** from the current market price
It is especially helpful for:
* **Profit targets in trending trades**
* Monitoring **potential resistance zones** in uptrends
* Planning **entry/exit timing**
---
## 🧮 **How It Works**
1. **Swing Logic (A → B → C)**
* It automatically finds:
* `A`: the **lowest low** in the last `swingLen` bars
* `B`: the **highest high** in that same lookback
* `C`: current bar’s low is used as the **retracement point** (simplified)
2. **Extension Formula**
Using the Fibonacci formula:
```text
Extension Price = C + (B - A) × Fibonacci Ratio
```
The script calculates projected target prices at:
* **100%**
* **127.2%**
* **161.8%** (Golden Ratio)
* **200%**
* **261.8%**
3. **Distance Calculation**
For each level, it calculates:
* The **absolute difference** between current price and the extension level
* The **percentage difference**, which helps quickly assess how close or far the market is from that target
---
## 📋 **Table Output in Top Right**
| Level | Target ₹ | Dist % from current price |
| ------ | ---------- | ------------------------- |
| 100% | Calculated | % Above/Below |
| 127.2% | Calculated | % Above/Below |
| 161.8% | Calculated | % Above/Below |
| 200% | Calculated | % Above/Below |
| 261.8% | Calculated | % Above/Below |
* The table updates **live on each bar**
* It **highlights levels** where price is nearing
* Useful in **any time frame** and **any market** (stocks, crypto, forex)
---
## 🔔 Example Use Case
You bought a stock at ₹100, and recent swing shows:
* A = ₹80
* B = ₹110
* C = ₹100
The 161.8% extension = 100 + (110 − 80) × 1.618 = ₹148.54
If the current price is ₹144, the table will show:
* Golden Ratio Target: ₹148.54
* Distance: −4.54
* Distance %: −3.05%
You now know your **target is near** and can plan your **exit or trailing stop**.
---
## 🧠 Benefits
* No need to draw extensions manually
* Automatically adapts to new swing structures
* Supports **scalping**, **swing**, and **positional** strategies

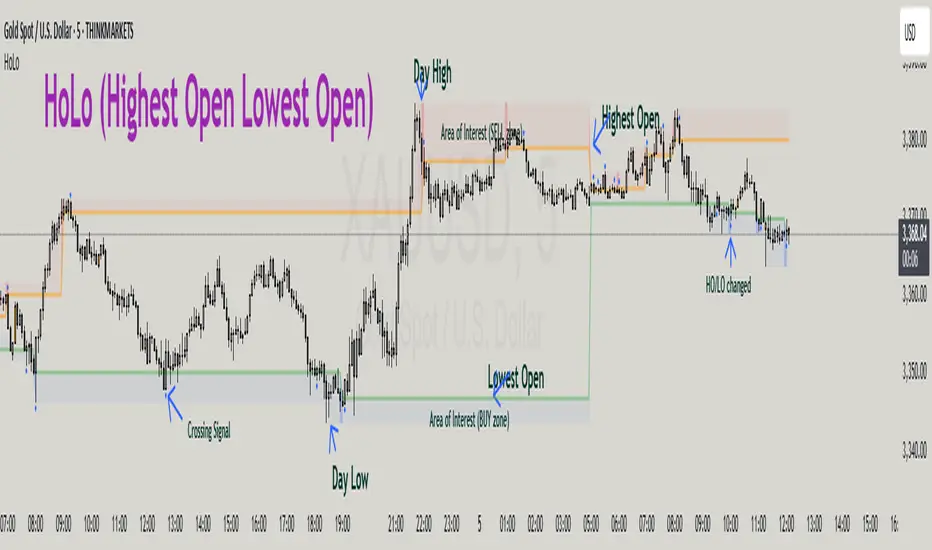
HoLo (Highest Open Lowest Open)HoLo (Highest Open Lowest Open) Method
Overview
HoLo stands for "Highest Open Lowest Open" – a forex trading strategy.
Core Concept
Definition of HoLo:
Highest Open (HO): The highest opening price among all H1 candles of the current trading day
Lowest Open (LO): The lowest opening price among all H1 candles of the current trading day
Trading Day: Starts at Asia Open Session
Strategy Setup
Step 1: Mark Key Levels
Current day's High/Low
Highest Open and Lowest Open (from H1 candles)
Step 2: Define the Area of Interest
Sell Zone: Between the Highest Open and the current day's High
Buy Zone: Between the Lowest Open and the current day's Low
Trade Entry Rules
Sell Trade:
Price goes above the Highest Open
Trigger candle (M5, M15, or M30) closes above the Highest Open
Enter a sell when price revisits the Highest Open level (Sell Stop Order)
Buy Trade:
Price drops below the Lowest Open
Trigger candle closes below the Lowest Open
Enter a buy when price revisits the Lowest Open level (Buy Stop Order)
Trigger Timeframe:
Choose M1, M5, or M15 based on:
Your screen time availability
Personal trading style
Risk and Profit Management
Stop Loss:
For sell: Set SL at the day’s High + spread
For buy: Set SL at the day’s Low + spread
Take Profit (TP) Basic Rule:
You should open 2 positions:
When profit reaches 1R: Take partial profit + move SL to BE (Break Even)
Let the remaining position run using partial TP or trailing stop
Money Management:
Never risk more than 1% per trade
Recommended: 0.5% risk due to multiple opportunities daily
Prioritize major pairs.
The Indicator
How to read data
For Day Traders
Monitor the sell zone (red area) for potential short entries near resistance
Watch the buy zone (blue area) for potential long entries near support
Use cross signals for entry/exit points
Pay attention to timing markers for key market hours
Alert
HO (Highest Open) level changes
LO (Lowest Close) level changes
Price crossing key levels
Timing notifications
Three Candle Bullish Engulfing StrategyThe Three Candle Bullish Engulfing Strategy is a versatile, multi-mode trading system designed for TradingView, combining classic candlestick patterns with momentum confirmation and dynamic risk management. This script supports both swing trading and intraday approaches, as well as an optional RSI-based breakout mode for additional signal filtering.
Key Features:
Three Candle Pattern Detection:
The strategy identifies potential trend reversal points using a three-candle pattern:
The first candle is a strong bullish (or bearish) move.
The second candle is a doji or small-bodied candle, indicating indecision.
The third candle is a bullish (or bearish) engulfing candle that closes above (or below) the previous high (or low), confirming the reversal.
Flexible Trading Modes:
Swing Long Only: Enter long trades on bullish three-candle setups.
Intraday Long & Short: Trade both long and short based on bullish and bearish three-candle patterns, with automatic session-end exits.
RSI Breakout Mode: Enter long trades when the 1-hour RSI exceeds a user-defined threshold (default 80) and a bullish candle forms, with breakout confirmation and a fixed-percentage stop loss.
Visual Aids:
Plots the RSI breakout trigger price and stop loss on the chart for easy monitoring.
How It Works:
Three Candle Pattern Entries:
Long Entry: Triggered when a bullish candle is followed by a doji, then a bullish engulfing candle closes above the previous high.
Short Entry (Intraday only): Triggered by the inverse pattern—bearish candle, doji, then bearish engulfing candle closing below the previous low.
RSI Breakout Entries:
When the RSI on a higher timeframe (default 1 hour) exceeds the set threshold and a bullish candle forms, the script records a trigger price.
A long trade is entered if the price breaks above this trigger, with a stop loss set a fixed percentage below.
Exits:
Positions are closed if the trailing stop is hit, the session ends (for intraday mode), or the stop loss is triggered in RSI breakout mode.
In RSI breakout mode, positions are also closed if a new breakout trigger forms while in position.

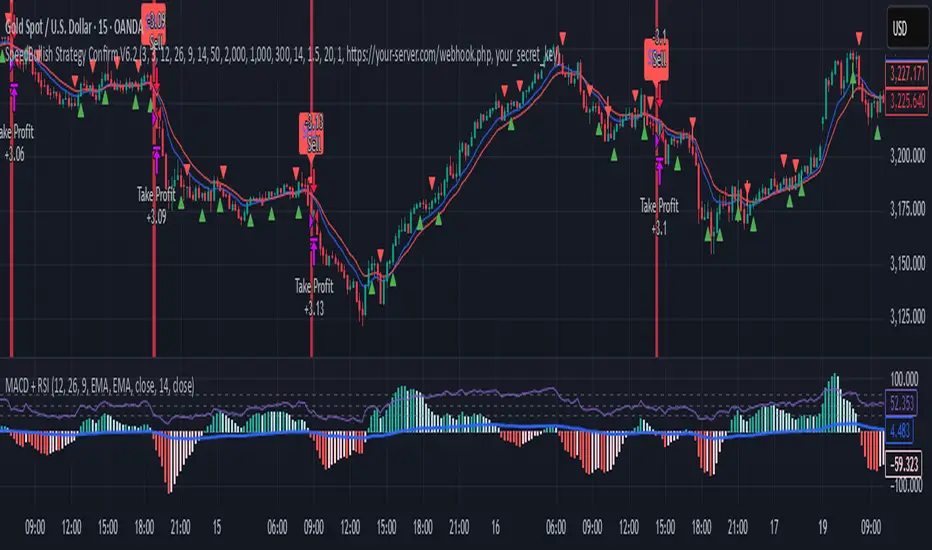
SpeedBullish Strategy Confirm V6.2SpeedBullish Strategy Confirm V6.2
SpeedBullish V6.2 is an advanced price-action + indicator-based strategy designed to confirm trend strength and signal entries with high precision. This version builds on the W/M pattern structure and adds dynamic filtering with EMA, MACD Histogram, RSI, ATR, and Volume.
✅ Signal Conditions
🔹 Buy Signal:
Price above EMA10 or EMA15
MACD Histogram crosses above 0
RSI > 50
(Optional) Higher low via Pivot Low
(Optional) ATR > ATR SMA * Multiplier
(Optional) Volume > SMA * Multiplier
🔻 Sell Signal:
Price below EMA10 or EMA15
MACD Histogram crosses below 0
RSI < 50
(Optional) Lower high via Pivot High
(Optional) Confirmed high volatility and volume
⚙️ Strategy Features
MACD Histogram for momentum shift detection
RSI filtering for momentum confirmation
EMA10/15 for trend direction
ATR-based volatility filter
Volume confirmation filter
Dynamic TP/SL + Trailing Stop
Webhook Integration for MT5 auto-trade
Visual signal markers + background highlight
🔔 Alerts
Alerts are sent in JSON format via alert() with the current symbol, action (buy/sell), and price. Webhook endpoint and secret key are configurable.
📈 How to Use
Attach the strategy to any symbol and timeframe
Customize filters and confirmations to fit your market conditions
Enable webhook alerts for integration with your MT5 Expert Advisor or trading bot
Backtest and optimize before live deployment
[blackcat] L2 Multi-Level Price Condition TrackerOVERVIEW
The L2 Multi-Level Price Condition Tracker represents an innovative approach to analyzing financial markets by simultaneously monitoring multiple price levels, thus providing traders with a holistic view of market dynamics. By combining dynamic calculations based on moving averages and price deviations, this tool aims to deliver precise and actionable insights into potential entry and exit points. It leverages sophisticated statistical measures to identify key thresholds that signify shifts in market sentiment, thereby aiding traders in making well-informed decisions. 🎯
Key benefits encompass:
• Comprehensive calculation of midpoints and average prices indicating short-term trend directions.
• Interactive visualization elements enhancing interpretability effortlessly.
• Real-time generation of buy/sell signals driven by precise condition evaluations.
TECHNICAL ANALYSIS COMPONENTS
📉 Midpoint Calculations:
Computes central reference points derived from high-low ranges establishing baseline supports/resistances.
Utilizes Simple Moving Averages (SMAs) along with standardized deviation formulas smoothing out volatility while preserving long-term trends accurately.
Facilitates identification of directional biases reflecting underlying market forces dynamically.
🕵️♂️ Advanced Price Level Detection:
Derives upper/lower bounds adjusting sensitivities adaptively responding to changing conditions flexibly.
Employs proprietary logic distinguishing between bullish/bearish sentiments promptly signaling transitions effectively.
Ensures consistent adherence to predefined statistical protocols maintaining accuracy robustly.
🎥 Dynamic Signal Generation:
Detects crossovers indicating dominance shifts between buyers/sellers promptly triggering timely alerts.
Integrates conditional logic reinforcing signal validity minimizing erroneous activations systematically.
Supports adaptive thresholds tuning sensitivities based on evolving market conditions flexibly accommodating varying scenarios.
INDICATOR FUNCTIONALITY
🔢 Core Algorithms:
Utilizes moving averages alongside standardized deviation formulas generating precise net volume measurements.
Implements Arithmetic Mean Line Algorithm (AMLA) smoothing techniques improving interpretability.
Ensures consistent alignment with established statistical principles preserving fidelity.
🖱️ User Interface Elements:
Dedicated plots displaying real-time midpoint markers facilitating swift decision-making.
Context-sensitive color coding distinguishing positive/negative deviations intuitively highlighting key activations clearly.
Background shading emphasizing proximity to crucial threshold activations enhancing visibility focusing attention on vital signals promptly.
STRATEGY IMPLEMENTATION
✅ Entry Conditions:
Confirm bullish/bearish setups validated through multiple confirmatory signals assessing concurrent market sentiment factors.
Validate entry decisions considering alignment between calculated midpoints and broader trend directions ensuring coherence.
Monitor cumulative breaches signifying potential trend reversals executing partial/total closes contingent upon predetermined loss limits preserving capital efficiently.
🚫 Exit Mechanisms:
Trigger exits upon hitting predefined thresholds derived from historical analyses promptly executing closures.
Execute partial/total closes contingent upon cumulative loss limits preserving capital efficiently managing exposures prudently.
Conduct periodic reviews gauging strategy effectiveness rigorously identifying areas needing refinement implementing corrective actions iteratively enhancing performance metrics steadily.
PARAMETER CONFIGURATIONS
🎯 Optimization Guidelines:
Lookback Period: Governs responsiveness versus stability balancing sensitivity/stability governing moving averages aligning with preferred granularity.
Price Source: Dictates primary data series driving volume calculations selecting relevant inputs accurately tailoring strategies accordingly.
💬 Customization Recommendations:
Commence with baseline defaults; iteratively refine parameters isolating individual impacts evaluating adjustments independently prior to combined modifications minimizing disruptions.
Prioritize minimizing erroneous trigger occurrences first optimizing signal fidelity sustaining balanced risk-reward profiles irrespective of chosen settings upholding disciplined approaches preserving capital efficiently.
ADVANCED RISK MANAGEMENT
🛡️ Proactive Risk Mitigation Techniques:
Enforce strict compliance with pre-defined maximum leverage constraints adhering strictly to guidelines managing exposures prudently.
Mandatorily apply trailing stop-loss orders conforming to script outputs enforcing discipline rigorously preventing adverse consequences.
Allocate positions proportionately relative to available capital reserves conducting periodic reviews gauging effectiveness continuously identifying improvement opportunities steadily.
⚠️ Potential Pitfalls & Solutions:
Address frequent violations arising during heightened volatility phases necessitating manual interventions judiciously preparing contingency plans proactively mitigating risks effectively.
Manage false alerts warranting immediate attention avoiding adverse consequences systematically implementing corrective actions reliably.
Prepare proactive responses amid adverse movements ensuring seamless functionality amidst fluctuating conditions fortifying resilience against anomalies robustly.
PERFORMANCE MONITORING METRICS
🔍 Evaluation Criteria:
Assess win percentages consistently across diverse trading instruments gauging reliability measuring profitability efficiency accurately evaluating downside risks comprehensively uncovering systematic biases potentially skewing outcomes.
Calculate average profit ratios per successful execution benchmarking actual vs expected performances documenting results meticulously tracking progress dynamically addressing identified shortcomings proactively fostering continuous improvements.
📈 Historical Data Analysis Tools:
Maintain detailed logs capturing every triggered event recording realized profits/losses comparing simulated projections accurately identifying discrepancies warranting investigation implementing iterative refinements steadily enhancing performance metrics progressively.
Identify recurrent systematic errors demanding corrective actions implementing iterative refinements steadily addressing identified shortcomings proactively fostering continuous enhancements dynamically improving robustness resiliently.
PROBLEM SOLVING ADVICE
🔧 Frequent Encountered Challenges:
Unpredictable behaviors emerging within thinly traded markets requiring filtration processes enhancing signal integrity excluding low-liquidity assets prone to erratic movements effectively.
Latency issues manifesting during abrupt price fluctuations causing missed opportunities introducing buffer intervals safeguarding major news/event impacts mitigating distortions seamlessly verifying reliable connections ensuring uninterrupted data flows guaranteeing accurate interpretations dependably.
💡 Effective Resolution Pathways:
Limit ongoing optimization attempts preventing model degradation maintaining optimal performance levels consistently recalibrating parameters periodically adapting strategies flexibly responding appropriately amidst varying conditions dynamically improving robustness resiliently.
Verify reliable connections ensuring uninterrupted data flows guaranteeing accurate interpretations dependably bolstering overall efficacy systematically addressing identified shortcomings dynamically fostering continuous advancements.
THANKS
Heartfelt acknowledgment extends to all developers contributing invaluable insights regarding multi-level price condition-based trading methodologies! ✨
