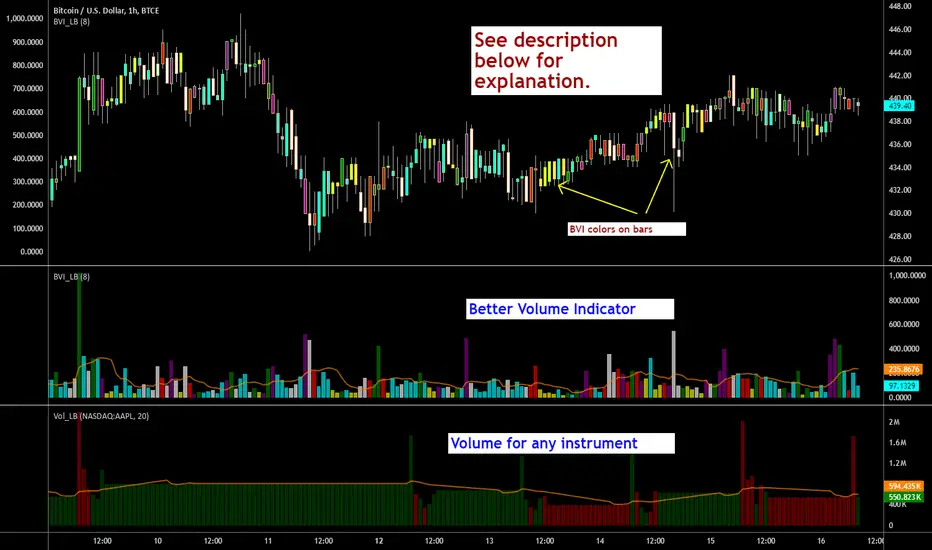
Indicators: Better Volume Indicator & InstrumentVolumeBetter Volume Indicator
-----------------------------------------
This is a direct port of a famous indicator from Tradestation platform.
BVI improves on your typical volume histogram by coloring the bars based on 5 criteria:
* Volume Climax Up – high volume, high range, up bars (red)
* Volume Climax Down – high volume, high range, down bars (white)
* High Volume Churn – high volume, low range bars (green, barcolor= blue)
* Low Volume – low volume bars (yellow)
* Volume Climax plus High Volume Churn – both the above conditions (magenta)
When there are no volume signals the default histogram bar coloring is cyan.
Bars can also be colored to match volume color. Enable "Change BarColors?" in the options page.
Volume Climax Up bars are typically seen at:
* The start of up trends
* The end of up trends, and
* Pullbacks during down trends.
Volume Climax Down bars are typically seen at:
* The start of down trends
* The end of down trends, and
* Pullbacks during up trends.
High Volume Churn bars are typically seen at:
* The end of up trends
* The end of down trends, and
* Profit taking mid-trend.
Low Volume bars are typically seen at:
* The end of up trends
* The end of down trends, and
* Pullbacks mid-trend.
More info:
emini-watch.com
Instrument Volume
-----------------------------------------
This is a simple script that allows you to plot volume for any instrument.
Very handy when you want to compare volumes. Just add multiple instances and select the symbol you want via Options page.
This script also gets close/open for the selected symbol. If you are itching to get started on Pinescripting (scripting language used at TV), I suggest trying out the following, using this script as the template:
- Show RSI for any instrument
(hint: "close" for the selected symbol is already in script. Do a "plot(rsi(c, 14))")
- MACD / CCI / ....
- Plot the difference (not correlation). This may be of interest in some instruments.
For ex. BTC in BTCE exchange mostly lags BITSTAMP.
Hope this piques your interest in Pine. Feel free to post in the Pinescript room if you have any queries.
"VOLUME BAR"に関するスクリプトを検索
Clean Volume (SUV)The Problem with Raw Volume
Traditional volume bars tell you how much traded, but not whether that amount is unusual. This creates noise that misleads traders:
Stock A averages 1M shares with wild daily swings (500K-2M is normal). Today's 2M volume looks like a spike—but it's just a routine high day.
Stock B averages 1M shares with rock-steady volume (950K-1.05M typical). Today's 2M volume is genuinely extraordinary—institutions are clearly active.
Both show identical 200% relative volume. But Stock B's reading is far more significant. Raw volume and simple relative volume (RVol) can't distinguish between these situations, leading to:
- False signals on naturally volatile stocks
- Missed signals on stable stocks where smaller deviations matter
- Inconsistent comparisons across different securities
---
A Solution: Standardized Unexpected Volume (SUV)
SUV applies statistical normalization to volume, measuring how many standard deviations today's volume is from the mean. This z-score approach accounts for each stock's individual volume stability, not just its average.
SUV = (Today's Volume - Average Volume) / Standard Deviation of Volume
Using the examples above:
- Stock A (high volatility): SUV = 2.0 — elevated but not unusual for this stock
- Stock B (low volatility): SUV = 10.0 — extremely unusual, demands attention
SUV automatically calibrates to each security's behaviour, making volume readings comparable across any stock, ETF, or timeframe.
---
What SUV Is Good For
✅ Identifying genuine volume anomalies — separates signal from noise
✅ Comparing volume across different securities — apples-to-apples z-scores
✅ Spotting institutional activity — large players create statistically significant footprints
✅ Confirming breakouts — high SUV validates price moves
✅ Detecting exhaustion — extreme SUV after extended moves may signal climax
✅ Finding "dry" setups — negative SUV reveals quiet accumulation periods
---
Where SUV Has Limitations
⚠️ Earnings/news events — SUV will spike dramatically (by design), but the statistical reading may be less meaningful when fundamentals change
⚠️ Low-float stocks — extreme volume volatility can produce erratic SUV readings
⚠️ First 20 bars — needs lookback period to establish baseline; early readings are less reliable
⚠️ Doesn't predict direction — SUV measures volume intensity, not whether price will rise or fall
---
How to Read This Indicator
Bar Height
Displays actual volume (like a traditional volume chart) so you can still see absolute levels.
Bar Color (SUV Intensity)
Color intensity reflects the SUV z-score. Brighter = more unusual.
Up Days (Green Gradient):
| Color | SUV Range | Meaning |
|--------------|-----------|------------------------------------------|
| Bright Green | ≥ 3.0 | EXTREME — Highly unusual buying activity |
| Green | ≥ 2.0 | VERY HIGH — Significant accumulation |
| Light Green | ≥ 1.5 | HIGH — Above-average interest |
| Pale Green | ≥ 1.0 | ELEVATED — Moderately active |
| Muted Green | 0 to 1.0 | NORMAL — Typical volume |
| Dark Grey | < 0 | DRY — Below-average, quiet |
Down Days (Red Gradient):
| Color | SUV Range | Meaning |
|------------|-----------|-----------------------------------------|
| Bright Red | ≥ 3.0 | EXTREME — Panic selling or capitulation |
| Red | ≥ 2.0 | VERY HIGH — Heavy distribution |
| Light Red | ≥ 1.5 | HIGH — Active selling |
| Pale Red | ≥ 1.0 | ELEVATED — Moderate selling |
| Muted Red | 0 to 1.0 | NORMAL — Routine down day |
| Dark Grey | < 0 | DRY — Light profit-taking |
Coiled State (Tan/Beige):
When detected, bars turn muted tan regardless of direction. This indicates:
- Volume compression (SUV below threshold for consecutive days)
- Volatility contraction (ATR below average)
- Price tightness (small recent moves)
Coiled states may precede significant breakouts.
Special Markers
"P" Label (Blue) — Pocket Pivot detected. Morales & Kacher's signal fires when:
- Price closes higher than previous close
- Price closes above the open (green candle)
- Volume exceeds the highest down-day volume of the last 10 bars
Pocket Pivots may indicate institutional buying before a traditional breakout.
"C" Label (Orange) — Coiled state confirmed. The stock is consolidating with compressed volume and tight price action. Watch for expansion.
Dashboard
The configurable dashboard displays real-time metrics. Default items:
- Vol — Current bar volume
- SUV — Z-score value
- Class — Classification (EXTREME/VERY HIGH/HIGH/ELEVATED/NORMAL/DRY/COILED)
- Proj RVol — Projected end-of-day relative volume (intraday only)
Additional optional items: Direction, Coil Status, Relative ATR, Pocket Pivot, Average Volume.
---
Practical Usage Tips
1. SUV ≥ 2 on breakouts — Validates the move has institutional participation
2. Watch for SUV < 0 bases — Quiet accumulation zones where smart money builds positions
3. Coil → Expansion — After consecutive coiled days, the first SUV ≥ 1.5 bar often signals direction
4. Pocket Pivots in bases — Early accumulation signals before price breaks out
5. Extreme SUV (≥3) after extended moves — May indicate climax/exhaustion rather than continuation
---
Settings Overview
| Group | Key Settings |
|-----------------|-----------------------------------------------------|
| SUV Settings | Lookback period (default 20) |
| Coil Detection | Enable/disable, sensitivity thresholds |
| Pocket Pivot | Enable/disable, lookback period |
| Display | Dashboard style (Ribbon/Table), position, text size |
| Dashboard Items | Toggle which metrics appear |
| Colors | Fully customizable gradient colors |
---
Credits
SUV concept adapted from academic literature on standardized unexpected volume in market microstructure research. Pocket Pivot methodology based on Gil Morales and Chris Kacher's work. Coil detection inspired by volatility contraction patterns.
---
This indicator does not provide financial advice. Always combine volume analysis with price action, market context, and proper risk management. No animals were harmed during the coding and testing of this indicator.

Liquidity Void Detector (Zeiierman)█ Overview
Liquidity Void Detector (Zeiierman) is an oscillator highlighting inefficient price displacements under low participation. It measures the most recent price move (standardized return) and amplifies it only when volume is below its own trend.
Positive readings ⇒ strong up-move on low volume → potential Buy-Side Imbalance (void below) that often refills.
Negative readings ⇒ strong down-move on low volume → potential Sell-Side Imbalance (void above) that often refills.
This tool provides a quantitative “void” proxy: when price travels far with unusually thin volume, the move is flagged as likely inefficient and prone to mean-reversion/mitigation.
█ How It Works
⚪ Volume Shock (Participation Filter)
Each bar, volume is compared to a rolling baseline. This is then z-scored.
// Volume Shock calculation
volTrend = ta.sma(volume, L)
vs = (volume > 0 and volTrend > 0) ? math.log(volume) - math.log(volTrend) : na
vsZ = zScore(vs, vzLen) // z-scored volume shock
lowVS = (vsZ <= vzThr) // low-volume condition
Bars with VolShock Z ≤ threshold are treated as low-volume (thin).
⚪ Prior Return Extremeness
The 1-bar log return is computed and z-scored.
// Prior return extremeness
r1 = math.log(close / close )
retZ = zScore(r1, rLen) // z-scored prior return
This shows whether the latest move is unusually large relative to recent history.
⚪ Void Oscillator
The oscillator is:
// Oscillator construction
weight = lowVS ? 1.0 : fadeNoLow
osc = retZ * weight
where Weight = 1 when volume is low, otherwise fades toward a user-set factor (0–1).
Osc > 0: up-move emphasized under low volume ⇒ Buy-Side Imbalance.
Osc < 0: down-move emphasized under low volume ⇒ Sell-Side Imbalance.
█ Why Use It
⚪ Targets Inefficient Moves
By filtering for low participation, the oscillator focuses on moves most likely driven by thin books/noise trading, which are statistically more likely to retrace.
⚪ Simple, Robust Logic
No need for tick data or order-book depth. It derives a practical void proxy from OHLCV, making it portable across assets and timeframes.
⚪ Complements Price-Action Tools
Use alongside FVG/imbalance zones, key levels, and volume profile to prioritize voids that carry the highest reversal probability.
█ How to Use
Sell-Side Imbalance = aggressive sell move (price goes down on low volume) → expect price to move up to fill it.
Buy-Side Imbalance = aggressive buy move (price goes up on low volume) → expect price to move down to fill it.
█ Settings
Volume Baseline Length — Bars for the volume trend used in VolShock. Larger = smoother baseline, fewer low-volume flags.
Vol Shock Z-Score Lookback — Bars to standardize VolShock; larger = smoother, fewer extremes.
Low-Volume Threshold (VolShock Z ≤) — Defines “thin participation.” Typical: −0.5 to −1.0.
Return Z-Score Lookback — Bars to standardize the 1-bar log return; larger = smoother “extremeness” measure.
Fade When Volume Not Low (0–1) — Weight applied when volume is not low. 0.00 = ignore non-low-volume bars entirely. 1.00 = treat volume condition as irrelevant (pure return extremeness).
Upper Threshold (Osc ≥) — Trigger for Sell-Side Imbalance (void below).
Lower Threshold (Osc ≤) — Trigger for Buy-Side Imbalance (void above).
-----------------
Disclaimer
The content provided in my scripts, indicators, ideas, algorithms, and systems is for educational and informational purposes only. It does not constitute financial advice, investment recommendations, or a solicitation to buy or sell any financial instruments. I will not accept liability for any loss or damage, including without limitation any loss of profit, which may arise directly or indirectly from the use of or reliance on such information.
All investments involve risk, and the past performance of a security, industry, sector, market, financial product, trading strategy, backtest, or individual's trading does not guarantee future results or returns. Investors are fully responsible for any investment decisions they make. Such decisions should be based solely on an evaluation of their financial circumstances, investment objectives, risk tolerance, and liquidity needs.

Intelligent Currency Breakout ChannelIndicator: Intelligent Currency Breakout Channel
This document provides a detailed explanation of the "Intelligent Currency Breakout Channel" indicator for TradingView.
1. Overview
The Intelligent Currency Breakout Channel is an advanced technical analysis tool designed to identify periods of price consolidation and signal potential breakouts. It automatically draws channels around ranging price action and utilizes sophisticated volume analysis to provide deeper insights into market sentiment. The indicator also includes a built-in logarithmic regression screener to help traders align their breakout signals with the broader market trend.
2. Key Features
Automatic Channel Detection: The indicator identifies periods of low volatility and automatically draws a containing channel (box) around the price action.
Breakout Signals: It generates clear visual alerts (▲ for bullish, ▼ for bearish) when the price closes decisively outside of a channel.
In-Depth Volume Analysis: Within each channel, the indicator plots volume as candlestick-like bars, offering three distinct modes: Total Volume, Buy/Sell Comparison, and Volume Delta. This helps traders gauge the strength and conviction behind price movements.
Real-time Sentiment Gauge: When a channel is active, a dynamic color-graded gauge appears on the right side of the chart. It visualizes the current volume delta momentum relative to its recent range, offering an at-a-glance sentiment reading.
Integrated Trend Screener: A secondary analysis tool based on logarithmic regression is included to determine the underlying trend direction (Up, Down, or Neutral), which can be used to filter breakout signals.
Fully Customizable: Users can extensively customize all parameters, from calculation lengths and breakout sensitivity to the visual appearance of every component.
3. How to Use
Channel Formation: Watch for the indicator to draw a new channel. This signifies that the market is in a consolidation or ranging phase. The formation of a channel itself can be an alertable event.
Volume Interpretation: Observe the volume bars inside the channel. An increase in volume as the price approaches the channel's upper or lower boundary can foreshadow a potential breakout. Use the Volume Display Mode to analyze if buying pressure (Comparison, Delta) or selling pressure is building.
Breakout Confirmation: A bullish breakout signal (▲) appears when the price closes above the channel's upper boundary. A bearish breakout signal (▼) appears when the price closes below the lower boundary. For higher-quality signals, enable the Strong Closes Only option.
Trend Confirmation (Screener): Use the screener's plot and background color to confirm the broader trend. For instance, you might choose to only take bullish breakout signals when the screener indicates an uptrend (green background) and bearish signals when it indicates a downtrend (red background).
Sentiment Gauge: The pointer on the gauge indicates current momentum. A pointer in the upper (green) section suggests bullish pressure, while a pointer in the lower (red) section suggests bearish pressure. This can provide additional confluence for a trade decision.
4. Settings and Inputs
Main Settings
Overlap Channels: If enabled, allows multiple channels to be drawn on the chart simultaneously, even if they overlap. When disabled, a new channel will only form if it doesn't intersect with an existing one.
Strong Closes Only: If enabled, a breakout is only triggered if the midpoint of the candle's body (average of open and close) is outside the channel. This helps filter out false signals caused by long wicks. If disabled, any close outside the channel triggers a breakout.
Normalization Length: The lookback period (in bars) used for price normalization. A higher value creates a more stable normalization but may be slower to react to recent price changes.
Box Detection Length: The lookback period used to detect the channel formation pattern. A lower value will result in more frequent channels but may be more sensitive to noise. A higher value will result in fewer, but potentially more significant, channels.
Volume Analysis
Show Volume Analysis: Toggles the visibility of the candlestick-like volume bars inside the channel.
Volume Display Mode:
Volume: Displays total volume as symmetrical bars around the channel's midline.
Comparison: Shows buying volume (green) above the midline and selling volume (red) below it.
Delta: Shows the net difference between buying and selling volume. Positive delta is shown above the midline, and negative delta is shown below.
Volume Delta Timeframe Source: The timeframe from which to source volume data for calculations. Using a lower timeframe can provide a more granular view of volume dynamics.
Volume Scaling: A multiplier that adjusts the vertical size of the volume bars relative to the channel's height.
Appearance
Volume Text Size: Sets the size of the volume data text displayed in the corners of the channel. Options: Tiny, Small, Medium, Large.
Bullish Color: The primary color for all bullish visual elements, including breakout signals and positive volume bars.
Bearish Color: The primary color for all bearish visual elements, including breakout signals and negative volume bars.
Screener Settings
Lookback Period: The number of bars used for the logarithmic regression calculation to determine the trend.
Screener Type:
Log Regression Channel: The signal is based on the slope of the entire regression channel over the lookback period. An upward sloping channel is bullish (1), and a downward sloping one is bearish (-1).
Logarithmic Regression: The signal is based on the most recent value of the regression line compared to its value 3 bars ago. This provides a more responsive measure of the immediate trend.
5. Alerts
You can set up the following alerts through the TradingView alerts panel:
New Channel Formed: Triggers when a new price consolidation channel is detected and drawn on the chart.
Bullish Breakout: Triggers when the price breaks out and closes above the upper boundary of a channel.
Bearish Breakout: Triggers when the price breaks out and closes below the lower boundary of a channel.
Is In Channel: Triggers on every bar that the price is currently trading inside an active channel.
Signal UP: Triggers when the Screener's signal turns bullish (1).
Signal DOWN: Triggers when the Screener's signal turns bearish (-1).

Z-Score Volume with CVD TrendZ-Score Volume & CVD Trend with Exhaustion Signals
This powerful, all-in-one indicator combines statistical volume analysis, Cumulative Volume Delta (CVD), and a custom clustering algorithm to provide a clear and dynamic view of market sentiment. It is designed to help traders identify the prevailing trend and spot potential reversals or trend exhaustion before they happen.
Important Note: This indicator is specifically designed and optimized for use during the Regular Trading Hours (RTH) New York session, which is typically characterized by high volume and volatility. Its signals may be less reliable in low-volume or overnight sessions.
Core Concepts
1. Volume Z-Score
The script first calculates a Z-score for volume, which measures how many standard deviations a bar's volume is from a moving average. This helps to identify statistically significant volume spikes that may signal institutional activity or a major shift in sentiment.
2. Cumulative Volume Delta (CVD)
CVD plots the net difference between buying and selling volume over time. A rising CVD indicates a surplus of buying pressure, while a falling CVD shows a surplus of selling pressure. This provides a clear look at the direction of momentum.
3. Custom Clustering
By combining the Volume Z-score and CVD delta, the script classifies each bar into one of six distinct "clusters." The purpose is to simplify complex data into actionable signals.
High Conviction Bullish: High Z-score volume with strong CVD buying.
High Conviction Bearish: High Z-score volume with strong CVD selling.
Effort vs. Result: High Z-score volume with no clear CVD bias, indicating indecision or a struggle between buyers and sellers.
Quiet Accumulation: Low volume with subtle CVD buying, suggesting passive accumulation.
Quiet Distribution: Low volume with subtle CVD selling, suggesting passive distribution.
Low Conviction/Noise: Low volume and low CVD, representing general market noise.
Trend and Exhaustion Logic
Trend Establishment: The indicator determines the overall trend (Bullish, Bearish, or Neutral) by analyzing the majority of recent clusters over a configurable lookback period.
A Bullish Trend is confirmed when a majority of recent bars are either "High Conviction Bullish" or "Quiet Accumulation."
A Bearish Trend is confirmed when a majority of recent bars are either "High Conviction Bearish" or "Quiet Distribution."
Trend Exhaustion: This is a key feature for identifying potential reversals. The script looks for a divergence between price action and CVD within a confirmed trend.
Bullish Exhaustion Signal: Occurs during a confirmed "Bullish Trend" when you see a bearish divergence (price makes a higher high, but CVD shows negative delta and a close lower than the open). This is a strong sign the uptrend may be running out of steam.
Bearish Exhaustion Signal: Occurs during a confirmed "Bearish Trend" when you see a bullish divergence (price makes a lower low, but CVD shows positive delta and a close higher than the open). This indicates the downtrend may be exhausted.
How to Interpret the Visuals
Volume Bars: Colored to match the cluster they belong to.
Background Color: Shows the overall trend (light green for bullish, light red for bearish).
Circle Markers (bottom): Green circles indicate a bullish trend, and red circles indicate a bearish trend.
Triangles and Circles (top): Represent the specific cluster of each bar.
Trend Exhaustion Markers: Triangles above/below the bar signal potential trend exhaustion.
Info Table: An optional table provides a real-time summary of all key metrics for the current bar.
Settings
Volume EMA Length: Adjusts the moving average used for the Volume Z-score calculation.
Z-Score Look Back: Defines the number of bars to use for the volume and CVD percentile calculation.
Lower/Upper Cluster Percentile: Use these to adjust the sensitivity of the clustering. Tighter ranges (e.g., 25/75) capture more data, while wider ranges (e.g., 10/90) will only signal truly extreme events.
Trend Lookback Bars: Controls how many recent bars are considered when determining the trend.
This script offers a comprehensive and easy-to-read way to integrate volume, momentum, and trend analysis into your trading.
Happy Trading!

Volumatic Fair Value Gaps [BigBeluga]🔵 OVERVIEW
The Volumatic Fair Value Gaps indicator detects and plots size-filtered Fair Value Gaps (FVGs) and immediately analyzes the bullish vs. bearish volume composition inside each gap. When an FVG forms, the tool samples volume from a 10× lower timeframe , splits it into Buy and Sell components, and overlays two compact bars whose percentages always sum to 100%. Each gap also shows its total traded volume . A live dashboard (top-right) summarizes how many bullish and bearish FVGs are currently active and their cumulative volumes—offering a quick read on directional participation and trend pressure.
🔵 CONCEPTS
FVGs (Fair Value Gaps) : Imbalance zones between three consecutive candles where price “skips” trading. The script plots bullish and bearish gaps and extends them until mitigated.
Size Filtering : Only significant gaps (by relative size percentile) are drawn, reducing noise and emphasizing meaningful imbalances.
// Gap Filters
float diff = close > open ? (low - high ) / low * 100 : (low - high) / high *100
float sizeFVG = diff / ta.percentile_nearest_rank(diff, 1000, 100) * 100
bool filterFVG = sizeFVG > 15
Volume Decomposition : For each FVG, the indicator inspects a 10× lower timeframe and aggregates volume of bullish vs. bearish candles inside the gap’s span.
100% Split Bars : Two inline bars per FVG display the % Bull and % Bear shares; their total is always 100%.
Total Gap Volume : A numeric label at the right edge of the FVG shows the total traded volume associated with that gap.
Mitigation Logic : Gaps are removed when price closes through (or touches via high/low—user-selectable) the opposite boundary.
Dashboard Summary : Counts and sums the active bullish/bearish FVGs and their total volumes to gauge directional dominance.
🔵 FEATURES
Bullish & Bearish FVG plotting with independent color controls and visibility toggles.
Adaptive size filter (percentile-based) to keep only impactful gaps.
Lower-TF volume sampling at 10× faster resolution for more granular Buy/Sell breakdown.
Per-FVG volume bars : two horizontal bars showing Bull % and Bear % (sum = 100%).
Per-FVG total volume label displayed at the right end of the gap’s body.
Mitigation source option : choose close or high/low for removing/invalidating gaps.
Overlap control : older overlapped gaps are cleaned to avoid clutter.
Auto-extension : active gaps extend right until mitigated.
Dashboard : shows count of bullish/bearish gaps on chart and cumulative volume totals for each side.
Performance safeguards : caps the number of active FVG boxes to maintain responsiveness.
🔵 HOW TO USE
Turn on/off FVG types : Enable Bullish FVG and/or Bearish FVG depending on your focus.
Tune the filter : The script already filters by relative size; if you need fewer (stronger) signals, increase the percentile threshold in code or reduce the number of displayed boxes.
Choose mitigation source :
close — stricter; gap is removed when a closing price crosses the boundary.
high/low — more sensitive; a wick through the boundary mitigates the gap.
Read the per-FVG bars :
A higher Bull % inside a bullish gap suggests constructive demand backing the imbalance.
A higher Bear % inside a bearish gap suggests supply is enforcing the imbalance.
Use total gap volume : Larger totals imply more meaningful interest at that imbalance; confluence with structure/HTF levels increases relevance.
Watch the dashboard : If bullish counts and cumulative volume exceed bearish, market pressure is likely skewed upward (and vice versa). Combine with trend tools or market structure for entries/exits.
Optional: hide volume bars : Disable Volume Bars when you want a cleaner FVG map while keeping total volume labels and the dashboard.
🔵 CONCLUSION
Volumatic Fair Value Gaps blends precise FVG detection with lower-timeframe volume analytics to show not only where imbalances exist but also who powers them. The per-gap Bull/Bear % bars, total volume labels, and the cumulative dashboard together provide a fast, high-signal read on directional participation. Use the tool to prioritize higher-quality gaps, align with trend bias, and time mitigations or continuations with greater confidence.

simple swing indicator-KTRNSE:NIFTY
1. Pivot High/Low as Lines:
Purpose: Identifies local peaks (pivot highs) and troughs (pivot lows) in price and draws horizontal lines at these levels.
How it Works:
A pivot high occurs when the price is higher than the surrounding bars (based on the pivotLength parameter).
A pivot low occurs when the price is lower than the surrounding bars.
These pivots are drawn as horizontal lines at the price level of the pivot.
Visualization:
Pivot High: A red horizontal line is drawn at the price level of the pivot high.
Pivot Low: A green horizontal line is drawn at the price level of the pivot low.
Example:
Imagine the price is trending up, and at some point, it forms a peak. The script identifies this peak as a pivot high and draws a red line at the price of that peak. Similarly, if the price forms a trough, the script will draw a green line at the low point.
2. Moving Averages (20-day and 50-day):
Purpose: Plots the 20-day and 50-day simple moving averages (SMA) on the chart.
How it Works:
The 20-day SMA smooths the closing price over the last 20 days.
The 50-day SMA smooths the closing price over the last 50 days.
These lines provide an overview of short-term and long-term price trends.
Visualization:
20-day SMA: A blue line showing the 20-day moving average.
50-day SMA: An orange line showing the 50-day moving average.
Example:
When the price is above both moving averages, it indicates an uptrend. If the price crosses below these averages, it might signal a downtrend.
3. Supertrend:
Purpose: The Supertrend is an indicator based on the Average True Range (ATR) and is used to track the market trend.
How it Works:
When the market is in an uptrend, the Supertrend line will be green.
When the market is in a downtrend, the Supertrend line will be red.
Visualization:
Uptrend: The Supertrend line will be plotted in green.
Downtrend: The Supertrend line will be plotted in red.
Example:
If the price is above the Supertrend, the market is considered to be in an uptrend, and if the price is below the Supertrend, the market is in a downtrend.
4. Momentum (Rate of Change):
Purpose: Measures the rate at which the price changes over a set period, showing if the momentum is positive or negative.
How it Works:
The Rate of Change (ROC) measures how much the price has changed over a certain number of periods (e.g., 14).
Positive ROC indicates upward momentum, and negative ROC indicates downward momentum.
Visualization:
Positive ROC: A purple line is plotted above the zero line.
Negative ROC: A purple line is plotted below the zero line.
Example:
If the ROC line is above zero, it means the price is increasing, suggesting bullish momentum. If the ROC is below zero, it indicates bearish momentum.
5. Volume:
Purpose: Displays the volume of traded assets, giving insight into the strength of price movements.
How it Works:
The script will color the volume bars based on whether the price closed higher or lower than the previous bar.
Green bars indicate bullish volume (closing price higher than the previous bar), and red bars indicate bearish volume (closing price lower than the previous bar).
Visualization:
Bullish Volume: Green volume bars when the price closes higher.
Bearish Volume: Red volume bars when the price closes lower.
Example:
If you see a green volume bar, it suggests that the market is participating in an uptrend, and the price has closed higher than the previous period. Red bars indicate a downtrend or selling pressure.
6. MACD (Moving Average Convergence Divergence):
Purpose: The MACD is a trend-following momentum indicator that shows the relationship between two moving averages of the price.
How it Works:
The MACD Line is the difference between the 12-period EMA (Exponential Moving Average) and the 26-period EMA.
The Signal Line is the 9-period EMA of the MACD Line.
The MACD Histogram shows the difference between the MACD line and the Signal line.
Visualization:
MACD Line: A blue line representing the difference between the 12-period and 26-period EMAs.
Signal Line: An orange line representing the 9-period EMA of the MACD line.
MACD Histogram: A red or green histogram that shows the difference between the MACD line and the Signal line.
Example:
When the MACD line crosses above the Signal line, it’s considered a bullish signal. When the MACD line crosses below the Signal line, it’s considered a bearish signal.
Full Chart Example:
Imagine you're looking at a price chart with all the indicators:
Pivot High/Low Lines are drawn as red and green horizontal lines.
20-day and 50-day SMAs are plotted as blue and orange lines, respectively.
Supertrend shows a green or red line indicating the trend.
Momentum (ROC) is shown as a purple line oscillating around zero.
Volume bars are green or red based on whether the close is higher or lower.
MACD appears as a blue line and orange line, with a red or green histogram showing the MACD vs. Signal line difference.
How the Indicators Work Together:
Trend Confirmation: If the price is above the Supertrend line and both SMAs are trending up, it indicates a strong bullish trend.
Momentum: If the ROC is positive and the MACD line is above the Signal line, it further confirms bullish momentum.
Volume: Increasing volume, especially with green bars, suggests that the trend is being supported by active participation.
By using these combined indicators, you can get a comprehensive view of the market's trend, momentum, and potential reversal points (via pivot highs and lows).

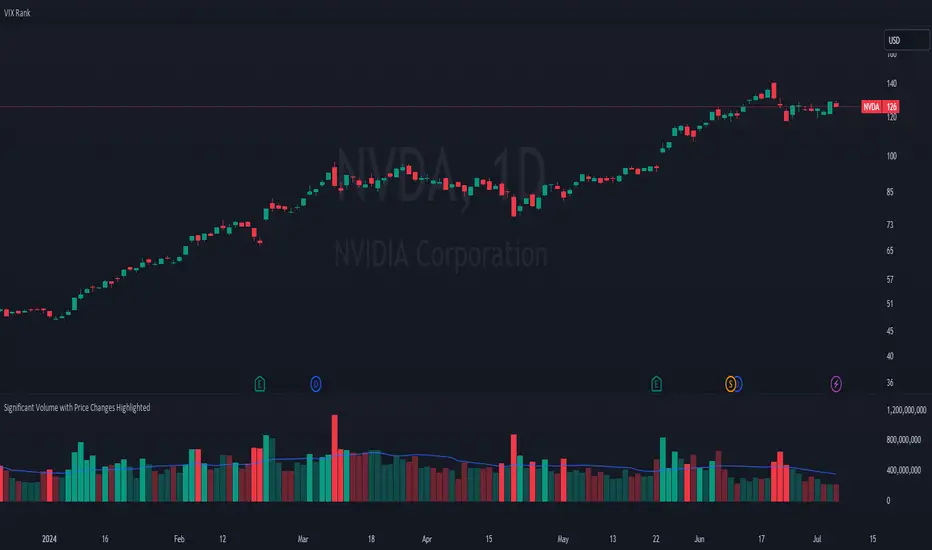
Significant Volume with Price Changes HighlightedSignificant Volume with Price Changes Highlighted
The "Significant Volume with Price Changes Highlighted" indicator by PappyTrading is a powerful tool designed to help traders identify significant volume spikes and price changes in the market. This indicator overlays the volume bars on the price chart and highlights them based on specific volume and price change conditions, providing a clear visual representation of market activity.
What It Does
This indicator calculates the moving average of the volume over a specified period and compares the current volume to this average. It also calculates the daily percentage change relative to the previous day's close and compares this to its moving average. The volume bars are then color-coded based on the following conditions:
Bright Green (#089981): Indicates a significant volume spike with an above-average price increase.
Bright Red (#f23645): Indicates a significant volume spike with an above-average price decrease.
Green with 60% transparency: Indicates a normal up day with a price increase but not a significant volume spike.
Red with 60% transparency: Indicates a normal down day with a price decrease but not a significant volume spike.
Additionally, the indicator plots a 20-period simple moving average (SMA) of the volume, providing a reference point to understand the general volume trend.
How It Works
Volume Calculation:
The indicator calculates the 20-period SMA of the volume and compares the current volume to this average to determine if there is a significant volume spike.
Price Change Calculation:
The indicator calculates the daily percentage change in price relative to the previous day's close and compares this to the 20-period SMA of the percentage change to identify significant price movements.
Color Coding:
The volume bars are color-coded based on the combination of the volume and price change conditions. This visual representation allows traders to quickly identify significant market activities.
How to Use It
Overlay on Chart:
Add the "Significant Volume with Price Changes Highlighted" indicator to your chart. The volume bars will be displayed at the bottom of the chart, color-coded based on the conditions described above.
Identify Market Activity:
Use the color-coded volume bars to identify significant market activities. Bright green bars indicate strong buying pressure, while bright red bars indicate strong selling pressure. Transparent green and red bars indicate normal market activity without significant volume spikes.
Volume Moving Average:
The blue line represents the 20-period SMA of the volume. Use this as a reference to understand the general volume trend and identify deviations from the average.
Concepts Underlying the Calculations
Volume Spikes: Significant volume spikes often precede or accompany major market moves. By highlighting these spikes, traders can gain insights into potential market turning points or continuation patterns.
Price Changes: Large price changes relative to the previous day's close indicate strong market momentum. By comparing these changes to their moving average, the indicator helps traders identify unusually strong buying or selling pressure.
This indicator is ideal for traders who want to gain a deeper understanding of market dynamics by analyzing volume and price changes together. It is suitable for various trading styles, including trend following, swing trading, and scalping.
Signs of the Times [LucF]█ OVERVIEW
This oscillator calculates the directional strength of bars using a primitive weighing mechanism based on a small number of what I consider to be fundamental properties of a bar. It does not consider the amplitude of price movements, so can be used as a complement to momentum-based oscillators. It thus belongs to the same family of indicators as my Bar Balance , Volume Ticks , Efficient work , Volume Buoyancy or my Delta Volume indicators.
█ CONCEPTS
The calculations underlying Signs of the Times (SOTT) use a simple, oft-explored concept: measure bar attributes, assign a weight to them, and aggregate results to provide an evaluation of a bar's directional strength. Bull and bear weights are added independently, then subtracted and divided by the maximum possible weight, so the final calculation looks like this:
(up - dn) / weightRange
SOTT has a zero centerline and oscillates between +1 and -1. Ten elementary properties are evaluated. Most carry a weight of one, a few are doubly weighted. All properties are evaluated using only the current bar's values or by comparing its values to those of the preceding bar. The bull conditions follow; their inverse applies to bear conditions:
Weight of 1
• Bar's close is greater than the bar's open (bar is considered to be of "up" polarity)
• Rising open
• Rising high
• Rising low
• Rising close
• Bar is up and its body size is greater than that of the previous bar
• Bar is up and its body size is greater than the combined size of wicks
Weight of 2
• Gap to the upside
• Efficient Work when it is positive
• Bar is up and volume is greater than that of the previous bar (this only kicks in if volume is actually available on the chart's data feed)
Except for the Efficient Work weight, which is a +1 to -1 float value multiplied by 2, all weights are discrete; either zero or the full weight of 1 or 2 is generated. This will cause any gap, for example, to generate a weight of +2 or -2, regardless of the gap's size. That is the reason why the oscillator is oblivious to the amplitude of price movements.
You can see the code used to calculate SOTT in my ta library 's `sott()` function.
█ HOW TO USE THE INDICATOR
No videos explain this indicator and none are planned; reading this description or the script's code is the only way to understand what Signs of the Times does.
Load the indicator on an active chart (see here if you don't know how).
The default configuration displays:
• An Arnaud-Legoux moving average of length 20 of the instant SOTT value. This is the signal line.
• A fill between the MA and the centerline.
• Levels at arbitrary values of +0.3 and -0.3.
• A channel between the signal line and its MA (a simple MA of length 20), which can be one of four colors:
• Bull (green): The signal line is above its MA.
• Strong bull (lime): The bull condition is fulfilled and the signal line is above the centerline.
• Bear (red): The signal line is below its MA.
• Strong bear (pink): The bear condition is fulfilled and the signal line is below the centerline.
The script's "Inputs" tab allows you to:
• Choose a higher timeframe to calculate the indicator's values. This can be useful to get a wider perspective of the indicator's values.
If you elect to use a higher timeframe, make sure that your chart's timeframe is always lower than the higher timeframe you specified,
as calculating on a timeframe lower than the chart's does not make much sense because the indicator is then displaying only the value of the last intrabar in the chart bar.
• Specify the type of MA used to produce the signal line. Use a length of 1 or the Data Window to see the instant value of SOTT. It is quite noisy, thus the need to average it.
• Specify the type of MA applied to the signal line. The idea here is to provide context to the signal.
• Control the display and colors of the lines and fills.
The first pane of this publication's chart shows the default setup. The second one shows only a monochrome signal line.
Using the "Style" tab of the indicator's settings, you can change the type and width of the lines, and the level values.
█ INTERPRETATION
Remember that Signs of the Times evaluates directional bar strength — not price movement. Its highs and lows do not reflect price, but the strength of chart bars. The fact that SOTT knows nothing of how far price moves or of trends is easy to forget. As such, I think SOTT is best used as a confirmation tool. Chart movements may appear to be easy to read when looking at historical bars, but when you have to make go-no-go decisions on the last bar, the landscape often becomes murkier. By providing a quantitative evaluation of the strength of the last few bars, which is not always easily discernible by simply looking at them, SOTT aims to help you decide if the short-term past favors the bets you are considering. Can SOTT predict the future? Of course not.
While SOTT uses completely different calculations than classical momentum oscillators, its profile shares many of their characteristics. This could lead one to infer that directional bar strength correlates with price movement, which could in turn lead one to conclude that indicators such as this one are useless, or that they can be useful tools to confirm momentum oscillators or other models of price movement. The call is, of course, up to you. You can try, for example, to compare a Wilder MA of SOTT to an RSI of the same length.
One key difference with momentum oscillators is that SOTT is much less sensitive to large price movements. The default Arnaud-Legoux MA used for the signal line makes it quite active; you can use a more quiet SMA or EMA if you prefer to tone it down.
In systems where it can be useful to only enter or exit on short-term strength, an average of SOTT values over the last 3 to 5 bars can be used as a more quiet filter than a momentum oscillator would.
█ NOTES
My publications often go through a long gestation period where I use them on my charts or in systems before deciding if they are worth a publication. With an incubation period of more than three years, Signs of the Times holds the record. The properties SOTT currently evaluates result from the systematic elimination of contaminants over that lengthy period of time. It was long because of my usual, slow gear, but also because I had to try countless combinations of conditions before realizing that, contrary to my intuition, best results were achieved by:
• Keeping the number of evaluated properties to the absolute minimum.
• Limiting the evaluation's scope to the current and preceding bar.
• Choosing properties that, in my view, were unmistakably indicative of bullish/bearish conditions.
Repainting
As most oscillators, the indicator provides live realtime values that will recalculate with chart updates. It will thus repaint in real time, but not on historical values. To learn more about repainting, see the Pine Script™ User Manual's page on the subject .

Volume Play This is going to be my first published indicator on Trading View. Thanks for TradingView for providing us this great platform And thanks for all of those who helps me to built this indicator and share there ideas.I cannot mention everyone name here believe me that list going to be huge.Everyone’s idea and help is much appreciated.This is how our TradingView community is growing day by day with kindness and knowledge. Every time I take so much from community in form knowledge that every time somewhere I feel that I also need to do something for community and finally day arrived .A gift from my side to community.A gift of indicator-VOLUME PLAY
This volume based indicator has High Relative Volume bar Background, Low Relative Volume bar background ,Volume Labels of Buying volume, Selling volume and Total volume count with percentage, Highest Volume in Percentage and Highest 5x volume count and 10x volume count of bar.Plus I have did column scaling to take Down pan input so you can switch pane or add in existing pane without any major problem And all this works on any time frame. Isn’t it good idea?
This indicator displays the volume of each session in a similar manner of the default volume indicator.However it add on the last bar Green and Red bar colours. Green means buying is more than selling and Red means selling is more than buying.On top of Some bar If number appears That means that’s volume is highest multiple volume of 5 and if number appears with label means highest multiple volume of 10.So simple without label volume counts means 5x and with label means 10x.
Now some of bars has background colour of Mint green , Pastel red and White.That’s highlight high relative volume bars with a highly buying activity range in Green and high relative volume bars with a highly selling activity range in Red And white background is low relative volume for that timeframe bar.
I am kind of person who don’t keep show indicator value enable all time.So it’s come in mind why not plot this values without enabling it.So I decided to show this values of buying, selling and total volumes on top near middle pane.Interesting thing is that I made a label with the help of pine script Table feature.Thanks a lot to Pine Team to add this new great feature! It’s great alternative for labels feature.Because of this feature I am able to locate buying, selling and total volume at right place where in most of scenario it will adjust.
Please note that all values are estimate.It’s not accurate.I show volumes in K,M form.Plus with volume I also try to show Buying And Selling volume in percentage form to get rough idea about what’s going on in instrument.Idea is to get better view of volume by splitting it into Buying , Selling and Total volume.This allows you to see are the bulls or bears in-control in relation to the overall Volume.
By default this indicator overlay is false but you can move this indicator pane to existing upper or lower pane.It will help to save space as well.If combine with two indicator at same pane then it will create two value scale at right side.So you will not loose any indicators values.By default I used 50% of vertical space in indicator scale factor.
I tried to make this indicator as accurate as inbuilt volume indicator with added extra feature.The main aim of indicator to get Idea of volume role in that symbol with that specific timeframe.Result might not be accurate but I expect somewhat nearby to accurate.
Kept source code open purposely for learners of pine script. Please avoid misuse or selling of this indicator.Remember Sharing Is Caring. If someone has suggestions or any addition then please comment below.Wishing you all abundance of health, wealth, and prosperity.
After all its all about VOLUME PLAY.
Disclaimer:-This indicator is not meant for buy or sell signals.This post and the script don’t provide any financial advice. This indicator/code IS NOT intended to be a formal investment advice or recommendation by the author, nor should be construed as such. Users will be fully responsible by their use regarding their own trading vehicles/assets.

Float Rotation TrackerFloat Rotation Tracker - Quick Reference Guide
What is Float Rotation?
Float Rotation = Cumulative Daily Volume ÷ Float
Example:
Float = 5,000,000 shares
Day Volume = 7,500,000 shares
Rotation = 7.5M ÷ 5M = 1.5x (150%)
When rotation hits 1x (100%), every available share has theoretically changed hands at least once during the trading day.
Why It Matters
RotationMeaningImplication0.5x50% of float tradedInterest building1.0x 🔥Full rotationExtreme interest confirmed2.0x 🔥🔥Double rotationVery high volatility3.0x 🔥🔥🔥Triple rotationRare - maximum volatility
Key insight: High rotation on a low-float stock = explosive potential
Float Classification
Float SizeClassificationRotation Impact≤ 2M🔥 MICROExtremely volatile, fast rotation≤ 5M🔥 VERY LOWExcellent momentum potential≤ 10MLOWGood for rotation plays> 10MNORMALNeeds massive volume to rotate
Rule of thumb: Focus on stocks with float under 10M for meaningful rotation signals.
Reading the Indicator
Rotation Line (Yellow)
Shows current rotation level
Rises throughout the day as volume accumulates
Crosses horizontal level lines at milestones
Level Lines
LineColorMeaning0.5Gray dotted50% rotation1.0Orange solidFull rotation2.0Red solidDouble rotation3.0Fuchsia solidTriple rotation
Volume Bars (Bottom)
ColorMeaningGrayBelow average volumeBlueNormal volume (1-2x avg)GreenHigh volume (2-5x avg)LimeExtreme volume (5x+ avg)
Milestone Markers
Circles appear when rotation crosses key levels
Labels show "50%", "1x", "2x", "3x🔥"
Background Color
Changes as rotation increases
Darker = higher rotation level
Info Table Explained
FieldDescriptionFloatShare count + classification (MICRO/LOW/NORMAL)SourceAuto ✓ = TradingView data / Manual = user enteredRotationCurrent rotation with emoji indicatorRotation %Same as rotation × 100Day VolumeCumulative volume todayTo XxVolume needed to reach next milestoneBar RVolCurrent bar's relative volumeMilestonesWhich levels have been hit todayPer RotationShares equal to one full rotationEst. TimeBars until next milestone (at current pace)
Trading with Float Rotation
Entry Signals
Early Entry (Higher Risk, Higher Reward)
Rotation approaching 0.5x
Strong price action (bull flag, breakout)
Rising relative volume bars
Confirmation Entry (Lower Risk)
Rotation at or above 1x
Price holding above VWAP
Continuous green/lime volume bars
Late Entry (Highest Risk)
Rotation above 2x
Only enter on clear pullback pattern
Tight stop required
Exit Signals
Warning Signs:
Rotation very high (2x+) with declining volume bars
Reversal candle after milestone
Price breaking below key support
Volume bars turning gray/blue after being green/lime
Take Profits:
Partial profit at each rotation milestone
Trail stop as rotation increases
Full exit on reversal pattern after 2x+ rotation
Best Setups
Ideal Float Rotation Play
✓ Float under 10M (preferably under 5M)
✓ Stock up 5%+ on the day
✓ News catalyst driving interest
✓ Rotation approaching or exceeding 1x
✓ Price above VWAP
✓ Volume bars green or lime
✓ Clear chart pattern (bull flag, flat top)
Red Flags to Avoid
✗ Float over 50M (hard to rotate meaningfully)
✗ Rotation high but price declining
✗ Volume bars turning gray after spike
✗ No clear catalyst
✗ Price below VWAP with high rotation
✗ Late in day (3pm+) after 2x rotation
Float Data Sources
If auto-detect doesn't work, get float from:
SourceHow to FindFinvizfinviz.com → ticker → "Shs Float"Yahoo FinanceFinance.yahoo.com → Statistics → "Float"MarketWatchMarketwatch.com → ticker → ProfileYour BrokerUsually in stock details/fundamentals
Note: Float can change due to offerings, buybacks, lockup expirations. Check recent data.
Settings Guide
Conservative Settings
Alert Level 1: 0.75 (75%)
Alert Level 2: 1.0 (100%)
Alert Level 3: 2.0 (200%)
Alert Level 4: 3.0 (300%)
High Vol Multiplier: 2.0
Extreme Vol Multiplier: 5.0
Aggressive Settings
Alert Level 1: 0.3 (30%)
Alert Level 2: 0.5 (50%)
Alert Level 3: 1.0 (100%)
Alert Level 4: 2.0 (200%)
High Vol Multiplier: 1.5
Extreme Vol Multiplier: 3.0
Alert Setup
Recommended Alerts
100% Rotation (1x) - Primary signal
Most important milestone
Confirms extreme interest
High Rotation + Extreme Volume
Combined condition
Very high probability signal
How to Set
Right-click chart → Add Alert
Condition: Float Rotation Tracker
Select desired milestone
Set notification (popup/email/phone)
Set expiration
Common Questions
Q: Why is my float showing "Manual (no data)"?
A: TradingView doesn't have float data for this stock. Enter the float manually in settings after looking it up on Finviz or Yahoo Finance.
Q: The rotation seems too high/low - is the float wrong?
A: Possibly. Cross-check float on Finviz. Recent offerings or share structure changes may not be reflected in TradingView's data.
Q: What if float rotates early in the day?
A: Early 1x rotation (within first hour) is very bullish - indicates massive interest. Watch for continuation patterns.
Q: High rotation but price is dropping?
A: This is distribution - large holders are selling into demand. High rotation doesn't guarantee price direction, just volatility.
Q: Can I use this for swing trading?
A: The indicator resets daily, so it's designed for intraday use. You could note multi-day rotation patterns manually.
Quick Decision Matrix
RotationPrice ActionVolumeDecision<0.5xStrong upHighWatch, early stage0.5-1xConsolidatingSteadyPrepare entry1x+Breaking outIncreasingEntry on pattern1x+DroppingHighAvoid - distribution2x+Strong upExtremePartial profit, trail stop2x+Reversal candleDecliningExit or avoid
Workflow Integration
MORNING ROUTINE:
1. Scan for gappers (5%+, high volume)
2. Check float on each candidate
3. Apply Float Rotation Tracker
4. Prioritize lowest float with building rotation
DURING SESSION:
5. Watch rotation levels on active trades
6. Enter on patterns when rotation confirms (0.5-1x)
7. Scale out as rotation increases
8. Exit or trail after 2x rotation
END OF DAY:
9. Note which stocks hit 2x+ rotation
10. Review rotation vs price action
11. Learn patterns for future trades
Combining with Other Indicators
IndicatorHow to Use Together5 PillarsScreen for low-float stocks firstGap & GoCheck rotation on gappersBull FlagEnter bull flags with 1x+ rotationVWAPOnly trade rotation plays above VWAPRSIWatch for divergence at high rotation
Key Takeaways
Float size matters - Lower float = faster rotation = more volatility
1x is the key level - Full rotation confirms extreme interest
Volume quality matters - Green/lime bars better than gray
Combine with price action - Rotation confirms, patterns trigger
Know when you're late - 2x+ rotation is late stage
Check your float data - Wrong float = wrong rotation calculation
Happy Trading! 🔥

Volumetric Support and Resistance [BackQuant]Volumetric Support and Resistance
What this is
This Overlay locates price levels where both structure and participation have been meaningful. It combines classical swing points with a volume filter, then manages those levels on the chart as price evolves. Each level carries:
• A reference price (support or resistance)
• An estimate of the volume that traded around that price
• A touch counter that updates when price retests it
• A visual box whose thickness is scaled by volatility
The result is a concise map of candidate support and resistance that is informed by both price location and how much trading occurred there.
How levels are built
Find structural pivots uses ta.pivothigh and ta.pivotlow with a user set sensitivity. Larger sensitivity looks for broader swings. Smaller sensitivity captures tighter turns.
Require meaningful volume computes an average volume over a lookback period and forms a volume ratio for the current bar. A pivot only becomes a level when the ratio is at least the volume significance multiplier.
Avoid clustering checks a minimum level distance (as a percent of price). If a candidate is too close to an existing level, it is skipped to keep the map readable.
Attach a volume strength to the level estimates volume strength by averaging the volume of recent bars whose high to low range spans that price. Levels with unusually high strength are flagged as high volume.
Store and draw levels are kept in an array with fields for price, type, volume, touches, creation bar, and a box handle. On the last bar, each level is drawn as a horizontal box centered at the price with a vertical thickness scaled by ATR. Borders are thicker when the level is marked high volume. Boxes can extend into the future.
How levels evolve over time
• Aging and pruning : levels are removed if they are too old relative to the lookback or if you exceed the maximum active levels.
• Break detection : a level can be removed when price closes through it by more than a break threshold set as a fraction of ATR. Toggle with Remove Broken Levels.
• Touches : when price approaches within the break threshold, the level’s touch counter increments.
Visual encoding
• Boxes : support boxes are green, resistance boxes are red. Box height uses an ATR based thickness so tolerance scales with volatility. Transparency is fixed in this version. Borders are thicker on high volume levels.
• Volume annotation : show the estimated volume inside the box or as a label at the right. If a level has more than one touch, a suffix like “(2x)” is appended.
• Extension : boxes can extend a fixed number of bars into the future and can be set to extend right.
• High volume bar tint : bars with volume above average × multiplier are tinted green if up and red if down.
Inputs at a glance
Core Settings
• Level Detection Sensitivity — pivot window for swing detection
• Volume Significance Multiplier — minimum volume ratio to accept a pivot
• Lookback Period — window for average volume and maintenance rules
Level Management
• Maximum Active Levels — cap on concurrently drawn levels
• Minimum Level Distance (%) — required spacing between level prices
Visual Settings
• Remove Broken Levels — drop a level once price closes decisively through it
• Show Volume Information on Levels — annotate volume and touches
• Extend Levels to Right — carry boxes forward
Enhanced Visual Settings
• Show Volume Text Inside Box — text placement option
• Volume Based Transparency and Volume Based Border Thickness — helper logic provided; current draw block fixes transparency and increases border width on high volume levels
Colors
• Separate colors for support, resistance, and their high volume variants
How it can be used
• Trade planning : use the most recent support and resistance as reference zones for entries, profit taking, or stop placement. ATR scaled thickness provides a practical buffer.
• Context for patterns : combine with breakouts, pullbacks, or candle patterns. A breakout through a high volume resistance carries more informational weight than one through a thin level.
• Prioritization : when multiple levels are nearby, prefer high volume or higher touch counts.
• Regime adaptation : widen sensitivity and increase minimum distance in fast regimes to avoid clutter. Tighten them in calm regimes to capture more granularity.
Why volume support and resistance is used in trading
Support and resistance relate to willingness to transact at certain prices. Volume measures participation. When many contracts change hands near a price:
• More market players hold inventory there, often creating responsive behavior on retests
• Order flow can concentrate again to defend or to exit
• Breaks can be cleaner as trapped inventory rebalances
Conditioning level detection on above average activity focuses attention on prices that mattered to more participants.
Alerts
• New Support Level Created
• New Resistance Level Created
• Level Touch Alert
• Level Break Alert
Strengths
• Dual filter of structure and participation, reducing trivial swing points
• Self cleaning map that retires old or invalid levels
• Volatility aware presentation using ATR based thickness
• Touch counting for persistence assessment
• Tunable inputs for instrument and timeframe
Limitations and caveats
• Volume strength is an approximation based on bars spanning the price, not true per price volume
• Pivots confirm after the sensitivity window completes, so new levels appear with a delay
• Narrow ranges can still cluster levels unless minimum distance is increased
• Large gaps may jump past levels and immediately trigger break conditions
Practical tuning guide
• If the chart is crowded: increase sensitivity, increase minimum level distance, or reduce maximum active levels
• If useful levels are missed: reduce volume multiplier or sensitivity
• If you want stricter break removal: increase the ATR based break threshold in code
• For instruments with session patterns: tailor the lookback period to a representative window
Interpreting touches and breaks
• First touch after creation is a validation test
• Multiple shallow touches suggest absorption; a later break may then travel farther
• Breaks on high current volume merit extra attention
Multi timeframe usage
Levels are computed on the active chart timeframe. A common workflow is to keep a higher timeframe instance for structure and a lower timeframe instance for execution. Align trades with higher timeframe levels where possible.
Final Thoughts
This indicator builds a lightweight, self updating map of support and resistance grounded in swings and participation. It is not a full market profile, but it captures much of the practical benefit with modest complexity. Treat levels as context and decision zones, not guarantees. Combine with your entry logic and risk controls.

Up/Down Volume Delta %this script is based on FractalTrade_'s rendition of the up/down volume bars.
the shortcomings of that chart were that large volume bars caused the auto-scaling to shrink smaller volume bar displays to the point where much of the data was too small to see.
in this chart, the bars are displaying the percent delta out of the total bar volume. this way, large overall volume bars do not cause visual compression to everything else in the chart.
I've used color modulation to indicate relation to a relative volume point, so users can still tell when overall volume is large or small. when volume is under a moving average, the bars will display at a basis transparency. when the volume is over the average, the brightness will increase up to a specific ratio of volume defined by the user.
for example, if basis transparency is at 20, and the full opacity ratio is at 3, and the volume average is at 1M, a volume of 750k will display the delta bar at the basis transparency. a volume of 3M will achieve full brightness. a volume of 2M will display with moderate brightness (about 60%), but still stand out against other bars with basis transparency.
areas of the chart that are either increasing bar sizes or increasing in brightness can indicate directional force. when volume delta direction contradicts the candle direction, this can indicate support / resistance.

Relative Measured Volatility (RMV)RMV • Volume-Sensitive Consolidation Indicator
A lightweight Pine Script that highlights true low-volatility, low-volume bars in a single squeeze measure.
What it does
Calculates each bar’s raw High-Low range.
Down-weights bars where volume is below its 30-day average, emphasizing genuine quiet periods.
Normalizes the result over the prior 15 bars (excluding the current bar), scaling from 0 (tightest) to 100 (most volatile).
Draws the series as a step plot, shades true “tight” bars below the user threshold, and marks sustained squeezes with a small arrow.
Key inputs
Lookback (bars): Number of bars to use for normalization (default 15).
Tight Threshold: RMV value under which a bar is considered squeezed (default 15).
Volume SMA Period: Period for the volume moving average benchmark (default 30).
How it works
Raw range: barRange = high - low
Volume ratio: volRatio = min(volume / sma(volume,30), 1)
Weighted range: vwRange = barRange * volRatio
Rolling min/max (prior 15 bars): exclude today so a new low immediately registers a 0.
Normalize: rmv = clamp(100 * (vwRange - min) / (max - min), 0, 100)
Visualization & signals
Step line for exact bar-by-bar values.
Shaded background when RMV < threshold.
Consecutive-bar filter ensures arrows only appear when tightness lasts at least two bars, cutting noise.
Why use it
Quickly spot consolidation zones that combine narrow price action with genuine dry volume—ideal for swing entries ahead of breakouts.
Volume Cluster Support & ResistanceVolume Cluster Support & Resistance
This indicator identifies potential Support and Resistance (S/R) levels on the chart using Volume-Based Point of Control (POC) Clustering. It offers extensive customization for calculation parameters, display styles, and visualization options, including S/R zones, color gradients, and historical reaction markers.
How It Works
Volume Based S/R:
Scans the specified Clustering Lookback period for "High Volume Bars", defined as bars where volume exceeds the average volume (over Volume Lookback Period) multiplied by the High Volume Threshold Multiplier.
Calculates the Point of Control (POC) for each high-volume bar using hl2.
Clusters these high-volume bar POCs: POCs within a proximity defined by Cluster Proximity (ATR) (Average True Range multiplier) are grouped together.
Filters these clusters, requiring a Min Bars in Cluster to form a valid S/R zone.
(Image showing the indicator being used on the Bitcoin 5min chart)
The center price of valid clusters determines the S/R level. Clusters above the current price become potential Resistance, and those below become potential Support.
Calculates the offset based on the most recent bar included in the cluster.
Level Selection & Display:
The indicator identifies multiple potential S/R levels.
It then selects and displays the top Number of S/R Levels to Display support levels below the current price and resistance levels above the current price.
(Image showing the indicator on the GBP/USD 5min chart)
ATR Usage:
The Average True Range (ta.atr(14)) is used in two key areas:
Determining the proximity threshold for grouping POCs in the 'Volume Based' clustering (clusterProximityAtr).
Calculating the width of the S/R zones when 'Use Zone Visualization' is enabled (zoneAtrMultiplier).
Key Features & Components
Dual Calculation Methods: Choose between Pivot-based S/R or Volume-based POC clustering.
Volume Confirmation: Pivots require volume confirmation; Volume method directly analyzes high-volume bars.
POC Clustering: Groups high-volume areas to identify significant price zones.
Configurable Lookbacks: Adjust periods for volume averaging, pivot detection, and clustering analysis.
Dynamic S/R Display: Shows a configurable number of the most relevant S/R levels relative to the current price.
Optional Zone Visualization: Display levels as filled zones with configurable width (ATR-based), fill transparency, and border transparency. Includes a dashed center line.
Optional Historical Reactions: Mark past price interactions (lows bouncing off support zones, highs rejecting from resistance zones) directly on the chart (Warning: Can significantly impact performance).
Customizable Styling: Control line style (Solid, Dashed, Dotted), width, color (separate for Support & Resistance), and horizontal extension (None, Left, Right, Both).
Price Labels: Toggle visibility of price labels next to each S/R level/zone.
Visual Elements Explained
S/R Lines/Zones: Plotted lines or filled zones representing calculated support and resistance levels. Color-coded for Support (default green) and Resistance (default magenta).
Line/Zone Borders: Appearance controlled by Style settings (Style, Width, Extension). Can have a gradient color effect based on age if enabled.
Zone Fills: Semi-transparent fills for zones (if enabled), with configurable transparency. Fill color matches the border color (including gradient effect if enabled).
Zone Center Line: A thin, dashed line indicating the exact calculated S/R price within a zone.
Price Labels: Text labels showing the exact price of the S/R level.
Historical Reactions: Small dot markers appearing on historical bars where price potentially reacted to a displayed zone (only if Show Historical Reactions is enabled).
Configuration Options
Users can adjust the following parameters in the indicator settings:
Calculation Method: Select "Pivot Based" or "Volume Based".
Volume Zone Settings (Volume Based): Threshold multiplier, clustering lookback, cluster proximity (ATR), minimum bars per cluster.
Display Options: Toggle S/R visibility, price tags, set the number of levels to show.
Volume Settings: Volume lookback period, volume multiplier (for Pivot confirmation).
Style Settings: Line style, width, extension, support/resistance text and line colors, enable gradient coloring, set gradient start/end colors.
Zone Visualization: Enable/disable zones, set zone width (ATR multiplier), fill and border transparency, enable/disable historical reaction markers (performance warning).
Interpretation Notes
This indicator identifies potential areas of support and resistance based on historical price action and volume analysis. These levels are not guaranteed reversal points.
The 'Volume Based' method focuses on areas where significant trading activity occurred, while the 'Pivot Based' method focuses on price turning points confirmed by volume.
Use the displayed levels in conjunction with other technical analysis tools, price action patterns, and risk management strategies.
Be mindful of the performance impact when enabling Show Historical Reactions, especially on longer timeframes or with large lookback periods. The default setting is false for optimal performance.
The max_bars_back setting is optimized for performance; increasing it significantly may slow down chart loading.
Risk Disclaimer
Trading involves significant risk. This indicator is provided for analytical and educational purposes only and does not constitute financial advice or a trading recommendation. Past performance is not indicative of future results. Always use sound risk management practices and never trade with capital you cannot afford to lose.

IDX - 5UPThe UDX-5UP is a custom indicator designed to assist traders in identifying trends, entry and exit signals, and market reversal moments with greater accuracy. It combines price analysis, volume, and momentum (RSI) to provide clear buy ("Buy") and sell ("Sell") signals across any asset and timeframe, whether you're a scalper on the 5M chart or a swing trader on the 4H chart. Inspired by robust technical analysis strategies, the UDX-5UP is ideal for traders seeking a reliable tool to operate in volatile markets such as cryptocurrencies, forex, stocks, and futures.
Components of the UDX-5UP
The UDX-5UP consists of three main panels that work together to provide a comprehensive view of the market:
Main Panel (Price):
Pivot Supertrend: A dynamic line that changes color to indicate the trend. Green for an uptrend (look for buys), red for a downtrend (look for sells).
SMAs (Simple Moving Averages): Two SMAs (8 and 21 periods) to confirm the trend direction. When the SMA 8 crosses above the SMA 21, it’s a bullish signal; when it crosses below, it’s a bearish signal.
Entry/Exit Signals: "Buy" (green) and "Sell" (red) labels are plotted on the chart when entry or exit conditions are met.
Volume Panel:
Colored Volume Bars: Green bars indicate dominant buying volume, while red bars indicate dominant selling volume.
Volume Moving Average (MA 20): A blue line that helps identify whether the current volume is above or below the average, confirming the strength of the movement.
RSI Panel:
RSI (Relative Strength Index): Calculated with a period of 14, with overbought (70) and oversold (30) lines to identify momentum extremes.
Divergences: The indicator detects divergences between the RSI and price, plotting signals for potential reversals.
How the UDX-5UP Works
The UDX-5UP uses a combination of rules to generate buy and sell signals:
Buy Signal ("Buy"):
The Pivot Supertrend changes from red to green.
The SMA 8 crosses above the SMA 21.
The volume is above the MA 20, with green bars (indicating buying pressure).
The RSI is rising and, ideally, below 70 (not overbought).
Example: On the 4H chart, the price of Tether (USDT) is at 0.05515. The Pivot Supertrend turns green, the SMA 8 crosses above the SMA 21, the volume shows green bars above the MA 20, and the RSI is at 46. The UDX-5UP plots a "Buy".
Sell Signal ("Sell"):
The Pivot Supertrend changes from green to red.
The SMA 8 crosses below the SMA 21.
The volume is above the MA 20, with red bars (indicating selling pressure).
The RSI is falling and, ideally, above 70 (overbought).
Example: On the 4H chart, the price of Tether rises to 0.05817. The Pivot Supertrend turns red, the SMA 8 crosses below the SMA 21, the volume shows red bars, and the RSI is above 70. The UDX-5UP plots a "Sell".
RSI Divergences:
The indicator identifies bullish divergences (price makes a lower low, but RSI makes a higher low) and bearish divergences (price makes a higher high, but RSI makes a lower high), plotting alerts for potential reversals.
Adjustable Settings
The UDX-5UP is highly customizable to suit your trading style:
Pivot Supertrend Period: Default is 2. Increase to 3 or 4 for more conservative signals (fewer false positives, but more lag).
SMA Periods: Default is 8 and 21. Adjust to 5 and 13 for smaller timeframes (e.g., 5M) or 13 and 34 for larger timeframes (e.g., 1D).
RSI Period: Default is 14. Reduce to 10 for greater sensitivity or increase to 20 for smoother signals.
Overbought/Oversold Levels: Default is 70/30. Adjust to 80/20 in volatile markets.
Display Panels: You can enable/disable the volume and RSI panels to simplify the chart.
How to Use the UDX-5UP
Identify the Trend:
Use the Pivot Supertrend and SMAs to determine the market direction. Uptrend: look for buys. Downtrend: look for sells.
Confirm with Volume and RSI:
For buys: Volume above the MA 20 with green bars, RSI rising and below 70.
For sells: Volume above the MA 20 with red bars, RSI falling and above 70.
Enter the Trade:
Enter a buy when the UDX-5UP plots a "Buy" and all conditions are aligned.
Enter a sell when the UDX-5UP plots a "Sell" and all conditions are aligned.
Plan the Exit:
Use Fibonacci levels or support/resistance on the price chart to set targets.
Exit the trade when the UDX-5UP plots an opposite signal ("Sell" after a buy, "Buy" after a sell).
Tips for Beginners
Start with Larger Timeframes: Use the 4H or 1D chart for more reliable signals and less noise.
Combine with Other Indicators: Use the UDX-5UP with tools like Fibonacci or the Candles RSI (another powerful indicator) to confirm signals.
Practice in Demo Mode: Test the indicator in a demo account before using real money.
Manage Risk: Always use a stop-loss and don’t risk more than 1-2% of your capital per trade.
Why Use the UDX-5UP?
Simplicity: Clear "Buy" and "Sell" signals make trading accessible even for beginners.
Versatility: Works on any asset (crypto, forex, stocks) and timeframe.
Multiple Confirmations: Combines price, volume, and momentum to reduce false signals.
Customizable: Adjust the settings to match your trading style.
Author’s Notes
The UDX-5UP was developed based on years of trading and technical analysis experience. It is an evolution of tested strategies, designed to help traders navigate volatile markets with confidence. However, no indicator is infallible. Always combine the UDX-5UP with proper risk management and fundamental analysis, especially in unpredictable markets. Feedback is welcome – leave a comment or reach out with suggestions for improvements!

GOLD Volume-Based Entry StrategyShort Description:
This script identifies potential long entries by detecting two consecutive bars with above-average volume and bullish price action. When these conditions are met, a trade is entered, and an optional profit target is set based on user input. This strategy can help highlight momentum-driven breakouts or trend continuations triggered by a surge in buying volume.
How It Works
Volume Moving Average
A simple moving average of volume (vol_ma) is calculated over a user-defined period (default: 20 bars). This helps us distinguish when volume is above or below recent averages.
Consecutive Green Volume Bars
First bar: Must be bullish (close > open) and have volume above the volume MA.
Second bar: Must also be bullish, with volume above the volume MA and higher than the first bar’s volume.
When these two bars appear in sequence, we interpret it as strong buying pressure that could drive price higher.
Entry & Profit Target
Upon detecting these two consecutive bullish bars, the script places a long entry.
A profit target is set at current price plus a user-defined fixed amount (default: 5 USD).
You can adjust this target, or you can add a stop-loss in the script to manage risk further.
Visual Cues
Buy Signal Marker appears on the chart when the second bar confirms the signal.
Green Volume Columns highlight the bars that fulfill the criteria, providing a quick visual confirmation of high-volume bullish bars.
Works fine on 1M-2M-5M-15M-30M. Do not use it on higher TF. Due the lack of historical data on lower TF, the backtest result is limited.

[blackcat] L1 Abnormal Volume Monitor█ OVERVIEW
The script is an indicator designed to monitor abnormal volume patterns in the market. It calculates and plots moving average volumes, identifies triple volume bars, and detects potential large order entries based on specific conditions.
█ FEATURES
• Input Parameters: The script defines parameters M1, M2, and lbk which control the calculation of moving averages and the lookback period for detecting abnormal volume.
• Calculations: The script calculates two moving averages of volume (MAVOL1 and MAVOL2), a smoothed price level (mm), and identifies conditions for triple volume bars and large order entries.
• Plotting: The script plots volume histograms for up and down bars, moving average volumes, and highlights triple volume bars with and without large order entries.
• Conditional Statements: The script uses conditional statements to determine when to plot certain data points and labels based on the calculated conditions.
█ LOGICAL FRAMEWORK
• xfl(cond, lbk): This function checks if a condition (cond) has been true within a specified lookback period (lbk). It returns true if the condition has been met and false otherwise.
• Parameters: cond (condition to check), lbk (lookback period).
• Return Value: outb (boolean indicating if the condition was met within the lookback period).
• abnormal_vol_monitor(close, open, high, low, volume, M1, M2, lbk): This function calculates moving average volumes, identifies triple volume bars, and detects large order entries.
• Parameters: close, open, high, low, volume (price and volume data), M1, M2 (periods for moving averages), lbk (lookback period).
• Return Value: A tuple containing MAVOL1, MAVOL2, xa (large order entry condition), and tripleVolume (triple volume condition).
█ KEY POINTS AND TECHNIQUES
• Moving Averages: The script uses simple moving averages (sma) and exponential moving averages (ema) to smooth volume data.
• Volume Analysis: The script identifies triple volume bars and large order entries based on specific conditions, such as volume doubling and price increases.
• Lookback Period: The xfl function uses a lookback period to ensure the accuracy of the detected conditions.
• Plotting Techniques: The script uses different plot styles and colors to distinguish between up bars, down bars, moving averages, and abnormal volume patterns.
█ EXTENDED KNOWLEDGE AND APPLICATIONS
• Modifications: The script could be modified to include additional conditions for detecting other types of abnormal volume patterns or to adjust the sensitivity of the detection.
• Extensions: Similar techniques could be applied to other financial instruments or timeframes to identify unusual trading activity.
• Related Concepts: The script utilizes concepts such as moving averages, exponential moving averages, and conditional plotting, which are fundamental in Pine Script and technical analysis.
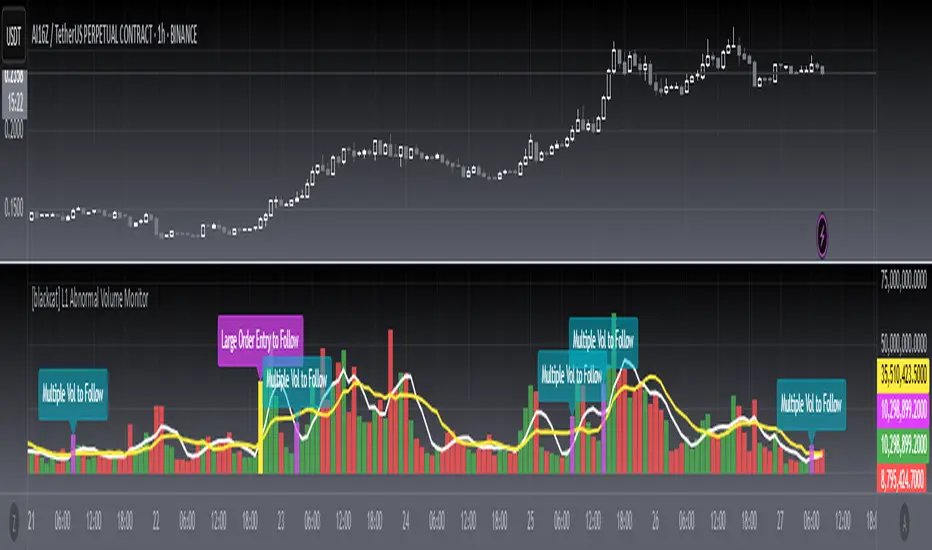
Effective Volume (ADV) v3Effective Volume (ADV) v3: Enhanced Accumulation/Distribution Analysis Tool
This indicator is an updated version of the original script by cI8DH, now upgraded to Pine Script v5 with added functionality, including the Volume Multiple feature. The tool is designed for analyzing Accumulation/Distribution (A/D) volume, referred to here as "Effective Volume," which represents the volume impact in alignment with price direction, providing insights into bullish or bearish trends through volume.
Accumulation/Distribution Volume Analysis : The script calculates and visualizes Effective Volume (ADV), helping traders assess volume strength in relation to price action. By factoring in bullish or bearish alignment, Effective Volume highlights points where volume strongly supports price movements.
Volume Multiple Feature for Volume Multiplication : The Volume Multiple setting (default value 2) allows you to set a multiplier to identify bars where Effective Volume exceeds the previous bar’s volume by a specified factor. This feature aids in pinpointing significant shifts in volume intensity, often associated with potential trend changes.
Customizable Aggregation Types : Users can choose from three volume aggregation types:
Simple - Standard SMA (Simple Moving Average) for averaging Effective Volume
Smoothed - RMA (Recursive Moving Average) for a less volatile, smoother line
Cumulative - Accumulated Effective Volume for ongoing trend analysis
Volume Divisor : The “Divide Vol by” setting (default 1 million) scales down the Effective Volume value for easier readability. This allows Effective Volume data to be aligned with the scale of the price chart.
Visualization Elements
Effective Volume Columns : The Effective Volume bar plot changes color based on volume direction:
Green Bars : Bullish Effective Volume (volume aligns with price movement upwards)
Red Bars : Bearish Effective Volume (volume aligns with price movement downwards)
Moving Average Lines :
Volume Moving Average - A gray line representing the moving average of total volume.
A/D Moving Average - A blue line showing the moving average of Accumulation/Distribution (A/D) Effective Volume.
High ADV Indicator : A “^” symbol appears on bars where the Effective Volume meets or exceeds the Volume Multiple threshold, highlighting bars with significant volume increase.
How to Use
Analyze Accumulation/Distribution Trends : Use Effective Volume to observe if bullish or bearish volume aligns with price direction, offering insights into the strength and sustainability of trends.
Identify Volume Multipliers with Volume Multiple : Adjust Volume Multiple to track when Effective Volume has notably increased, signaling potential shifts or strengthening trends.
Adjust Volume Display : Use the volume divisor setting to scale Effective Volume for clarity, especially when viewing alongside price data on higher timeframes.
With customizable parameters, this script provides a flexible, enhanced perspective on Effective Volume for traders analyzing volume-based trends and reversals.

Volume Indicator VSidea take from Alexander Elder, author of: The New Trading for a Living: Psychology, Discipline, Trading Tools and Systems, Risk Control, Trade Management
Meaning of colouring:
- Green bar Volume: If we look back certain numbers of volume bars, higher close price and higher volume.
- Blue bar Volume: If we look back certain numbers of volume bars, higher close price and lower volume.
- Red bar Volume: If we look back certain numbers of volume bars, lower close price and higher volume.
- Orange bar Volume: If we look back certain numbers of volume bars, lower close prince and lower volume.
- Grey bar Volume: If we look back certain numbers of volume bars, same price and same volume.

Momentum Breakout Filter + ATR ZonesMomentum Breakout Filter + ATR Zones - User Guide
What This Indicator Does
This indicator helps you with your MACD + volume momentum strategy by:
Filtering out fake breakouts - Shows ⚠️ warnings when breakouts lack confirmation
Showing clear entry signals - 🚀 LONG and 🔻 SHORT labels when all conditions align
Automatic stop loss & profit targets - Based on ATR (Average True Range)
Visual trend confirmation - Background color + EMA alignment
Signal Types
🚀 LONG Entry Signal (Green Label)
Appears when ALL conditions met:
✅ MACD crosses above signal line
✅ Volume > 1.5× average
✅ Price > EMA 9 > EMA 21 > EMA 200 (bullish trend)
✅ Price closes above recent 20-bar high
🔻 SHORT Entry Signal (Red Label)
Appears when ALL conditions met:
✅ MACD crosses below signal line
✅ Volume > 1.5× average
✅ Price < EMA 9 < EMA 21 < EMA 200 (bearish trend)
✅ Price closes below recent 20-bar low
⚠️ FAKE Breakout Warning (Orange Label)
Appears when price breaks high/low BUT lacks confirmation:
❌ Low volume (below 1.5× average), OR
❌ Wick break only (didn't close through level), OR
❌ MACD not aligned with direction
Hover over the warning label to see what's missing!
ATR Stop Loss & Targets
When you get a signal, colored lines automatically appear:
Long Position
Red solid line = Stop Loss (Entry - 1.5×ATR)
Green dashed lines = Profit Targets:
Target 1: Entry + 2×ATR
Target 2: Entry + 3×ATR
Target 3: Entry + 4×ATR
Short Position
Red solid line = Stop Loss (Entry + 1.5×ATR)
Green dashed lines = Profit Targets:
Target 1: Entry - 2×ATR
Target 2: Entry - 3×ATR
Target 3: Entry - 4×ATR
The lines move with each bar until you exit the position.
Chart Elements
Moving Averages
Blue line = EMA 9 (fast)
Orange line = EMA 21 (medium)
White line = EMA 200 (trend filter)
Volume
Yellow bars = High volume (above threshold)
Gray bars = Normal volume
Background Color
Light green = Bullish trend (all EMAs aligned up)
Light red = Bearish trend (all EMAs aligned down)
No color = Neutral/mixed
MACD (Bottom Pane)
Green/Red columns = MACD Histogram
Blue line = MACD Line
Orange line = Signal Line
Info Dashboard (Bottom Right)
ItemWhat It ShowsVolumeCurrent volume vs average (✓ HIGH or ✗ Low)MACDDirection (BULLISH or BEARISH)TrendEMA alignment (BULL, BEAR, or NEUTRAL)ATRCurrent ATR value in dollarsPositionCurrent position (LONG, SHORT, or NONE)R:RRisk-to-Reward ratio (shows when in position)
How To Use It
Basic Workflow
Wait for setup
Watch for MACD to approach signal line
Volume should be building
Price should be near EMA structure
Get confirmation
Wait for 🚀 LONG or 🔻 SHORT label
Check dashboard shows "✓ HIGH" volume
Verify trend is aligned (green or red background)
Enter the trade
Enter when signal appears
Note your stop loss (red line)
Note your targets (green dashed lines)
Manage the trade
Exit at first target for partial profit
Move stop to breakeven
Trail remaining position
What To Avoid
❌ Don't trade when you see:
⚠️ FAKE labels (wait for confirmation)
Neutral background (no clear trend)
"✗ Low" volume in dashboard
MACD and Trend not aligned
Settings You Can Adjust
Volume Sensitivity
High Volume Threshold: Default 1.5×
Increase to 2.0× for cleaner signals (fewer trades)
Decrease to 1.2× for more signals (more trades)
Fake Breakout Filters
You can toggle these ON/OFF:
Volume Confirmation: Requires high volume
Close Through: Requires candle close, not just wick
MACD Alignment: Requires MACD direction match
Tip: Turn all three ON for highest quality signals
ATR Stop/Target Multipliers
Default settings (conservative):
Stop Loss: 1.5×ATR
Target 1: 2×ATR (1.33:1 R:R)
Target 2: 3×ATR (2:1 R:R)
Target 3: 4×ATR (2.67:1 R:R)
Aggressive traders might use:
Stop Loss: 1.0×ATR
Target 1: 2×ATR (2:1 R:R)
Target 2: 4×ATR (4:1 R:R)
Conservative traders might use:
Stop Loss: 2.0×ATR
Target 1: 3×ATR (1.5:1 R:R)
Target 2: 5×ATR (2.5:1 R:R)
Example Trade Scenarios
Scenario 1: Perfect Long Setup ✅
Stock consolidating near EMA 21
MACD curling up toward signal line
Volume bar turns yellow (high volume)
🚀 LONG label appears
Red stop line and green target lines appear
Result: High probability trade
Scenario 2: Fake Breakout Avoided ✅
Price breaks above resistance
Volume is normal (gray bar)
⚠️ FAKE label appears (hover shows "Low volume")
No entry signal
Price falls back below breakout level
Result: Avoided losing trade
Scenario 3: Premature Entry ❌
MACD crosses up
Volume is high
BUT trend is NEUTRAL (no background color)
No signal appears (trend filter blocks it)
Result: Avoided choppy/sideways market
Quick Reference
Entry Checklist
🚀 or 🔻 label on chart
Dashboard shows "✓ HIGH" volume
Dashboard shows aligned MACD + Trend
Colored background (green or red)
ATR lines visible
No ⚠️ FAKE warning
Exit Strategy
Target 1 (2×ATR): Take 50% profit, move stop to breakeven
Target 2 (3×ATR): Take 25% profit, trail stop
Target 3 (4×ATR): Take remaining profit or trail aggressively
Stop Loss: Exit entire position if hit
Alerts
Set up these alerts:
Long Entry: Fires when 🚀 LONG signal appears
Short Entry: Fires when 🔻 SHORT signal appears
Fake Breakout Warning: Fires when ⚠️ appears (optional)
Tips for Success
Use on 5-minute charts for day trading momentum plays
Only trade high volume stocks ($5-20 range works best)
Wait for full confirmation - don't jump early
Respect the stop loss - it's calculated based on volatility
Scale out at targets - don't hold for home runs
Avoid trading first 15 minutes - let market settle
Best during 10am-11am and 2pm-3pm - peak momentum times
Common Questions
Q: Why didn't I get a signal even though MACD crossed?
A: All conditions must be met - check dashboard for what's missing (likely volume or trend alignment)
Q: Can I use this on any timeframe?
A: Yes, but it's designed for 5-15 minute charts. On daily charts, adjust ATR multipliers higher.
Q: The stop loss seems too tight, can I widen it?
A: Yes, increase "Stop Loss (×ATR)" from 1.5 to 2.0 or 2.5 in settings.
Q: I keep seeing FAKE warnings but price keeps going - what gives?
A: The filter is conservative. You can disable some filters in settings, but expect more false signals.
Q: Can I use this for swing trading?
A: Yes, but use larger timeframes (1H or 4H) and adjust ATR multipliers up (3× for stops, 6-9× for targets).

Ultra VolumeVisualizes volume intensity using dynamic color gradients and percentile thresholds. Includes optional SMA, bar coloring, and adaptive liquidity boxes to highlight high- and low-volume zones in real time.
Introduction
The Ultra Volume indicator enhances volume analysis by categorizing volume bars into percentile-based intensity levels. It uses color-coded gradients to quickly identify periods of unusually high or low activity. The script also includes an optional simple moving average (SMA), bar coloring, and visual box overlays to highlight zones of significant liquidity shifts.
Detailed Description
.........
Volume Classification
Volume is segmented into five tiers: Extra High, High, Medium, Normal, and Low, using percentile ranks calculated over a dynamically adjusted historical window. This segmentation adapts based on the chart's timeframe – using 100 bars for daily and 1440/minutes for intraday – allowing for consistent behavior across resolutions.
.....
Color Gradients
Each volume bar is colored based on its percentile category, smoothly transitioning between thresholds for visual clarity. This makes it easy to spot volume spikes or droughts relative to recent history.
.....
Simple Moving Average (SMA)
An optional SMA can be plotted on top of the volume bars for trend comparison and baseline reference. Its length and color are fully customizable.
.....
Bar Coloring
You can optionally color the chart's candlesticks to reflect the same volume intensity as the histogram bars, reinforcing visual cues across the chart.
.....
Liquidity Boxes
Two adaptive box systems highlight zones of increased or decreased liquidity:
High Liquidity Boxes expand upward when price exceeds the previous box’s top.
Low Liquidity Boxes expand downward when price breaks the previous box’s bottom.
These boxes persist and auto-adjust over time unless reset, helping traders spot key zones of volume-driven price action.
.....
Box Indexing
A configurable index shift determines how far back in the chart the boxes originate. Setting this to 501 makes them "stick" to the candle where they were first created.
.....
Data Handling
A safety check ensures the script throws an error if volume data is unavailable (e.g., for some crypto or CFD symbols).
.........
Summary
Ultra Volume is a practical tool for traders who want more than just raw volume bars. With intelligent percentile-based classification, real-time adaptive liquidity zones, and fully customizable visual elements, it turns volume into a highly readable, actionable signal.

Green*DiamondGreen*Diamond (GD1)
Unleash Dynamic Trading Signals with Volatility and Momentum
Overview
GreenDiamond is a versatile overlay indicator designed for traders seeking actionable buy and sell signals across various markets and timeframes. Combining Volatility Bands (VB) bands, Consolidation Detection, MACD, RSI, and a unique Ribbon Wave, it highlights high-probability setups while filtering out noise. With customizable signals like Green-Yellow Buy, Pullback Sell, and Inverse Pullback Buy, plus vibrant candle and volume visuals, GreenDiamond adapts to your trading style—whether you’re scalping, day trading, or swing trading.
Key Features
Volatility Bands (VB): Plots dynamic upper and lower bands to identify breakouts or reversals, with toggleable buy/sell signals outside consolidation zones.
Consolidation Detection: Marks low-range periods to avoid choppy markets, ensuring signals fire during trending conditions.
MACD Signals: Offers flexible buy/sell conditions (e.g., cross above signal, above zero, histogram up) with RSI divergence integration for precision.
RSI Filter: Enhances signals with customizable levels (midline, oversold/overbought) and bullish divergence detection.
Ribbon Wave: Visualizes trend strength using three EMAs, colored by MACD and RSI for intuitive momentum cues.
Custom Signals: Includes Green-Yellow Buy, Pullback Sell, and Inverse Pullback Buy, with limits on consecutive signals to prevent overtrading.
Candle & Volume Styling: Blends MACD/RSI colors on candles and scales volume bars to highlight momentum spikes.
Alerts: Set up alerts for VB signals, MACD crosses, Green*Diamond signals, and custom conditions to stay on top of opportunities.
How It Works
Green*Diamond integrates multiple indicators to generate signals:
Volatility Bands: Calculates bands using a pivot SMA and standard deviation. Buy signals trigger on crossovers above the lower band, sell signals on crossunders below the upper band (if enabled).
Consolidation Filter: Suppresses signals when candle ranges are below a threshold, keeping you out of flat markets.
MACD & RSI: Combines MACD conditions (e.g., cross above signal) with RSI filters (e.g., above midline) and optional volume spikes for robust signals.
Custom Logic: Green-Yellow Buy uses MACD bullishness, Pullback Sell targets retracements, and Inverse Pullback Buy catches reversals after downmoves—all filtered to avoid consolidation.
Visuals: Ribbon Wave shows trend direction, candles blend momentum colors, and volume bars scale dynamically to confirm signals.
Settings
Volatility Bands Settings:
VB Lookback Period (20): Adjust to 10–15 for faster markets (e.g., 1-minute scalping) or 25–30 for daily charts.
Upper/Lower Band Multiplier (1.0): Increase to 1.5–2.0 for wider bands in volatile stocks like AEHL; decrease to 0.5 for calmer markets.
Show Volatility Bands: Toggle off to reduce chart clutter.
Use VB Signals: Enable for breakout-focused trades; disable to focus on Green*Diamond signals.
Consolidation Settings:
Consolidation Lookback (14): Set to 5–10 for small caps (e.g., AEHL) to catch quick consolidations; 20 for higher timeframes.
Range Threshold (0.5): Lower to 0.3 for stricter filtering in choppy markets; raise to 0.7 for looser signals.
MACD Settings:
Fast/Slow Length (12/26): Shorten to 8/21 for scalping; extend to 15/34 for swing trading.
Signal Smoothing (9): Reduce to 5 for faster signals; increase to 12 for smoother trends.
Buy/Sell Signal Options: Choose “Cross Above Signal” for classic MACD; “Histogram Up” for momentum plays.
Use RSI Div + MACD Cross: Enable for high-probability reversal signals.
RSI Settings:
RSI Period (14): Drop to 10 for 1-minute charts; raise to 20 for daily.
Filter Level (50): Set to 55 for stricter buys; 45 for sells.
Overbought/Oversold (70/30): Tighten to 65/35 for small caps; widen to 75/25 for indices.
RSI Buy/Sell Options: Select “Bullish Divergence” for reversals; “Cross Above Oversold” for momentum.
Color Settings:
Adjust bullish/bearish colors for visibility (e.g., brighter green/red for dark themes).
Border Thickness (1): Increase to 2–3 for clearer candle outlines.
Volume Settings:
Volume Average Length (20): Shorten to 10 for scalping; extend to 30 for swing trades.
Volume Multiplier (2.0): Raise to 3.0 for AEHL’s volume surges; lower to 1.5 for steady stocks.
Bar Height (10%): Increase to 15% for prominent bars; decrease to 5% to reduce clutter.
Ribbon Settings:
EMA Periods (10/20/30): Tighten to 5/10/15 for scalping; widen to 20/40/60 for trends.
Color by MACD/RSI: Disable for simpler visuals; enable for dynamic momentum cues.
Gradient Fill: Toggle on for trend clarity; off for minimalism.
Custom Signals:
Enable Green-Yellow Buy: Use for momentum confirmation; limit to 1–2 signals to avoid spam.
Pullback/Inverse Pullback % (50): Set to 30–40% for small caps; 60–70% for indices.
Max Buy Signals (1): Increase to 2–3 for active markets; keep at 1 for discipline.
Tips and Tricks
Scalping Small Caps (e.g., AEHL):
Use 1-minute charts with VB Lookback = 10, Consolidation Lookback = 5, and Volume Multiplier = 3.0 to catch $0.10–$0.20 moves.
Enable Green-Yellow Buy and Inverse Pullback Buy for quick entries; disable VB Signals to focus on Green*Diamond logic.
Pair with SMC+ green boxes (if you use them) for reversal confirmation.
Day Trading:
Try 5-minute charts with MACD Fast/Slow = 8/21 and RSI Period = 10.
Enable RSI Divergence + MACD Cross for high-probability setups; set Max Buy Signals = 2.
Watch for volume bars turning yellow to confirm entries.
Swing Trading:
Use daily charts with VB Lookback = 30, Ribbon EMAs = 20/40/60.
Enable Pullback Sell (60%) to exit after rallies; disable RSI Color for cleaner candles.
Check Ribbon Wave gradient for trend strength—bright green signals strong bulls.
Avoiding Noise:
Increase Consolidation Threshold to 0.7 on volatile days to skip false breakouts.
Disable Ribbon Wave or Volume Bars if the chart feels crowded.
Limit Max Buy Signals to 1 for disciplined trading.
Alert Setup:
In TradingView’s Alerts panel, select:
“GD Buy Signal” for standard entries.
“RSI Div + MACD Cross Buy” for reversals.
“VB Buy Signal” for breakout plays.
Set to “Once Per Bar Close” for confirmed signals; “Once Per Bar” for scalping.
Backtesting:
Replay on small caps ( Float < 5M, Price $0.50–$5) to test signals.
Focus on “GD Buy Signal” with yellow volume bars and green Ribbon Wave.
Avoid signals during gray consolidation squares unless paired with RSI Divergence.
Usage Notes
Markets: Works on stocks, forex, crypto, and indices. Best for volatile assets (e.g., small-cap stocks, BTCUSD).
Timeframes: Scalping (1–5 minutes), day trading (15–60 minutes), or swing trading (daily). Adjust settings per timeframe.
Risk Management: Combine with stop-losses (e.g., 1% risk, $0.05 below AEHL entry) and take-profits (3–5%).
Customization: Tweak inputs to match your strategy—experiment in replay to find your sweet spot.
Disclaimer
Green*Diamond is a technical tool to assist with trade identification, not a guarantee of profits. Trading involves risks, and past performance doesn’t predict future results. Always conduct your own analysis, manage risk, and test settings before live trading.
Feedback
Love Green*Diamond? Found a killer setup?
