BAT Multi Anchored VWAPMulti Anchored VWAP which includes: BTC Key Pivots SPX Key Pivots Yearly Opens 5 Adjustable Dates Works on all assets, unlike some VWAP calculations.Pine Script® インジケーターbatlethの投稿更新済 3363
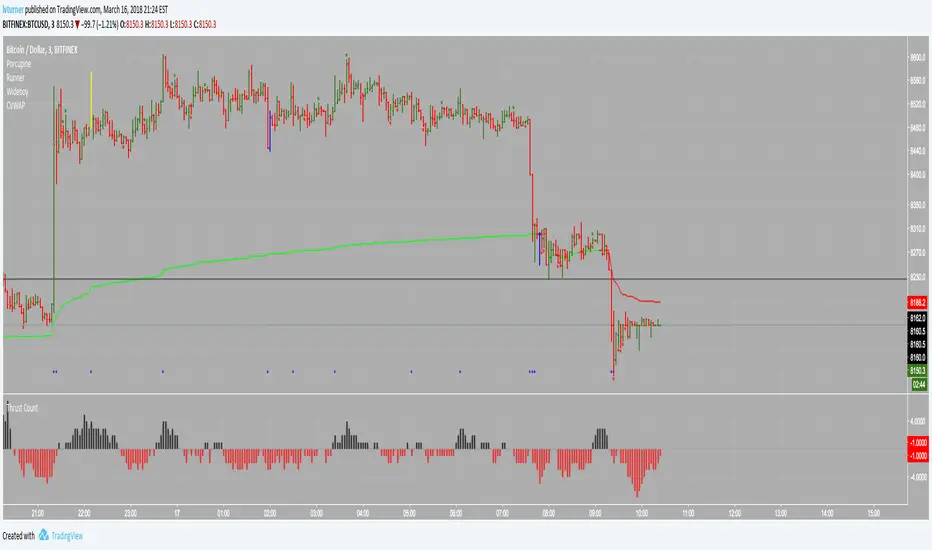
Colored Volume Weighted Average PriceSimple addition to the standard VWAP indicator. If price is above VWAP the plot is colored green. If below plot is colored red. Colors are configurable. You can also choose the source for price (i.e. open/low/high etc)Pine Script® インジケーターlvturnerの投稿22472
Market Liquidity IndicatorThe strategy identifies institutional "Ignition" points where price breaks a key macro level (VWAP) with significant volume and order flow support. It assumes that a clean breakout, backed by high relative volume (RVOL) and aggressive buying/selling pressure (CVD Slope), will result in a sustainable trend. Risk is managed via a "Profit-Only Trailing Stop" mechanism, which enforces a hard floor for losses but allows profits to run uncapped until the trend bends Timeframe: This strategy is hardcoded to look at 1-minute data for its decision engine (RVOL/CVD), regardless of the chart timeframe. However, it is recommended to run it on a 5-minute chart for visual clarity. Execution: GOL (Green Arrow): Go Long. GOS (Red Arrow): Go Short. Exits: 1 Brick = 0.1% of Entry Price. Trailing Stop Loss: Retrace from Extreme High/Low ± 3 Bricks. Stop Out: +/- 3 Bricks from Entry Price Works well with Stocks - 5 min TF. For Index 10 min TF works well. However do play around to get your best fit. Happy Profitable Trading! Have fun!Pine Script® インジケーターrazcadsの投稿4
Multi-Strategy Filter: Pivot/Breakout/VWAP/RSI/MACDStrategy Overview: Multi-Confirmation Technical Scanner This filter is a high-probability trend-following system that combines three core trading methodologies: Pivot Points (for institutional levels), Breakout Trading (for price action momentum), and VWAP (for volume-weighted value tracking). To ensure accuracy and avoid false breakouts, a signal is only generated when at least three of these core strategies align, further validated by a "Sweet Spot" RSI (momentum confirmation without being overbought) and a bullish MACD crossover. This multi-layered approach identifies stocks with strong institutional support and significant upward momentum.Pine Script® インジケーターfimasanの投稿8
Ema+Vwap+ORB4 Ema, Vwap plus the ORB, defined by User. Previous Day, Week and Month Highs and Lows.Pine Script® インジケーターjuliocruz01の投稿6
G&G VWAPSimple VWAP Indicator with green and red shading signaling buyers or sellers in control. Blue line in middle is decision line. Pine Script® インジケーターGridandGrit_Chartingの投稿10
GCM Apex Predator AlgoTitle: GCM Apex Predator Algo Overview The GCM Apex Predator is a high-performance, multi-engine trading system designed for traders who demand precision and clarity. Whether you are a fast-paced scalper or a patient swing trader, this algorithm adapts to market conditions using a sophisticated "Apex Score" momentum engine combined with institutional-grade volume and trend filters. Key Features • Triple Engine Logic: Switch seamlessly between Scalper Mode (Fast), Trend Mode (Swing), or a Hybrid setup that captures both micro-moves and macro-trends. • Apex Score Momentum: A proprietary loop-based engine that calculates the "persistence" of price action. It filters out "fake" moves by ensuring momentum is backed by structural strength. • Institutional Filters: Includes built-in ADX Trend Power and Relative Volume filters to keep you out of "chop" and only in high-probability trades. • Dynamic Risk Management: Automatically calculates and draws Entry, Stop Loss (SL), and Take Profit (TP) zones using ATR-based volatility, giving you a professional "desk" feel. • Corporate Dashboard: A real-time HUD (Heads-Up Display) that monitors Trend Bias, ADX Power, Apex Momentum, and VWAP positioning at a glance. How to Use 1. Select Your Mode: Use the "Scalper Mode" for lower timeframes (1m, 5m) or "Trend Mode" for higher timeframes (1h, 4h). 2. The "Sniper" Signal: Look for the Gold Circle symbols. These represent "Sniper" entries where all engines (Trend, Volume, and Apex) align for a high-conviction move. 3. Market Structure: Pay attention to the dashed reversal lines. These project potential structural shifts based on fast-reversal HMA logic. Alerts This indicator is fully optimized for Any alert() function call. You can set one single alert to receive detailed notifications like: • 🎯 SNIPER LONG: BTCUSD @ 65000 • ⚡ SCALP BUY: EURUSD @ 1.0850 Disclaimer Trading involves significant risk. This tool is for educational and technical analysis purposes. Past performance does not guarantee future results. Pine Script® インジケーターuniGramの投稿更新済 11802
ES VWAP + GEX OverlayAI v6 ES VWAP + GEX Overlay. The system seems to want me to add more text for description before I know it it works. Pine Script® インジケーターjdye001の投稿4
Kotegawa Dip ReversalTakashi Kotegawa trading indicator it is meant to buy cheap japanese stocks when they are below vwapPine Script® インジケーターEloniTheの投稿14
Adaptive Pullbacks ML v2.5Adaptive Pullbacks ML - Context-Aware Trend Trading Overview Adaptive Pullbacks ML is a sophisticated trend-following tool that solves the biggest problem in pullback trading: "Is this a dip to buy, or the start of a reversal?" Unlike standard indicators that use fixed percentages or static moving averages, this script uses a 5-Dimensional k-Nearest Neighbors (k-NN) machine learning engine to learn the specific characteristics of successful pullbacks for the asset you are trading. The 5-Dimensional ML Engine The market is dynamic. A pullback depth that works in a low-volatility lunch session might fail during a high-volatility news event. This indicator tracks 5 key dimensions for every pullback: Depth (ATR Normalized): How deep is the pullback relative to volatility? Trend Slope: Is the trend steep (parabolic) or flat (grinding)? ADX: How strong is the directional energy? VWAP Distance: Is price extended or close to value? Time of Day: Is this a morning drive or an afternoon fade? When a new pullback occurs, the k-NN engine finds the 5 most similar historical events across these dimensions and predicts the probability of success. Core Features 1. Fractal Normalization The indicator speaks the language of ATR (Average True Range). It doesn't care if you trade the 15-second chart or the Daily chart. A "1.5 ATR Pullback" is a statistically comparable event across all timeframes, allowing for robust, scale-invariant analysis. 2. HTF Stats Bridge (Higher Timeframe Data) You can trade on lower timeframes (e.g., 1-minute) while using statistics derived from higher timeframes (e.g., 15-minute). This ensures your signals are based on significant market structure, not microstructure noise. 3. Smart Zones The indicator plots dynamic "Value Zones" based on learning: Cyan Zone (Avg Depth): The "Sweet Spot". High probability bounce area. Yellow Zone (Sigma): The "Extension". Price is stretching elastic limits. Red Zone (Deep): The "Danger/Opportunity". Statistical anomaly. 4. PQS & k-NN Filters Two layers of filtering protect your capital: PQS (Probability Qualification Score): Based on raw win-rate of the zone. k-NN Probability: Based on similarity to past winners. Settings Guide Stats Timeframe: The timeframe to learn from (Leave empty for Chart). Trend/Trigger Settings: Define what constitutes a trend for your strategy. k-Neighbors: Number of historical twins to compare (Default: 5). Min PQS / k-NN: Thresholds for filtering weak signals. Disclaimer: This tool is for educational purposes. Past performance of the k-NN engine does not guarantee future results.Pine Script® インジケーターSelfsimilarityの投稿更新済 1126
KCP TEMA 20 & VWAP Trend [Dr.K.C.Prakash]This indicator plots TEMA 20 High and Low lines to show fast-reacting dynamic support and resistance, with VWAP displayed as an intraday reference. It helps identify short-term trend direction and price strength relative to volume-weighted levels.Pine Script® インジケーターprakash1126の投稿3
KCP TEMA 50 & VWAP Trend [Dr.K.C.Prakash]This indicator displays TEMA 50 High and Low lines to capture fast-reacting dynamic support and resistance, along with VWAP as an intraday reference. It helps identify short-term trend direction and price positioning relative to volume-weighted market value.Pine Script® インジケーターprakash1126の投稿6
Clean EMA VWAP Trend Pullback - SrPyeA clean, confirmation-based trend pullback indicator using EMA and VWAP alignment. Designed to reduce noise and highlight high-probability continuation setups. Best used on 1–2 minute charts during high-liquidity sessions. This indicator is designed as a confirmation tool, not a standalone trading system. Good For NY Session 9:30am - 11:00am - After Lunch 1:00pm- 3:00pm OR Optional Alerts - Sr.Pye Pine Script® インジケーターfnunez914の投稿更新済 17
ICT Killzones & Pivots [TFO] + VWAP (NY Anchor)Made this for me, Enjoy it if it works for you ICT killzones + Vwap entry model from new york open with alerts Pine Script® インジケーターethanclements4の投稿1146
RTH VWAP (9:30 Anchor) with Custom BandsPlots a VWAP anchored to the 9:30 AM New York open, resetting each Regular Trading Hours session. Includes up to three customizable standard-deviation bands with user-defined multipliers, colors, and line styles (solid, dashed, dotted). Designed for US equities and index futures, providing a clear intraday mean price and overextension levels during RTH.Pine Script® インジケーターcrptoworthyの投稿6
Desk Alerts: AMD / PLTR / NVDA (VWAP + EMA + Volume)Desk Alerts: AMD / PLTR / NVDA (VWAP + EMA + Volume)Pine Script® インジケーターHotHandz44の投稿5
Desk Alerts: AMD / PLTR / NVDA (VWAP + EMA + Volume)Desk Alerts: AMD / PLTR / NVDA (VWAP + EMA + Volume)Pine Script® インジケーターHotHandz44の投稿2
Breakout Alert Pro + VWAPAdvanced breakout/breakdown indicator featuring multi-pattern detection, quality tier scoring (S/A/B/C), strength analysis (0-10), VWAP integration, multi-timeframe filters, and adaptive R-based take-profit/stop-loss framework. Includes comprehensive dashboard with real-time metrics and market regime detection.Pine Script® インジケーターryan561の投稿5
Breakout Alert Pro + VWAPAdvanced breakout/breakdown indicator featuring multi-pattern detection, quality tier scoring (S/A/B/C), strength analysis (0-10), VWAP integration, multi-timeframe filters, and adaptive R-based take-profit/stop-loss framework. Includes comprehensive dashboard with real-time metrics and market regime detection.Pine Script® インジケーターryan561の投稿4
Weekly Debit Spread VWAP + Prior Day + Dual ConfirmOpen Debit Spreads using previous day and current vwap Pine Script® インジケーターwholsinger86の投稿8
Smart Money Signals - Minimal v5 (No VWAP, Manual CMF) - RajeevSmart Money Signals - Minimal v5 (No VWAP, Manual CMF) - RajeevPine Script® インジケーターdranandtendulkarの投稿4
UT Bot Decimal + HA Signals + HA VWAP (Bold White Labels)Custom UT Bot with Built in VWAP and ability to use decimal sensitivity and signals fire off of Heikin Ashi candlePine Script® インジケーターsellmore32の投稿150
BTC ETF Average Inflow Cost BasisConcept Since the historic launch of Bitcoin Spot ETFs on January 11, 2024, institutional flows have become a major driver of price action. This indicator aims to visualize the aggregate Cost Basis (average entry price) of the major Bitcoin ETFs relative to the underlying asset. It serves as an on-chain proxy for institutional positioning, helping traders identify critical support levels where ETF inflows have historically concentrated. How it Works The script aggregates daily volume data from the top Bitcoin ETFs (IBIT, FBTC, ARKB, GBTC, BITB) and compares it against the Bitcoin price (BTCUSDT). ETF Cost Basis (Pink Line): This is calculated as a Cumulative Volume-Weighted Average Price (VWAP), anchored specifically to the ETF launch date (Jan 11, 2024). Formula: It accumulates (BTC Price * Total ETF Volume) and divides it by the Cumulative Total ETF Volume. This creates a dynamic level representing the "breakeven" price for the aggregate volume traded through these funds. True Market Mean (Gray Line): This represents the simple cumulative average of the Bitcoin price since the ETF launch date. It acts as a neutral baseline for the post-ETF market era. How to Use Institutional Support: The Cost Basis line often acts as a strong dynamic support level during corrections. When price revisits this level, it suggests the market is returning to the average institutional entry price. Trend Filter: Price > Cost Basis: The market is in a net profit state relative to ETF flows (Bullish/Trend continuation). Price < Cost Basis: The market is in a net loss state (Bearish/Capitulation risk). Confluence: The intersection of the Cost Basis and the True Market Mean can signal pivotal moments of trend reset. Features Data Aggregation: Pulls data from 5 major ETFs via request.security without repainting (using closed bars). Dashboard: Includes a table in the top-right corner displaying real-time values for Price, Cost Basis, and Market Mean. Customization: You can toggle individual ETF Moving Averages in the settings (disabled by default due to price scale differences between BTC and ETF shares). Disclaimer This tool is for educational purposes only and attempts to estimate institutional cost basis using volume proxies. It does not represent financial advice. Pine Script® インジケーターcarlosbucciの投稿34