Multi Time Frame Composite BandsMulti Time Frame Composite Bands utilizes Fibonacci numbers (5, 8, 13, 21, 34) as period lengths for calculations. The indicator calculates a composite high line (C_high) by averaging the highest prices over Fibonacci periods, incorporating moving averages (SMA) of high prices for added refinement and smoothing. Similarly, a composite low line (C_low) is calculated by averaging the lowest prices with moving averages of low prices. The midline, obtained from the mean of C_high and C_low.
This band can function as volatility bands unlike traditional volatility indicators like Bollinger Bands , ATR bands it does not use traditional measures of volatility such standard deviation , ATR. This hugs closely to the price and during trending markets the some part of the candles stay outside the band and when the entire candle digress outside the band a price correction or reversal can be anticipated. This can be considered as a smoothed Donchian channel.
"band"に関するスクリプトを検索

TrueLevel BandsTrueLevel Bands is a powerful trading indicator that employs linear regression and standard deviation to create dynamic, envelope-style bands around the price action of a financial instrument. These bands are designed to help traders identify potential support and resistance levels, trend direction, and volatility.
The TrueLevel Bands indicator consists of multiple envelope bands, each constructed using different timeframes or lengths, and a multiple (mult) factor. The multiple factor determines the width of the bands by adjusting the number of standard deviations from the linear regression line.
Key Features of TrueLevel Bands
1. Multi-Timeframe Analysis: Unlike traditional moving average-based indicators, TrueLevel Bands allow traders to incorporate multiple timeframes into their analysis. This helps traders capture both short-term and long-term market dynamics, offering a more comprehensive understanding of price behavior.
2. Customization: The TrueLevel Bands indicator offers a high level of customization, allowing traders to adjust the lengths and multiple factors to suit their trading style and preferences. This flexibility enables traders to fine-tune the indicator to work optimally with various instruments and market conditions.
3. Adaptive Volatility: By incorporating standard deviation, TrueLevel Bands can automatically adjust to changing market volatility. This feature enables the bands to expand during periods of high volatility and contract during periods of low volatility, providing traders with a more accurate representation of market dynamics.
4. Dynamic Support and Resistance Levels: TrueLevel Bands can help traders identify dynamic support and resistance levels, as the bands adjust in real-time according to price action. This can be particularly useful for traders looking to enter or exit positions based on support and resistance levels.
5. The "Global Trend Line" refers to the average of the bands used to indicate the overall trend.
Why TrueLevel Bands are Different from Classic Moving Averages
TrueLevel Bands differ from conventional moving averages in several ways:
1. Linear Regression: While moving averages are based on simple arithmetic means, TrueLevel Bands use linear regression to determine the centerline. This offers a more accurate representation of the trend and helps traders better assess potential entry and exit points.
2. Envelope Style Bands: Unlike moving averages, which are single lines, TrueLevel Bands form envelope-style bands around the price action. This provides traders with a visual representation of potential support and resistance levels, trend direction, and volatility.
3. Multi-Timeframe Analysis: Classic moving averages typically focus on a single timeframe. In contrast, TrueLevel Bands incorporate multiple timeframes, enabling traders to capture a broader understanding of market dynamics.
4. Adaptive Volatility: Traditional moving averages do not account for changing market volatility, whereas TrueLevel Bands automatically adjust to volatility shifts through the use of standard deviation.
The TrueLevel Bands indicator is a powerful, versatile tool that offers traders a unique approach to technical analysis. With its ability to adapt to changing market conditions, provide multi-timeframe analysis, and dynamic support and resistance levels, TrueLevel Bands can serve as an invaluable asset to both novice and experienced traders looking to gain an edge in the markets.

Bollinger Band ribbonThis indicator plots 9 upper and lower lines with increasing length. Lines are 0.618 upper and lower level of Bollinger band.
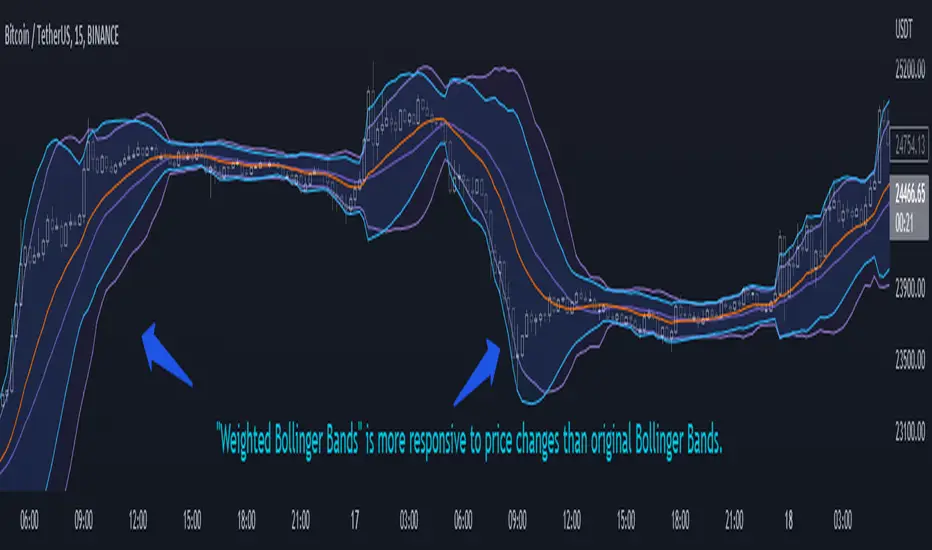
Weighted Bollinger Band (+ Logarithmic)ENG)
Weighted BB is more responsive to price changes than original Bollinger Bands.
the calculation formula uses a weighted method based on the current price.
Instead of using a standard deviation, I used a weighted standard deviation that weights the current price, and instead of a simple moving average, I used a weighted moving average.
Also included is a formula to log the Bollinger Bands for users who view charts on a logarithmic scale.
KOR)
원본 볼밴보다 가격변화에 대한 반응성이 높습니다.
계산식에는 현재가격에 가중을 주는 방식을 사용하였습니다.
표준편차를 사용하는 대신 저는 현재가격에 가중을 두는 가중표준편차를 사용하였고, 단순이동평균 대신 가중이동평균을 사용하였습니다.
또한 로그스케일로 차트를 보는 유저를 위해 볼린저밴드를 log화 하는 수식도 포함하였습니다.
Average Trend with Deviation BandsTL,DR: A trend indicator with deviation bands using a modified Donchian calculation
This indicator plots a trend using the average of the lowest and highest closing price and the lowest low and highest high of a given period. This is similar to Donchian channels which use an average of the lowest and highest value (of a given period). This might sound like a small change but imho it provides a better "average" when lows/highs and lowest/highest closing prices are considered in the average calculation as well.
I also added the option to show 2 deviation bands (one is deactivated by default but can be activated in the options menu). The deviation band uses the standard deviation (of the average trend) and can be used to determine if a price movement is still in a "normal" range or not. Based on my testing it is fine to use one band with a standard deviation of 1 but it is also possible to show a second band with a different deviation value if needed. The bands (and trendline) can also be used as dynamic support/resistance zones.
Trendline without deviation bands

Volume Weighted Hull Moving Average Bollinger Bands (VWHBB)Title: "Volume Weighted Hull Moving Average Bollinger Bands Indicator for TradingView"
Abstract: This script presents a TradingView indicator that displays Bollinger Bands based on the volume weighted Hull Moving Average (VEHMA) of a financial asset. The VEHMA is a technical analysis tool that combines the reduced lag of the Hull Moving Average (HMA) with volume weighting to provide a more sensitive indicator of market trends and dynamics. The Bollinger Bands are a volatility indicator that plot upper and lower bands around a moving average, which can help traders identify potential trend changes and overbought or oversold conditions. The script allows the user to customize the VEHMA length and Bollinger Band deviation parameters.
Introduction: Bollinger Bands are a popular technical analysis tool used to identify potential trend changes and overbought or oversold conditions in the market. They are constructed by plotting upper and lower bands around a moving average, with the width of the bands determined by the volatility of the asset. The VEHMA is a variant of the Hull Moving Average (HMA) that combines the reduced lag of the HMA with volume weighting to provide a more sensitive indicator of market trends and dynamics.
Methodology: The VEHMA is calculated using a weighted average of two exponential moving averages (EMAs), with the weighting based on the volume of the asset and the length of the moving average. The Bollinger Bands are calculated by plotting the VEHMA plus and minus a standard deviation of the asset's price over a specified period. The standard deviation is a measure of the volatility of the asset and helps to adjust the width of the bands based on market conditions.
Implementation: The script is implemented in TradingView's PineScript language and can be easily added to any chart on the platform. The user can customize the VEHMA length and Bollinger Band deviation parameters to suit their trading strategy. The VEHMA, Bollinger Bands, and fill colors are plotted on the chart to provide a visual representation of the indicator.
Conclusion: The VEHMA Bollinger Bands indicator is a useful tool for traders looking to identify potential trend changes and overbought or oversold conditions in the market. This script provides a convenient and customizable implementation of the indicator for use in TradingView.

Bollinger Bands Width and Bollinger Bands %BThis script shows both the Bollinger Band Width(BBW) and %B on the same indicator window.
Both the BBW and %B are introduced by John Bollinger(creator of Bollinger Bands) in 2010.
Default Parameter values: Length = 20, Source = Close, Mult = 2
Bollinger Bands Width (BBW): Color = (Default: Green )
- I consider stocks with "BBW >= 4" are at a volatile state and ready for price contraction, but this depends on the parameter values of your choice.
Bollinger Bands %B (%B): Color = (Default: Blue )
1. %B Above 10 = Price is Above the Upper Band
2. %B Equal to 10 = Price is at the Upper Band
3. %B Above 5 = Price is Above the Middle Line
4. %B Below 5 = Price is Below the Middle Line
5. %B Equal to 0 = Price is at the Lower Band
6. %B Below 0 = Price is Below the Lower Band

Rollin' pseudo-Bollinger Bands 5 linear regression curves and new highs/lows mixed together from the basis for this indicator. Using slightly different logic an upper boundary and lower boundary are formed. Then the boundary's are built upon to show price channels within the band using variations of fib levels and the distance between the initial boundary's. Dots plotted show the inverse of the close price relative to either the upper or lower boundary depending on where the close is relative to the center of the band. This shows the market's tendency for symmetry which is useful when looking for reversals etc. If it's too cluttered feel free to turn off some things in the options and keep what you feel is helpful.

CFB Adaptive MOGALEF Bands [Loxx]A Pine Script adaptation from MOGALEF Bands .
What are MOGALEF Bands?
Actual MOGALEF bands code is the final result of a lot of contributors. Syllables MO-GA-LEF are the initials of three of them.
The basic idea of bands: the markets are still in range, and trends that are moving ranges. The Mogalef bands try to estimate the current range and to project its on the future if prices move. This future estimation is often of great relevance and very useful, especialy for market profile users or pivot points users.
What is Composite Fractal Behavior ( CFB )?
All around you mechanisms adjust themselves to their environment. From simple thermostats that react to air temperature to computer chips in modern cars that respond to changes in engine temperature, r.p.m.'s, torque, and throttle position. It was only a matter of time before fast desktop computers applied the mathematics of self-adjustment to systems that trade the financial markets.
Unlike basic systems with fixed formulas, an adaptive system adjusts its own equations. For example, start with a basic channel breakout system that uses the highest closing price of the last N bars as a threshold for detecting breakouts on the up side. An adaptive and improved version of this system would adjust N according to market conditions, such as momentum, price volatility or acceleration.
Since many systems are based directly or indirectly on cycles, another useful measure of market condition is the periodic length of a price chart's dominant cycle, (DC), that cycle with the greatest influence on price action.
The utility of this new DC measure was noted by author Murray Ruggiero in the January '96 issue of Futures Magazine. In it. Mr. Ruggiero used it to adaptive adjust the value of N in a channel breakout system. He then simulated trading 15 years of D-Mark futures in order to compare its performance to a similar system that had a fixed optimal value of N. The adaptive version produced 20% more profit!
This DC index utilized the popular MESA algorithm (a formulation by John Ehlers adapted from Burg's maximum entropy algorithm, MEM). Unfortunately, the DC approach is problematic when the market has no real dominant cycle momentum, because the mathematics will produce a value whether or not one actually exists! Therefore, we developed a proprietary indicator that does not presuppose the presence of market cycles. It's called CFB (Composite Fractal Behavior) and it works well whether or not the market is cyclic.
CFB examines price action for a particular fractal pattern, categorizes them by size, and then outputs a composite fractal size index. This index is smooth, timely and accurate
Essentially, CFB reveals the length of the market's trending action time frame. Long trending activity produces a large CFB index and short choppy action produces a small index value. Investors have found many applications for CFB which involve scaling other existing technical indicators adaptively, on a bar-to-bar basis.
What is Jurik Volty used in the Juirk Filter?
One of the lesser known qualities of Juirk smoothing is that the Jurik smoothing process is adaptive. "Jurik Volty" (a sort of market volatility ) is what makes Jurik smoothing adaptive. The Jurik Volty calculation can be used as both a standalone indicator and to smooth other indicators that you wish to make adaptive.
What is the Jurik Moving Average?
Have you noticed how moving averages add some lag (delay) to your signals? ... especially when price gaps up or down in a big move, and you are waiting for your moving average to catch up? Wait no more! JMA eliminates this problem forever and gives you the best of both worlds: low lag and smooth lines.
Ideally, you would like a filtered signal to be both smooth and lag-free. Lag causes delays in your trades, and increasing lag in your indicators typically result in lower profits. In other words, late comers get what's left on the table after the feast has already begun.
Included:
-Color bars
-Fill levels

ATR BandsIn many strategies, it's quite common to use a scaled ATR to help define a stop-loss, and it's not uncommon to use it for take-profit targets as well. While it's possible to use the built-in ATR indicator and manually calculate the offset value, we felt this wasn't particularly intuitive or efficient, and could lead to the potential for miscalculations. And while there are quite a few indicators that plot ATR bands in some form or another already on TV, we could not find one that actually performed the exact way that we wanted. They all had at least one of the following gaps:
The ATR offset was not configurable (usually hard-coded to be based off the high or low, while we generally prefer to use close)
It would only print a single band (either the upper or lower), which would require the same indicator to be added twice
The ATR scaling factor was either not configurable or only stepped in whole numbers (often time fractional factors like 1.5 yield better results)
To that end, we took to making this enhanced version to meet all of the above requirements. While we were doing so, we decided to take this opportunity to also make some non-functional enhancements as well:
Updated the indicator to the most recent version of Pine
Updated the indicator definition to allow alternate (non-chart) timeframe usage
Made the input types explicitly defined to improve consistency
Updated the inputs with appropriate minimum values and step sizes where appropriate
Separated settings into logical groups
Added helptext to the indicator settings noting usage and common settings values
Explicitly titled the on-chart plots of the ATR bands so that they can more easily be identified and referenced in other indicators/scripts, as well as the Data Window
Food for thought : When looking at some of the behaviors of these ATR bands, you can see that when price first levels out, you can draw a "consolidation zone" from the first peak of the upper ATR band to the first valley of the lower ATR band that price will generally respect. Look for price to break and close outside of that zone. When that happens, price will usually (but not always) make a notable move in that direction, which can be used as either a potential trigger or as an additional confluence with other indicators/price action.
Finally, while we have made what we feel are some noteworthy updates and enhancements to this indicator, and have every intention of continuing to do so as we find worthy opportunities for enhancement, credit is still due to the original author: AlexanderTeaH

Trending Bollinger Bands by SiddWolfBollinger Bands are mostly used for trend reversal. I believe they should be used for Trend Continuation and Trend Confirmation.
In this Trending Bollinger Bands script you will see two bands drawn on chart. The Upper band is suggestive of Uptrend and Lower Band is suggestive of Downtrend Market. It just provides the guidance of where the market is now and where it is headed. It is not to be used as a standalone indicator. Use this to confirm your hypothesis of Uptrend or Downtrend.
Bollinger Bands Trend
When the price crosses the moving average it is interpreted as the price is gonna continue in that direction. But most of the time it is a fake breakout. With this script you get an additional confirmation so that you know it is not a fake breakout and the price have caught the trend.
Bollinger Bands Reversal:
This indicator can also work for reversal. For example when price closes outside the outer bands, it is most likely that the trend is gonna reverse. Don't just enter the trade wait for some other confirmation as reversal trading is more complicated.
Confluence:
Confluence is the key factor for profitable trading. Don't use this indicator as standalone indicator instead combine it with other indicators and price action. Like the divergence occurring when the price is outside the bands is suggestive of trend reversal. I have created a non-delay, non-repaint indicator for finding divergence. I'd soon publish that script. Stay tuned.
Settings is the Key:
Try to play around with the settings. It is a simple yet effective indicator. Change the moving average type or length. I've found moving average RMA or WMA works better than SMA. Find the best setting that works with your setup. Set the Band Source as High/Low to make the outer bands more extreme.
Conclusion:
This is my first script but it isn't my last. I've created quite a few gems that I'm gonna publish soon. If you have any questions or suggestions feel free to comment below. I'd love to connect with you. Thank you.

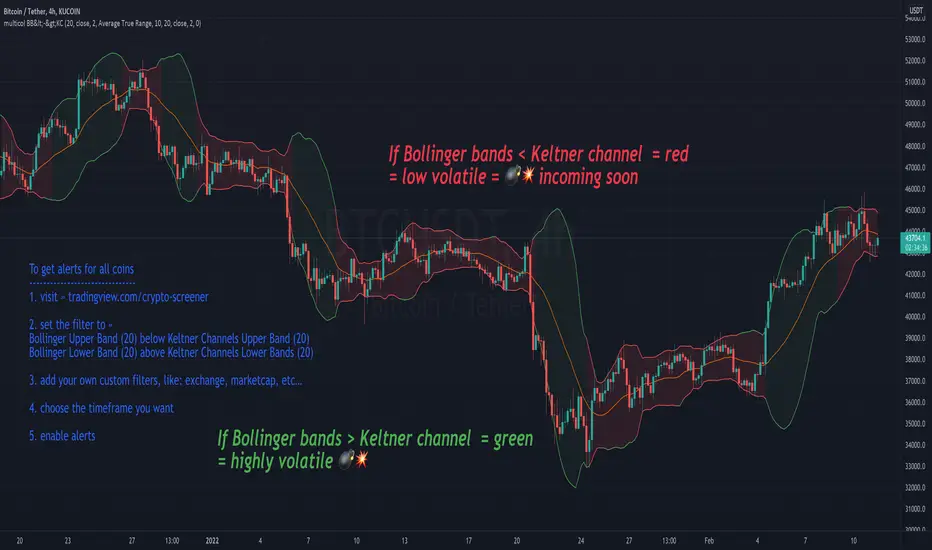
multicolor Bollinger Bands (BB <-> KC)Concept:
After every low volatile phase comes a high volatile phase and after every high volatile phase comes a low volatile phase.
If the Bollinger bands are smaller then the Keltner channel (colored red), the price action is low in volatility… meaning a breakout (colored green) will happen soon.
If Bollinger band is bigger than the Keltner channel = green
If Bollinger band is smaller than the Keltner channel = red
Displaying the Keltner Channel is optional
If multicolor BB is disabled, BB color = blue (default color)
Customise colors to your liking under settings -> style
-----------------------------------
To get alerts for all coins
1. visit » tradingview.com/crypto-screener
2. set the filter to »
Bollinger Upper Band (20) below Keltner Channels Upper Band (20)
Bollinger Lower Band (20) above Keltner Channels Lower Bands (20)
3. add your own custom filters, like: exchange, marketcap, etc…
4. choose the timeframe you want
5. enable alerts
Vector CPR Bands## Overview
The Vector CPR Bands indicator enhances the classic Central Pivot Range (CPR) by incorporating "vector" detection—identifying periods with above-average or climactic volume. It projects CPR ranges from these high-volume periods forward as visual bands, which act as persistent support/resistance zones until invalidated by price action. Ideal for spotting key levels in trending or ranging markets, especially on higher timeframes like weekly or monthly.
## Key Features
- **CPR Calculation**: Plots previous, developing (non-repainting), and repainting CPR with mid-pivot, TC (top central), and BC (bottom central) lines, plus fills.
- **Vector Detection**: Scans for high-volume bars in the anchor timeframe (default weekly). Flags "above-average" (≥1.5x avg) or "large" (≥2x avg or max climax).
- **Band Projection**: Creates bands from vector-qualified CPR periods. Extends them rightward until touched/revisited (configurable: invalidate on wick/close, delete or freeze/gray out).
- **Customization**:
- Timeframe: Set CPR anchor (e.g., 'W' for weekly, 'M' for monthly).
- Display: Toggle CPR types, pivot guides.
- Volume Thresholds: Adjust lookback and ratios.
- De-clutter: Limit max bands, pin to period start, always extend.
- **Alerts & Signals**: Built-in alerts for developing pivot crossing previous pivot (bullish/bearish).
## How to Use
1. Add to chart and set anchor timeframe (e.g., 'M' for monthly vCPR on BTC, as shown in example charts).
2. Watch bands as S/R: Virgin (untested) bands often provide strong bounces; mitigated ones fade.
3. Combine with volume/price action: Bullish bands suggest upside bias, especially if price holds above.
4. Example: On BTC weekly, vector bands from high-volume weeks highlight multi-month zones—breaks signal shifts.

Trendy Bands + Reversal SignalsTrendy Bands + Reversal Signals
This is a versatile and powerful TradingView indicator that combines a dual Bollinger Bands system with momentum-based reversal signals. It's designed to help traders identify the prevailing trend, potential volatility expansions/contractions, and key reversal points in the market.
Core Concept: The indicator uses two sets of Bollinger Bands with different standard deviation settings to create a "band within a band" structure. This visual setup makes it easier to gauge trend strength and spot potential breakouts or breakdowns. Additionally, it calculates a custom momentum oscillator to generate early warnings for potential trend reversals.

ATR Money Line Bands V2The "ATR Money Line Bands V2" is a clever TradingView overlay designed for trend identification with volatility-aware bands, evolving from basic ATR envelopes.
Reasoning Behind Construction: The core idea is to blend a smoothed trend line with dynamic volatility bands for reliable signals in varying markets. The "Money Line" uses linear regression (ta.linreg) on closes over a length (default 16) instead of a moving average, as it fits data via least-squares for a cleaner, forward-projected trend without lag artifacts. ATR (default 12-period) powers the bands because it measures true range volatility better than std dev in gappy assets like crypto/stocks—bands offset from the Money Line by ATR * multiplier (default 1.5). A dynamic multiplier (boosts by ~33% on spikes > prior ATR * 1.3) prevents tight bands from false breakouts during surges. Trend detection checks slope against an ATR-scaled tolerance (default 0.15) to ignore noise, labeling bull/bear/neutral—avoiding whipsaws in flats.
Properties: It's an overlay with a colored Money Line (green bull, red bear, yellow neutral) and invisible bands (toggle to show gray lines) filled semi-transparently matching trend for visual pop. Dynamic adaptation makes bands widen/contract intelligently. An info table (positionable, e.g., top_right) displays real-time values: Money Line, bands, ATR, trend—great for quick scans. Limits history (2000 bars) and labels (500) for efficiency.
Tips for Usage: Apply to any timeframe/asset; defaults suit medium-term (e.g., daily stocks). Watch color flips: green for longs (enter on pullbacks to lower band), red for shorts (vice versa), yellow to sit out. Use bands as S/R—breakouts signal momentum, squeezes impending vol. Tweak length for sensitivity (shorter for intraday), multiplier for width (higher for trends), tolerance for fewer neutrals. Pair with volume/RSI for confirmation; backtest to optimize. In choppy markets, disable dynamic mult to avoid over-expansion. Overall, it's adaptive and visual—helps trend-follow without overcomplicating.


Bridge Bands ATR (Overlay) ShaneHurst-Adaptive Volatility Bands
A fractal-inspired evolution of Bollinger and Keltner bands that adapts dynamically to both volatility and trend persistence.
This indicator estimates the Hurst exponent (H) — a measure of market memory — and adjusts a standard volatility band to lean in the direction of the prevailing trend.
When H > 0.5, markets exhibit persistence (trending behavior); the bands shift in the trend’s direction.
When H < 0.5, markets are mean-reverting; the bands flatten and recent extremes become potential fade zones.
Band width scales with recent volatility (σ), expanding in turbulent conditions and contracting during calm periods.
Key Features:
Adaptive offset using the Hurst exponent
Volatility-sensitive width for dynamic market regimes
EMA baseline with directional bias
Clear visual separation between trending and choppy phases
Inspired by Benoit Mandelbrot’s The Misbehavior of Markets and H.E. Hurst’s original work on long-term memory in time series.
Use it to identify regime shifts, trend-following entries, and volatility-adjusted stop levels.
Credit for this script goes to a number of people including Steve B, MichaalAngle, doc and joecat808. 500 day DEMA (double EMA) can be used as a longer term momentum line.

Bull Market Support Band (20W SMA + 21W EMA)🟩 Bull Market Support Band (20W SMA + 21W EMA)
OVERVIEW
The Bull Market Support Band is a long-term trend indicator that combines the 20-week SMA and 21-week EMA.
When price is above the band → bullish trend.
When below → bearish trend.
When within → neutral or transition phase.
This v6 version adds full customization, dynamic coloring, event labels, candle coloring, and a configurable on-chart legend table with trend arrows.
HOW IT WORKS
Calculates the 20W SMA and 21W EMA from a user-selectable higher timeframe (weekly by default).
Plots both averages and shades the area between them to form the support band.
The fill and line colors change automatically based on the market phase:
🟩 Green = Bullish (price above)
🟥 Red = Bearish (price below)
⬜ Gray = Neutral (price within).
Labels appear only when the trend state changes.
Alerts trigger when price crosses the band or either moving average.
Optional candle coloring applies the same bull/bear/neutral logic to price bars.
A convenience legend table displays current 20W SMA and 21W EMA values, along with slope arrows (^, v, =).
INCLUDED FEATURES
Configurable calculation timeframe.
Automatic band fill and line coloring.
Optional candle coloring overlay.
Compact or detailed regime-change labels.
ATR-based label offset and spacing control.
Customizable legend table with background color.
Horizontal or vertical legend layout.
Custom arrow characters (ASCII or Unicode).
Built-in alerts for band and MA crosses.
Optimized for higher-timeframe accuracy using request.security().
USAGE TIPS
Keep the default weekly setting for macro trend context.
On lower chart timeframes, use the band as higher-level support/resistance.
Combine with momentum or volume indicators (RSI, MACD, OBV) for confirmation.
Adjust ATR multiplier to move labels further from price candles.
Increase “Min bars between labels” to reduce visual clutter.
Disable auto-coloring if you prefer a static color theme.
Toggle compact legend or switch between horizontal/vertical layouts for best fit.
INTERPRETATION GUIDE
🟩 Bullish: Price above the band → trend continuation likely.
⬜ Neutral: Price within the band → consolidation or potential reversal zone.
🟥 Bearish: Price below the band → downtrend continuation or distribution.
Sustained closes above or below the band typically align with major market cycle shifts.
NOTES
Uses request.security() for higher-timeframe precision — accurate even on smaller charts.
The legend table is screen-anchored and remains fixed as you pan or zoom.
Plots and labels are price-anchored and move with candles.
Lightweight and efficient for all markets and intervals.
CREDITS
Original concept: The Bull Market Support Band (popularized in crypto analysis).
Enhanced Pine Script v6 version: Ricco .
Modernized for clarity, flexibility, and multi-timeframe accuracy.
SUMMARY
A modern, customizable Bull Market Support Band indicator highlighting long-term market regimes with clean visuals, color logic, and convenience features.
Designed for traders seeking macro clarity, minimal clutter, and professional presentation.

EQ + Bandas Pro 📊 EQ + Bands Pro is an advanced indicator built on OHLC analysis. It calculates a synthetic equilibrium price and plots dynamic, robust bands that adapt to volatility while filtering outliers. The tool highlights zones of overvaluation and undervaluation, helping traders identify key imbalances, potential reversals, and trend confirmations.

oscillator fast cryptosmart (Bands on Scale)The oscillator fast cryptosmart is a high-sensitivity momentum indicator designed to generate signals more rapidly than many traditional oscillators, such as the MACD. It is engineered to detect potential price breakouts by analyzing short-term market cycles.
At its core, the indicator uses a Detrended Price Oscillator (DPO) to remove the longer-term trend from price action, allowing it to focus purely on the underlying momentum cycles. It then calculates dynamic volatility bands around this oscillator line.
Signals are generated when momentum breaks out from a normal range, providing traders with an early warning of a potential acceleration in price.
How to Interpret the Signals:
Buy Signal (Green Vertical Line): A buy signal is generated when the oscillator's main line (yellow) crosses above its upper statistical band. This indicates a sharp surge in positive momentum, suggesting a potential upward move is beginning.
Sell Signal (Red Vertical Line): A sell signal is generated when the oscillator's main line crosses below its lower statistical band. This indicates a significant increase in negative momentum, suggesting a potential downward move is starting.
By focusing on momentum breakouts rather than lagging moving average crossovers, the oscillator fast cryptosmart aims to provide an edge in identifying opportunities in fast-moving markets.

Double Median ATR Bands | MisinkoMasterThe Double Median ATR Bands is a version of the SuperTrend that is designed to be smoother, more accurate while maintaining a good speed by combining the HMA smoothing technique and the median source.
How does it work?
Very simple!
1. Get user defined inputs:
=> Set them up however you want, for the result you want!
2. Calculate the Median of the source and the ATR
=> Very simple
3. Smooth the median with √length (for example if median length = 9, it would be smoothed over the length of 3 since 3x3 = 9)
4. Add ATR bands like so:
Upper = median + (atr*multiplier)
Lower = median - (atr*multiplier)
Trend Logic:
Source crossing over the upper band = uptrend
Source crossing below the lower band = downtrend
Enjoy G´s!

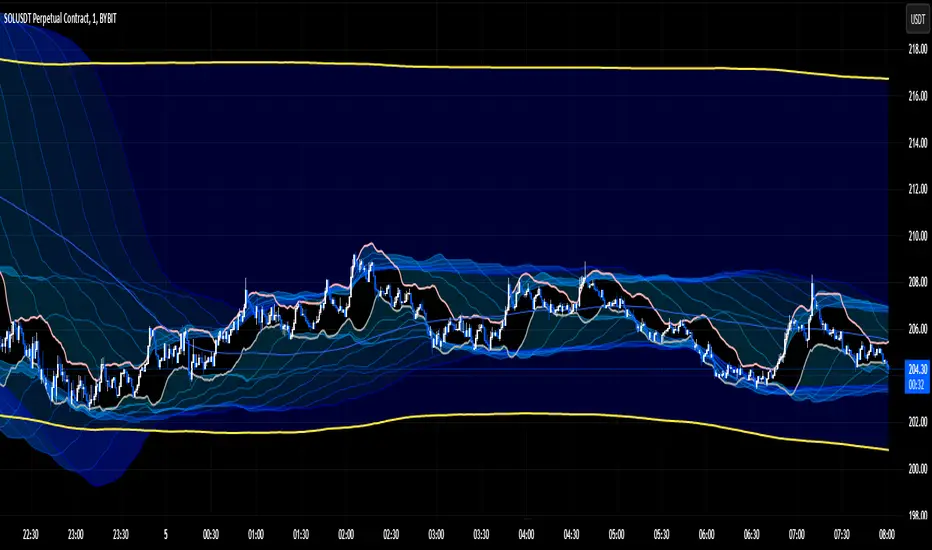
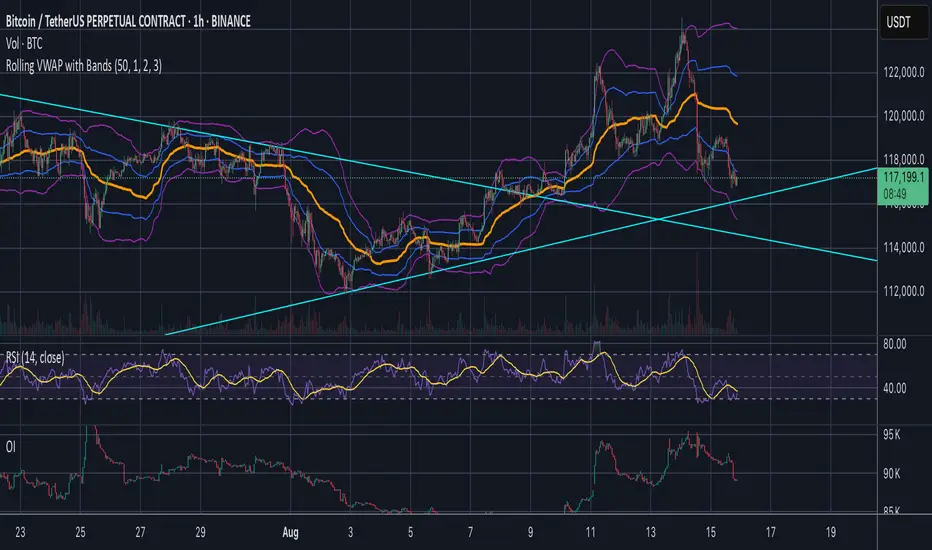
Jose's Rolling VWAP with BandsRolling VWAP with Customizable Deviation Bands
This indicator plots a rolling Volume Weighted Average Price (VWAP) over a user-defined lookback period, rather than resetting each day or from a fixed anchor point. The rolling calculation makes it act more like a moving average — but weighted by volume — providing a smoother, more adaptive central price line.
It also includes up to three optional deviation bands, which can be independently toggled on/off and assigned their own multipliers. These bands are calculated using the chosen lookback’s standard deviation, giving traders a quick visual of price dispersion around VWAP.
Features:
Adjustable rolling VWAP lookback length
Up to 3 customizable standard deviation bands
Individual checkboxes for enabling/disabling each band
Independent multiplier control for each band
Works on any timeframe and symbol
Uses:
Identify overextended price moves relative to VWAP
Spot dynamic support/resistance zones
Gauge mean reversion opportunities
Confirm trend strength when price hugs or breaks away from VWAP
VWAP with Prev. Session BandsVWAP with Prev. Session Bands is an advanced indicator based on TradingView’s original VWAP. It adds configurable standard deviation or percentage-based bands, both for the current and previous session. You can anchor the VWAP to various timeframes or events (like Sessions, Weeks, Months, Earnings, etc.) and selectively show up to three bands.
The unique feature of this script is the ability to display the VWAP and bands from the previous session, helping traders visualize mean reversion levels or historical volatility ranges.
Built on top of the official TradingView VWAP implementation, this version provides enhanced flexibility and visual clarity for intraday and swing traders alike.
