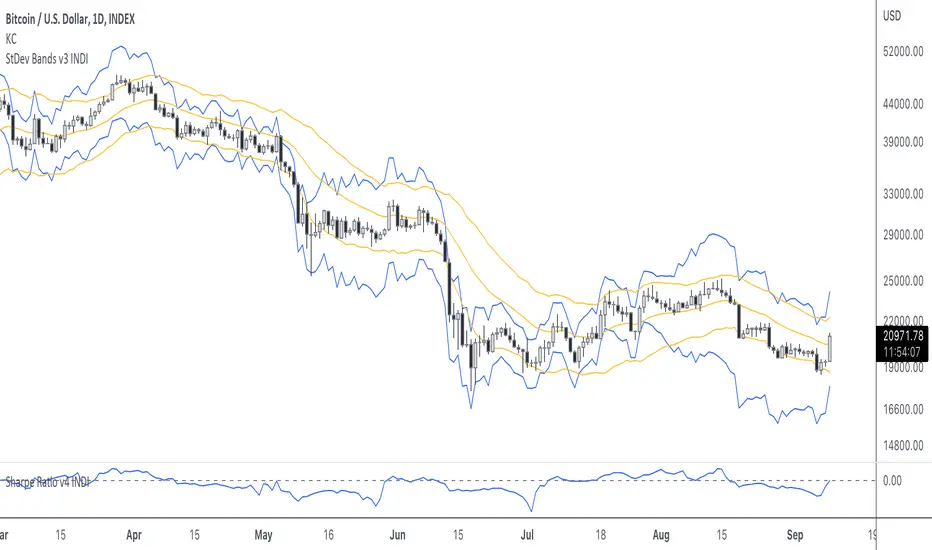
StDev BandsThis is a "bands"-type indicator. It was developed out of my Sharpe Ratio indicator . It uses the standard deviation of returns as basis for drawing the bands. I'm going to update this indicator as the other indicator evolves. Please be sure you know how to calculate Sharpe Ratio and check out the Sharpe Ratio indicator as well. This will help you understand the purpose of this indicator a bit more.
As a very short introduction. Many investors use the standard deviation of returns as risk measurement . I admit the defaults of this indicator aren't perfect. Normally investors use the standard deviation over a 1 year period. Traditional finance uses 265 days, and because crypto never sleeps, we could use 365. I defaulted it to 20.
"band"に関するスクリプトを検索
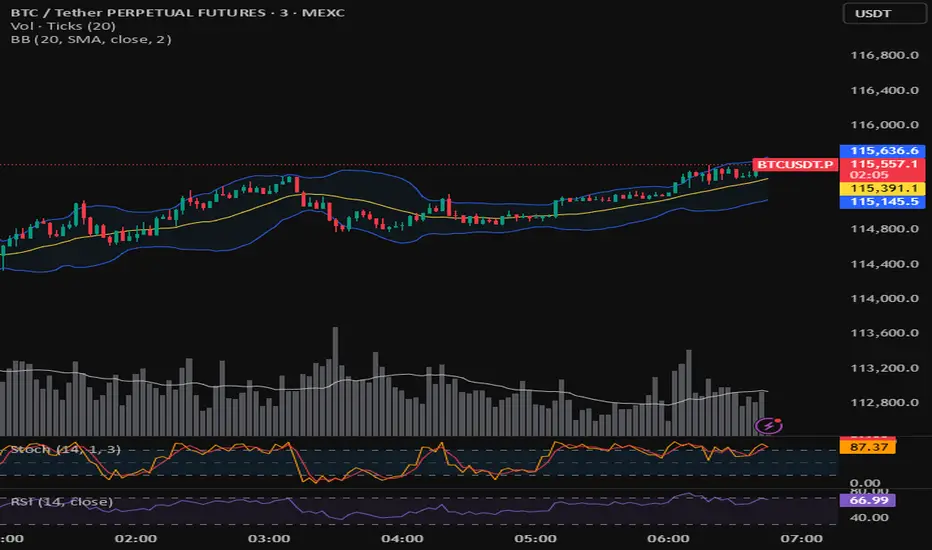
Bollinger Bands + EMA 9A 1 minute scalping strategy.
Uses Bollinger Bands (no basis line) and a 9 period EMA.
Waits for price to close below the lower Bollinger Band and the next candle to close bullish above the lower Bollinger Band but below the 9 Period EMA.
If all conditions are met, the script enters a long position with TP at the 9 Period EMA.

Accumulation/Distribution Bands & Signals (BTC, 1D, BITSTAMP) This is an accumulation/distribution indicator for BTC/USD (D) based on variations of 1400D and 120D moving averages and logarithmic regression. Yellow plot signals Long Term Accumulation, which is based on 1400D (200W) ALMA, orange plot signals Mid Term Accumulation and is based on 120D ALMA, and finally the red plot signals Long Term Distribution that's based on log regression. It should be noted that for red plot to work BTC 1D BITSTAMP graph must be used, because the function of the logarithmic regression was modified according to the x axis of the BITSTAMP data.
Signal bands have different coefficients; long term accumulation (yellow) and and the log regression (red) plots have the highest coefficients and mid term accumulation (orange) has the lowest coefficients. Coefficients are 6x, 3x and 1.5x for the red (sell) and yellow (buy) plots and 1x, 2x and 3x for the orange (buy) plot. Selling coefficient for the yellow and the orange plots are respectively 2x and 1x. Buy and sell signals are summed up accordingly and plotted at the top of the highest band.
Acknowledgement: Credits for the logarithmic regression function are due @memotyka9009 and Benjamin Cowen

Corpus Bollinger BandsThis is a copy of the build-in indicator, but as addition, it shows the distance between upper and lower band in percentage.
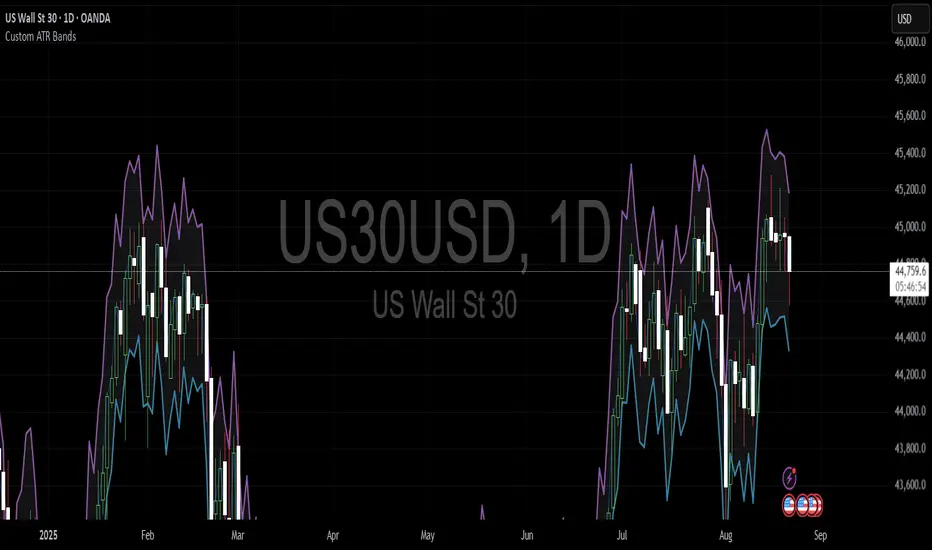
Custom ATR BandsThis indicator provides a customisable, easy to view band around the price, based on the ATR. The ATR length and multiplier can be adjusted.

Weighted Regression Bands (Zeiierman)█ Overview
Weighted Regression Bands is a precision-engineered trend and volatility tool designed to adapt to the real market structure instead of reacting to price noise.
This indicator analyzes Weighted High/Low medians and applies user-selectable smoothing methods — including Kalman Filtering, ALMA, and custom Linear Regression — to generate a Fair Value line. Around this, it constructs dynamic standard deviation bands that adapt in real-time to market volatility.
The result is a visually clean and structurally intelligent trend framework suitable for breakout traders, mean reversion strategies, and trend-driven analysis.
█ How It Works
⚪ Structural High/Low Analysis
At the heart of this indicator is a custom high/low weighting system. Instead of using just the raw high or low values, it calculates a midline = (high + low) / 2, then applies one of three weighting methods to determine which price zones matter most.
Users can select the method using the “Weighted HL Method” setting:
Simple
Selects the single most dominant median (highest or lowest) in the lookback window. Ideal for fast, reactive signals.
Advanced
Ranks each bar based on a composite score: median × range × recency. This method highlights structurally meaningful bars that had both volatility and recency. A built-in Kalman filter is applied for extra stability.
Smooth
Blends multiple bars into a single weighted average using smoothed decay and range. This provides the softest and most stable structural response.
⚪ Smoothing Methods (ALMA / Linear Regression)
ALMA provides responsive, low-lag smoothing for fast trend reading.
Linear Regression projects the Fair Value forward, ideal for trend modeling.
⚪ Kalman Smoothing Filter
Before trend calculations, the indicator applies an optional Kalman-style smoothing filter. This helps:
Reduce choppy false shifts in trend,
Retain signal clarity during volatile periods,
Provide stability for long-term setups.
⚪ Deviation Bands (Dynamic Volatility Envelopes)
The indicator builds ±1, ±2, and ±3 standard deviation bands around the fair value line:
Calculated from the standard deviation of price,
Bands expand and contract based on recent volatility,
Visualizes potential overbought/oversold or trending conditions.
█ How to Use
⚪ Trend Trading & Filtering
Use the Fair Value line to identify the dominant direction.
Only trade in the direction of the slope for higher probability setups.
⚪ Volatility-Based Entries
Watch for price reaching outer bands (+2σ, +3σ) for possible exhaustion.
Mean reversion entries become higher quality when far from Fair Value.
█ Settings
Length – Lookback for Weighted HL and trend smoothing
Deviation Multiplier – Controls how wide the bands are from the fair value line
Method – Choose between ALMA or Linear Regression smoothing
Smoothing – Strength of Kalman Filter (1 = none, <1 = stronger smoothing)
-----------------
Disclaimer
The content provided in my scripts, indicators, ideas, algorithms, and systems is for educational and informational purposes only. It does not constitute financial advice, investment recommendations, or a solicitation to buy or sell any financial instruments. I will not accept liability for any loss or damage, including without limitation any loss of profit, which may arise directly or indirectly from the use of or reliance on such information.
All investments involve risk, and the past performance of a security, industry, sector, market, financial product, trading strategy, backtest, or individual's trading does not guarantee future results or returns. Investors are fully responsible for any investment decisions they make. Such decisions should be based solely on an evaluation of their financial circumstances, investment objectives, risk tolerance, and liquidity needs.

Double Bollinger Bands MTF and Price projectionI did this script because I wanted to project prices over future bars quickly because I am a options trader.
Options:
Time frame: Default is Chart
Some times I prefer using 15 m with period 200 on a daily chart in a fast moving market. But you can chose what suites you
BB inner deviation 1 is default
When BB inner deviation=1 the outer will be 2X if its 0.5 outer will be 1
Moving Average type : Default EMA
Project next bar in label Default is off
This will calculate a linear projection of price of each band for the number of bars requested and print them in the label. It does not plot the future values
Using: in a trending market the prices will be generally be between band1 and band 2
and other times between -band1 and +band1. The projection can assist in optimal option strategy. Also in a fast moving market I would use 10 period ema for accurate price projections and others 20

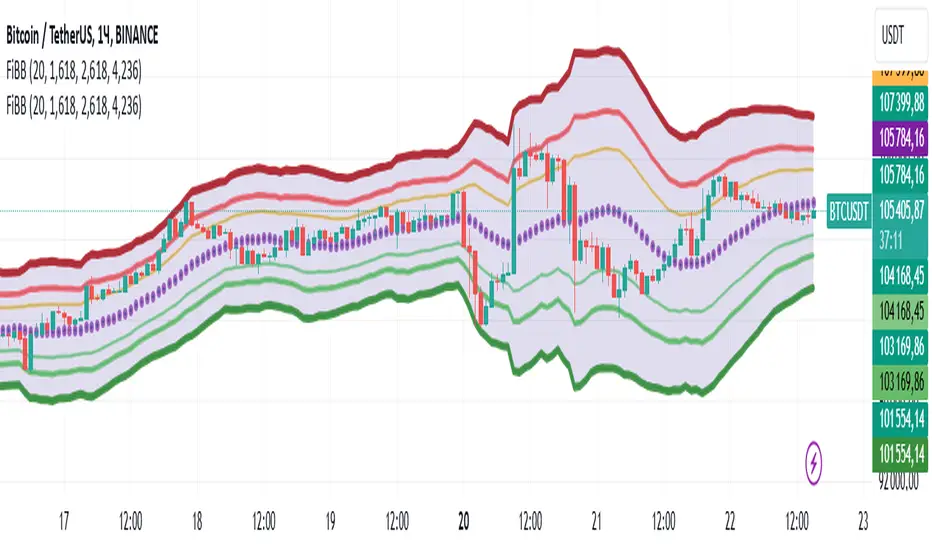
Bollingers Bands Fibonacci ratios_copy of FOMOBollinger Bands Fibonacci Ratios (FiBB)
This TradingView script is a powerful tool that combines the classic Bollinger Bands with Fibonacci ratios to help traders identify potential support and resistance zones based on market volatility.
Key Features:
Dynamic Fibonacci Levels: The script calculates additional levels around a Simple Moving Average (SMA) using Fibonacci ratios (default: 1.618, 2.618, and 4.236). These levels adapt to market volatility using the Average True Range (ATR).
Customizable Parameters: Users can modify the length of the SMA and the Fibonacci ratios to fit their trading strategy and time frame.
Visual Representation: The indicator plots three upper and three lower bands, with color-coded transparency for easy interpretation.
Central SMA Line: The core SMA line provides a baseline for price movement and trend direction.
Shaded Range: The script visually fills the area between the outermost bands to highlight the overall range of price action.
How to Use:
Use the upper bands as potential resistance zones and the lower bands as potential support zones.
Look for price interactions with these levels to identify opportunities for breakout, trend continuation, or reversal trades.
Combine with other indicators or price action analysis to enhance decision-making.
This script is ideal for traders who want a unique blend of Fibonacci-based analysis and Bollinger Bands to better navigate market movements.
Bollinger Bands with Squeeze and SMA Indicator Description: BB+SMA
Overview:
Bollinger Bands (BB): Computes and plots three bands based on a selected moving average type (SMA, EMA, SMMA (RMA), WMA, VWMA) and standard deviation multiplier. The bands indicate potential support and resistance levels relative to price volatility.
Squeeze Condition: Detects periods of low volatility (squeeze) when the distance between the upper and lower Bollinger Bands narrows significantly. This condition can signal potential price breakouts.
Simple Moving Average (SMA): Calculates and plots a simple moving average based on user-defined length. It smooths price data to highlight trends and potential reversals.
Smoothing Line: Further enhances the SMA by applying different smoothing methods (SMA, EMA, SMMA (RMA), WMA, VWMA) over a specified smoothing length. It helps in identifying smoother trends and changes in direction.
Key Components:
Inputs: Users can adjust parameters such as Bollinger Bands length, type of moving average, standard deviation multiplier, squeeze condition length, squeeze threshold percentage, SMA length, smoothing method, and smoothing length.
Plotting: Displays the Bollinger Bands (basis, upper, lower), SMA, squeeze condition bands (basis, upper, lower), and a smoothing line on the chart.
Visualization: Utilizes different colors and line styles for clarity in visualizing each component's plot on the chart.
Purpose:
Helps traders identify potential price volatility, trend reversals, and breakout opportunities using Bollinger Bands, SMA, squeeze conditions, and smoothed moving averages.
Enhances technical analysis by providing clear visual cues for trend strength and potential entry/exit points based on the specified parameters.
Conclusion:
The "BB+SMA" indicator integrates multiple technical analysis tools into a single script, offering traders a comprehensive approach to analyzing price movements and making informed trading decisions directly on TradingView charts.

Kelbol Bands @shrilss The Kelbol Bands are designed to provide traders with insights into price volatility and potential trend reversal points. By combining Bollinger Bands (BB) and Keltner Channels (KC), this indicator offers a versatile approach to analyzing market dynamics.
Key Features:
- Customizable Parameters: The indicator allows traders to adjust parameters such as BB Length, BB Multiplier, KC Length, KC Multiplier, and ATR Length to suit their trading preferences and strategies.
- Timeframe Flexibility: Traders can select different timeframes for calculating Bollinger Bands and Keltner Channels independently, enhancing adaptability to various market conditions.
- Visual Representation: The indicator plots Upper, Basis (Midline), and Lower Kelbol Bands, as well as Upper, Basis, and Lower Keltner Channels and Bollinger Bands separately. This visual representation aids traders in identifying potential support and resistance levels, as well as trend direction.
- Toggle Display: Users have the option to toggle the visibility of each component individually, providing flexibility in focusing on specific aspects of price action.
Calculation Method:
- Bollinger Bands (BB) are calculated based on the selected BB Length and BB Multiplier. The upper and lower bands are derived from the simple moving average (SMA) of the price and the standard deviation of the price series.
- Keltner Channels (KC) are determined using the selected KC Length, KC Multiplier, and ATR Length. The basis (midline) of the channel is derived from the SMA of the price, while the upper and lower channels are calculated based on the average true range (ATR).
- Kelbol Bands (KBL) are a combination of Bollinger Bands and Keltner Channels. The upper, basis, and lower bands of KBL are calculated as the averages of the corresponding values of Bollinger Bands and Keltner Channels.

RSI Bands + Levels (Miu)This indicator was designed to plot lines from prices of overbought (OB) and oversold (OS) RSI levels in chart. It will also create a visible band between these levels.
It's main utility is to show in chart current and past prices for OB/OS RSI levels. Traditionally the RSI is considered overbought when above 70 and oversold when below 30 but you can customize these values in settings. The RSI oscillates between zero and 100.
Users can easily identify overbought and oversold prices using this indicator and then it is expected to help users to make better strategic decisions with their trades.
There are some extra options available in settings:
- Customizable RSI levels
- Customizable RSI length
- RSI Levels: if activated, it will draw lines above OB line and below OS line according to the multiplier, so it will plot sequential lines that goes in different RSI levels (e.g: RSI 72, 74, 76, 78 and 80).
- Backgroud only: it will remove these lines and keep only a backgroung color instead
- RSI 50: it will draw a line as RSI 50
- Customizable multiplier
Enjoy!

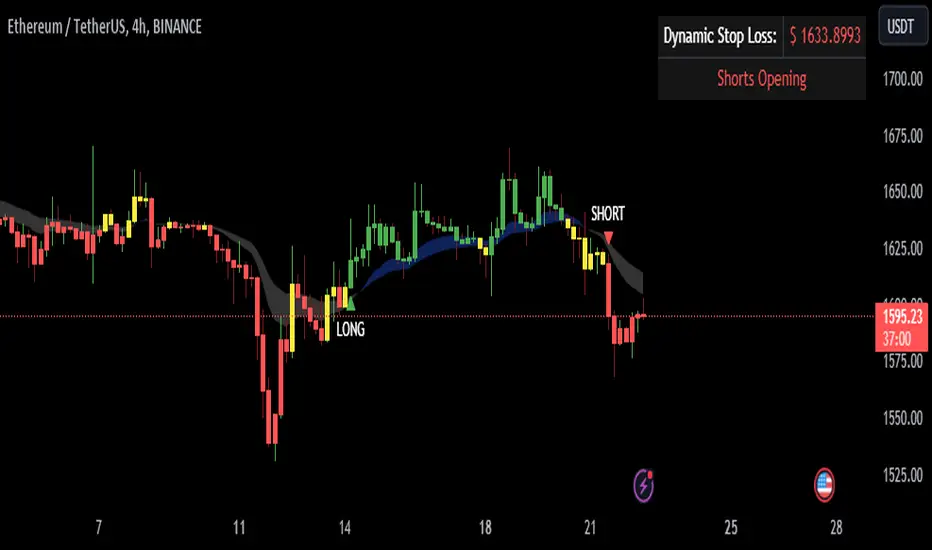
Ichimoku MA BandsThis indicator is based on the price average of the Ichimoku Strategy taking into account the last twenty five bars.
The blue band represents an upward momentum whereas the white band represents a downward momentum.
The red line is the 50 EMA which is used as a dynamic support resistance level for this strategy.
This indicator also has alerts that can be enabled by the user.
Disclaimer :
The current script should be used in confluence with other trading strategies and not in isolation. The scripts works best on 5M and 15M Timeframes and should be used with caution on lower timeframes.
This indicator is not intended to give exact entry or exit points for a trade but to provide a general idea of the trend & determine a good range for entering or exiting the trade. Please DYOR
Credit & References :
This script uses the default technical analysis reference library provided by PineScript (denoted as ta)
Bollinger Bands Lab - by InFinitoVariation of the Moving Average Lab that includes Bollinger Bands functionality for any manually created Moving Average. It includes:
- Standard Deviations for any MA
- Fixed Symmetrical Deviations for any MA that remain at a constant % away from the MA
- The same Moving Average creation settings from the Moving Average Lab
"The Moving Average Lab allows to create any possible combination of up to 3 given MAs. It is meant to help you find the perfect MA that fits your style, strategy and market type.
This script allows to average, weight, double and triple multiple types and lengths of Moving Averages
Currently supported MA types are:
SMA
EMA
VWMA
WMA
SMMA (RMA)
HMA
LSMA
DEMA
TEMA
Features:
- Double or Triple any type of Moving Average using the same logic used for calculating DEMAs and TEMAs
- Average 2 or 3 different types and lengths of Moving Average
- Weight each MA manually
- Average up to 3 personalized MAs
- Average different Moving Averages with different length each "
The preview screenshot shows:
- The combination of:
- 200 LSMA - Weight: 1
- 200 HMA - Weight: 2
- 200 VWMA - Weight: 1 - Double
- The regular Bollinger Band setting, 2 standard deviations
- Two fixed symmetrical deviations at 15% and 20% away from the XMA
Bollinger Bands - Breakout StrategyThe Bollinger Bands - Breakout Strategy is a trend-following optimized for short-term trading in the crypto market. This strategy employs the Bollinger Bands, a widely recognized technical indicator, as its primary instrument for pinpointing potential trades. It is capable of executing both long and short positions, depending on whether the market is in a spot or futures, and is particularly effective in trending markets.
The strategy boasts a high degree of configurability, allowing users to set the Bollinger Bands period and deviation, trend filter, volatility filter, trade direction filter, rate of change filter, and date filter. Furthermore, it offers options for Take Profit, Stop Loss, and Trailing Stop for both long and short positions, ensuring a comprehensive risk management approach. The inclusion of a maximum intraday loss feature adds another layer of protection, making this strategy a valuable tool for traders seeking a professional and adaptable trading system.
Name : Bollinger Bands - Breakout Strategy
Category : Trend Follower based on Bollinger Bands
Operating mode : Long and Short on Futures or Long on Spot
Trade duration : Intraday
Timeframe : 2H, 3H, 4H, 5H
Market : Crypto
Suggested usage : Trending Markets
Entry : When the price crosses above or below the Bollinger Bands
Exit : Opposite Cross or Profit target, Trailing stop or Stop loss
Configuration :
- Bollinger Bands period and deviation
- Trend Filter
- Volatility Filter
- Trade direction filter
- Rate of Change filter
- Date Filter (for backtesting purposes)
- Take Profit, Stop Loss and Trailing Stop for long and short positions
- Risk Management: Max Intraday Loss
Backtesting :
⁃ Exchange: BINANCE
⁃ Pair: BTCUSDT.P
⁃ Timeframe: 4H
⁃ Fee: 0.025%
⁃ Slippage: 1
- Initial Capital: 10000 USDT
- Position sizing: 10% of Equity
- Start : 2019-09-19 (Out Of Sample from 2022-12-23)
- Bar magnifier: on
Credits :
- LucF of Pine Coders for f_security function to avoid repainting using security.
- QuantNomad for Monthly Table.
Disclaimer : Risk Management is crucial, so adjust stop loss to your comfort level. A tight stop loss can help minimise potential losses. Use at your own risk.
How you or we can improve? Source code is open so share your ideas!
Leave a comment and smash the boost button!
Thanks for your attention, happy to support the TradingView community.

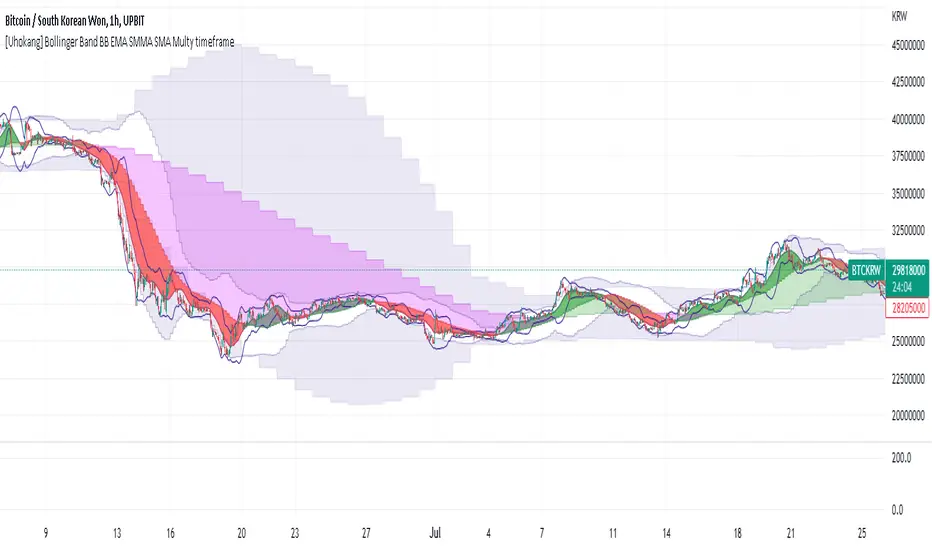
[Uhokang] Bollinger Band BB EMA SMMA SMA Multy timeframeYou can view indicators from the specified upper timeframe together.
( Bollinger Bands, SMMA, EMA, SMA )
If it is based on a 1-hour bar, you can see indicators for 4-hour bars and 1-day bars at the same time.
=> =>
Minutes
1 => 5 => 30
2 => 10 => 60
3 => 15 => 90
4 => 20 => 120
5 => 30 => 120
6 => 30 => 120
10 => 60 => 240
15 => 60 => 240
30 => 120 => 480
45 => 180 => 450
over Hours
1 => 4 => D
2 => 8 => 2D
3 => 12 => 3D
4 => D => W
D => W => M
W => M => Y
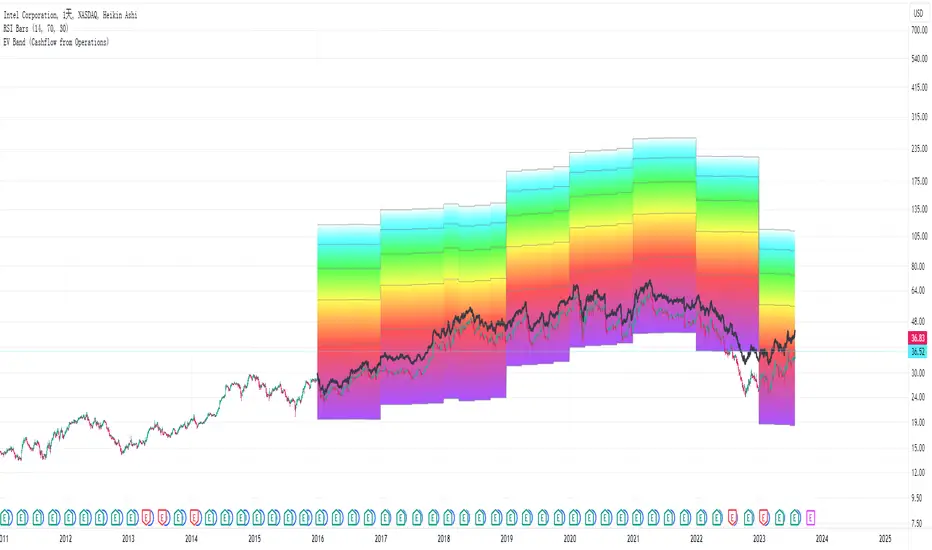
Enterprise Value on Earnings / FCF / FFO Band Enterprise Value per Diluted Share plotted as black line.
Bands start at 5x and stops at 30x, each represents a 5x increment.
Band Options (per Diluted Share, Fiscal Year):
①Free Cash Flow
②Operating Income
③Adjusted Funds from Operations
④Core Earnings
where:
AFfO = FFO - Unusual Income/Expenses + Tax Distortion (dafault 25% tax rate)
Core Earnings = Net Income - Unusual Income/Expenses + Tax Distortion (default 25% tax rate)
These two adjustments are coarse and watered-down, so take them with a grain of salt.
For professional assessments of Core Earnings versus GAAP Earnings you may go to David Trainer at Great Speculations(costs money). I am unaffiliated with these entities.
Tips:
①③ are unapplicable to financials.
③ may work for REIT-like companies whose depreciation is mostly overstated(e.g. hydro-elec utility companies whose dams typically don't wear out in ten years; companies with assets that APPRECIATE in reality but they D&A them anyway).
Probably none works for cyclicals, especially extreme boom-bust cyclicals such as oil, aluminum & shipping etc.
Beware unnaturally low (dividend_payout+buyback)/net_income ratio as some majority shareholders may funnel money to themselves/cronies at the expense of small shareholders.
Disclaimer: Use at your own discretion. No guarantees for any accuracy or usefulness. If you decide to use it, I take no responsibility whatsoever for any consequences. Does not constitute financial advice. Past performance is not Indicative of future results.
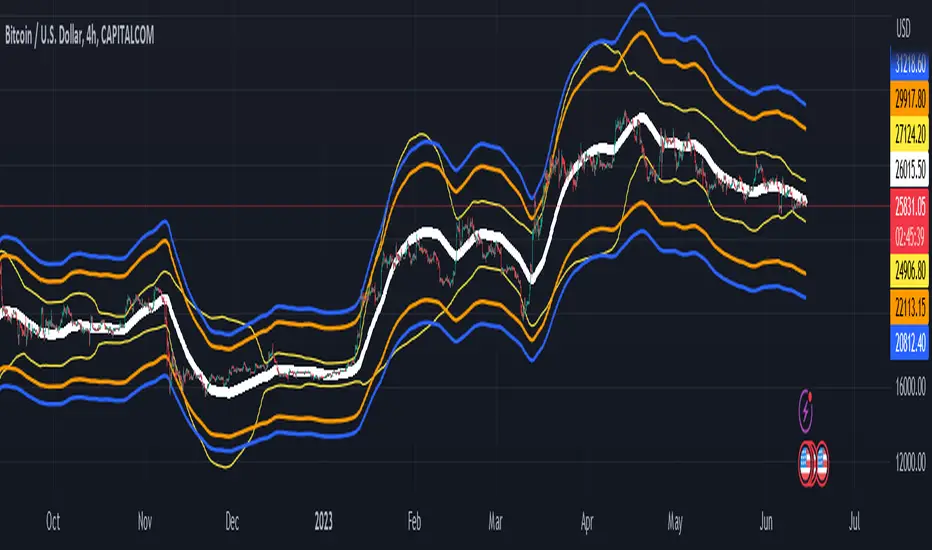
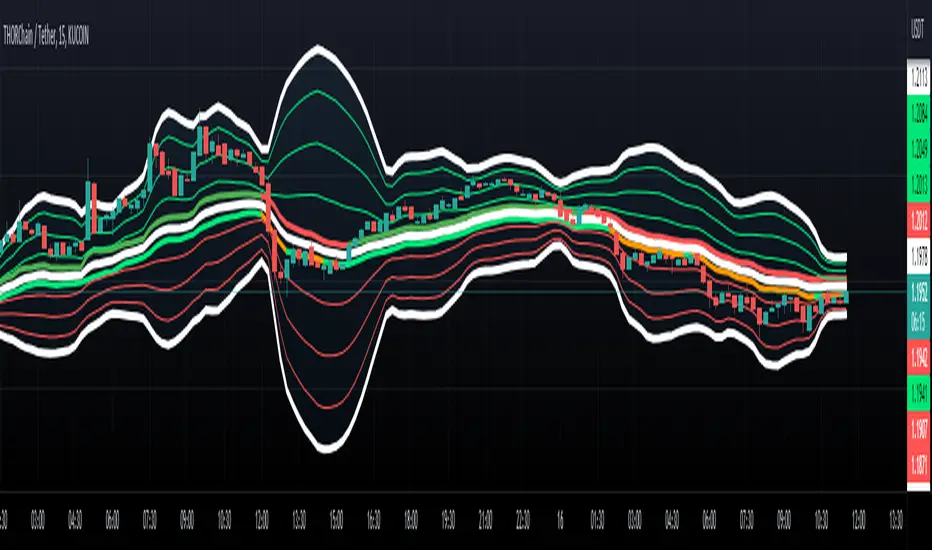
VWMA Fibonacci Bands (VFIBs)This is a momentum indicator , utilizing Volume Weighted Moving Averages (VWMAs), Average True Range (ATR), and Fibonacci Levels.
This indicator can be used in most, if not all, financial markets. I have personally found it to be most useful in mid or large cap stocks, index funds, and cryptocurrencies in the top 25 by market cap. I have not tested this indicator in Forex markets, but I imagine that it would function well there, too.
The idea behind proper use of this indicator centers around mean reversion. If price is low compared to previous price action, mean reversion implies that it is likely to revert back to the mean, over time. If price is high, it implies that it will move lower. Generally, the different period VWMAs (center lines) will act as support when in an uptrend and resistance when in a downtrend. Additionally, it is rare for price to go above the upper bounds or lower bounds of the Fibonacci Bollinger Bands . Price action doing so may indicate a potential short or long position, respectively.
This indicator is intended to be used in tandem with the oscillator 'VFIBs Agreement', to be published shortly.
As we can see in the chart, the 50 week VWMA has been acting as resistance and recently dipped down to the bottom range of the band, only to bounce back. Holding above the 50 VWMA might indicate a bullish reversal, treating it as support moving forward.

Fibonacci Bollinger Band ClusterThis indicator creates moving averages based on Fibonacci numbers (3-233, divided by 10 to average) sourced by high, low, and ohlc4 and plots lines based on these three. The Fib MA High line is either green or red (Fib High < Close), the Fib MA Low line is either lime or orange (Fib Low < Close), and the Fib MA OHLC4 line is constantly white. A cluster or series of Bollinger Bands is then created using the Fib MA OHLC4 line as the basis. Fibonacci-based deviations (1, 2, 3, 5, 8) are then used to create three upper and three lower Bollinger lines.
Bollinger Bands %B using HMAThe built-in Bollinger Band %b script modified to use the Hull Moving Average as the basis.
Hull Moving Averages have much less lag than a regular moving average.
Do not assume that regular BB interpretation rules apply to this.
This is an experimental indicator at this time.

Bollinger Bands with HMAThe built-in Bollinger Band script modified to use the Hull Moving Average as the basis.
Hull Moving Averages have much less lag than a regular moving average.
Do not assume that regular BB interpretation rules apply to this.
This is an experimental indicator at this time.
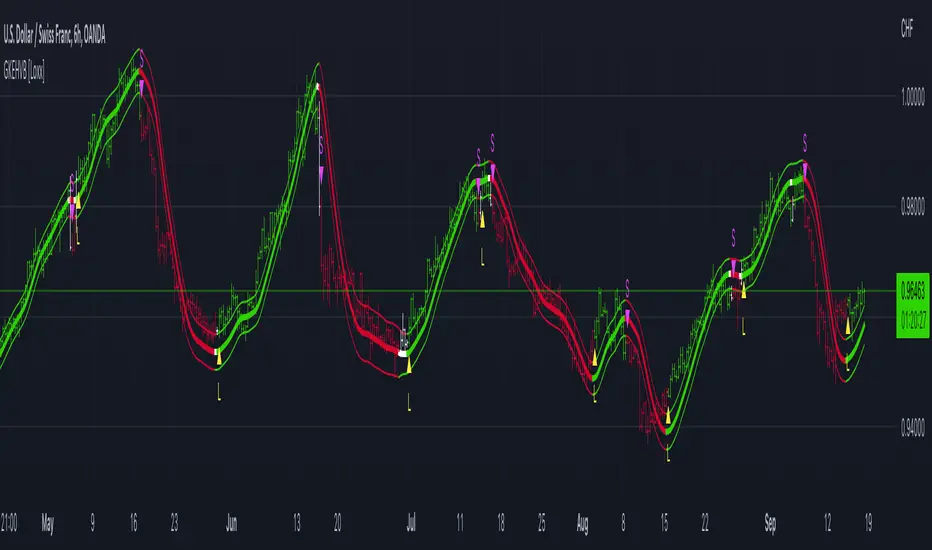
Garman-Klass-Yang-Zhang Historical Volatility Bands [Loxx]Garman-Klass-Yang-Zhang Historical Volatility Bands are constructed using:
Average as the middle line.
Upper and lower bands using the Garman-Klass-Yang-Zhang Historical Volatility Bands for bands calculation.
What is Garman-Klass-Yang-Zhang Historical Volatility?
Yang and Zhang derived an extension to the Garman Klass historical volatility estimator that allows for opening jumps. It assumes Brownian motion with zero drift. This is currently the preferred version of open-high-low-close volatility estimator for zero drift and has an efficiency of 8 times the classic close-to-close estimator. Note that when the drift is nonzero, but instead relative large to the volatility, this estimator will tend to overestimate the volatility. The Garman-Klass-Yang-Zhang Historical Volatility calculation is as follows:
GKYZHV = sqrt((Z/n) * sum((log(open(k)/close(k-1)))^2 + (0.5*(log(high(k)/low(k)))^2) - (2*log(2) - 1)*(log(close(k)/open(2:end)))^2))
The color of the middle line, unlike the bands colors, has 3 colors. When colors of the bands are the same, then the middle line has the same color, otherwise it's white.
Included
Alerts
Signals
Loxx's Expanded Source Types
Bar coloring
Related Indicators
Garman & Klass Estimator Historical Volatility Bands

Garman & Klass Estimator Historical Volatility Bands [Loxx]Garman & Klass Estimator Historical Volatility Bands are constructed using:
Average as the middle line.
Upper and lower bands using the Garman & Klass Estimator Historical Volatility (instead of "regular" Historical Volatility ) for bands calculation.
What is Garman & Klaus Historical Volatility?
Garman Klass is a volatility estimator that incorporates open, low, high, and close prices of a security. The Garman and Klass estimator for estimating historical volatility assumes Brownian motion with zero drift and no opening jumps (i.e. the opening = close of the previous period). This estimator is 7.4 times more efficient than the close-to-close estimator. Garman-Klass volatility extends Parkinson's volatility by taking into account the opening and closing price. As markets are most active during the opening and closing of a trading session, it makes volatility estimation more accurate. Garman and Klass also assumed that the process of price change is a process of continuous diffusion (geometric Brownian motion). However, this assumption has several drawbacks. The method is not robust for opening jumps in price and trend movements. Despite its drawbacks, the Garman-Klass estimator is still more effective than the basic formula since it takes into account not only the price at the beginning and end of the time interval but also intraday price extremums.
The Garman & Klass Estimator is as follows:
GKE = sqrt((Z/n)* sum((0.5*(log(high./low)).^2) - (2*log(2) - 1).*(log(close./open)).^2))
The color of the middle line, unlike the bands colors, has 3 colors. When colors of the bands are the same, then the middle line has the same color, otherwise it's white.
Included
Alerts
Signals
Loxx's Expanded Source Types
Bar coloring
Related indicators:
Parkinson's Historical Volatility Bands