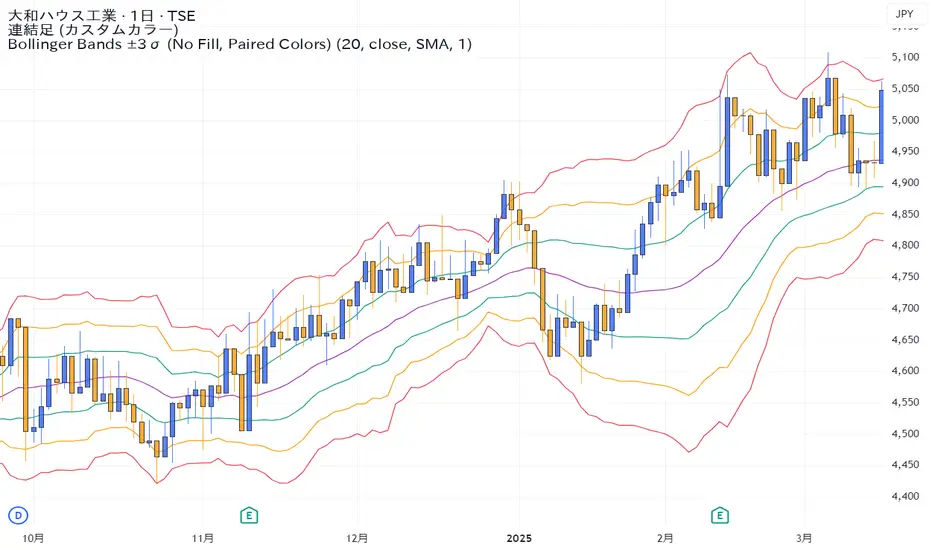
Bollinger Bands ±3σ (No Fill, Paired Colors)±3σまで1つのインジケーターで表示できるシンプルなボリンジャーバンドです。 A simple Bollinger Bands indicator that can display up to ±3σ within a single script. Pine Script® インジケーターsameamaの投稿15
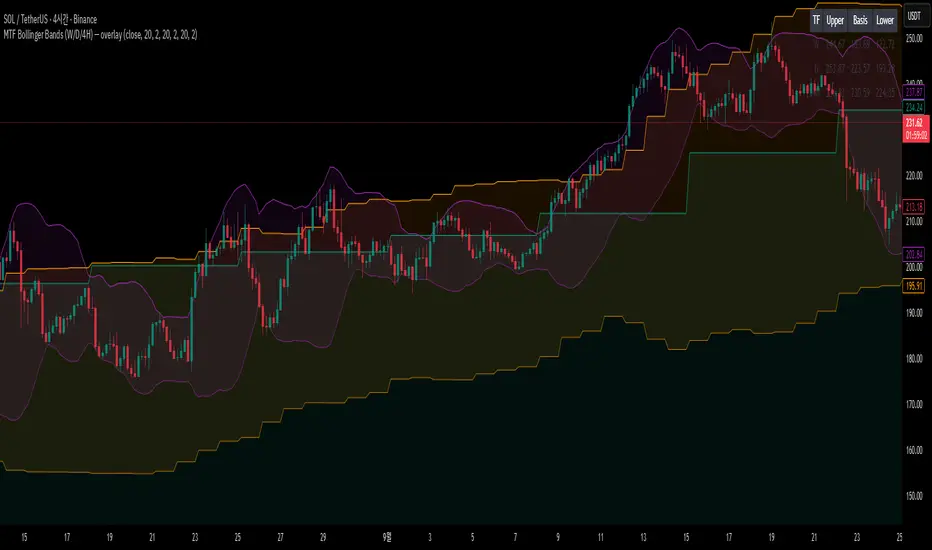
MTF Bollinger Bands (W/D/4H)MTF Bollinger Bands (W/D/4H) Always mark the 1W 1D 4H bolinger band regardless of the time frame.Pine Script® インジケーターGudals_の投稿18
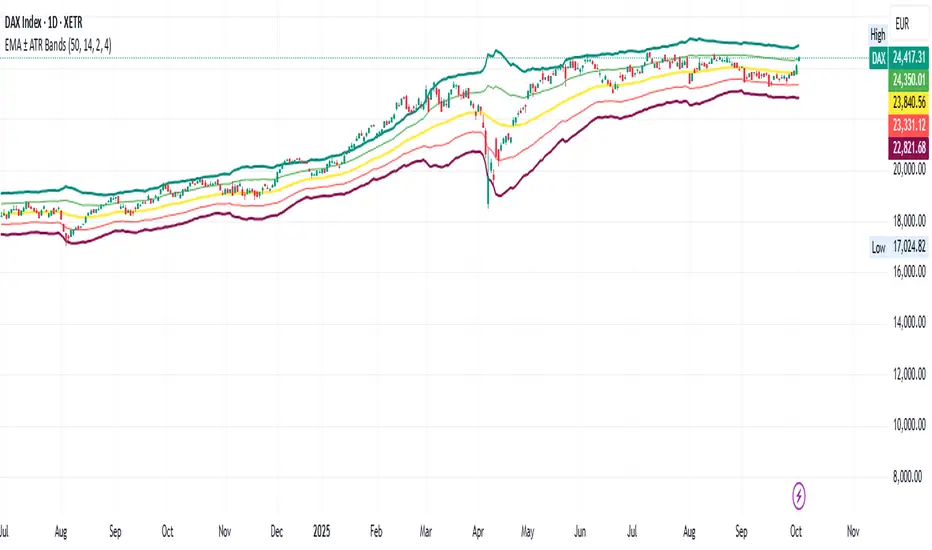
EMA ± ATR BandsPlot the bands from EMA as potential points where may want to enter/exit on principle that price returns to mean over time. This script was created using Chat GPT.Pine Script® インジケーターcode536の投稿更新済 10
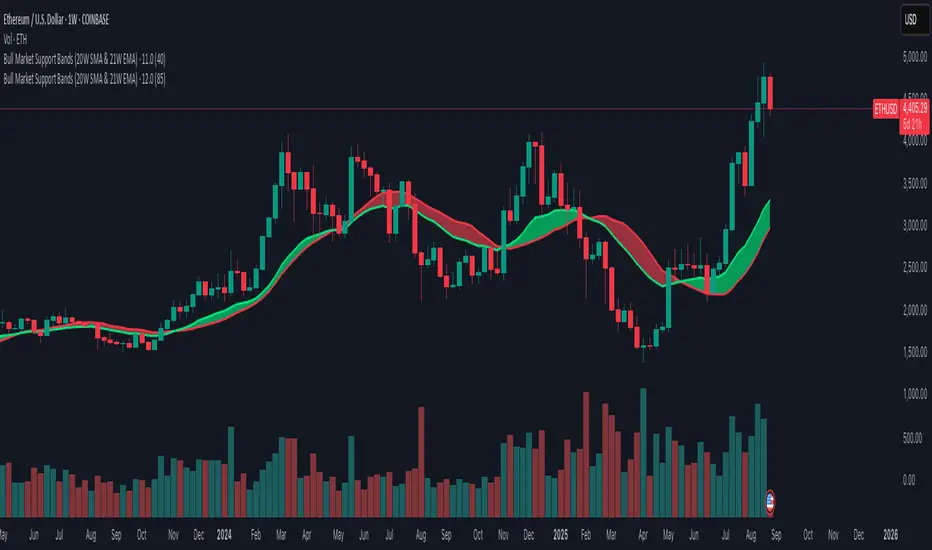
Bull Market Support Bands (20W SMA & 21W EMA)This indicator plots the 20-week Simple Moving Average (SMA) and the 21-week Exponential Moving Average (EMA), together forming the Bull Market Support Bands (BMSB). Fully compatible with any chart; values are calculated using the weekly timeframe, even if applied on daily charts. Adjustable band transparency in settings. Includes optional alerts when EMA crosses above/below SMA. Pine Script® インジケーターkd06の投稿87
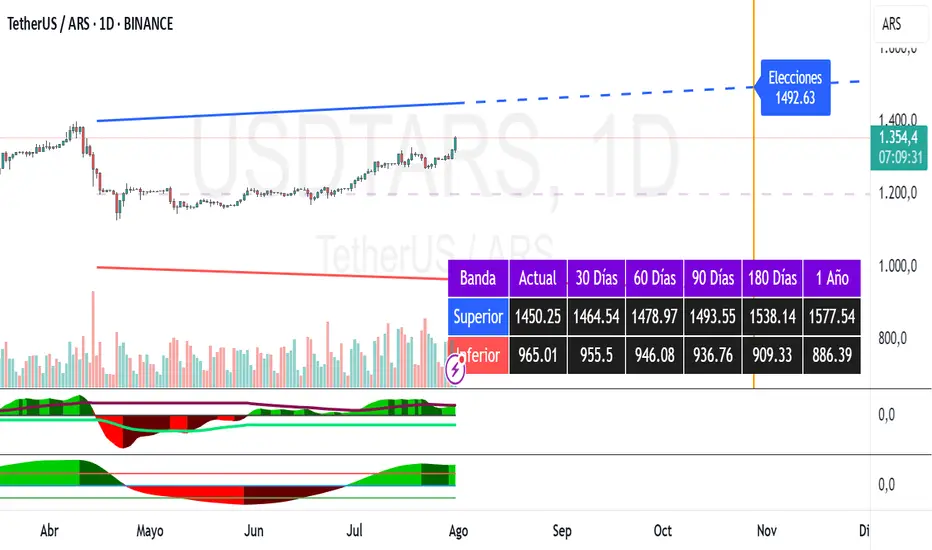
Dollar Bands [TNI]This script shows divergences bands implemented by Argentine Goverment this year for the Argentine Currency USDARS. You can change the fix monthly and date/price init, and create upper or lower band cross alerts.Pine Script® インジケーターwgustavoの投稿更新済 9
SYMPL Reversal BandsThis is an expansion of the Hybrid moving average. It uses the same hybrid moving code from the hybrid moving average script with an additional layer using the ta.hma function for some slight additional smoothing. Colors of the bands change dynamically based of the long and short hybrid moving averages running in the background. This can be really helpful in identifying periods to short bounces or long dips. Below is the explanation of the hybrid moving average Hybrid Moving Average Market Trend System - , designed to visualize market trends using a combination of three moving averages: FRAMA (Fractal Adaptive Moving Average), VIDYA (Variable Index Dynamic Average), and a Hamming windowed Volume-Weighted Moving Average (VWMA). Key Features: FRAMA Calculation: FRAMA adapts to market volatility by dynamically adjusting its smoothing factor based on the fractal dimension of price movement. This allows it to be more responsive during trending periods while filtering out noise in sideways markets. The FRAMA is calculated for both short and long periods VIDYA with CMO: The VIDYA (Variable Index Dynamic Average) is based on a Chande Momentum Oscillator (CMO), which adjusts the smoothing factor dynamically depending on the momentum of the market. Higher momentum periods result in more responsive averages, while low momentum periods lead to smoother averages. Like FRAMA, VIDYA is calculated for both short and long periods. Hamming Windowed VWMA: This VWMA variation applies a Hamming window to smooth the weighting of volume across the calculation period. This method emphasizes central data points and reduces noise, making the VWMA more adaptive to volume fluctuations. The Hamming VWMA is calculated for short and long periods, offering another layer of adaptability to the hybrid moving average. Hybrid Moving Averages: Dynamic Coloring and Filling: The script uses dynamic color transitions to visually distinguish between bullish and bearish conditions:Pine Script® インジケーターCmo22の投稿8
Bollinger Bands Width TresholdsBasic Bollinger Bands Bandwidth. I added dashed lines to indicate the 6%/9% treshold where it's likely to squeeze.Pine Script® インジケーターUnknownUnicorn21946291の投稿35
MTF RSI MA System + Adaptive BandsMTF RSI MA System + Adaptive Bands Overview MTF RSI MA System + Adaptive Bands is a highly customizable Pine Script indicator for traders seeking a versatile tool for multi-timeframe (MTF) analysis. Unlike traditional RSI, it focuses on the Moving Average of RSI (RSI MA), delivering smoother and more flexible trading signals. The main screenshot displays the indicator in two panels to showcase its diverse capabilities. Important: Timeframes do not adjust automatically – users must manually set them to match the chart’s timeframe. Features Core Component: Built around RSI MA, not raw RSI, for smoother trend signals. Multi-Timeframe: Analyze RSI MA across three customizable timeframes (default: 4H, 8H, 12H). Adaptive Bands: Three band calculation methods (Fixed, Percent, StdDev) for dynamic signals. Flexible Signals: Generated via RSI MA crossovers, band interactions, or directional alignment across timeframes. Background Coloring: Highlights when RSI MAs across timeframes move in the same direction, aiding trend confirmation. Screenshot Panels Configuration Upper Panel: Shows RSI, RSI MA, and fixed bands for reversal strategies (RSI crossing bands). Lower Panel: Displays three RSI MAs (Alligator-style) for trend-following, with background coloring for directional alignment. Band Calculation Methods The indicator offers three ways to calculate bands around RSI MA, each with unique characteristics: Fixed Bands Set at a fixed point value (default: 10) above and below RSI MA. Example: If RSI MA = 50, band value = 10 → upper band = 60, lower = 40. Use Case: Best for stable markets or fixed-range preferences. Tip: Adjust the band value to widen or narrow the range based on asset volatility. Percent Bands Calculated as a percentage of RSI MA (default: 10%). Example: If RSI MA = 50, band value = 10% → upper band = 55, lower = 45. Use Case: Ideal for assets with varying volatility, as bands scale with RSI MA. Tip: Experiment with percentage values to match typical price swings. Standard Deviation Bands (StdDev) Based on RSI’s standard deviation over the MA period, multiplied by a user-defined factor (default: 10). Example: If RSI MA = 50, standard deviation = 5, factor = 2 → upper band = 60, lower = 40. Important: The default value (10) may produce wide bands. Reduce to 1–2 for tighter, practical bands. Use Case: Best for dynamic markets with fluctuating volatility. Configuration Options RSI Length: Set RSI calculation period (default: 20). MA Length: Set RSI MA period (default: 20). MA Type: Choose SMA or EMA for RSI MA (default: EMA). Timeframes: Configure three timeframes (default: 4H, 8H, 12H) for MTF analysis. Overbought/Oversold Levels: Optionally display fixed levels (default: 70/30). Background Coloring: Enable/disable for each timeframe to highlight directional alignment. How to Use Add Indicator: Load it onto your TradingView chart. Setup: Reversals: Configure like the upper panel (RSI, RSI MA, bands) and watch for RSI crossing bands. Trends: Configure like the lower panel (three RSI MAs) and look for fastest MA crossovers and background coloring. Adjust Timeframes: Manually set tf1, tf2, tf3 (e.g., 1H, 2H, 4H on a 1H chart) to suit your strategy. Adjust Bands: Choose band type (Fixed, Percent, StdDev) and value. For StdDev, reduce to 1–2 for tighter bands. Experiment: Test settings to match your trading style, whether scalping, swing trading, or long-term. Notes Timeframes: Always match tf1, tf2, tf3 to your chart’s needs, as they don’t auto-adjust. StdDev Bands: Lower the default value (10) to avoid overly wide bands. Versatility: Works across markets (stocks, forex, crypto). Pine Script® インジケーターUncle_the_shooterの投稿40
Bollinger Bands [LePasha]Bollinger Bands : Advanced Volatility Analysis Made Simple Discover a refined take on Bollinger Bands that offers clearer market insights and deeper volatility understanding — perfect for traders seeking precision and confidence. What Is the Bollinger Bands Indicator? The Bollinger Bands indicator is a powerful, overlay chart tool designed to help traders visualize price volatility and identify potential market extremes more effectively. Unlike classic Bollinger Bands which use just two standard deviation bands, this enhanced version employs multiple deviation levels around a simple moving average (SMA) to give a richer picture of market dynamics. Key Features Multiple Deviation Bands: Instead of only ±2 standard deviations, it uses three extended levels: 2.5, 3.0, and 3.5 standard deviations to highlight subtle and extreme price movements. Color-coded Volatility Zones: Each band range is filled with translucent red or teal shades to help traders visually grasp the intensity of price moves. Customizable Length and Toggle: Adjust the length of the bands and enable or disable the indicator easily through inputs. Why Three Deviation Levels? Traditional Bollinger Bands (±2 standard deviations) cover approximately 95% of price action, but markets often present significant moves beyond this range that are important to identify for better risk management and trading decisions. The three deviation levels serve distinct purposes: Deviation Level Approximate Purpose Market Insight Provided ±2.5 SD Captures strong but fairly common moves Entry/exit trigger zones for trending moves ±3.0 SD Highlights more extreme, less frequent moves Indicates breakout strength or overextension ±3.5 SD Marks rare and extreme price deviations Signals potential reversal or exhaustion This graduated scale allows traders to differentiate between normal volatility, strong momentum, and possible exhaustion—making it easier to tailor trading decisions according to market context. How to Use Bollinger Bands Identify Volatility Zones: Observe how price interacts with the colored bands: Price touching or crossing the ±2.5 SD band may indicate a strong move is underway. Price breaching the ±3.0 or ±3.5 SD bands signals rare, extreme market conditions, which could be either a breakout or a setup for reversal. Combine With Trend Analysis: Use in conjunction with trend indicators like moving averages or volume to confirm the direction or strength of moves indicated by the bands. Adjust Your Stops and Targets: The layered bands help you set more intelligent stop losses and take profit zones by understanding how far price can reasonably stray. Visual Clarity for Market Phases: The shaded fills between bands give intuitive visual cues of volatility expansion and contraction phases. Why Traders Choose Bollinger Bands Greater Precision: More nuanced volatility detection than traditional Bollinger Bands. Visual Elegance: Soft translucent fills and clear band lines reduce clutter while delivering maximum insight. User-Friendly: Easy to toggle and adjust with minimal setup. Versatile: Effective across assets, timeframes, and trading styles. Final Thoughts The Bollinger Bands indicator is more than just a volatility tool — it's your visual guide to understanding how extreme price moves develop in real-time. Whether you’re entering new trades, managing risk, or hunting reversals, this indicator equips you with superior clarity and confidence. Add Bollinger Bands to your TradingView toolkit and see volatility like never before.Pine Script® インジケーターLePashaの投稿29
Stochastic RSI BandsStochastic RSI Bands by // © drbarry92064859 It is suggested to view this indicator on 15m or 5m timeframe with current Default Settings. This indicator is based on the StochRsi. It creates color bands based on the direction of multiple timeframe StochRsi. When the MTF StochRsi's are opposed in direction it produces darker bands and when aligned in direction it produces light bands. During Green Bands, price tends to be Bullish. During Red Bands, price tends to be Bearish. During Medium toned Bands, price action tends to be in a correction in existing HTF trend, ranging, or getting ready for reversal. During Light Bands, price tends to be in Trend in direction of color. There is usually Dark Bands on either side of a light or medium toned band. Best to enter in direction of current color, during the dark band after the medium toned bands And exit in the dark band after the light toned band. Brown bands tend to indicate reversal of direction and color. I have experimented with all the timeframes and StochRSI settings and found the best settings to be as follows. The Default settings are Middle Time Frame: 4H and Higher TimeFrame: D1. The Default StochRSI settings are 34 RSI, 21 Stochastic, 13 smooth K and 13 smooth D. It is suggested to use a lower timeframe such as 15m or 5m for entry. You can experiment with different StochRSI and TimeFrame Settings. SUGGESTED STRATEGY Dark Bands after medium toned bands: Look for an entry on lower timeframe (15m or 5m) based on reversal candlestick formations or other indicators in direction of current color. Light Bands: Do not enter during lighter bands. You should already be in trade during Light Bands Light Band changes to Dark Band: Exit Trade if already in. Look for general change of directional bias if a brown band occurs; however wait for dark band after the 2nd wide band following the brown band.Pine Script® インジケーターKaizenTraderBの投稿更新済 5531
Bollinger Bands & SuperTrend Strategy by Tradinggg HubThis TradingView Pinescript combines Bollinger Bands and a custom SuperTrend indicator to generate trading signals. Bollinger Bands: Bollinger Bands are a popular volatility indicator that consists of three lines: * Basis: A simple moving average (SMA) of the price (default length is 20 periods). * Upper Band: The basis plus a standard deviation multiplier (default is 2). * Lower Band: The basis minus a standard deviation multiplier (default is 2). These bands expand and contract as volatility increases or decreases, helping traders identify potential overbought and oversold conditions. SuperTrend: The SuperTrend indicator is a trend-following tool that aims to identify the direction of the price trend. It uses the Average True Range (ATR) to determine the volatility of the market and sets levels above and below the price to indicate potential trend reversals. How the Strategy Works: 1. Bollinger Bands: The script plots Bollinger Bands around the price, providing insight into the current volatility and potential overbought or oversold conditions. 2. SuperTrend: The script calculates and plots a custom SuperTrend indicator based on user-defined ATR period and factor. It helps visualize the current trend direction and potential trend reversals. 3. Buy Signals: A buy signal is generated when the following conditions are met: - The price crosses above the SuperTrend line. - The price is above the Bollinger Bands basis line. 4. Sell Signals: A sell signal is generated when one of the following conditions is met: - The price crosses below the SuperTrend line. - The price is below the Bollinger Bands basis line. Key Parameters: * Bollinger Bands Length: The number of periods used to calculate the basis (SMA) of the Bollinger Bands. * Bollinger Bands Multiplier: The factor used to calculate the standard deviation for the upper and lower bands. * SuperTrend ATR Period: The number of periods used to calculate the Average True Range (ATR) for the SuperTrend. * SuperTrend Factor: The factor used to determine the distance of the SuperTrend levels from the price. Customization: Feel free to experiment with different parameter values to optimize the strategy for your preferred asset and time frame. Disclaimer: This script is intended for educational and informational purposes only. It should not be considered as financial advice. Always conduct thorough research and consider your own risk tolerance before making any trading decisions. Pine Script® インジケーターSachinvadhvana91105の投稿75
Double Median SD Bands | MisinkoMasterThe Double Median SD Bands (DMSDB) is a trend-following tool designed to capture market direction in a way that balances responsiveness and smoothness, filtering out excessive noise without introducing heavy lag. Think of it like a house: A jail (too restrictive) makes you miss opportunities. No house at all (too unsafe) leaves you exposed to false signals. DMSDB acts like a comfortable house with windows—protecting you from the noise while still letting you see what’s happening in the market. 🔎 Methodology The script works in the following steps: Standard Deviation (SD) Calculation Computes the standard deviation of the selected price source (ohlc4 by default). The user can choose whether to use biased (sample) or unbiased (population) standard deviation. Raw Bands Construction Upper Band = source + (SD × multiplier) Lower Band = source - (SD × multiplier) The multiplier can be adjusted for tighter or looser bands. First Median Smoothing Applies a median filter over half of the length (len/2) to both bands. This reduces noise without creating excessive lag. Second Median Smoothing Applies another median filter over √len to the already smoothed bands. This produces a balance: Cutting the length → maintains responsiveness. Median smoothing → reduces whipsaws. The combination creates a fast yet clean band system ideal for trend detection. 📈 Trend Logic The trend is detected based on price crossing the smoothed bands: Long / Bullish (Purple) → when price crosses above the upper band. Short / Bearish (Gold) → when price crosses below the lower band. Neutral → when price remains between the bands. 🎨 Visualization Upper and lower bands are plotted as colored lines. The area between the bands is filled with a transparent zone that reflects the current bias: Purple shading = Bullish zone. Golden shading = Bearish zone. This creates a visual tunnel for trend confirmation, helping traders quickly identify whether price action is trending or consolidating. ⚡ Features Adjustable Length parameter (len) for dynamic control. Adjustable Band Multiplier for volatility adaptation. Choice between biased vs. unbiased standard deviation. Double median smoothing for clarity + responsiveness. Works well on cryptocurrencies (e.g., BTCUSD) but is flexible enough for stocks, forex, and indices. ✅ Use Cases Trend Following → Ride trends by staying on the correct side of the bands. Entry Timing → Use crossovers above/below bands for entry triggers. Filter for Other Strategies → Can serve as a directional filter to avoid trading against the trend. ⚠️ Limitations & Notes This is a trend-following tool, so it will perform best in trending conditions. In sideways or choppy markets, whipsaws may still occur (although smoothing reduces them significantly). The indicator is not a standalone buy/sell system. For best results, combine with volume, momentum, or higher-timeframe confluence. All of this makes for a really unique & original tool, as it removes noise but keeps good responsitivity, using methods from many different principles which make for a smooth a very useful toolPine Script® インジケーターMisinkoMasterの投稿64
RSI BandsOverview The RSI Bands indicator is a tool designed to calculate and display overbought, oversold, and middle bands based on the Relative Strength Index (RSI). Its primary purpose is to provide traders with a clue on whether to place limit buy or limit sell orders, or to set stop-loss orders effectively. The bands represent the price levels the asset must reach for the RSI to align with specific thresholds: Overbought Band: Displays the upper band representing the price level the asset must reach for the RSI to become overbought. Oversold Band: Displays the lower band representing the price level the asset must reach for the RSI to become oversold. Middle Band: Displays the middle band representing the price level the asset must reach for the RSI to hit the middle level. It uses both traditional RSI calculations and a dynamic period adjustment mechanism for improved adaptability to market conditions. The script also offers smoothing options for the bands. Features Calculates overbought, oversold, and middle bands using RSI values. Dynamically adjusts the RSI period based on pivot points if enabled. Offers smoothing options for the bands: EMA, SMA, or None. Customizable input parameters for flexibility. Inputs Source Value: Selects the data source (e.g., close price) for RSI calculation. Period: Sets the static RSI calculation period. Used if dynamic period is disabled. Use Dynamic Period?: Toggles the use of a dynamic RSI period. Pivot Left/Right Length: Determines the range of bars for pivot detection when using dynamic periods. Dynamic Period Multiplier: Scales the dynamically calculated RSI period. Overbought Level: RSI level that marks the overbought threshold. Oversold Level: RSI level that marks the oversold threshold. Middle Level: RSI level used as a midpoint reference. Smoothing Type: Specifies the smoothing method for the bands (EMA, SMA, or None). Smoothing Length: Length used for the selected smoothing method. Key Calculations RSI Calculation: Computes RSI using gains and losses over the specified period (dynamic or static). Incorporates a custom function for calculating RSI with dynamic periods. Dynamic Period Adjustment: Uses pivot points to determine an adaptive RSI period. Multiplies the base dynamic period by the Dynamic Period Multiplier. Band Calculation: Calculates price changes (deltas) required to achieve the overbought, oversold, and middle RSI levels. The price changes (deltas) are determined using an iterative approximation technique. For each target RSI level (overbought, oversold, or middle), the script estimates the required change in price by adjusting a hypothetical delta value until the calculated RSI aligns with the target RSI. This approximation ensures precise calculation of the price levels necessary for the RSI to reach the specified thresholds. Computes the upper (overbought), lower (oversold), and middle bands by adding these deltas to the source price. Smoothing: Applies the selected smoothing method (EMA or SMA) to the calculated bands. Plots Overbought Band: Displays the upper band representing the price level the asset must reach for the RSI to become overbought. Oversold Band: Displays the lower band representing the price level the asset must reach for the RSI to become oversold. Middle Band: Displays the middle band representing the price level the asset must reach for the RSI to hit the middle level. Usage Choose the source value (e.g., close price). Select whether to use a dynamic RSI period or a static one. Adjust pivot lengths and multipliers for dynamic period calculation as needed. Set the overbought, oversold, and middle RSI levels based on your analysis. Configure smoothing options for the bands. Observe the plotted bands and use them to identify potential overbought and oversold market conditions. Pine Script® インジケーターCrimsonVaultの投稿67
Moving Average Bands with Signals [UAlgo]The "Moving Average Bands with Signals combines various moving average types with ATR-based bands to help traders identify potential support and resistance levels. It plots moving average bands with upper and lower support/resistance levels based on the Average True Range (ATR) and user-defined settings.Additionally, the script generates buy/sell signals based on price crossing above or below the bands. 🔶 Key Features Multiple Moving Average Types: Supports various moving average calculations including Arnaud Legoux Moving Average (ALMA), Exponential Moving Average (EMA), Double Exponential Moving Average (DEMA), Triple Exponential Moving Average (TEMA), Kaufman Adaptive Moving Average (KAMA), Hull Moving Average (HMA), Least Squares Moving Average (LSMA), Simple Moving Average (SMA), Triangular Moving Average (TMA), Volume-Weighted Moving Average (VWMA), Weighted Moving Average (WMA), and Zero-Lag Moving Average (ZLMA). Customizable ATR Bands: Integrates the Average True Range (ATR) to calculate dynamic support and resistance bands around the moving average. The multiplier for the bands is user-adjustable, allowing for finer control over the sensitivity and width of the bands. Signal Generation: Provides visual signals on the chart when the price interacts with the support or resistance bands. Users can choose between using the wick or the close price to generate these signals, adding an extra layer of customization based on their trading style. Flexible Input Parameters: Allows users to input parameters for moving average length, ATR length, band multiplier, and signal type. Additional settings are available for specific moving average types, such as ALMA's offset and sigma, KAMA's fast and slow periods, and LSMA's offset. 🔶 Disclaimer This script is provided for educational purposes only and should not be considered financial advice. Trading financial instruments involves substantial risk and can result in significant financial losses. The script’s performance in the past is not indicative of future results, and no guarantees are made regarding its accuracy, reliability, or performance. Pine Script® インジケーターUAlgoの投稿11283
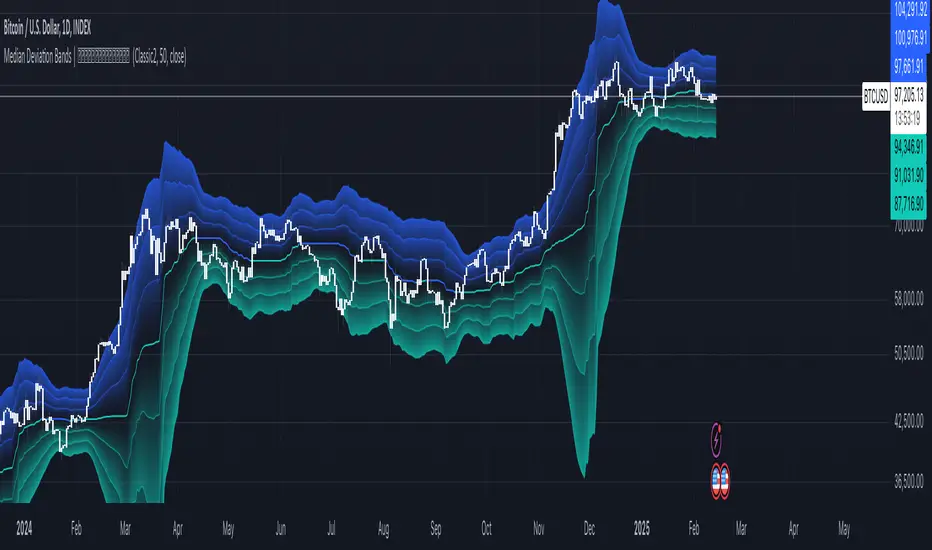
Median Deviation Bands | QuantumResearchIntroducing QuantumResearch’s Median Deviation Bands Indicator The Median Deviation Bands indicator is an advanced volatility-based tool designed to help traders identify price trends, market reversals, and potential trading opportunities. By using a percentile-based median baseline combined with standard deviation bands, this indicator provides a dynamic framework for analyzing price movements and assessing market volatility. How It Works Baseline Calculation: The median price over a user-defined period (default: 50) is calculated using the 50th percentile of price data. This serves as the central reference point for trend analysis. Trend Identification: Bullish Trend: Occurs when the price crosses above the baseline. Bearish Trend: Occurs when the price crosses below the baseline. Deviation Bands: The indicator plots three sets of upper and lower bands, representing 1x, 2x, and 3x standard deviations from the median. These bands act as dynamic support and resistance zones, helping traders identify overbought and oversold conditions. Visual Representation The Median Deviation Bands indicator offers a clear, customizable visual layout: Color-Coded Baseline: Green (Bullish): Price is above the median. Red (Bearish): Price is below the median. Deviation Bands: First Band (Light Fill): Represents 1 standard deviation from the baseline. Second Band (Medium Fill): Represents 2 standard deviations, highlighting stronger trends. Third Band (Dark Fill): Represents 3 standard deviations, showing extreme price conditions. Trend Markers: Green Up Arrows: Indicate the start of a bullish trend when price crosses above the baseline. Red Down Arrows: Indicate the start of a bearish trend when price crosses below the baseline. Customization & Parameters The Median Deviation Bands indicator includes multiple user-configurable settings to adapt to different trading strategies: Baseline Length: Default set to 50, determines the lookback period for median calculation. Source Price: Selectable input price for calculations (default: close). Band Visibility: Traders can toggle individual deviation bands on or off to match their preferences. Trend Markers: Option to enable or disable up/down trend arrows. Color Modes: Choose from eight color schemes to customize the indicator’s appearance. Trading Applications This indicator is highly versatile and can be applied to multiple trading strategies, including: Volatility-Based Trading: Price movement within and outside the bands helps traders gauge volatility and market conditions. Trend Following: The baseline and deviation bands help confirm ongoing trends. Mean Reversion Strategies: Traders can look for price reactions at extreme bands (±3 standard deviations). Final Note QuantumResearch’s Median Deviation Bands indicator provides a unique approach to market analysis by integrating percentile-based median price levels with standard deviation-based volatility bands. This combination helps traders understand price behavior in relation to historical volatility, making it a valuable tool for both trend-following and mean-reversion strategies. As always, backtesting and customization are recommended to optimize performance across different market conditions. Pine Script® インジケーターQuantumResearchの投稿更新済 625
Prime Bands [ChartPrime]The Prime Standard Deviation Bands indicator uses custom-calculated bands based on highest and lowest price values over specific period to analyze price volatility and trend direction. Traders can set the bands to 1, 2, or 3 standard deviations from a central base, providing a dynamic view of price behavior in relation to volatility. The indicator also includes color-coded trend signals, standard deviation labels, and mean reversion signals, offering insights into trend strength and potential reversal points. ⯁ KEY FEATURES AND HOW TO USE ⯌ Standard Deviation Bands : The indicator plots upper and lower bands based on standard deviation settings (1, 2, or 3 SDs) from a central base, allowing traders to visualize volatility and price extremes. These bands can be used to identify overbought and oversold conditions, as well as potential trend reversals. Example of 3-standard-deviation bands around price: ⯌ Dynamic Trend Indicator : The midline of the bands changes color based on trend direction. If the midline is rising, it turns green, indicating an uptrend. When the midline is falling, it turns orange, suggesting a downtrend. This color coding provides a quick visual reference to the current trend. Trend color examples for rising and falling midlines: ⯌ Standard Deviation Labels : At the end of the bands, the indicator displays labels with price levels for each standard deviation level (+3, 0, -3, etc.), helping traders quickly reference where price is relative to its statistical boundaries. Price labels at each standard deviation level on the chart: ⯌ Mean Reversion Signals : When price moves beyond the upper or lower bands and then reverts back inside, the indicator plots mean reversion signals with diamond icons. These signals indicate potential reversal points where the price may return to the mean after extreme moves. Example of mean reversion signals near bands: ⯌ Standard Deviation Scale on Chart : A visual scale on the right side of the chart shows the current price position in relation to the bands, expressed in standard deviations. This scale provides an at-a-glance view of how far price has deviated from the mean, helping traders assess risk and volatility. ⯁ USER INPUTS Length : Sets the number of bars used in the calculation of the bands. Standard Deviation Level : Allows selection of 1, 2, or 3 standard deviations for upper and lower bands. Colors : Customize colors for the uptrend and downtrend midline indicators. ⯁ CONCLUSION The Prime Standard Deviation Bands indicator provides a comprehensive view of price volatility and trend direction. Its customizable bands, trend coloring, and mean reversion signals allow traders to effectively gauge price behavior, identify extreme conditions, and make informed trading decisions based on statistical boundaries.Pine Script® インジケーターChartPrimeの投稿88 2.5 K
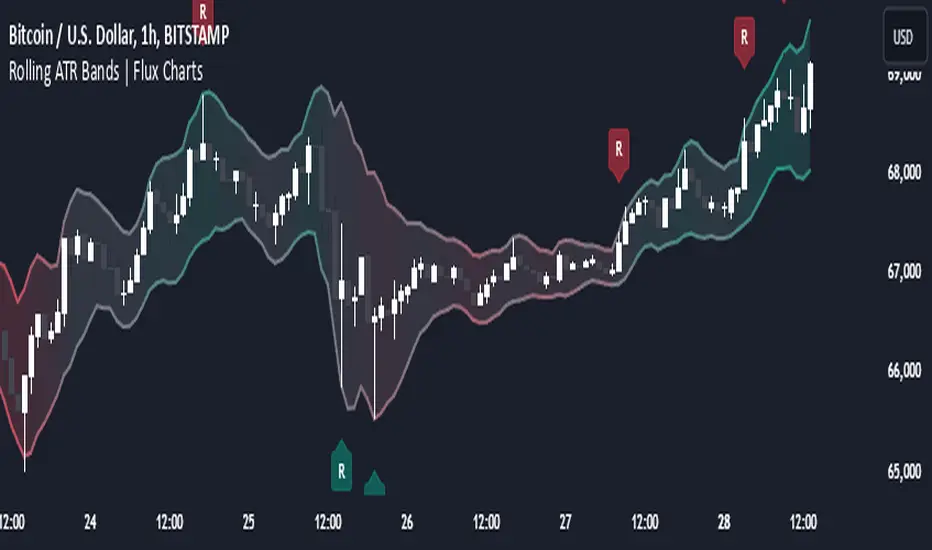
Rolling ATR Bands | Flux Charts💎 GENERAL OVERVIEW Introducing the Rolling ATR Bands indicator! This indicator overlays adaptive bands around the price, using the Average True Range (ATR) to define dynamic support and resistance levels. The Rolling ATR Bands are color-coded to visually indicate potential trend strength, shifting between bearish, neutral, and bullish colors. This tool can help traders interpret price volatility, as well as identify probable trend changes, continuations, or reversals. For more information about the process, check the "HOW DOES IT WORK ?" section. Features of the new Rolling ATR Bands: ATR Bands With Customizable ATR Length & Multiplier Smooth Trend Strength With Adjustable Smoothing Options Color-coded bands Representing Bearish, Neutral, or Bullish Trends Alerts for Retests & Breaks Customizable Visuals 📌 HOW DOES IT WORK? The Rolling ATR Bands indicator calculates the ATR based on the specified length and multiplier to form upper and lower bands around the price. These bands adapt with market volatility, widening during high volatility and contracting during lower volatility periods. In addition, the indicator calculates a "trend strength" score by combining an interpolated RSI, Supertrend, and EMA crossover. This score is smoothed with a customizable length, and a color gradient is applied to visually denote the strength of bearish, neutral, or bullish conditions. Here's how to interpret the bands: Upper Band: Acts as dynamic resistance; when price approaches or touches it, this often suggests potential overbought conditions. Lower Band: Acts as dynamic support; touching or nearing this band might indicate potential oversold conditions. Color Shifts: Color changes indicate shifts in trend direction. For example, a green color suggests a bullish trend, while red hints at bearish tendencies. 🚩 UNIQUENESS What sets the Rolling ATR Bands apart is the combined use of interpolated RSI, Supertrend, and EMA cross values, creating a weighted trend strength score. This integration allows for nuanced, color-coded visual cues that respond quickly to trend changes without excessive noise, offering traders an intuitive view of both trend direction and potential momentum. You can also set up alerts for retest & alerts for upper and lower bands to get informed of potential movements. ⚙️ SETTINGS 1. General Configuration ATR Length : Controls the ATR calculation length for the bands. Smoothing: Adjusts the trend strength smoothing to control sensitivity to trend changes. ATR Multiplier : Sets the width of the bands by multiplying the ATR value. Trend Smoothing : Higher settings will result in longer periods of time required for trend to change direction from bullish to bearish and vice versa.Pine Script® インジケーターfluxchartの投稿66 2.3 K
Dynamic Trend Bands [ChartPrime]The Dynamic Trend Bands is a versatile trend-following indicator that uses a double-smoothed Hull Moving Average (HMA) to detect market trends, combined with dynamic bands that provide insight into potential momentum shifts and volatility-based price zones. ⯁ KEY FEATURES Double HMA Trend Filter Utilizes a double-smoothed HMA for a smoother and more responsive trend line, reducing noise while highlighting clear market trends. float base = ta.hma(ta.hma(close, length - 10), length) Dynamic Volatility Bands Plots upper and lower bands based on volatility, positioned above the price in a downtrend and below the price in an uptrend. Momentum Shift Detection Highlights bars in orange when a potential momentum shift occurs: - During a downtrend, if the high breaks above the upper band. - During an uptrend, if the low breaks below the lower band. Customizable Band Appearance Users can adjust the size, distance, and colors of the bands, as well as choose whether to display the mid-band line and fill the area between bands. Timeframe Flexibility Allows selection of different calculation timeframes, enabling traders to adapt the indicator to various trading strategies. ⯁ HOW TO USE Identify Trend Direction Use the double HMA line to confirm the prevailing trend: - Above the bands: downtrend. - Below the bands: uptrend. Spot Potential Momentum Shifts Watch for orange-highlighted bars signaling potential reversals or weakening trends. Optimize Entries and Exits Enter trades on trend continuation signals while using band breaks to spot potential reversal zones. Customize to Fit Your Strategy Adjust the bands’ size, distance, and calculation timeframe to suit scalping, swing, or position trading. ⯁ CONCLUSION The Dynamic Trend Bands is an all-in-one tool that helps traders assess trend strength, detect momentum shifts, and identify key price zones. Its customizable features make it adaptable for various trading styles and market conditions.Pine Script® インジケーターChartPrimeの投稿11 1.6 K
Price Extreme BandsPrice Extreme Bands Description This indicator calculates and displays Price Extreme Bands based on an Exponential Moving Average (EMA) and True Range Average True Range (TR ATR). It utilizes a custom "Super Smoother" function to smooth the bands, providing a clearer representation of potential price extremes without sacrificing accuracy. Usage Built for specifically for intraday timeframes, this indicator identifies short term price extremes and volatility ranges. Traders can observe when price moves towards the outer bands, suggesting strong momentum or potential overbought/oversold conditions. The filled zones highlight areas of increased volatility which can used as exit criteria for a trade, possible reversal points in ranging markets or price ranges where price momentum could slow in trending markets. Key Features Length Input: Controls the length of the EMA and TR ATR calculations. Multiplier Inputs: Uses two fixed multipliers (1.71 and 2.50) to create bands. Super Smoother: Applies a custom smoothing function to the bands for reduced noise. Fill Zones: Fills the areas between the inner and outer bands to highlight potential volatility ranges. Calculation: 1. EMA (Basis): Calculates the Exponential Moving Average of the selected source. 2. TR ATR: Calculates the True Range and then smoothes it using RMA (Rolling Moving Average). 3. Bands: Calculates upper and lower bands using the EMA and ATR, with multipliers of 1.71 and 2.50. 4. Super Smoother: Applies a smoothing function to the calculated bands. Visuals: Basis Line: Plots the EMA (basis) (invisible by default). Inner Bands (1.71 Multiplier): Plots the smoothed bands with a distinct color (e.g., orange) (invisible by default). Outer Bands (2.50 Multiplier): Plots the smoothed bands with a different color (e.g., purple) (invisible by default). Fill Zones: Fills the region between the inner and outer upper bands and the inner and outer lower bands with a translucent color (e.g. light blue). // Note: The plot lines are invisible by default. To view the basis, upper and lower band lines, adjust the visibility settings in the indicator's settings. Uniqueness: Ready of the box. Code and parameters built specifically for 1m to 15m timeframes provides users with an indicator to easily identify price extremes. The use of TR ATR and addition of the Super Smoother calculation create a easier visualization and implementation compared to existing price band options. Pine Script® インジケーターB3AR_Tradesの投稿更新済 56
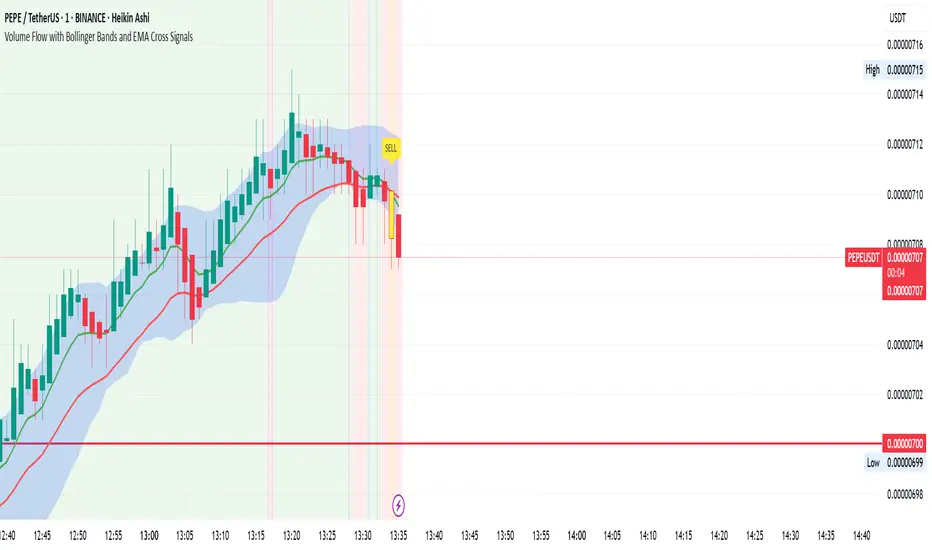
Volume Flow with Bollinger Bands and EMA Cross SignalsThe Volume Flow with Bollinger Bands and EMA Cross Signals indicator is a custom technical analysis tool designed to identify potential buy and sell signals based on several key components: Volume Flow: This component combines price movement and trading volume to create a signal that indicates the strength or weakness of price movements. When the price is rising with increasing volume, it suggests strong buying activity, whereas falling prices with increasing volume indicate strong selling pressure. Bollinger Bands: Bollinger Bands consist of three lines: The Basis (middle line), which is a Simple Moving Average (SMA) of the price over a set period. The Upper Band, which is the Basis plus a multiple of the standard deviation (typically 2). The Lower Band, which is the Basis minus a multiple of the standard deviation. Bollinger Bands help identify periods of high volatility and potential overbought/oversold conditions. When the price touches the upper band, it might indicate that the market is overbought, while touching the lower band might indicate oversold conditions. EMA Crossovers: The script includes two Exponential Moving Averages (EMAs): Fast EMA: A shorter-term EMA, typically more sensitive to price changes. Slow EMA: A longer-term EMA, responding slower to price changes. The crossover of the Fast EMA crossing above the Slow EMA (bullish crossover) signals a potential buy opportunity, while the Fast EMA crossing below the Slow EMA (bearish crossover) signals a potential sell opportunity. Background Color and Candle Color: The indicator highlights the chart's background with specific colors based on the signals: Green background for buy signals. Yellow background for sell signals. Additionally, the candles are colored green for buy signals and yellow for sell signals to visually reinforce the trade opportunities. Buy/Sell Labels: Small labels are placed on the chart: "BUY" label in green is placed below the bar when a buy signal is generated. "SELL" label in yellow is placed above the bar when a sell signal is generated. Working of the Indicator: Volume Flow Calculation: The Volume Flow is calculated by multiplying the price change (current close minus the previous close) with the volume. This product is then smoothed with a Simple Moving Average (SMA) over a user-defined period (length). The result is then multiplied by a multiplier to adjust its sensitivity. Price Change = close - close Volume Flow = Price Change * Volume Smoothed Volume Flow = SMA(Volume Flow, length) The Volume Flow Signal is then: Smooth Volume Flow * Multiplier This calculation represents the buying or selling pressure in the market. Bollinger Bands: Bollinger Bands are calculated using the Simple Moving Average (SMA) of the closing price (basis) and the Standard Deviation (stdev) of the price over a period defined by the user (bb_length). Basis (Middle Band) = SMA(close, bb_length) Upper Band = Basis + (bb_std_dev * Stdev) Lower Band = Basis - (bb_std_dev * Stdev) The upper and lower bands are plotted alongside the price to identify the price's volatility. When the price is near the upper band, it could be overbought, and near the lower band, it could be oversold. EMA Crossovers: The Fast EMA and Slow EMA are calculated using the Exponential Moving Average (EMA) function. The crossovers are detected by checking: Buy Signal (Bullish Crossover): When the Fast EMA crosses above the Slow EMA. Sell Signal (Bearish Crossover): When the Fast EMA crosses below the Slow EMA. The long_condition variable checks if the Fast EMA crosses above the Slow EMA, and the short_condition checks if it crosses below. Visual Signals: Background Color: The background is colored green for a buy signal and yellow for a sell signal. This gives an immediate visual cue to the trader. Bar Color: The candles are colored green for buy signals and yellow for sell signals. Labels: A "BUY" label in green appears below the bar when the Fast EMA crosses above the Slow EMA. A "SELL" label in yellow appears above the bar when the Fast EMA crosses below the Slow EMA. Summary of Buy/Sell Logic: Buy Signal: The Fast EMA crosses above the Slow EMA (bullish crossover). Volume flow is positive, indicating buying pressure. Background turns green and candles are colored green. A "BUY" label appears below the bar. Sell Signal: The Fast EMA crosses below the Slow EMA (bearish crossover). Volume flow is negative, indicating selling pressure. Background turns yellow and candles are colored yellow. A "SELL" label appears above the bar. Usage of the Indicator: This indicator is designed to help traders identify potential entry (buy) and exit (sell) points based on: The interaction of Exponential Moving Averages (EMAs). The strength and direction of Volume Flow. Price volatility using Bollinger Bands. By combining these components, the indicator provides a comprehensive view of market conditions, helping traders make informed decisions on when to enter and exit trades.Pine Script® インジケーターzaheerarrainの投稿44661
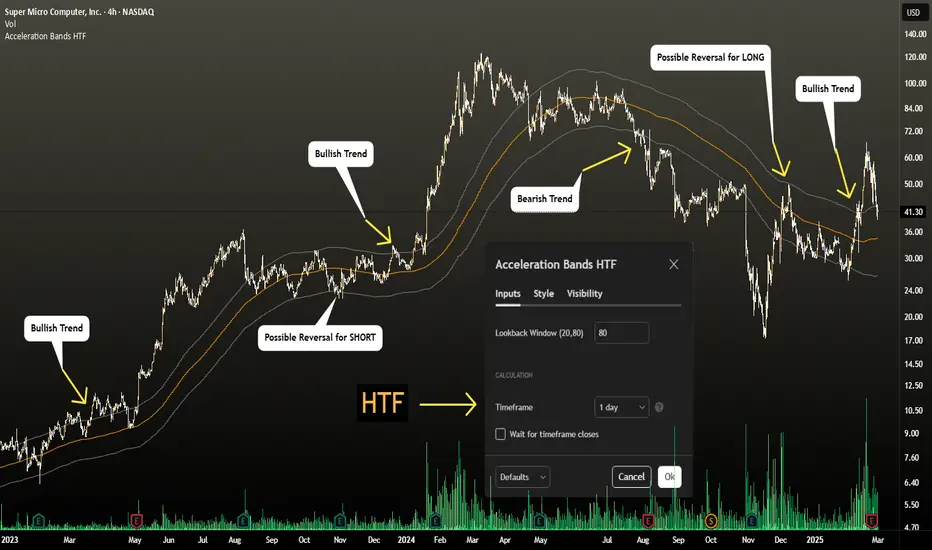
Acceleration Bands HTF This version gives you the ability to see the indicator from the HIGHER timeframes when you are on the timeframes. Please note that this is not the original formula, but a factored one that I found effective for identifying market trends. Thanks to @capissimo who provided the base open-code. Acceleration Bands are designed to capture potential price breakouts or reversals in an asset. They are calculated based on a stock's price movements over a specified period, typically using the high, low, and closing prices. The idea is to identify moments when the price is accelerating (hence the name) beyond its normal range, which might indicate the beginning of a new trend. Calculation Acceleration Bands consist of three lines: Upper Band (AB Upper): This is calculated by adding a certain percentage of the simple moving average (SMA) to the highest high over a given period. Middle Band: This is typically the SMA of the stock's price. Lower Band (AB Lower): This is calculated by subtracting the same percentage of the SMA from the lowest low over a given period. Mathematically : AB Upper = SMA + (Highest High * Percentage) AB Lower = SMA - (Lowest Low * Percentage) OR Upper Band = SMA x (1 + (High - Low) / SMA) Lower Band = SMA x (1 - (High - Low) / SMA) Interpretation The bands are used to identify periods when the price of a security is accelerating or decelerating: Breakout Above Upper Band: This is usually considered a bullish signal, suggesting that the price is accelerating upwards and a new uptrend may be starting. Breakdown Below Lower Band: This is usually considered a bearish signal, suggesting that the price is accelerating downwards and a new downtrend may be starting. Reversal Between Bands: When the price re-enters the region between the bands after breaking out, it can be seen as a potential reversal signal. Trading Strategy Entry Signals: Buy when the price breaks above the upper band. Sell or short when the price breaks below the lower band. Exit Signals: Close a long position when the price falls back into the area between the bands. Close a short position when the price rises back into the area between the bands. Advantages Helps capture early trends. Can be used across various time frames and assets. Provides clear entry and exit signals.Pine Script® インジケーターZoharChoの投稿11169
Entropy Bands (TechnoBlooms)Entropy Bands — A New Era of Volatility and Trend Analysis Entropy Bands is our next indicator as a part of the Quantum Price Theory (QPT) Series of indicators. 🧠 Overview Entropy Bands are an advanced volatility-based indicator that reimagines traditional banded systems like Bollinger Bands. Built on entropy theory, adaptive moving averages, and dynamic volatility measurement, Entropy Bands provide deeper insights into market randomness, trend strength, and breakout potential. Instead of only relying on price deviation (like Bollinger Bands), Entropy Bands integrate chaos theory principles to create smarter, more responsive dynamic bands that adapt to real market behavior. 🚀Why is Entropy Bands Different — and Better Dynamic Band Width : Adjusts using both entropy and ATR, creating smarter expansion/contraction. Multi-Moving Average Core : Choose between SMA, EMA, or WMA for optimal centerline behavior. Noise and Breakout Filtering : Filters fake breakouts by analyzing candle body size and entropy conditions. Visual Clarity : Background and candle coloring highlight chaotic/noisy zones, trend zones, and breakout moments. Entropy Bands don't just react to price — they analyze the underlying market behavior, offering superior decision-making signals. 📚 Watch Band Behavior: Bands expand during volatility spikes or chaotic conditions. Bands contract during low volatility or tight consolidation zones. 📚 Analyze Candle Coloring: Green = Bullish breakout (closing above upper band). Pink = Bearish breakout (closing below lower band). Gray = Inside bands (neutral/random noise). ✨ Key Features of Entropy Bands: Entropy-Based Band Width Calculation: A scientific edge over pure price deviation methods. Dynamic Background Coloring: Highlights high entropy areas where randomness dominates. Candle Breakout Coloring: Easy-to-spot trend breakouts and strength moves. Multi-MA Flexibility: Adapt the bands’ core to trending, ranging, or volatile markets. Body Size Filter: Protects against fake breakouts by requiring meaningful candle body moves. Pine Script® インジケーターTechnoBloomsの投稿55141
Dynamic RSI Bollinger Bands with Waldo Cloud TradingView Indicator Description: Dynamic RSI Bollinger Bands with Waldo Cloud Title: Dynamic RSI Bollinger Bands with Waldo Cloud Short Title: Dynamic RSI BB Waldo Overview: Introducing an experimental indicator, the Dynamic RSI Bollinger Bands with Waldo Cloud, designed for adventurous traders looking to explore new dimensions in technical analysis. This indicator overlays on your chart, providing a unique perspective by integrating the Relative Strength Index (RSI) with Bollinger Bands, creating a dynamic trading tool that adapts to market conditions through the lens of momentum and volatility. What is it? This innovative indicator combines the traditional Bollinger Bands with the RSI in a way that hasn't been commonly explored. Here's a breakdown: RSI Integration: The RSI is calculated with customizable length settings, and its values are used not just for momentum analysis but as the basis for the Bollinger Bands. This means the position and width of the bands are directly influenced by the RSI, offering a visual representation of momentum within the context of price volatility. Dynamic Bollinger Bands: Instead of using price directly, the Bollinger Bands are calculated using a scaled version of the RSI. This scaling is done to fit the RSI values into the price range, ensuring the bands are relevant to the actual price movement. The standard deviation for these bands is also scaled accordingly, providing a unique volatility measure that's momentum-driven. Waldo Cloud: Named after a visual representation concept, the 'Waldo Cloud' refers to the colored area between the Bollinger Bands, which changes based on various conditions: Purple when RSI is overbought. Blue when RSI is oversold. Green for bullish conditions, defined by the fast-moving average crossing above the slow one, RSI is bullish, and the price is above the slow MA. Red for bearish conditions, when the fast MA crosses below the slow MA, the RSI is bearish, and the price is below the slow MA. Gray for neutral market conditions. Moving Averages: Two simple moving averages (Fast MA and Slow MA) are included, which can be toggled on or off, offering additional trend analysis through crossovers. How to Use It: Given its experimental nature, this indicator should be used with caution and in conjunction with other analysis methods: Identifying Market Conditions: Use the color of the Waldo Cloud to gauge market sentiment. A green cloud might suggest a good time to consider long positions, while a red cloud could indicate potential shorting opportunities. Purple and blue clouds highlight extreme conditions that might precede reversals. Volatility and Momentum: The dynamic nature of the Bollinger Bands based on RSI provides insight into how momentum is affecting price volatility. When the bands are wide, it might indicate high momentum and potential trend continuation or reversal, depending on the RSI's position relative to its overbought/oversold levels. Trend Confirmation: The moving average crossovers can act as confirmation signals. For instance, a bullish crossover (fast MA over slow MA) within a green cloud might strengthen a buy signal, whereas a bearish crossover in a red cloud might reinforce a sell decision. Customization: Adjust the RSI length, overbought/oversold levels, and moving average lengths to suit different trading styles or market conditions. Experiment with these settings to find what works best for your strategy. Combining with Other Indicators: Since this is an experimental tool, it's advisable to use it alongside established indicators like traditional Bollinger Bands, MACD, or trend lines to validate signals. Conclusion: The Dynamic RSI Bollinger Bands with Waldo Cloud is an experimental venture into combining momentum with volatility visually and interactively. It's designed for traders who are open to exploring new methods of market analysis. Remember, due to its experimental status, this indicator should be part of a broader trading strategy, and backtesting or paper trading is recommended before applying it in live trading scenarios. Keep an eye on how the market reacts to the signals provided by this indicator and always consider risk management practices.Pine Script® インジケーターRSI_Trading_Conceptsの投稿更新済 2225