Bollinger Bands Entry/Exit ThresholdsBollinger Bands Entry/Exit Thresholds
Author of enhancements: chuckaschultz
Inspired and adapted from the original 'Bollinger Bands Breakout Oscillator' by LuxAlgo
Overview
Pairs nicely with Contrarian 100 MA
The Bollinger Bands Entry/Exit Thresholds is a powerful momentum-based indicator designed to help traders identify potential entry and exit points in trending or breakout markets. By leveraging Bollinger Bands, this indicator quantifies price deviations from the bands to generate bullish and bearish momentum signals, displayed as an oscillator. It includes customizable entry and exit signals based on user-defined thresholds, with visual cues plotted either on the oscillator panel or directly on the price chart.
This indicator is ideal for traders looking to capture breakout opportunities or confirm trend strength, with flexible settings to adapt to various markets and trading styles.
How It Works
The Bollinger Bands Entry/Exit Thresholds calculates two key metrics:
Bullish Momentum (Bull): Measures the extent to which the price exceeds the upper Bollinger Band, expressed as a percentage (0–100).
Bearish Momentum (Bear): Measures the extent to which the price falls below the lower Bollinger Band, also expressed as a percentage (0–100).
The indicator generates:
Long Entry Signals: Triggered when the bearish momentum (bear) crosses below a user-defined Long Threshold (default: 40). This suggests weakening bearish pressure, potentially indicating a reversal or breakout to the upside.
Exit Signals: Triggered when the bullish momentum (bull) crosses below a user-defined Sell Threshold (default: 80), indicating a potential reduction in bullish momentum and a signal to exit long positions.
Signals are visualized as tiny colored dots:
Long Entry: Blue dots, plotted either at the bottom of the oscillator or below the price bar (depending on user settings).
Exit Signal: White dots, plotted either at the top of the oscillator or above the price bar.
Calculation Methodology
Bollinger Bands:
A user-defined Length (default: 14) is used to calculate an Exponential Moving Average (EMA) of the source price (default: close).
Standard deviation is computed over the same length, multiplied by a user-defined Multiplier (default: 1.0).
Upper Band = EMA + (Standard Deviation × Multiplier)
Lower Band = EMA - (Standard Deviation × Multiplier)
Bull and Bear Momentum:
For each bar in the lookback period (length), the indicator calculates:
Bullish Momentum: The sum of positive deviations of the price above the upper band, normalized by the total absolute deviation from the upper band, scaled to a 0–100 range.
Bearish Momentum: The sum of positive deviations of the price below the lower band, normalized by the total absolute deviation from the lower band, scaled to a 0–100 range.
Formula:
bull = (sum of max(price - upper, 0) / sum of abs(price - upper)) * 100
bear = (sum of max(lower - price, 0) / sum of abs(lower - price)) * 100
Signal Generation:
Long Entry: Triggered when bear crosses below the Long Threshold.
Exit: Triggered when bull crosses below the Sell Threshold.
Settings
Length: Lookback period for EMA and standard deviation (default: 14).
Multiplier: Multiplier for standard deviation to adjust Bollinger Band width (default: 1.0).
Source: Input price data (default: close).
Long Threshold: Bearish momentum level below which a long entry signal is generated (default: 40).
Sell Threshold: Bullish momentum level below which an exit signal is generated (default: 80).
Plot Signals on Main Chart: Option to display entry/exit signals on the price chart instead of the oscillator panel (default: false).
Style:
Bullish Color: Color for bullish momentum plot (default: #f23645).
Bearish Color: Color for bearish momentum plot (default: #089981).
Visual Features
Bull and Bear Plots: Displayed as colored lines with gradient fills for visual clarity.
Midline: Horizontal line at 50 for reference.
Threshold Lines: Dashed green line for Long Threshold and dashed red line for Sell Threshold.
Signal Dots:
Long Entry: Tiny blue dots (below price bar or at oscillator bottom).
Exit: Tiny white dots (above price bar or at oscillator top).
How to Use
Add to Chart: Apply the indicator to your TradingView chart.
Adjust Settings: Customize the Length, Multiplier, Long Threshold, and Sell Threshold to suit your trading strategy.
Interpret Signals:
Enter a long position when a blue dot appears, indicating bearish momentum dropping below the Long Threshold.
Exit the long position when a white dot appears, indicating bullish momentum dropping below the Sell Threshold.
Toggle Plot Location: Enable Plot Signals on Main Chart to display signals on the price chart for easier integration with price action analysis.
Combine with Other Tools: Use alongside other indicators (e.g., trendlines, support/resistance) to confirm signals.
Notes
This indicator is inspired by LuxAlgo’s Bollinger Bands Breakout Oscillator but has been enhanced with customizable entry/exit thresholds and signal plotting options.
Best used in conjunction with other technical analysis tools to filter false signals, especially in choppy or range-bound markets.
Adjust the Multiplier to make the Bollinger Bands wider or narrower, affecting the sensitivity of the momentum calculations.
Disclaimer
This indicator is provided for educational and informational purposes only.
"bear"に関するスクリプトを検索

Simple Multi-Timeframe Trends with RSI (Realtime)Simple Multi-Timeframe Trends with RSI Realtime Updates
Overview
The Simple Multi-Timeframe Trends with RSI Realtime Updates indicator is a comprehensive dashboard designed to give you an at-a-glance understanding of market trends across nine key timeframes, from one minute (M1) to one month (M).
It moves beyond simple moving average crossovers by calculating a sophisticated Trend Score for each timeframe. This score is then intelligently combined into a single, weighted Confluence Signal , which adapts to your personal trading style. With integrated RSI and divergence detection, SMTT provides a powerful, all-in-one tool to confirm your trade ideas and stay on the right side of the market.
Key Features
Automatic Trading Presets: The most powerful feature of the script. Simply select your trading style, and the indicator will automatically adjust all internal parameters for you:
Intraday: Uses shorter moving averages and higher sensitivity, focusing on lower timeframe alignment for quick moves.
Swing Trading: A balanced preset using medium-term moving averages, ideal for capturing trends that last several days or weeks.
Investment: Uses long-term moving averages and lower sensitivity, prioritizing the major trends on high timeframes.
Advanced Trend Scoring: The trend for each timeframe isn't just "up" or "down". The score is calculated based on a combination of:
Price vs. Moving Average: Is the price above or below the MA?
MA Slope: Is the trend accelerating or decelerating? A steep slope indicates a strong trend.
Price Momentum: How quickly has the price moved recently?
Volatility Adjustment: The score's quality is adjusted based on current market volatility (using ATR) to filter out choppy conditions.
Weighted Confluence Score: The script synthesizes the trend scores from all nine timeframes into a single, actionable signal. The weights are dynamically adjusted based on your selected Trading Style , ensuring the most relevant timeframes have the most impact on the final result.
Integrated RSI & Divergence: Each timeframe includes a smoothed RSI value to help you spot overbought/oversold conditions. It also flags potential bullish (price lower, RSI higher) and bearish (price higher, RSI lower) divergences, which can be early warnings of a trend reversal.
Clean & Customizable Dashboard: The entire analysis is presented in a clean, easy-to-read table on your chart. You can choose its position and optionally display the raw numerical scores for a deeper analysis.
How to Use It
1. Add to Chart: Apply the "Simple Multi-Timeframe Trends" indicator to your chart.
2. Select Your Style: This is the most important step. Go to the indicator settings and choose the Trading Style that best fits your strategy (Intraday, Swing Trading, or Investment). All calculations will instantly adapt.
3. Analyze the Dashboard:
Look at the Trend row to see the direction and strength of the trend on individual timeframes. Strong alignment (e.g., all green or all red) indicates a powerful, market-wide move.
Check the RSI row. Is the trend overextended (RSI > 60) or is there room to run? Look for the fuchsia color, which signals a divergence and warrants caution.
Focus on the Signal row. This is your summary. A "STRONG SIGNAL" with high alignment suggests a high-probability setup. A "NEUTRAL" or "Weak" signal suggests waiting for a better opportunity.
4. Confirm Your Trades: Use the SMTT dashboard as a confirmation tool. For example, if you are looking for a long entry, wait for the dashboard to show a "BULLISH" or "STRONG SIGNAL" to confirm that the broader market structure supports your trade.
Dashboard Legend
Trend Row
This row shows the trend direction and strength for each timeframe.
⬆⬆ (Dark Green): Ultra Bullish - Very strong, established uptrend.
⬆ (Green): Strong Bullish - Confident uptrend.
▲ (Light Green): Bullish - The beginning of an uptrend or a weak uptrend.
━ (Orange): Neutral - Sideways or consolidating market.
▼ (Light Red): Bearish - The beginning of a downtrend or a weak downtrend.
⬇ (Red): Strong Bearish - Confident downtrend.
⬇⬇ (Dark Red): Ultra Bearish - Very strong, established downtrend.
RSI Row
This row displays the smoothed RSI value and its condition.
Green Text: Oversold (RSI < 40). Potential for a bounce or reversal upwards.
Red Text: Overbought (RSI > 60). Potential for a pullback or reversal downwards.
Fuchsia (Pink) Text: Divergence Detected! A potential reversal is forming.
White Text: Neutral (RSI between 40 and 60).
Signal Row
This is the final, weighted confluence of all timeframes.
Label:
🚀 STRONG SIGNAL / 💥 STRONG SIGNAL: High confluence and strong momentum.
🟢 BULLISH / 🔴 BEARISH: Clear directional bias across relevant timeframes.
🟡 Weak + / 🟠 Weak -: Minor directional bias, suggests caution.
⚪ NEUTRAL: No clear directional trend; market is likely choppy or undecided.
Numerical Score: The raw weighted confluence score. The further from zero, the stronger the signal.
Alignment %: The percentage of timeframes (out of 9) that are showing a clear bullish or bearish trend. Higher percentages indicate a more unified market.

Uptrick: Fusion Trend Reversion SystemOverview
The Uptrick: Fusion Trend Reversion System is a multi-layered indicator designed to identify potential price reversals during intraday movement while keeping traders informed of the dominant short-term trend. It blends a composite fair value model with deviation logic and a refined momentum filter using the Relative Strength Index (RSI). This tool was created with scalpers and short-term traders in mind and is especially effective on lower timeframes such as 1-minute, 5-minute, and 15-minute charts where price dislocations and quick momentum shifts are frequent.
Introduction
This indicator is built around the fusion of two classic concepts in technical trading: identifying trend direction and spotting potential reversion points. These are often handled separately, but this system merges them into one process. It starts by computing a fair value price using five moving averages, each with its own mathematical structure and strengths. These include the exponential moving average (EMA), which gives more weight to recent data; the simple moving average (SMA), which gives equal weight to all periods; the weighted moving average (WMA), which progressively increases weight with recency; the Arnaud Legoux moving average (ALMA), known for smoothing without lag; and the volume-weighted average price (VWAP), which factors in volume at each price level.
All five are averaged into a single value — the raw fusion line. This fusion acts as a dynamically balanced centerline that adapts to price conditions with both smoothing and responsiveness. Two additional exponential moving averages are applied to the raw fusion line. One is slower, giving a stable trend reference, and the other is faster, used to define momentum and cloud behavior. These two lines — the fusion slow and fusion fast — form the backbone of trend and signal logic.
Purpose
This system is meant for traders who want to trade reversals without losing sight of the underlying directional bias. Many reversal indicators fail because they act too early or signal too frequently in choppy markets. This script filters out noise through two conditions: price deviation and RSI confirmation. Reversion trades are considered only when the price moves a significant distance from fair value and RSI suggests a legitimate shift in momentum. That filtering process gives the trader a cleaner, higher-quality signal and reduces false entries.
The indicator also visually supports the trader through colored bars, up/down labels, and a filled cloud between the fast and slow fusion lines. These features make the market context immediately visible: whether the trend is up or down, whether a reversal just occurred, and whether price is currently in a high-risk reversion zone.
Originality and Uniqueness
What makes this script different from most reversal systems is the way it combines layers of logic — not just to detect signals, but to qualify and structure them. Rather than relying on a single MA or a raw RSI level, it uses a five-MA fusion to create a baseline fair value that incorporates speed, stability, and volume-awareness.
On top of that, the system introduces a dual-smoothing mechanism. It doesn’t just smooth price once — it creates two layers: one to follow the general trend and another to track faster deviations. This structure lets the script distinguish between continuation moves and possible turning points more effectively than a single-line or single-metric system.
It also uses RSI in a more refined way. Instead of just checking if RSI is overbought or oversold, the script smooths RSI and requires directional confirmation. Beyond that, it includes signal memory. Once a signal is generated, a new one will not appear unless the RSI becomes even more extreme and curls back again. This memory-based gating reduces signal clutter and prevents repetition, a rare feature in similar scripts.
Why these indicators were merged
Each moving average in the fusion serves a specific role. EMA reacts quickly to recent price changes and is often favored in fast-trading strategies. SMA acts as a long-term filter and smooths erratic behavior. WMA blends responsiveness with smoothing in a more balanced way. ALMA focuses on minimizing lag without losing detail, which is helpful in fast markets. VWAP anchors price to real trade volume, giving a sense of where actual positioning is happening.
By combining all five, the script creates a fair value model that doesn’t lean too heavily on one logic type. This fusion is then smoothed into two separate EMAs: one slower (trend layer), one faster (signal layer). The difference between these forms the basis of the trend cloud, which can be toggled on or off visually.
RSI is then used to confirm whether price is reversing with enough force to warrant a trade. The RSI is calculated over a 14-period window and smoothed with a 7-period EMA. The reason for smoothing RSI is to cut down on noise and avoid reacting to short, insignificant spikes. A signal is only considered if price is stretched away from the trend line and the smoothed RSI is in a reversal state — below 30 and rising for bullish setups, above 70 and falling for bearish ones.
Calculations
The script follows this structure:
Calculate EMA, SMA, WMA, ALMA, and VWAP using the same base length
Average the five values to form the raw fusion line
Smooth the raw fusion line with an EMA using sens1 to create the fusion slow line
Smooth the raw fusion line with another EMA using sens2 to create the fusion fast line
If fusion slow is rising and price is above it, trend is bullish
If fusion slow is falling and price is below it, trend is bearish
Calculate RSI over 14 periods
Smooth RSI using a 7-period EMA
Determine deviation as the absolute difference between current price and fusion slow
A raw signal is flagged if deviation exceeds the threshold
A raw signal is flagged if RSI EMA is under 30 and rising (bullish setup)
A raw signal is flagged if RSI EMA is over 70 and falling (bearish setup)
A final signal is confirmed for a bullish setup if RSI EMA is lower than the last bullish signal’s RSI
A final signal is confirmed for a bearish setup if RSI EMA is higher than the last bearish signal’s RSI
Reset the bullish RSI memory if RSI EMA rises above 30
Reset the bearish RSI memory if RSI EMA falls below 70
Store last signal direction and use it for optional bar coloring
Draw the trend cloud between fusion fast and fusion slow using fill()
Show signal labels only if showSignals is enabled
Bar and candle colors reflect either trend slope or last signal direction depending on mode selected
How it works
Once the script is loaded, it builds a fusion line by averaging five different types of moving averages. That line is smoothed twice into a fast and slow version. These two fusion lines form the structure for identifying trend direction and signal areas.
Trend bias is defined by the slope of the slow line. If the slow line is rising and price is above it, the market is considered bullish. If the slow line is falling and price is below it, it’s considered bearish.
Meanwhile, the script monitors how far price has moved from that slow line. If price is stretched beyond a certain distance (set by the threshold), and RSI confirms that momentum is reversing, a raw reversion signal is created. But the script only allows that signal to show if RSI has moved further into oversold or overbought territory than it did at the last signal. This blocks repetitive, weak entries. The memory is cleared only if RSI exits the zone — above 30 for bullish, below 70 for bearish.
Once a signal is accepted, a label is drawn. If the signal toggle is off, no label will be shown regardless of conditions. Bar colors are controlled separately — you can color them based on trend slope or last signal, depending on your selected mode.
Inputs
You can adjust the following settings:
MA Length: Sets the period for all moving averages used in the fusion.
Show Reversion Signals: Turns on the plotting of “Up” and “Down” labels when a reversal is confirmed.
Bar Coloring: Enables or disables colored bars based on trend or signal direction.
Show Trend Cloud: Fills the space between the fusion fast and slow lines to reflect trend bias.
Bar Color Mode: Lets you choose whether bars follow trend logic or last signal direction.
Sens 1: Smoothing speed for the slow fusion line — higher values = slower trend.
Sens 2: Smoothing speed for the fast line — lower values = faster signal response.
Deviation Threshold: Minimum distance price must move from fair value to trigger a signal check.
Features
This indicator offers:
A composite fair value model using five moving average types.
Dual smoothing system with user-defined sensitivity.
Slope-based trend definition tied to price position.
Deviation-triggered signal logic filtered by RSI reversal.
RSI memory system that blocks repetitive signals and resets only when RSI exits overbought or oversold zones.
Real-time tracking of the last signal’s direction for optional bar coloring.
Up/Down labels at signal points, visible only when enabled.
Optional trend cloud between fusion layers, visualizing current market bias.
Full user control over smoothing, threshold, color modes, and visibility.
Conclusion
The Fusion Trend-Reversion System is a tool for short-term traders looking to fade price extremes without ignoring trend bias. It calculates fair value using five diverse moving averages, smooths this into two dynamic layers, and applies strict reversal logic based on RSI deviation and momentum strength. Signals are triggered only when price is stretched and momentum confirms it with increasingly strong behavior. This combination makes the tool suitable for scalping, intraday entries, and fast market environments where precision matters.
Disclaimer
This indicator is for informational and educational purposes only. It does not constitute financial advice. All trading involves risk, and no tool can predict market behavior with certainty. Use proper risk management and do your own research before making trading decisions.

Contrarian 100 MAPairs nicely with Enhanced-Stock-Ticker-with-50MA-vs-200MA located here:
Description
The Contrarian 100 MA is a sophisticated Pine Script v6 indicator designed for traders seeking to identify key market structure shifts and trend reversals using a combination of a 100-period Simple Moving Average (SMA) envelope and Inner Circle Trader (ICT) Break of Structure (BoS) and Market Structure Shift (MSS) logic. By overlaying a semi-transparent SMA-based shadow on the price chart and plotting bullish and bearish structure signals, this indicator helps traders visualize critical price levels and potential trend changes. It leverages higher timeframe (HTF) pivot points and dynamic logic to adapt to various chart timeframes, making it ideal for swing and contrarian trading strategies. Customizable colors, timeframes, and alert conditions enhance its versatility for manual and automated trading setups.
Key Features
SMA Envelope: Plots a 100-period SMA for high and low prices, creating a semi-transparent (50% opacity) purple shadow to highlight the price range and provide context for price movements.
ICT BoS/MSS Logic: Identifies Break of Structure (BoS) and Market Structure Shift (MSS) signals for both bullish and bearish conditions, based on HTF pivot points.
Dynamic Timeframe Support: Adjusts pivot detection based on user-selected HTF (default: 1D) and chart timeframe (1M, 5M, 15M, 30M, 1H, 4H, 1D), ensuring adaptability across markets.
Visual Signals: Draws dotted lines for BoS (bullish/bearish) and MSS (bullish/bearish) signals at pivot levels, with customizable colors for easy identification.
Contrarian Approach: Signals potential reversals by combining SMA context with ICT structure breaks, ideal for traders looking to capitalize on trend shifts.
Alert Conditions: Supports alerts for bullish/bearish BoS and MSS signals, enabling integration with TradingView’s alert system for automated trading.
Performance Optimization: Uses efficient pivot detection and line management to minimize resource usage while maintaining accuracy.
Technical Details
SMA Calculation:
Computes 100-period SMAs for high (smaHigh) and low (smaLow) prices.
Plots invisible SMAs (fully transparent) and fills the area between them with 50% transparent purple for visual context.
Pivot Detection:
Uses ta.pivothigh and ta.pivotlow to identify HTF swing points, with dynamic lookback periods (rlBars: 5 for daily, 2 for intraday).
Tracks pivot highs (pH, nPh) and lows (pL, nPl) using a custom piv type for price and time.
BoS/MSS Logic:
Bullish BoS: Triggered when price breaks above a pivot high in a bullish trend, drawing a line at the pivot level.
Bearish BoS: Triggered when price breaks below a pivot low in a bearish trend.
Bullish MSS: Occurs when price breaks a pivot high in a bearish trend, signaling a potential trend reversal.
Bearish MSS: Occurs when price breaks a pivot low in a bullish trend.
Lines are drawn using line.new with xloc.bar_time for precise alignment, styled as dotted with customizable colors.
HTF Integration: Fetches HTF close prices and pivot data using request.security with lookahead_on for accurate signal timing.
Line Management: Maintains an array of lines (lin), removing outdated lines when new MSS signals occur to keep the chart clean.
Pivot Reset: Clears broken pivots (e.g., when price exceeds a pivot high or falls below a pivot low) to ensure fresh signal generation.
How to Use
Add to Chart:
Copy the script into TradingView’s Pine Editor and apply it to your chart.
Configure Settings:
SMA Length: Adjust the SMA period (default: 100 bars) to suit your trading style.
Structure Timeframe: Set the HTF for pivot detection (default: 1D).
Chart Timeframe: Select the chart timeframe (1M, 5M, 15M, 30M, 1H, 4H, 1D) to adjust pivot sensitivity.
Colors: Customize bullish/bearish BoS and MSS line colors via input settings.
Interpret Signals:
Bullish BoS: White dotted line (default) at a broken pivot high in a bullish trend, indicating trend continuation.
Bearish BoS: White dotted line at a broken pivot low in a bearish trend.
Bullish MSS: White dotted line at a broken pivot high in a bearish trend, suggesting a reversal to bullish.
Bearish MSS: White dotted line at a broken pivot low in a bullish trend, suggesting a reversal to bearish.
Use the SMA shadow to gauge price position within the recent range.
Set Alerts:
Create alerts for bullish/bearish BoS and MSS signals using TradingView’s alert system.
Customize Visuals:
Adjust line colors or SMA fill transparency via TradingView’s settings for better visibility.
Example Use Cases
Swing Trading: Use MSS signals to enter trades at potential trend reversals, with the SMA envelope confirming price extremes.
Contrarian Trading: Capitalize on BoS and MSS signals to trade against prevailing trends, using the SMA shadow for context.
Automated Trading: Integrate BoS/MSS alerts with trading bots for systematic entries and exits.
Multi-Timeframe Analysis: Combine HTF signals (e.g., 1D) with lower timeframe charts (e.g., 1H) for precise entries.
Notes
Testing: Backtest the indicator on your chosen market and timeframe to validate performance.
Compatibility: Built for Pine Script v6 and tested on TradingView as of June 19, 2025.
Limitations: Signals rely on HTF pivot accuracy, which may lag in fast-moving markets. Adjust rlBars or timeframe for sensitivity.
Optional Enhancements: Consider uncommenting or adding a histogram for SMA divergence (e.g., smaHigh - smaLow) for additional insights.
Acknowledgments
This indicator combines ICT’s market structure concepts with a dynamic SMA envelope to provide a unique contrarian trading tool. Share your feedback or suggestions in the TradingView comments, and happy trading!

SuperTrend Adaptive (STD Smooth)Supertrend Adaptive (Smoothed StdDev)
Supertrend Adaptive is a refined trend-following indicator based on the classic Supertrend. It enhances the original by incorporating smoothed standard deviation into the volatility calculation, instead of relying solely on ATR. This hybrid approach enables more responsive and adaptive trend detection, reducing noise and false signals in volatile or ranging markets. The indicator also features confidence-weighted signal labels and a clean, uncluttered display, making it practical for any trading timeframe.
🔍 Detailed Methodology and Conceptual Foundation
Unlike traditional Supertrend indicators that use only absolute volatility (ATR) to define trend bands, this version blends standard deviation — a relative volatility measure — into the calculation. Standard deviation helps capture the dispersion of price, not just its range, and when smoothed, it filters out erratic jumps caused by sudden spikes or drops.
This fusion creates trend bands that expand and contract dynamically based on recent price variability. As a result:
Fewer whipsaws : The trend bands adjust to both low and high volatility environments, which helps avoid unnecessary signal flips during consolidation.
Stronger trend adherence : Signals are less reactive to momentary price movements. This allows the indicator to hold positions longer in trending markets, giving traders the opportunity to ride extended moves.
Bollinger Band-style adaptation : By including standard deviation, this indicator behaves similarly to Bollinger Bands — accounting for relative price change rather than absolute moves alone.
These enhancements make the tool suitable not only for identifying directional bias, but also for refining entries and exits with more context-aware volatility filtering.
📈 How to Use the Indicator
Trend Direction: The script draws a colored line beneath (uptrend) or above (downtrend) price. Green indicates bullish trend, red indicates bearish.
Buy/Sell Labels: Only the most recent signal is shown to reduce clutter:
🟢 Green "Buy" label = trend reversal to bullish, with strong confidence.
🔵 Blue "Buy" label = same reversal, but with lower volume confidence.
🔴 Red "Sell" label = trend reversal to bearish, with strong confidence.
🟠 Orange "Sell" label = bearish signal with lower volume confidence.
These color codes are derived from comparing current volume to its average — a higher-than-average volume gives greater confidence to the signal.
Settings:
ATR Period: Controls the smoothing window for volatility calculation.
ATR Multiplier: Adjusts the size of the trend bands.
Std Smooth: Controls smoothing applied to standard deviation to reduce jitter.
Change ATR Method: Option to toggle between default and smoothed ATR.
Show Signals: Toggle for label display.
📢 Alerts
The script includes three built-in alert conditions:
Buy Signal: Triggered when the trend flips to bullish.
Sell Signal: Triggered when the trend flips to bearish.
Trend Direction Change: Alerts on any switch in trend regardless of confidence level.
These alerts allow traders to automate notifications or integrations with bots or trading platforms.
🧼 Clean Chart Display
To ensure clarity and comply with best practices:
The chart shows only this indicator.
Trend lines are drawn in real time for visual context.
Only one label per direction is shown — the most recent one — to keep the chart readable.
No drawings or unrelated indicators are included.
This setup ensures the script’s signals and structure are immediately understandable at a glance.
📌 Best Use Cases
This tool is designed for:
Traders who want adaptive volatility filters instead of rigid ATR-based models.
Scalpers and swing traders who prefer clean charts with minimal lag and fewer false signals.
Any asset class — works well on crypto, FX, and equities.
Shortcoming of this tool is sideway price action (will be tackled in next versions).
Credit for www.tradingview.com the version which this script extends.

MACD Breakout SuperCandlesMACD Breakout SuperCandles
The MACD Breakout SuperCandles indicator is a candle-coloring tool that monitors trend alignment across multiple timeframes using a combination of MACD behavior and simple price structure. It visually reflects market sentiment directly on price candles, helping traders quickly recognize shifting momentum conditions.
How It Works
The script evaluates trend behavior based on:
- Multi-timeframe MACD Analysis: Uses MACD values and signal line relationships to gauge trend direction and strength.
- Price Relative to SMA Zones: Analyzes whether price is positioned above or below the 20-period high and low SMAs on each timeframe.
For each timeframe, the script assigns one of five possible trend statuses:
- SUPERBULL: Strong bullish MACD signal with price above both SMAs.
- Bullish: Bullish MACD crossover with price showing upward bias.
- Basing: MACD flattening or neutralizing near zero with no directional dominance.
- Bearish: Bearish MACD signal without confirmation of stronger trend.
- SUPERBEAR: Strong bearish MACD signal with price below both SMAs.
-Ghost Candles: Candles with basing attributes that can signal directional change or trend strength.
Signal Scoring System
The script compares conditions across four timeframes:
- TF1 (Short)
- TF2 (Medium)
- TF3 (Long)
- MACD at a fixed 10-minute resolution
Each status type is tracked independently. A colored candle is only applied when a status type (e.g., SUPERBULL) reaches the minimum match threshold, defined by the "Min Status Matches for Candle Color" setting. If no status meets the required threshold, the candle is displayed in a neutral "Ghost" color.
Customizable Visuals
The indicator offers full control over candle appearance via grouped settings:
Body Colors
- SUPERBULL Body
- Bullish Body
- Basing Body
- Bearish Body
- SUPERBEAR Body
- Ghost Candle Body (used when no match)
Border & Wick Colors
- SUPERBULL Border/Wick
- Bullish Border/Wick
- Basing Border/Wick
- Bearish Border/Wick
- SUPERBEAR Border/Wick
- Ghost Border/Wick
Colors are grouped by function and can be adjusted independently to match your chart theme or personal preferences.
Settings Overview
- TF1, TF2, TF3: Select short, medium, and long timeframes to monitor trend structure.
- Min Status Matches: Set how many timeframes must agree before a candle status is applied.
- MACD Settings: Customize MACD fast, slow, and signal lengths, and choose MA type (EMA, SMA, WMA).
This tool helps visualize how aligned various timeframe conditions are by embedding sentiment into the candles themselves. It can assist with trend identification, momentum confirmation, or visual filtering for discretionary strategies.

Magnificent 7 OscillatorThe Magnificent 7 Oscillator is a sophisticated momentum-based technical indicator designed to analyze the collective performance of the seven largest technology companies in the U.S. stock market (Apple, Microsoft, Alphabet, Amazon, NVIDIA, Tesla, and Meta). This indicator incorporates established momentum factor research and provides three distinct analytical modes: absolute momentum tracking, equal-weighted market comparison, and relative performance analysis. The tool integrates five different oscillator methodologies and includes advanced breadth analysis capabilities.
Theoretical Foundation
Momentum Factor Research
The indicator's foundation rests on seminal momentum research in financial markets. Jegadeesh and Titman (1993) demonstrated that stocks with strong price performance over 3-12 month periods tend to continue outperforming in subsequent periods¹. This momentum effect was later incorporated into formal factor models by Carhart (1997), who extended the Fama-French three-factor model to include a momentum factor (UMD - Up Minus Down)².
The momentum calculation methodology follows the academic standard:
Momentum(t) = / P(t-n) × 100
Where P(t) is the current price and n is the lookback period.
The focus on the "Magnificent 7" stocks reflects the increasing market concentration observed in recent years. Fama and French (2015) noted that a small number of large-cap stocks can drive significant market movements due to their substantial index weights³. The combined market capitalization of these seven companies often exceeds 25% of the total S&P 500, making their collective momentum a critical market indicator.
Indicator Architecture
Core Components
1. Data Collection and Processing
The indicator employs robust data collection with error handling for missing or invalid security data. Each stock's momentum is calculated independently using the specified lookback period (default: 14 periods).
2. Composite Oscillator Calculation
Following Fama-French factor construction methodology, the indicator offers two weighting schemes:
- Equal Weight: Each active stock receives identical weighting (1/n)
- Market Cap Weight: Reserved for future enhancement
3. Oscillator Transformation Functions
The indicator provides five distinct oscillator types, each with established technical analysis foundations:
a) Momentum Oscillator (Default)
- Pure rate-of-change calculation
- Centered around zero
- Direct implementation of Jegadeesh & Titman methodology
b) RSI (Relative Strength Index)
- Wilder's (1978) relative strength methodology
- Transformed to center around zero for consistency
- Scale: -50 to +50
c) Stochastic Oscillator
- George Lane's %K methodology
- Measures current position within recent range
- Transformed to center around zero
d) Williams %R
- Larry Williams' range-based oscillator
- Inverse stochastic calculation
- Adjusted for zero-centered display
e) CCI (Commodity Channel Index)
- Donald Lambert's mean reversion indicator
- Measures deviation from moving average
- Scaled for optimal visualization
Operational Modes
Mode 1: Magnificent 7 Analysis
Tracks the collective momentum of the seven constituent stocks. This mode is optimal for:
- Technology sector analysis
- Growth stock momentum assessment
- Large-cap performance tracking
Mode 2: S&P 500 Equal Weight Comparison
Analyzes momentum using an equal-weighted S&P 500 reference (typically RSP ETF). This mode provides:
- Broader market momentum context
- Size-neutral market analysis
- Comparison baseline for relative performance
Mode 3: Relative Performance Analysis
Calculates the momentum differential between Magnificent 7 and S&P 500 Equal Weight. This mode enables:
- Sector rotation analysis
- Style factor assessment (Growth vs. Value)
- Relative strength identification
Formula: Relative Performance = MAG7_Momentum - SP500EW_Momentum
Signal Generation and Thresholds
Signal Classification
The indicator generates three signal states:
- Bullish: Oscillator > Upper Threshold (default: +2.0%)
- Bearish: Oscillator < Lower Threshold (default: -2.0%)
- Neutral: Oscillator between thresholds
Relative Performance Signals
In relative performance mode, specialized thresholds apply:
- Outperformance: Relative momentum > +1.0%
- Underperformance: Relative momentum < -1.0%
Alert System
Comprehensive alert conditions include:
- Threshold crossovers (bullish/bearish signals)
- Zero-line crosses (momentum direction changes)
- Relative performance shifts
- Breadth Analysis Component
The indicator incorporates market breadth analysis, calculating the percentage of constituent stocks with positive momentum. This feature provides insights into:
- Strong Breadth (>60%): Broad-based momentum
- Weak Breadth (<40%): Narrow momentum leadership
- Mixed Breadth (40-60%): Neutral momentum distribution
Visual Design and User Interface
Theme-Adaptive Display
The indicator automatically adjusts color schemes for dark and light chart themes, ensuring optimal visibility across different user preferences.
Professional Data Table
A comprehensive data table displays:
- Current oscillator value and percentage
- Active mode and oscillator type
- Signal status and strength
- Component breakdowns (in relative performance mode)
- Breadth percentage
- Active threshold levels
Custom Color Options
Users can override default colors with custom selections for:
- Neutral conditions (default: Material Blue)
- Bullish signals (default: Material Green)
- Bearish signals (default: Material Red)
Practical Applications
Portfolio Management
- Sector Allocation: Use relative performance mode to time technology sector exposure
- Risk Management: Monitor breadth deterioration as early warning signal
- Entry/Exit Timing: Utilize threshold crossovers for position sizing decisions
Market Analysis
- Trend Identification: Zero-line crosses indicate momentum regime changes
- Divergence Analysis: Compare MAG7 performance against broader market
- Volatility Assessment: Oscillator range and frequency provide volatility insights
Strategy Development
- Factor Timing: Implement growth factor timing strategies
- Momentum Strategies: Develop systematic momentum-based approaches
- Risk Parity: Use breadth metrics for risk-adjusted portfolio construction
Configuration Guidelines
Parameter Selection
- Momentum Period (5-100): Shorter periods (5-20) for tactical analysis, longer periods (50-100) for strategic assessment
- Smoothing Period (1-50): Higher values reduce noise but increase lag
- Thresholds: Adjust based on historical volatility and strategy requirements
Timeframe Considerations
- Daily Charts: Optimal for swing trading and medium-term analysis
- Weekly Charts: Suitable for long-term trend analysis
- Intraday Charts: Useful for short-term tactical decisions
Limitations and Considerations
Market Concentration Risk
The indicator's focus on seven stocks creates concentration risk. During periods of significant rotation away from large-cap technology stocks, the indicator may not represent broader market conditions.
Momentum Persistence
While momentum effects are well-documented, they are not permanent. Jegadeesh and Titman (1993) noted momentum reversal effects over longer time horizons (2-5 years).
Correlation Dynamics
During market stress, correlations among the constituent stocks may increase, reducing the diversification benefits and potentially amplifying signal intensity.
Performance Metrics and Backtesting
The indicator includes hidden plots for comprehensive backtesting:
- Individual stock momentum values
- Composite breadth percentage
- S&P 500 Equal Weight momentum
- Relative performance calculations
These metrics enable quantitative strategy development and historical performance analysis.
References
¹Jegadeesh, N., & Titman, S. (1993). Returns to buying winners and selling losers: Implications for stock market efficiency. Journal of Finance, 48(1), 65-91.
Carhart, M. M. (1997). On persistence in mutual fund performance. Journal of Finance, 52(1), 57-82.
Fama, E. F., & French, K. R. (2015). A five-factor asset pricing model. Journal of Financial Economics, 116(1), 1-22.
Wilder, J. W. (1978). New concepts in technical trading systems. Trend Research.

RSI Divergence StrategyOverview
The RSI Divergence Strategy Indicator is a trading tool that uses the RSI and divergences created to generate high-probability buy and sell signals.
I have provided the best formula of numbers to use for BTC on a 30 minute timeframe.
You can change where on RSI you enter and exit both long or short trades. This way you can experiment on different tokens using different entry/exit points. Can use on multiple timeframes.
This strategy is designed to open and close long or short trades based on the levels you provide it. You can then check on the RSI where the best levels are for each token you want to trade and amend it as required to generate a profitable strategy.
How It Works
The RSI Divergence Strategy Indicator uses bear and bull divergences in conjuction with a level you have input on the RSI.
RSI for Overbought/Oversold:
• Input variables for entry and exit levels and when the entry levels combine with a bear or bull divergence signal, a trade is alerted.
RSI Divergence:
• Buy and sell signals are confirmed when the RSI creates bearish or bullish divergences and these divergences are in the same area as your levels you input for entry to short or long.
After 7 years of experience and testing I have calculated the exact numbers required and produced a formula to calculate the exact input variables for a 30 minute Bitcoin chart.
Key Features
1️⃣ Divergence Identification – Ensures trades are taken only when a bull or bear divergence has formed.
2️⃣ Overbought/Oversold Input Filtering – Set up your own variables on the RSI for different markets after identifying patterns on the RSI in relation to a bearish or bullish divergence.
3️⃣ Works on any chart – Suitable for all markets and timeframes once you input the correct variables for entry and exit levels.
How to Use
🟢 Basic Trading:
• Use on any timeframe.
• Enter trade only when alert has fired off. Close when it says to exit.
• Change entry and exit levels in the properties of the strategy indicator.
• Make entry and exit levels coincide with bearish or bullish divergences on the RSI.
Check the strategy tester to see backtesting so you know if the indicator is profitable or not for that market and timeframe as each crypto token is different and so is the timeframe you choose.
📢 Webhook Automation:
• Set up TradingView Alerts to auto-execute trades via Webhook-compatible platforms.
Key additions for divergence visualization:
Divergence Arrows:
Bullish divergence: Green label with white 'bull ' text
Bearish divergence: Red label with white 'bear' text
Positioned at the pivot point
Divergence Lines:
Connects consecutive RSI pivot points
Automatically drawn between consecutive pivot points
Enhanced RSI Coloring:
Overbought zone: Red
Oversold zone: Green
Neutral zone: Gray
The visualization helps you instantly spot:
Where divergences are forming on the RSI
The pattern of higher lows (bullish) or lower highs (bearish)
Contextual coloring of RSI relative to standard levels
All divergence markers appear at the correct historical pivot points, making it easy to visually confirm divergence patterns as they develop.
Strategy levels and background zones also shown to help visual look.
Why This Combination?
This indicator is just a simple RSI tool.
It is designed to filter out weak trades and only execute trades that have:
✅ RSI Divergence
✅ Overbought or Oversold Conditions
It does not calculate downtrends or bear markets so care is recommended taking long trades during these times.
Why It’s Worth Using?
📈 Open Source – Free to use and learn from.
📉 Long or Short Term Trading Style – Entry/Exit parameters options are designed for both short or long term trades allowing you to experiment until you find a profitable strategy for that market you want to trade.
📢 Seamless Webhook Automation – Execute trades automatically with TradingView alerts.
💲 Ready to trade smarter?
✅ Add the RSI Divergence Strategy Indicator to your TradingView chart.

Market Pulse ProMarket Pulse Pro (Pulse‑X) — User Guide
Market Pulse Pro, also known as Pulse‑X, is an advanced momentum indicator that combines SMI, Stochastic RSI, and a smoothed signal line to identify zones of buying and selling strength in the market. It is designed to assess the balance of power between bulls and bears with clear visualizations.
How It Works
The indicator calculates three main components:
SMI (Stochastic Momentum Index) – measures price position relative to its recent range.
Stochastic RSI – captures overbought/oversold extremes of the RSI.
Smoothed Signal Line – based on closing price, smoothed using various methods (such as HMA, EMA, etc.).
Each component is normalized to create two final values:
Bull Herd (Buying Strength) – green line.
Bear Winter (Selling Strength) – red line.
Interpretation
Bull Herd (high green values): Bulls dominate the market. May indicate the start or continuation of an uptrend.
Bear Winter (high red values): Bears dominate. May indicate reversal or continuation of a downtrend.
Convergence around 50%: Market is balanced. Signals are weaker or indecisive.
Tip: Combine with price action analysis or support/resistance levels to confirm entries.
Customizable Settings
You can adjust:
SMI Period, Smooth K, and D – control the sensitivity of the SMI.
RSI Period – sets the RSI calculation window.
Signal Period – period for the price-based signal line.
Smoothing Methods – choose between HMA, EMA, WMA, JMA, SMMA, etc.
Line Width – thickness of the plotted lines.
Note: The JMA (Jurik Moving Average) used in this script is not the original proprietary version.
It is a custom public version, based on open-source code shared by the TradingView community.
The original JMA is copyrighted and owned by Jurik Research.
How to Use It in Practice
Buy Entries
When the green Bull Herd line crosses above 60 and the red Bear Winter line falls below 40.
Entry is more reliable if the green line is rising steadily.
Sell Entries
When the red Bear Winter line crosses above 60 and the green Bull Herd line falls.
Signals are stronger when there is a clear crossover and divergence between the two lines.
Avoid trading near the neutral zone (~50%), where the market shows indecision.
Additional Tips
Combine with volume analysis or reversal candlestick patterns for higher accuracy.
Test different smoothing methods: HMA is more responsive, SMMA is smoother and slower.

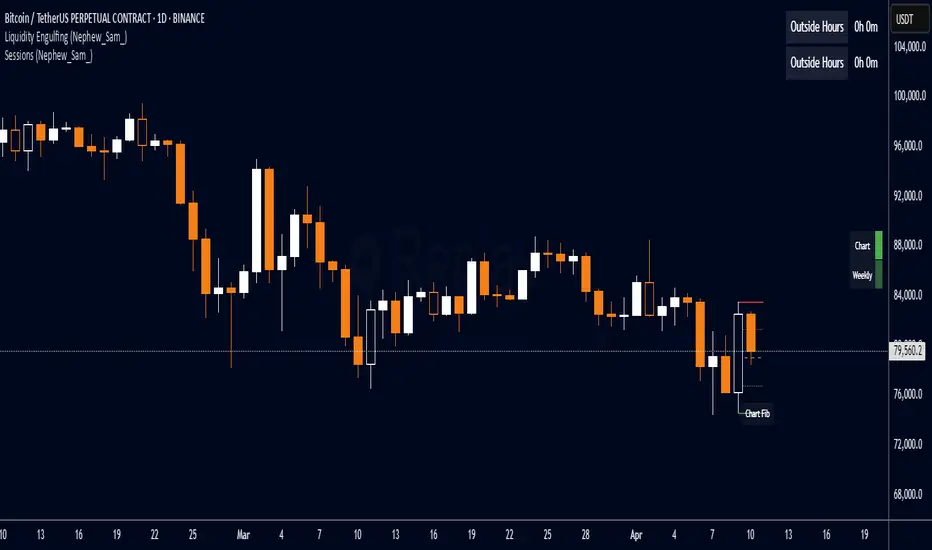
Liquidity Engulfing (Nephew_Sam_)🔥 Liquidity Engulfing Multi-Timeframe Detector
This indicator finds engulfing bars which have swept liquidity from its previous candle. You can use it across 6 timeframes with fibonacci entries.
⚡ Key Features
6 Customizable Timeframes - Complete market structure analysis
Smart Liquidity Detection - Finds patterns that sweep liquidity then reverse
Real-Time Status Table - Confirmed vs unconfirmed patterns with color coding
Fibonacci Integration - 5 customizable fib levels for precise entries
HTF → LTF Strategy - Spot reversals on higher timeframes, enter on lower timeframe fibs
📈 Engulfing Rules
Bullish: Current candle bullish + previous bearish + current low < previous low + current close > previous open
Bearish: Current candle bearish + previous bullish + current high > previous high + current close < previous open
(Mustang Algo) Stochastic RSI + Triple EMAStochastic RSI + Triple EMA (StochTEMA)
Overview
The Stochastic RSI + Triple EMA indicator combines the Stochastic RSI oscillator with a Triple Exponential Moving Average (TEMA) overlay to generate clear buy and sell signals on the price chart. By measuring RSI overbought/oversold conditions and confirming trend direction with TEMA, this tool helps traders identify high-probability entries and exits while filtering out noise in choppy markets.
Key Features
Stochastic RSI Calculation
Computes a standard RSI over a user-defined period (default 50).
Applies a Stochastic oscillator to the RSI values over a second user-defined period (default 50).
Smooths the %K line by taking an SMA over a third input (default 3), and %D is an SMA of %K over another input (default 3).
Defines oversold when both %K and %D are below 20, and overbought when both are above 80.
Triple EMA (TEMA)
Calculates three successive EMAs on the closing price with the same length (default 9).
Combines them using TEMA = 3×(EMA1 – EMA2) + EMA3, producing a fast-reacting trend line.
Bullish trend is identified when price > TEMA and TEMA is rising; bearish trend when price < TEMA and TEMA is falling; neutral/flat when TEMA change is minimal.
Signal Logic
Strong Buy: Previous bar’s Stoch RSI was oversold (both %K and %D < 20), %K crosses above %D, and TEMA is in a bullish trend.
Medium Buy: %K crosses above %D (without requiring oversold), TEMA is bullish, and previous %K < 50.
Weak Buy: Previous bar’s %K and %D were oversold, %K crosses above %D, TEMA is flat or bullish (not bearish).
Strong Sell: Previous bar’s Stoch RSI was overbought (both %K and %D > 80), %K crosses below %D, and TEMA is bearish.
Medium Sell: %K crosses below %D (without requiring overbought), TEMA is bearish, and previous %K > 50.
Weak Sell: Previous bar’s %K and %D were overbought, %K crosses below %D, TEMA is flat or bearish (not bullish).
Visual Elements on Chart
TEMA Line: Plotted in cyan (#00BCD4) with a medium-thick line for clear trend visualization.
Buy/Sell Markers:
BUY STRONG: Lime label below the candle
BUY MEDIUM: Green triangle below the candle
BUY WEAK: Semi-transparent green circle below the candle
SELL STRONG: Red label above the candle
SELL MEDIUM: Orange triangle above the candle
SELL WEAK: Semi-transparent orange circle above the candle
Candle & Background Coloring: When a strong buy or sell signal occurs, the candle body is tinted (semi-transparent lime/red) and the chart background briefly flashes light green (buy) or light red (sell).
Dynamic Support/Resistance:
On a strong buy signal, a green dot is plotted under that bar’s low as a temporary support marker.
On a strong sell signal, a red dot is plotted above that bar’s high as a temporary resistance marker.
Alerts
Strong Buy Alert: Triggered when Stoch RSI is oversold, %K crosses above %D, and TEMA is bullish.
Strong Sell Alert: Triggered when Stoch RSI is overbought, %K crosses below %D, and TEMA is bearish.
General Buy Alert: Triggered on any bullish crossover (%K > %D) when TEMA is not bearish.
General Sell Alert: Triggered on any bearish crossover (%K < %D) when TEMA is not bullish.
Inputs
Stochastic RSI Settings (group “Stochastic RSI”):
K (smoothK): Period length for smoothing the %K line (default 3, minimum 1)
D (smoothD): Period length for smoothing the %D line (default 3, minimum 1)
RSI Length (lengthRSI): Number of bars used for the RSI calculation (default 50, minimum 1)
Stochastic Length (lengthStoch): Number of bars for the Stochastic oscillator applied to RSI (default 50, minimum 1)
RSI Source (src): Price source for the RSI (default = close)
TEMA Settings (group “Triple EMA”):
TEMA Length (lengthTEMA): Number of bars used for each of the three EMAs (default 9, minimum 1)
How to Use
Add the Script
Copy and paste the indicator code into TradingView’s Pine Editor (version 6).
Save the script and add it to your chart as “Stochastic RSI + Triple EMA (StochTEMA).”
Adjust Inputs
Choose shorter lengths for lower timeframes (e.g., intraday scalping) and longer lengths for higher timeframes (e.g., swing trading).
Fine-tune the Stochastic RSI parameters (K, D, RSI Length, Stochastic Length) to suit the volatility of the instrument.
Modify TEMA Length if you prefer a faster or slower moving average response.
Interpret Signals
Primary Entries/Exits: Focus on “BUY STRONG” and “SELL STRONG” signals, as they require both oversold/overbought conditions and a confirming TEMA trend.
Confirmation Signals: Use “BUY MEDIUM”/“BUY WEAK” to confirm or add to an existing position when the market is trending. Similarly, “SELL MEDIUM”/“SELL WEAK” can be used to scale out or confirm bearish momentum.
Support/Resistance Dots: These help identify recent swing lows (green dots) and swing highs (red dots) that were tagged by strong signals—useful to place stop-loss or profit-target orders.
Set Alerts
Open the Alerts menu (bell icon) in TradingView, choose this script, and select the desired alert condition (e.g., “BUY Signal Strong”).
Configure notifications (popup, email, webhook) according to your trading workflow.
Notes & Best Practices
Filtering False Signals: By combining Stoch RSI crossovers with TEMA trend confirmation, most false breakouts during choppy price action are filtered out.
Timeframe Selection: This indicator works on all timeframes, but shorter timeframes may generate frequent signals—consider higher-timeframe confirmation when trading lower timeframes.
Risk Management: Always use proper position sizing and stop-loss placement. An “oversold” or “overbought” reading can remain extended for some time in strong trends.
Backtesting/Optimization: Before live trading, backtest different parameter combinations on historical data to find the optimal balance between sensitivity and reliability for your chosen instrument.
No Guarantee of Profits: As with any technical indicator, past performance does not guarantee future results. Use in conjunction with other forms of analysis (volume, price patterns, fundamentals).
Author: Your Name or Username
Version: 1.0 (Pine Script v6)
Published: June 2025
Feel free to customize input values and visual preferences. If you find bugs or have suggestions for improvements, open an issue or leave a comment below. Trade responsibly!

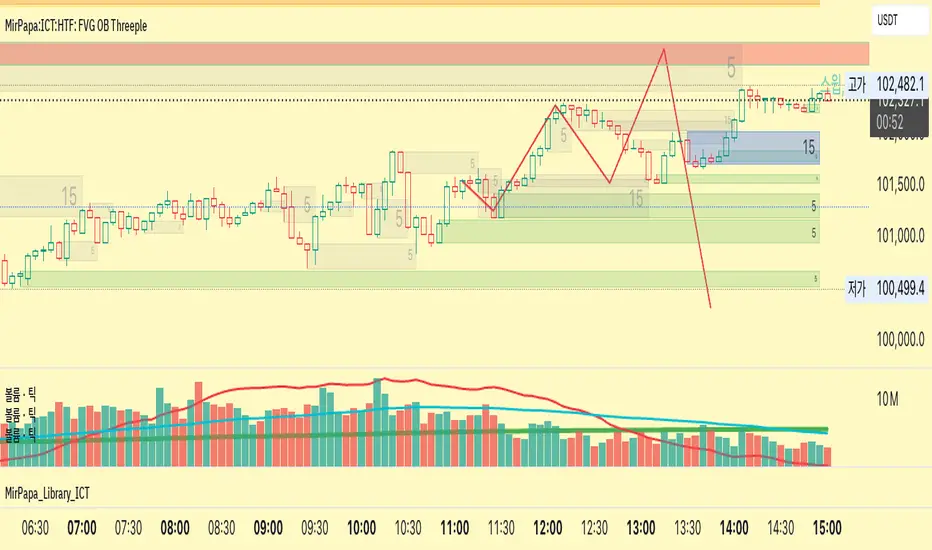
MirPapa:ICT:HTF: FVG OB Threeple# MirPapa:ICT:HTF: FVG OB (Fair Value Gap Order Block)
**Version:** Pine Script® v6
**Author:** © goodia
**License:** MPL-2.0 (Mozilla Public License 2.0)
---
## Overview
“FVG OB” (Fair Value Gap Order Block) identifies higher-timeframe candle ranges where a gap (imbalance) exists between two non-consecutive candles, signaling potential institutional order blocks. This module draws bullish or bearish FVG OB boxes on your lower-timeframe chart, extends them until price interacts a specified number of times, and then finalizes (recolors) the box.
---
## Inputs
- **Enable FVG OB Boxes** (`bool`)
Toggle drawing of HTF FVG OB boxes on the chart.
- **Enable FVG OB Midlines** (`bool`)
Toggle drawing of a midpoint line inside each FVG OB box.
- **FVG OB Close Count** (`int` 1–10)
Number of HTF closes beyond the FVG range required to finalize (recolor) the box.
- **FVG OB Bull Color** (`color`)
Fill & border color for bullish FVG OB boxes.
- **FVG OB Bear Color** (`color`)
Fill & border color for bearish FVG OB boxes.
- **FVG OB Box Transparency** (`int` 1–100)
Opacity level for FVG OB box fills (higher = more transparent).
---
## How It Works
1. **HTF Data Retrieval**
- The script uses `request.security()` (via `GetHTFrevised()`) to fetch HTF OHLC and historical values:
- `_htfHigh3` (high three bars ago) and `_htfLow1` (low one bar ago) for bullish FVG OB.
- `_htfLow3` (low three bars ago) and `_htfHigh1` (high one bar ago) for bearish FVG OB.
- It also tracks the HTF `bar_index` on the lower timeframe to align drawing.
2. **FVG OB Detection**
- **Bullish FVG OB**: Occurs when the HTF low of the previous bar (`low `) is strictly above the HTF high of three bars ago (`high `), creating a gap.
- **Bearish FVG OB**: Occurs when the HTF high of the previous bar (`high `) is strictly below the HTF low of three bars ago (`low `), creating a gap.
3. **Box Creation**
- On each new HTF bar (`ta.change(time(HTF)) != 0`), if a bullish or bearish FVG OB condition is met, the script calls `CreateBoxData()` with:
- **Bullish**: `bottom = HTF low `, `top = HTF high `, `_isBull = true`.
- **Bearish**: `bottom = HTF low `, `top = HTF high `, `_isBull = false`.
- Midline toggled by input.
- A `BoxData` struct is created and stored in either the Bull or Bear array.
4. **Box Extension & Finalization**
- On **every LTF bar**, `ProcessBoxDatas(...)` iterates over all active FVG OB boxes:
1. **Extend Right Edge**: `box.set_right(bar_index)` ensures the box follows the latest bar.
2. **Record Volume Delta**: Tracks buy/sell volume inside the box.
3. **Touch Stage Update**: `modBoxUpdateStage()` increments `_stage` when price touches its “basePoint” (for FVG OB, the basePrice is one side of the gap).
4. **Finalize**: `setBoxFinalize()` checks if the configured number of closes beyond the FVG gap (`FVG OB Close Count`) has occurred. If so:
- `_isActive := false`
- Border and background colors are changed to the “Box Close Color” (input).
- Finalized boxes remain on screen semi-transparent, indicating that the FVG OB zone has been tested.
5. **Midline (Optional)**
- If “Enable FVG OB Midlines” is checked, `ProcessBoxDatas()` also extends a horizontal midpoint line inside the box with `line.set_x2(bar_index)`.
---
## Usage Instructions
1. **Installation**
- Copy the FVG OB section of the Pine Script into TradingView’s Pine Editor (ensure the library import is included).
- Click “Add to Chart.”
2. **Configure Inputs**
- Choose a Higher Time Frame via the dropdown (e.g., “4시간” maps to a 4H timeframe).
- Toggle “Enable FVG OB Boxes” and “Enable FVG OB Midlines.”
- Select colors for bullish and bearish boxes and set transparency.
- Adjust “FVG OB Close Count” to control how many closes beyond the gap finalize the box.
3. **Interpretation**
- **Active FVG OB Boxes** extend to the right until price closes beyond the gap range the specified number of times.
- When finalized, each box changes to the “Box Close Color,” signaling that institutional orders in that gap have likely been filled.
Enjoy precise visualization of higher-timeframe Fair Value Gap Order Blocks on your lower-timeframe chart!
Canuck Trading Projection IndicatorCanuck Trading Projection Indicator
Overview
The Canuck Trading Projection Indicator is a powerful PineScript v6 tool designed for TradingView to project potential bullish and bearish price trajectories based on historical price and volume movements. It provides traders with actionable insights by estimating future price targets and assigning confidence levels to each outlook, helping to identify probable market directions across any timeframe. Ideal for both short-term and long-term traders, this indicator combines momentum analysis, RSI filtering, support/resistance detection, and time-weighted trend analysis to deliver robust projections.
Features
Bullish and Bearish Projections: Forecasts price targets for upward (bullish) and downward (bearish) movements over a user-defined projection period (default 20 bars).
Confidence Levels: Assigns percentage confidence scores to each outlook, reflecting the likelihood of the projected price based on historical trends, volatility, and volume.
RSI Filter: Incorporates a 14-period Relative Strength Index (RSI) to validate trends, requiring RSI > 50 for bullish and RSI < 50 for bearish signals.
Support/Resistance Detection: Adjusts confidence levels when projections are near key swing highs/lows (within 2% of average price), boosting confidence by 5% for alignments.
Time-Based Weighting: Prioritizes recent price movements in trend analysis, giving more weight to newer bars for improved relevance.
Customizable Inputs: Allows users to tailor lookback period, projection bars, RSI period, confidence threshold, colors, and label positioning.
Forced Label Spacing: Prevents overlap of bullish and bearish text labels, even for tight projections, using fixed vertical slots when price differences are small (<2% of average price).
Timeframe Flexibility: Works seamlessly across all TradingView timeframes (e.g., 30-minute, hourly, daily, weekly, monthly), adapting projections to the chart’s resolution.
Clean Visualization: Displays projections as green (bullish) and red (bearish) dashed lines, with non-overlapping text labels at the projection endpoints showing price targets and confidence levels.
How It Works
The indicator analyzes historical price and volume data over a user-defined lookback period (default 50 bars) to calculate:
Momentum: Combines price changes and volume to assess trend strength, using a weighted moving average (WMA) for directional bias.
Trend Analysis: Counts bullish (price up, volume above average, RSI > 50) and bearish (price down, volume above average, RSI < 50) trends, weighting recent bars more heavily.
Projections:
Bullish Slope: Positive or flat when momentum is upward, scaled by price change and momentum intensity.
Bearish Slope: Negative or flat when momentum is downward, amplified by bearish confidence for stronger projections.
Projects prices forward by 20 bars (default) using current close plus slope times projection bars.
Confidence Levels:
Base confidence derived from the proportion of bullish/bearish trends, with a 5% minimum to avoid zero confidence.
Adjusted by volatility (lower volatility increases confidence), volume trends, and proximity to support/resistance levels.
Visualization:
Draws projection lines from the current close to the 20-bar future target.
Places text labels at line endpoints, showing price targets and confidence percentages, with forced spacing for readability.
Input Parameters
Lookback Period (default: 50): Number of bars for historical analysis (minimum 10).
Projection Bars (default: 20): Number of bars to project forward (minimum 5).
Confidence Threshold (default: 0.6): Minimum confidence for strong trend indication (0.1 to 1.0).
Bullish Projection Line Color (default: Green): Color for bullish projection line and label.
Bearish Projection Line Color (default: Red): Color for bearish projection line and label.
RSI Period (default: 14): Period for RSI momentum filter (minimum 5).
Label Vertical Offset (%) (default: 1.0): Base offset for labels as a percentage of price range (0.1% to 5.0%).
Minimum Label Spacing (%) (default: 2.0): Minimum vertical spacing between labels for tight projections (0.5% to 10.0%).
Usage Instructions
Add to Chart: Copy the script into TradingView’s Pine Editor, save, and add the indicator to your chart.
Select Timeframe: Apply to any timeframe (e.g., 30-minute, hourly, daily, weekly, monthly) to match your trading strategy.
Interpret Outputs:
Green Line/Label: Bullish price target and confidence (e.g., "Bullish: 414.37, Confidence: 35%").
Red Line/Label: Bearish price target and confidence (e.g., "Bearish: 279.08, Confidence: 41.3%").
Higher confidence indicates a stronger likelihood of the projected outcome.
Adjust Inputs:
Modify Lookback Period to focus on shorter/longer historical trends (e.g., 20 for short-term, 100 for long-term).
Change Projection Bars to adjust forecast horizon (e.g., 10 for shorter, 50 for longer).
Tweak RSI Period or Confidence Threshold for sensitivity to momentum or trend strength.
Customize Colors for visual preference.
Increase Minimum Label Spacing if labels overlap in volatile markets.
Combine with Analysis: Use alongside other indicators (e.g., moving averages, Bollinger Bands) or fundamental analysis to confirm signals, as projections are probabilistic.
Example: TSLA Across Timeframes
Using live TSLA data (close ~346.46 USD, May 31, 2025), the indicator produces:
30-Minute: Bullish 341.93 (13.3%), Bearish 327.96 (86.7%) – Strong bearish sentiment due to intraday volatility.
1-Hour: Bullish 342.00 (33.9%), Bearish 327.50 (62.3%) – Bearish but less intense, reflecting hourly swings.
4-Hour: Bullish 345.52 (73.4%), Bearish 344.44 (19.0%) – Flat outlook, indicating consolidation.
Daily: Bullish 391.26 (68.8%), Bearish 302.22 (31.2%) – Bullish bias from recent uptrend, bearish tempered by longer lookback.
Weekly: Bullish 414.37 (35.0%), Bearish 279.08 (41.3%) – Wide range, reflecting annual volatility.
Monthly: Bullish 396.70 (54.9%), Bearish 296.93 (10.2%) – Long-term bullish optimism.
These results align with market dynamics: short-term intervals capture volatility, while longer intervals smooth trends, providing balanced outlooks.
Notes
Accuracy: Projections are estimates based on historical data and should be used with other analysis tools. Confidence levels indicate likelihood, not certainty.
Timeframe Sensitivity: Short-term intervals (e.g., 30-minute) show larger price swings and higher confidence due to volatility, while longer intervals (e.g., monthly) are more stable.
Customization: Adjust inputs to match your trading style (e.g., shorter lookback for day trading, longer for swing trading).
Performance: Tested on volatile stocks like TSLA, NVIDIA, and others, ensuring robust performance across markets.
Limitations: May produce conservative bearish projections in strong uptrends due to momentum weighting. Adjust lookback or projection_bars for sensitivity.
Feedback
If you encounter issues (e.g., label overlap, projection mismatches), please share your timeframe, settings, or a screenshot. Suggestions for enhancements (e.g., additional filters, visual tweaks) are welcome!
Disclaimer
The Canuck Trading Projection Indicator is provided for educational and informational purposes only. It is not financial advice. Trading involves significant risks, and past performance is not indicative of future results. Always perform your own due diligence and consult a qualified financial advisor before making trading decisions.

Schmit Trading LiquidityDescription
Schmit Trading Liquidity Marker automatically spots and labels open liquidity sweep levels by detecting classic stop-run patterns (Bull→Bear for highs, Bear→Bull for lows) across multiple timeframes. Lines are drawn exactly at the wick of the triggering candle and removed as soon as price “sweeps” through them, keeping your chart clean and focused on live levels only.
How It Works
1. Pattern Detection
• Liquidity High: When a bullish candle is immediately followed by a bearish candle (Bull→Bear), the script records the higher of the two wicks.
• Liquidity Low: When a bearish candle is immediately followed by a bullish candle (Bear→Bull), the script records the lower of the two wicks.
2. Multi-Timeframe Support
• Choose up to six timeframes (5 min, 15 min, 30 min, 1 h, 4 h, daily) via checkboxes.
• Each timeframe is evaluated independently, and liquidity levels are drawn on your current chart.
3. Precision Wick Placement
• Lines start at bar_index – 1 so they align exactly with the wick of the signal candle, regardless of your chart’s timeframe.
4. Automatic Cleanup
• As soon as price closes beyond a drawn line (sweep), that line is deleted automatically.
Inputs
Input Name Description
Show 5 min. Enable liquidity detection on the 5-minute timeframe.
Show 15 min. Enable liquidity detection on the 15-minute timeframe.
Show 30 min. Enable liquidity detection on the 30-minute timeframe.
Show 1 h. Enable liquidity detection on the 1-hour timeframe.
Show 4 h. Enable liquidity detection on the 4-hour timeframe.
Show 1 D. Enable liquidity detection on the daily timeframe.
High Line Color. Color of Bull→Bear (liquidity high) lines (default: red).
Low Line Color. Color of Bear→Bull (liquidity low) lines (default: blue).
Line Length. How many bars each liquidity line extends to the right.
Usage Tips
• Focus on Live Zones: Combine with volume or order-flow tools to confirm genuine
liquidity sweeps.
• Multiple TFs: Enable higher timeframes for major liquidity clusters; lower timeframes
for fine‐tuning entries.
• Chart Cleanliness: Lines self‐delete on sweep, ensuring no manual cleanup is needed.
⸻
Disclosure & License
This indicator is Open-Source under the Mozilla Public License 2.0. Feel free to review, adapt, and improve the code. No performance guarantees—use responsibly and backtest any strategy before trading live.

FvgPanel█ OVERVIEW
This library provides functionalities for creating and managing a display panel within a Pine Script™ indicator. Its primary purpose is to offer a structured way to present Fair Value Gap (FVG) information, specifically the nearest bullish and bearish FVG levels across different timeframes (Current, MTF, HTF), directly on the chart. The library handles the table's structure, header initialization, and dynamic cell content updates.
█ CONCEPTS
The core of this library revolves around presenting summarized FVG data in a clear, tabular format. Key concepts include:
FVG Data Aggregation and Display
The panel is designed to show at-a-glance information about the closest active FVG mitigation levels. It doesn't calculate these FVGs itself but relies on the main script to provide this data. The panel is structured with columns for timeframes (TF), Bullish FVGs, and Bearish FVGs, and rows for "Current" (LTF), "MTF" (Medium Timeframe), and "HTF" (High Timeframe).
The `panelData` User-Defined Type (UDT)
To facilitate the transfer of information to be displayed, the library defines a UDT named `panelData`. This structure is central to the library's operation and is designed to hold all necessary values for populating the panel's data cells for each relevant FVG. Its fields include:
Price levels for the nearest bullish and bearish FVGs for LTF, MTF, and HTF (e.g., `nearestBullMitLvl`, `nearestMtfBearMitLvl`).
Boolean flags to indicate if these FVGs are classified as "Large Volume" (LV) (e.g., `isNearestBullLV`, `isNearestMtfBearLV`).
Color information for the background and text of each data cell, allowing for conditional styling based on the FVG's status or proximity (e.g., `ltfBullBgColor`, `mtfBearTextColor`).
The design of `panelData` allows the main script to prepare all display-related data and styling cues in one object, which is then passed to the `updatePanel` function for rendering. This separation of data preparation and display logic keeps the library focused on its presentation task.
Visual Cues and Formatting
Price Formatting: Price levels are formatted to match the instrument's minimum tick size using an internal `formatPrice` helper function, ensuring consistent and accurate display.
Large FVG Icon: If an FVG is marked as a "Large Volume" FVG in the `panelData` object, a user-specified icon (e.g., an emoji) is prepended to its price level in the panel, providing an immediate visual distinction.
Conditional Styling: The background and text colors for each FVG level displayed in the panel can be individually controlled via the `panelData` object, enabling the main script to implement custom styling rules (e.g., highlighting the overall nearest FVG across all timeframes).
Handling Missing Data: If no FVG data is available for a particular cell (i.e., the corresponding level in `panelData` is `na`), the panel displays "---" and uses a specified background color for "Not Available" cells.
█ CALCULATIONS AND USE
Using the `FvgPanel` typically involves a two-stage process: initialization and dynamic updates.
Step 1: Panel Creation
First, an instance of the panel table is created once, usually during the script's initial setup. This is done using the `createPanel` function.
Call `createPanel()` with parameters defining its position on the chart, border color, border width, header background color, header text color, and header text size.
This function initializes the table with three columns ("TF", "Bull FVG", "Bear FVG") and three data rows labeled "Current", "MTF", and "HTF", plus a header row.
Store the returned `table` object in a `var` variable to persist it across bars.
// Example:
var table infoPanel = na
if barstate.isfirst
infoPanel := panel.createPanel(
position.top_right,
color.gray,
1,
color.new(color.gray, 50),
color.white,
size.small
)
Step 2: Panel Updates
On each bar, or whenever the FVG data changes (typically on `barstate.islast` or `barstate.isrealtime` for efficiency), the panel's content needs to be refreshed. This is done using the `updatePanel` function.
Populate an instance of the `panelData` UDT with the latest FVG information. This includes setting the nearest bullish/bearish mitigation levels for LTF, MTF, and HTF, their LV status, and their desired background and text colors.
Call `updatePanel()`, passing the persistent `table` object (from Step 1), the populated `panelData` object, the icon string for LV FVGs, the default text color for FVG levels, the background color for "N/A" cells, and the general text size for the data cells.
The `updatePanel` function will then clear previous data and fill the table cells with the new values and styles provided in the `panelData` object.
// Example (inside a conditional block like 'if barstate.islast'):
var panelData fvgDisplayData = panelData.new()
// ... (logic to populate fvgDisplayData fields) ...
// fvgDisplayData.nearestBullMitLvl = ...
// fvgDisplayData.ltfBullBgColor = ...
// ... etc.
if not na(infoPanel)
panel.updatePanel(
infoPanel,
fvgDisplayData,
"🔥", // LV FVG Icon
color.white,
color.new(color.gray, 70), // NA Cell Color
size.small
)
This workflow ensures that the panel is drawn only once and its cells are efficiently updated as new data becomes available.
█ NOTES
Data Source: This library is solely responsible for the visual presentation of FVG data in a table. It does not perform any FVG detection or calculation. The calling script must compute or retrieve the FVG levels, LV status, and desired styling to populate the `panelData` object.
Styling Responsibility: While `updatePanel` applies colors passed via the `panelData` object, the logic for *determining* those colors (e.g., highlighting the closest FVG to the current price) resides in the calling script.
Performance: The library uses `table.cell()` to update individual cells, which is generally more efficient than deleting and recreating the table on each update. However, the frequency of `updatePanel` calls should be managed by the main script (e.g., using `barstate.islast` or `barstate.isrealtime`) to avoid excessive processing on historical bars.
`series float` Handling: The price level fields within the `panelData` UDT (e.g., `nearestBullMitLvl`) can accept `series float` values, as these are typically derived from price data. The internal `formatPrice` function correctly handles `series float` for display.
Dependencies: The `FvgPanel` itself is self-contained and does not import other user libraries. It uses standard Pine Script™ table and string functionalities.
█ EXPORTED TYPES
panelData
Represents the data structure for populating the FVG information panel.
Fields:
nearestBullMitLvl (series float) : The price level of the nearest bullish FVG's mitigation point (bottom for bull) on the LTF.
isNearestBullLV (series bool) : True if the nearest bullish FVG on the LTF is a Large Volume FVG.
ltfBullBgColor (series color) : Background color for the LTF bullish FVG cell in the panel.
ltfBullTextColor (series color) : Text color for the LTF bullish FVG cell in the panel.
nearestBearMitLvl (series float) : The price level of the nearest bearish FVG's mitigation point (top for bear) on the LTF.
isNearestBearLV (series bool) : True if the nearest bearish FVG on the LTF is a Large Volume FVG.
ltfBearBgColor (series color) : Background color for the LTF bearish FVG cell in the panel.
ltfBearTextColor (series color) : Text color for the LTF bearish FVG cell in the panel.
nearestMtfBullMitLvl (series float) : The price level of the nearest bullish FVG's mitigation point on the MTF.
isNearestMtfBullLV (series bool) : True if the nearest bullish FVG on the MTF is a Large Volume FVG.
mtfBullBgColor (series color) : Background color for the MTF bullish FVG cell.
mtfBullTextColor (series color) : Text color for the MTF bullish FVG cell.
nearestMtfBearMitLvl (series float) : The price level of the nearest bearish FVG's mitigation point on the MTF.
isNearestMtfBearLV (series bool) : True if the nearest bearish FVG on the MTF is a Large Volume FVG.
mtfBearBgColor (series color) : Background color for the MTF bearish FVG cell.
mtfBearTextColor (series color) : Text color for the MTF bearish FVG cell.
nearestHtfBullMitLvl (series float) : The price level of the nearest bullish FVG's mitigation point on the HTF.
isNearestHtfBullLV (series bool) : True if the nearest bullish FVG on the HTF is a Large Volume FVG.
htfBullBgColor (series color) : Background color for the HTF bullish FVG cell.
htfBullTextColor (series color) : Text color for the HTF bullish FVG cell.
nearestHtfBearMitLvl (series float) : The price level of the nearest bearish FVG's mitigation point on the HTF.
isNearestHtfBearLV (series bool) : True if the nearest bearish FVG on the HTF is a Large Volume FVG.
htfBearBgColor (series color) : Background color for the HTF bearish FVG cell.
htfBearTextColor (series color) : Text color for the HTF bearish FVG cell.
█ EXPORTED FUNCTIONS
createPanel(position, borderColor, borderWidth, headerBgColor, headerTextColor, headerTextSize)
Creates and initializes the FVG information panel (table). Sets up the header rows and timeframe labels.
Parameters:
position (simple string) : The position of the panel on the chart (e.g., position.top_right). Uses position.* constants.
borderColor (simple color) : The color of the panel's border.
borderWidth (simple int) : The width of the panel's border.
headerBgColor (simple color) : The background color for the header cells.
headerTextColor (simple color) : The text color for the header cells.
headerTextSize (simple string) : The text size for the header cells (e.g., size.small). Uses size.* constants.
Returns: The newly created table object representing the panel.
updatePanel(panelTable, data, lvIcon, defaultTextColor, naCellColor, textSize)
Updates the content of the FVG information panel with the latest FVG data.
Parameters:
panelTable (table) : The table object representing the panel to be updated.
data (panelData) : An object containing the FVG data to display.
lvIcon (simple string) : The icon (e.g., emoji) to display next to Large Volume FVGs.
defaultTextColor (simple color) : The default text color for FVG levels if not highlighted.
naCellColor (simple color) : The background color for cells where no FVG data is available ("---").
textSize (simple string) : The text size for the FVG level data (e.g., size.small).
Returns: _void

FvgCalculations█ OVERVIEW
This library provides the core calculation engine for identifying Fair Value Gaps (FVGs) across different timeframes and for processing their interaction with price. It includes functions to detect FVGs on both the current chart and higher timeframes, as well as to check for their full or partial mitigation.
█ CONCEPTS
The library's primary functions revolve around the concept of Fair Value Gaps and their lifecycle.
Fair Value Gap (FVG) Identification
An FVG, or imbalance, represents a price range where buying or selling pressure was significant enough to cause a rapid price movement, leaving an "inefficiency" in the market. This library identifies FVGs based on three-bar patterns:
Bullish FVG: Forms when the low of the current bar (bar 3) is higher than the high of the bar two periods prior (bar 1). The FVG is the space between the high of bar 1 and the low of bar 3.
Bearish FVG: Forms when the high of the current bar (bar 3) is lower than the low of the bar two periods prior (bar 1). The FVG is the space between the low of bar 1 and the high of bar 3.
The library provides distinct functions for detecting FVGs on the current (Low Timeframe - LTF) and specified higher timeframes (Medium Timeframe - MTF / High Timeframe - HTF).
FVG Mitigation
Mitigation refers to price revisiting an FVG.
Full Mitigation: An FVG is considered fully mitigated when price completely closes the gap. For a bullish FVG, this occurs if the current low price moves below or touches the FVG's bottom. For a bearish FVG, it occurs if the current high price moves above or touches the FVG's top.
Partial Mitigation (Entry/Fill): An FVG is partially mitigated when price enters the FVG's range but does not fully close it. The library tracks the extent of this fill. For a bullish FVG, if the current low price enters the FVG from above, that low becomes the new effective top of the remaining FVG. For a bearish FVG, if the current high price enters the FVG from below, that high becomes the new effective bottom of the remaining FVG.
FVG Interaction
This refers to any instance where the current bar's price range (high to low) touches or crosses into the currently unfilled portion of an active (visible and not fully mitigated) FVG.
Multi-Timeframe Data Acquisition
To detect FVGs on higher timeframes, specific historical bar data (high, low, and time of bars at indices and relative to the higher timeframe's last completed bar) is required. The requestMultiTFBarData function is designed to fetch this data efficiently.
█ CALCULATIONS AND USE
The functions in this library are typically used in a sequence to manage FVGs:
1. Data Retrieval (for MTF/HTF FVGs):
Call requestMultiTFBarData() with the desired higher timeframe string (e.g., "60", "D").
This returns a tuple of htfHigh1, htfLow1, htfTime1, htfHigh3, htfLow3, htfTime3.
2. FVG Detection:
For LTF FVGs: Call detectFvg() on each confirmed bar. It uses high , low, low , and high along with barstate.isconfirmed.
For MTF/HTF FVGs: Call detectMultiTFFvg() using the data obtained from requestMultiTFBarData().
Both detection functions return an fvgObject (defined in FvgTypes) if an FVG is found, otherwise na. They also can classify FVGs as "Large Volume" (LV) if classifyLV is true and the FVG size (top - bottom) relative to the tfAtr (Average True Range of the respective timeframe) meets the lvAtrMultiplier.
3. FVG State Updates (on each new bar for existing FVGs):
First, check for overall price interaction using fvgInteractionCheck(). This function determines if the current bar's high/low has touched or entered the FVG's currentTop or currentBottom.
If interaction occurs and the FVG is not already mitigated:
Call checkMitigation() to determine if the FVG has been fully mitigated by the current bar's currentHigh and currentLow. If true, the FVG's isMitigated status is updated.
If not fully mitigated, call checkPartialMitigation() to see if the price has further entered the FVG. This function returns the newLevel to which the FVG has been filled (e.g., currentLow for a bullish FVG, currentHigh for bearish). This newLevel is then used to update the FVG's currentTop or currentBottom.
The calling script (e.g., fvgMain.c) is responsible for storing and managing the array of fvgObject instances and passing them to these update functions.
█ NOTES
Bar State for LTF Detection: The detectFvg() function relies on barstate.isconfirmed to ensure FVG detection is based on closed bars, preventing FVGs from being detected prematurely on the currently forming bar.
Higher Timeframe Data (lookahead): The requestMultiTFBarData() function uses lookahead = barmerge.lookahead_on. This means it can access historical data from the higher timeframe that corresponds to the current bar on the chart, even if the higher timeframe bar has not officially closed. This is standard for multi-timeframe analysis aiming to plot historical HTF data accurately on a lower timeframe chart.
Parameter Typing: Functions like detectMultiTFFvg and detectFvg infer the type for boolean (classifyLV) and numeric (lvAtrMultiplier) parameters passed from the main script, while explicitly typed series parameters (like htfHigh1, currentAtr) expect series data.
fvgObject Dependency: The FVG detection functions return fvgObject instances, and fvgInteractionCheck takes an fvgObject as a parameter. This UDT is defined in the FvgTypes library, making it a dependency for using FvgCalculations.
ATR for LV Classification: The tfAtr (for MTF/HTF) and currentAtr (for LTF) parameters are expected to be the Average True Range values for the respective timeframes. These are used, if classifyLV is enabled, to determine if an FVG's size qualifies it as a "Large Volume" FVG based on the lvAtrMultiplier.
MTF/HTF FVG Appearance Timing: When displaying FVGs from a higher timeframe (MTF/HTF) on a lower timeframe (LTF) chart, users might observe that the most recent MTF/HTF FVG appears one LTF bar later compared to its appearance on a native MTF/HTF chart. This is an expected behavior due to the detection mechanism in `detectMultiTFFvg`. This function uses historical bar data from the MTF/HTF (specifically, data equivalent to `HTF_bar ` and `HTF_bar `) to identify an FVG. Therefore, all three bars forming the FVG on the MTF/HTF must be fully closed and have shifted into these historical index positions relative to the `request.security` call from the LTF chart before the FVG can be detected and displayed on the LTF. This ensures that the MTF/HTF FVG is identified based on confirmed, closed bars from the higher timeframe.
█ EXPORTED FUNCTIONS
requestMultiTFBarData(timeframe)
Requests historical bar data for specific previous bars from a specified higher timeframe.
It fetches H , L , T (for the bar before last) and H , L , T (for the bar three periods prior)
from the requested timeframe.
This is typically used to identify FVG patterns on MTF/HTF.
Parameters:
timeframe (simple string) : The higher timeframe to request data from (e.g., "60" for 1-hour, "D" for Daily).
Returns: A tuple containing: .
- htfHigh1 (series float): High of the bar at index 1 (one bar before the last completed bar on timeframe).
- htfLow1 (series float): Low of the bar at index 1.
- htfTime1 (series int) : Time of the bar at index 1.
- htfHigh3 (series float): High of the bar at index 3 (three bars before the last completed bar on timeframe).
- htfLow3 (series float): Low of the bar at index 3.
- htfTime3 (series int) : Time of the bar at index 3.
detectMultiTFFvg(htfHigh1, htfLow1, htfTime1, htfHigh3, htfLow3, htfTime3, tfAtr, classifyLV, lvAtrMultiplier, tfType)
Detects a Fair Value Gap (FVG) on a higher timeframe (MTF/HTF) using pre-fetched bar data.
Parameters:
htfHigh1 (float) : High of the first relevant bar (typically high ) from the higher timeframe.
htfLow1 (float) : Low of the first relevant bar (typically low ) from the higher timeframe.
htfTime1 (int) : Time of the first relevant bar (typically time ) from the higher timeframe.
htfHigh3 (float) : High of the third relevant bar (typically high ) from the higher timeframe.
htfLow3 (float) : Low of the third relevant bar (typically low ) from the higher timeframe.
htfTime3 (int) : Time of the third relevant bar (typically time ) from the higher timeframe.
tfAtr (float) : ATR value for the higher timeframe, used for Large Volume (LV) FVG classification.
classifyLV (bool) : If true, FVGs will be assessed to see if they qualify as Large Volume.
lvAtrMultiplier (float) : The ATR multiplier used to define if an FVG is Large Volume.
tfType (series tfType enum from no1x/FvgTypes/1) : The timeframe type (e.g., types.tfType.MTF, types.tfType.HTF) of the FVG being detected.
Returns: An fvgObject instance if an FVG is detected, otherwise na.
detectFvg(classifyLV, lvAtrMultiplier, currentAtr)
Detects a Fair Value Gap (FVG) on the current (LTF - Low Timeframe) chart.
Parameters:
classifyLV (bool) : If true, FVGs will be assessed to see if they qualify as Large Volume.
lvAtrMultiplier (float) : The ATR multiplier used to define if an FVG is Large Volume.
currentAtr (float) : ATR value for the current timeframe, used for LV FVG classification.
Returns: An fvgObject instance if an FVG is detected, otherwise na.
checkMitigation(isBullish, fvgTop, fvgBottom, currentHigh, currentLow)
Checks if an FVG has been fully mitigated by the current bar's price action.
Parameters:
isBullish (bool) : True if the FVG being checked is bullish, false if bearish.
fvgTop (float) : The top price level of the FVG.
fvgBottom (float) : The bottom price level of the FVG.
currentHigh (float) : The high price of the current bar.
currentLow (float) : The low price of the current bar.
Returns: True if the FVG is considered fully mitigated, false otherwise.
checkPartialMitigation(isBullish, currentBoxTop, currentBoxBottom, currentHigh, currentLow)
Checks for partial mitigation of an FVG by the current bar's price action.
It determines if the price has entered the FVG and returns the new fill level.
Parameters:
isBullish (bool) : True if the FVG being checked is bullish, false if bearish.
currentBoxTop (float) : The current top of the FVG box (this might have been adjusted by previous partial fills).
currentBoxBottom (float) : The current bottom of the FVG box (similarly, might be adjusted).
currentHigh (float) : The high price of the current bar.
currentLow (float) : The low price of the current bar.
Returns: The new price level to which the FVG has been filled (e.g., currentLow for a bullish FVG).
Returns na if no new partial fill occurred on this bar.
fvgInteractionCheck(fvg, highVal, lowVal)
Checks if the current bar's price interacts with the given FVG.
Interaction means the price touches or crosses into the FVG's
current (possibly partially filled) range.
Parameters:
fvg (fvgObject type from no1x/FvgTypes/1) : The FVG object to check.
Its isMitigated, isVisible, isBullish, currentTop, and currentBottom fields are used.
highVal (float) : The high price of the current bar.
lowVal (float) : The low price of the current bar.
Returns: True if price interacts with the FVG, false otherwise.

Candle Breakout Oscillator [LuxAlgo]The Candle Breakout Oscillator tool allows traders to identify the strength and weakness of the three main market states: bullish, bearish, and choppy.
Know who controls the market at any given moment with an oscillator display with values ranging from 0 to 100 for the three main plots and upper and lower thresholds of 80 and 20 by default.
🔶 USAGE
The Candle Breakout Oscillator represents the three main market states, with values ranging from 0 to 100. By default, the upper and lower thresholds are set at 80 and 20, and when a value exceeds these thresholds, a colored area is displayed for the trader's convenience.
This tool is based on pure price action breakouts. In this context, we understand a breakout as a close above the last candle's high or low, which is representative of market strength. All other close positions in relation to the last candle's limits are considered weakness.
So, when the bullish plot (in green) is at the top of the oscillator (values above 80), it means that the bullish breakouts (close below the last candle low) are at their maximum value over the calculation window, indicating an uptrend. The same interpretation can be made for the bearish plot (in red), indicating a downtrend when high.
On the other hand, weakness is indicated when values are below the lower threshold (20), indicating that breakouts are at their minimum over the last 100 candles. Below are some examples of the possible main interpretations:
There are three main things to look for in this oscillator:
Value reaches extreme
Value leaves extreme
Bullish/Bearish crossovers
As we can see on the chart, before the first crossover happens the bears come out of strength (top) and the bulls come out of weakness (bottom), then after the crossover the bulls reach strength (top) and the bears weakness (bottom), this process is repeated in reverse for the second crossover.
The other main feature of the oscillator is its ability to identify periods of sideways trends when the sideways values have upper readings above 80, and trending behavior when the sideways values have lower readings below 20. As we just saw in the case of bullish vs. bearish, sideways values signal a change in behavior when reaching or leaving the extremes of the oscillator.
🔶 DETAILS
🔹 Data Smoothing
The tool offers up to 10 different smoothing methods. In the chart above, we can see the raw data (smoothing: None) and the RMA, TEMA, or Hull moving averages.
🔹 Data Weighting
Users can add different weighting methods to the data. As we can see in the image above, users can choose between None, Volume, or Price (as in Price Delta for each breakout).
🔶 SETTINGS
Window: Execution window, 100 candles by default
🔹 Data
Smoothing Method: Choose between none or ten moving averages
Smoothing Length: Length for the moving average
Weighting Method: Choose between None, Volume, or Price
🔹 Thresholds
Top: 80 by default
Bottom: 20 by default

$ADD LevelsThis Pine Script is designed to track and visualize the NYSE Advance-Decline Line (ADD). The Advance-Decline Line is a popular market breadth indicator, showing the difference between advancing and declining stocks on the NYSE. It’s often used to gauge overall market sentiment and strength.
1. //@version=5
This line tells TradingView to use Pine Script v5, the latest and most powerful version of Pine.
2. indicator(" USI:ADD Levels", overlay=false)
• This creates a new indicator called ” USI:ADD Levels”.
• overlay=false means it will appear in a separate pane, not on the main price chart.
3. add = request.security(...)
This fetches real-time data from the symbol USI:ADD (Advance-Decline Line) using a 1-minute timeframe. You can change the timeframe if needed.
add_symbol = input.symbol(" USI:ADD ", "Market Breadth Symbol")
add = request.security(add_symbol, "1", close)
4. Key Thresholds
These define the market sentiment zones:
Zone. Value. Meaning
Overbought +1500 Extremely bullish
Bullish +1000 Generally bullish trend
Neutral ±500 Choppy, unclear market
Bearish -1000 Generally bearish trend
Oversold -1500 Extremely bearish
5. Plot the ADD Line hline(...)
Draws static lines at +1500, +1000, +500, -500, -1000, -1500 for reference so you can visually assess where ADD stands.
6. Horizontal Threshold Lines bgcolor(...)
• Green background if ADD > +1500 → extremely bullish.
• Red background if ADD < -1500 → extremely bearish.
7. Background Highlights alertcondition(...)
• Green background if ADD > +1500 → extremely bullish.
• Red background if ADD < -1500 → extremely bearish.
8. Alert Conditions. alertcondition(...)
Lets you create automatic alerts for:
• USI:ADD being very high or low.
• Crosses above +1000 (bullish trigger).
• Crosses below -1000 (bearish trigger).
You can use these to trigger trades or monitor sentiment shifts.
Summary: When to Use It
• Use this script in a market breadth dashboard.
• Combine it with price action and volume analysis.
• Monitor for ADD crosses to signal potential market reversals or momentum.

MestreDoFOMO MACD VisualMasterDoFOMO MACD Visual
Description
MasterDoFOMO MACD Visual is a custom indicator that combines a unique approach to MACD with stochastic logic and simulated Renko-based direction signals. It is designed to help traders identify entry and exit opportunities based on market momentum and trend changes, with a clear and intuitive visualization.
How It Works
Stylized MACD with Stochastic: The indicator calculates the MACD using EMAs (exponential moving averages) normalized by stochastic logic. This is done by subtracting the lowest price (lowest low) from a defined period and dividing by the range between the highest and lowest price (highest high - lowest low). The result is a MACD that is more sensitive to market conditions, magnified by a factor of 10 for better visualization.
Signal Line: An EMA of the MACD is plotted as a signal line, allowing you to identify crossovers that indicate potential trend reversals or continuations.
Histogram: The difference between the MACD and the signal line is displayed as a histogram, with distinct colors (fuchsia for positive, purple for negative) to make momentum easier to read.
Simulated Renko Direction: Uses ATR (Average True Range) to calculate the size of Renko "bricks", generating signals of change in direction (bullish or bearish). These signals are displayed as arrows on the chart, helping to identify trend reversals.
Purpose
The indicator combines the sensitivity of the Stochastic MACD with the robustness of Renko signals to provide a versatile tool. It is ideal for traders looking to capture momentum-based market movements (using the MACD and histogram) while confirming trend changes with Renko signals. This combination reduces false signals and improves accuracy in volatile markets.
Settings
Stochastic Period (45): Sets the period for calculating the Stochastic range (highest high - lowest low).
Fast EMA Period (12): Period of the fast EMA used in the MACD.
Slow EMA Period (26): Period of the slow EMA used in the MACD.
Signal Line Period (9): Period of the EMA of the signal line.
Overbought/Oversold Levels (1.0/-1.0): Thresholds for identifying extreme conditions in the MACD.
ATR Period (14): Period for calculating the Renko brick size.
ATR Multiplier (1.0): Adjusts the Renko brick size.
Show Histogram: Enables/disables the histogram.
Show Renko Markers: Enables/disables the Renko direction arrows.
How to Use
MACD Crossovers: A MACD crossover above the signal line indicates potential bullishness, while below suggests bearishness.
Histogram: Fuchsia bars indicate bullish momentum; purple bars indicate bearish momentum.
Renko Arrows: Green arrows (upward triangle) signal a change to an uptrend; red arrows (downward triangle) signal a downtrend.
Overbought/Oversold Levels: Use the levels to identify potential reversals when the MACD reaches extreme values.
Notes
The chart should be set up with this indicator in isolation for better clarity.
Adjust the periods and ATR multiplier according to the asset and timeframe used.
Use the built-in alerts ("Renko Up Signal" and "Renko Down Signal") to set up notifications of direction changes.
This indicator is ideal for day traders and swing traders who want a visually clear and functional tool for trading based on momentum and trends.

Delta Volume Profile [BigBeluga]🔵Delta Volume Profile
A dynamic volume analysis tool that builds two separate horizontal profiles: one for bullish candles and one for bearish candles. This indicator helps traders identify the true balance of buying vs. selling volume across price levels, highlighting points of control (POCs), delta dominance, and hidden volume clusters with remarkable precision.
🔵 KEY FEATURES
Split Volume Profiles (Bull vs. Bear):
The indicator separates volume based on candle direction:
If close > open , the candle’s volume is added to the bullish profile (positive volume).
If close < open , it contributes to the bearish profile (negative volume).
ATR-Based Binning:
The price range over the selected lookback is split into bins using ATR(200) as the bin height.
Each bin accumulates both bull and bear volumes to form the dual-sided profile.
Bull and Bear Volume Bars:
Bullish volumes are shown as right-facing bars on the right side, colored with a bullish gradient.
Bearish volumes appear as left-facing bars on the left side, shaded with a bearish gradient.
Each bar includes a volume label (e.g., +12.45K or -9.33K) to show exact volume at that price level.
Points of Control (POC) Highlighting:
The bin with the highest bullish volume is marked with a border in POC+ color (default: blue).
The bin with the highest bearish volume is marked with a POC− color (default: orange).
Total Volume Density Map:
A neutral gray background box is plotted behind candles showing the total volume (bull + bear) per bin.
This reveals high-interest price zones regardless of direction.
Delta and Total Volume Summary:
A Delta label appears at the top, showing net % difference between bull and bear volume.
A Total label at the bottom shows total accumulated volume across all bins.
🔵 HOW IT WORKS
The indicator captures all candles within the lookback period .
It calculates the price range and splits it into bins using ATR for adaptive resolution.
For each candle:
If price intersects a bin and close > open , volume is added to the positive profile .
If close < open , volume is added to the negative profile .
The result is two side-by-side histograms at each price level—one for buyers, one for sellers.
The bin with the highest value on each side is visually emphasized using POC highlight colors.
At the end, the script calculates:
Delta: Total % difference between bull and bear volumes.
Total: Sum of all volumes in the lookback window.
🔵 USAGE
Volume Imbalance Zones: Identify price levels where buyers or sellers were clearly dominant.
Fade or Follow Volume Clusters: Use POC+ or POC− levels for reaction trades or breakouts.
Delta Strength Filtering: Strong delta values (> ±20%) suggest momentum or exhaustion setups.
Volume-Based Anchoring: Use profile levels to mark hidden support/resistance and execution zones.
🔵 CONCLUSION
Delta Volume Profile offers a unique advantage in market reading by separating buyer and seller activity into two visual layers. This allows traders to not only spot where volume was high, but also who was more aggressive. Whether you’re analyzing trend continuations, reversals, or absorption levels, this indicator gives you the transparency needed to trade with confidence.

Lyapunov Market Instability (LMI)Lyapunov Market Instability (LMI)
What is Lyapunov Market Instability?
Lyapunov Market Instability (LMI) is a revolutionary indicator that brings chaos theory from theoretical physics into practical trading. By calculating Lyapunov exponents—a measure of how rapidly nearby trajectories diverge in phase space—LMI quantifies market sensitivity to initial conditions. This isn't another oscillator or trend indicator; it's a mathematical lens that reveals whether markets are in chaotic (trending) or stable (ranging) regimes.
Inspired by the meditative color field paintings of Mark Rothko, this indicator transforms complex chaos mathematics into an intuitive visual experience. The elegant simplicity of the visualization belies the sophisticated theory underneath—just as Rothko's seemingly simple color blocks contain profound depth.
Theoretical Foundation (Chaos Theory & Lyapunov Exponents)
In dynamical systems, the Lyapunov exponent (λ) measures the rate of separation of infinitesimally close trajectories:
λ > 0: System is chaotic—small changes lead to dramatically different outcomes (butterfly effect)
λ < 0: System is stable—trajectories converge, perturbations die out
λ ≈ 0: Edge of chaos—transition between regimes
Phase Space Reconstruction
Using Takens' embedding theorem , we reconstruct market dynamics in higher dimensions:
Time-delay embedding: Create vectors from price at different lags
Nearest neighbor search: Find historically similar market states
Trajectory evolution: Track how these similar states diverged over time
Divergence rate: Calculate average exponential separation
Market Application
Chaotic markets (λ > threshold): Strong trends emerge, momentum dominates, use breakout strategies
Stable markets (λ < threshold): Mean reversion dominates, fade extremes, range-bound strategies work
Transition zones: Market regime about to change, reduce position size, wait for confirmation
How LMI Works
1. Phase Space Construction
Each point in time is embedded as a vector using historical prices at specific delays (τ). This reveals the market's hidden attractor structure.
2. Lyapunov Calculation
For each current state, we:
- Find similar historical states within epsilon (ε) distance
- Track how these initially similar states evolved
- Measure exponential divergence rate
- Average across multiple trajectories for robustness
3. Signal Generation
Chaos signals: When λ crosses above threshold, market enters trending regime
Stability signals: When λ crosses below threshold, market enters ranging regime
Divergence detection: Price/Lyapunov divergences signal potential reversals
4. Rothko Visualization
Color fields: Background zones represent market states with Rothko-inspired palettes
Glowing line: Lyapunov exponent with intensity reflecting market state
Minimalist design: Focus on essential information without clutter
Inputs:
📐 Lyapunov Parameters
Embedding Dimension (default: 3)
Dimensions for phase space reconstruction
2-3: Simple dynamics (crypto/forex) - captures basic momentum patterns
4-5: Complex dynamics (stocks/indices) - captures intricate market structures
Higher dimensions need exponentially more data but reveal deeper patterns
Time Delay τ (default: 1)
Lag between phase space coordinates
1: High-frequency (1m-15m charts) - captures rapid market shifts
2-3: Medium frequency (1H-4H) - balances noise and signal
4-5: Low frequency (Daily+) - focuses on major regime changes
Match to your timeframe's natural cycle
Initial Separation ε (default: 0.001)
Neighborhood size for finding similar states
0.0001-0.0005: Highly liquid markets (major forex pairs)
0.0005-0.002: Normal markets (large-cap stocks)
0.002-0.01: Volatile markets (crypto, small-caps)
Smaller = more sensitive to chaos onset
Evolution Steps (default: 10)
How far to track trajectory divergence
5-10: Fast signals for scalping - quick regime detection
10-20: Balanced for day trading - reliable signals
20-30: Slow signals for swing trading - major regime shifts only
Nearest Neighbors (default: 5)
Phase space points for averaging
3-4: Noisy/fast markets - adapts quickly
5-6: Balanced (recommended) - smooth yet responsive
7-10: Smooth/slow markets - very stable signals
📊 Signal Parameters
Chaos Threshold (default: 0.05)
Lyapunov value above which market is chaotic
0.01-0.03: Sensitive - more chaos signals, earlier detection
0.05: Balanced - optimal for most markets
0.1-0.2: Conservative - only strong trends trigger
Stability Threshold (default: -0.05)
Lyapunov value below which market is stable
-0.01 to -0.03: Sensitive - quick stability detection
-0.05: Balanced - reliable ranging signals
-0.1 to -0.2: Conservative - only deep stability
Signal Smoothing (default: 3)
EMA period for noise reduction
1-2: Raw signals for experienced traders
3-5: Balanced - recommended for most
6-10: Very smooth for position traders
🎨 Rothko Visualization
Rothko Classic: Deep reds for chaos, midnight blues for stability
Orange/Red: Warm sunset tones throughout
Blue/Black: Cool, meditative ocean depths
Purple/Grey: Subtle, sophisticated palette
Visual Options:
Market Zones : Background fields showing regime areas
Transitions: Arrows marking regime changes
Divergences: Labels for price/Lyapunov divergences
Dashboard: Real-time state and trading signals
Guide: Educational panel explaining the theory
Visual Logic & Interpretation
Main Elements
Lyapunov Line: The heart of the indicator
Above chaos threshold: Market is trending, follow momentum
Below stability threshold: Market is ranging, fade extremes
Between thresholds: Transition zone, reduce risk
Background Zones: Rothko-inspired color fields
Red zone: Chaotic regime (trending)
Gray zone: Transition (uncertain)
Blue zone: Stable regime (ranging)
Transition Markers:
Up triangle: Entering chaos - start trend following
Down triangle: Entering stability - start mean reversion
Divergence Signals:
Bullish: Price makes low but Lyapunov rising (stability breaking down)
Bearish: Price makes high but Lyapunov falling (chaos dissipating)
Dashboard Information
Market State: Current regime (Chaotic/Stable/Transitioning)
Trading Bias: Specific strategy recommendation
Lyapunov λ: Raw value for precision
Signal Strength: Confidence in current regime
Last Change: Bars since last regime shift
Action: Clear trading directive
Trading Strategies
In Chaotic Regime (λ > threshold)
Follow trends aggressively: Breakouts have high success rate
Use momentum strategies: Moving average crossovers work well
Wider stops: Expect larger swings
Pyramid into winners: Trends tend to persist
In Stable Regime (λ < threshold)
Fade extremes: Mean reversion dominates
Use oscillators: RSI, Stochastic work well
Tighter stops: Smaller expected moves
Scale out at targets: Trends don't persist
In Transition Zone
Reduce position size: Uncertainty is high
Wait for confirmation: Let regime establish
Use options: Volatility strategies may work
Monitor closely: Quick changes possible
Advanced Techniques
- Multi-Timeframe Analysis
- Higher timeframe LMI for regime context
- Lower timeframe for entry timing
- Alignment = highest probability trades
- Divergence Trading
- Most powerful at regime boundaries
- Combine with support/resistance
- Use for early reversal detection
- Volatility Correlation
- Chaos often precedes volatility expansion
- Stability often precedes volatility contraction
- Use for options strategies
Originality & Innovation
LMI represents a genuine breakthrough in applying chaos theory to markets:
True Lyapunov Calculation: Not a simplified proxy but actual phase space reconstruction and divergence measurement
Rothko Aesthetic: Transforms complex math into meditative visual experience
Regime Detection: Identifies market state changes before price makes them obvious
Practical Application: Clear, actionable signals from theoretical physics
This is not a combination of existing indicators or a visual makeover of standard tools. It's a fundamental rethinking of how we measure and visualize market dynamics.
Best Practices
Start with defaults: Parameters are optimized for broad market conditions
Match to your timeframe: Adjust tau and evolution steps
Confirm with price action: LMI shows regime, not direction
Use appropriate strategies: Chaos = trend, Stability = reversion
Respect transitions: Reduce risk during regime changes
Alerts Available
Chaos Entry: Market entering chaotic regime - prepare for trends
Stability Entry: Market entering stable regime - prepare for ranges
Bullish Divergence: Potential bottom forming
Bearish Divergence: Potential top forming
Chart Information
Script Name: Lyapunov Market Instability (LMI) Recommended Use: All markets, all timeframes Best Performance: Liquid markets with clear regimes
Academic References
Takens, F. (1981). "Detecting strange attractors in turbulence"
Wolf, A. et al. (1985). "Determining Lyapunov exponents from a time series"
Rosenstein, M. et al. (1993). "A practical method for calculating largest Lyapunov exponents"
Note: After completing this indicator, I discovered @loxx's 2022 "Lyapunov Hodrick-Prescott Oscillator w/ DSL". While both explore Lyapunov exponents, they represent independent implementations with different methodologies and applications. This indicator uses phase space reconstruction for regime detection, while his combines Lyapunov concepts with HP filtering.
Disclaimer
This indicator is for research and educational purposes only. It does not constitute financial advice or provide direct buy/sell signals. Chaos theory reveals market character, not future prices. Always use proper risk management and combine with your own analysis. Past performance does not guarantee future results.
See markets through the lens of chaos. Trade the regime, not the noise.
Bringing theoretical physics to practical trading through the meditative aesthetics of Mark Rothko
Trade with insight. Trade with anticipation.
— Dskyz , for DAFE Trading Systems

Full Day Midpoint Line with Dynamic StdDev Bands (ETH & RTH)A Pine Script indicator designed to plot a midpoint line based on the high and low prices of a user-defined trading session (typically Extended Trading Hours, ETH) and to add dynamic standard deviation (StdDev) bands around this midpoint.
Session Midpoint Line:
The midpoint is calculated as the average of the session's highest high and lowest low during the defined ETH period (e.g., 4:00 AM to 8:00 PM).
This line represents a central tendency or "fair value" for the session, similar to a pivot point or volume-weighted average price (VWAP) anchor.
Interpretation:
Prices above the midpoint suggest bullish sentiment, while prices below indicate bearish sentiment.
The midpoint can act as a dynamic support/resistance level, where price may revert to or react at this level during the session.
Dynamic StdDev Bands:
The bands are calculated by adding/subtracting a multiple of the standard deviation of the midpoint values (tracked in an array) from the midpoint.
The standard deviation is dynamically computed based on the historical midpoint values within the session, making the bands adaptive to volatility.
Interpretation:
The upper and lower bands represent potential overbought (upper) and oversold (lower) zones.
Prices approaching or crossing the bands may indicate stretched conditions, potentially signaling reversals or breakouts.
Trend Identification:
Use the midpoint as a reference for the session’s trend. Persistent price action above the midpoint suggests bullishness, while below indicates bearishness.
Combine with other indicators (e.g., moving averages, RSI) to confirm trend direction.
Support/Resistance Trading:
Treat the midpoint as a dynamic pivot point. Price rejections or consolidations near the midpoint can be entry points for mean-reversion trades.
The StdDev bands can act as secondary support/resistance levels. For example, price reaching the upper band may signal a potential short entry if accompanied by reversal signals.
Breakout/Breakdown Strategies:
A strong move beyond the upper or lower band may indicate a breakout (bullish above upper, bearish below lower). Confirm with volume or momentum indicators to avoid false breakouts.
The dynamic nature of the bands makes them useful for identifying significant price extensions.
Volatility Assessment:
Wider bands indicate higher volatility, suggesting larger price swings and potentially riskier trades.
Narrow bands suggest consolidation, which may precede a breakout. Traders can prepare for volatility expansions in such scenarios.
The "Full Day Midpoint Line with Dynamic StdDev Bands" is a versatile and visually intuitive indicator well-suited for day traders focusing on session-specific price action. Its dynamic midpoint and volatility-adjusted bands provide valuable insights into support, resistance, and potential reversals or breakouts.

Enhanced BTC Order Block IndicatorThe script you provided is an "Enhanced BTC Order Block Indicator" written in Pine Script v5 for TradingView. It is designed to identify and visually mark Order Blocks (OBs) on a Bitcoin (BTC) price chart, specifically tailored for a high-frequency scalping strategy on the 5-minute (M5) timeframe. Order Blocks are key price zones where institutional traders are likely to have placed significant buy or sell orders, making them high-probability areas for reversals or continuations. The script incorporates customizable filters, visual indicators, and alert functionality to assist traders in executing the strategy outlined earlier.
Key Features and Functionality
Purpose:
The indicator detects bullish Order Blocks (buy zones) and bearish Order Blocks (sell zones) based on a predefined percentage price movement (default 0.5–1%) and volume confirmation.
It marks these zones on the chart with colored boxes and provides alerts when an OB is detected.
User-Configurable Inputs:
Price Move Range: minMovePercent (default 0.5%) and maxMovePercent (default 1.0%) define the acceptable price movement range for identifying OBs.
Volume Threshold: volumeThreshold (default 1.5x average volume) ensures OB detection is backed by significant trading activity.
Lookback Period: lookback (default 10 candles) determines how many previous candles are analyzed to find the last candle before a strong move.
Wick/Body Option: useWick (default false) allows users to choose whether the OB zone is based on the candle’s wick or body.
Colors: bullishOBColor (default green) and bearishOBColor (default red) set the visual appearance of OB boxes.
Box Extension: boxExtension (default 100 bars) controls how far the OB box extends to the right on the chart.
RSI Filter: useRSI (default true) enables an RSI filter, with rsiLength (default 14), rsiBullishThreshold (default 50), and rsiBearishThreshold (default 50) for trend confirmation.
M15 Support/Resistance: useSR (default true) and srLookback (default 20) integrate M15 timeframe swing highs and lows for additional OB validation.
Core Logic:
Bullish OB Detection: Identifies a strong upward move (0.5–1%) with volume above the threshold. It then looks back to the last bearish candle before the move to define the OB zone. RSI > 50 and proximity to M15 support/resistance (optional) enhance confirmation.
Bearish OB Detection: Identifies a strong downward move (0.5–1%) with volume confirmation, tracing back to the last bullish candle. RSI < 50 and M15 resistance proximity (optional) add validation.
The OB zone is drawn as a rectangle from the high to low of the identified candle, extended rightward.
Visual Output:
Boxes: Uses box.new to draw OB zones, with left set to the previous bar (bar_index ), right extended by boxExtension, top and bottom defined by the OB’s high and low prices. Each box includes a text label ("Bullish OB" or "Bearish OB") and is semi-transparent.
Colors distinguish between bullish (green) and bearish (red) OBs.
Alerts:
Global alertcondition definitions trigger notifications for "Bullish OB Detected" and "Bearish OB Detected" when the respective conditions are met, displaying the current close price in the message.
Helper Functions:
f_priceChangePercent: Calculates the percentage price change between open and close prices.
isNearSR: Checks if the price is within 0.2% of M15 swing highs or lows for support/resistance confluence.
How It Works
The script runs on each candle, evaluating the current price action against the user-defined criteria.
When a bullish or bearish move is detected (meeting the percentage, volume, RSI, and S/R conditions), it identifies the preceding candle to define the OB zone.
The OB is then visualized on the chart, and an alert is triggered if configured in TradingView.
Use Case
This indicator is tailored for your BTC scalping strategy, where trades last 1–15 minutes targeting 0.3–0.5% gains. It helps traders spot institutional order zones on the M5 chart, confirmed by secondary M1 analysis, and integrates with your use of EMAs, RSI, and volume. The customizable settings allow adaptation to varying market conditions or personal preferences.
Limitations
The M15 S/R detection is simplified (using swing highs/lows), which may not always align perfectly with manual support/resistance levels.
Alerts depend on TradingView’s alert system and require manual setup.
Performance may vary with high volatility or low-volume periods, necessitating parameter adjustments.
