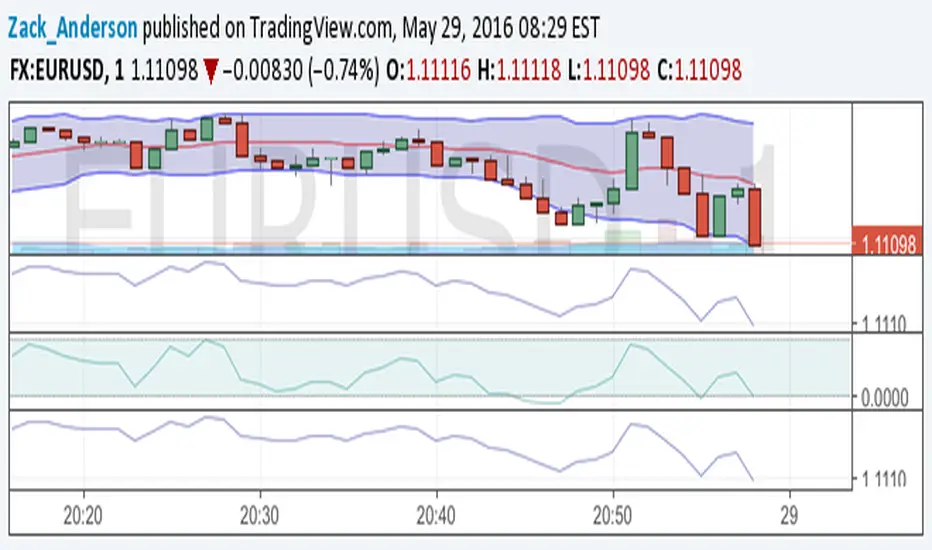
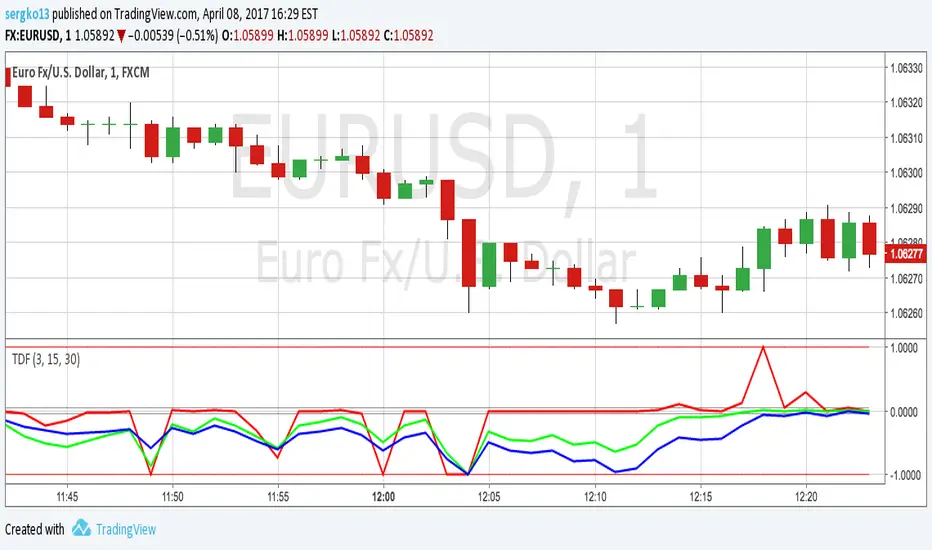
Trend Direction and Force IndexTrend direction and force index for binary options. Minor corrections to code. All invite-only scripts have been disabled
"binary option"に関するスクリプトを検索
Binary 15 V1 w/ AlertsSo this is my first time coding Pinescript. I used bits and pieces of idea from smarter people like JustUncle, uscgears and Chris Moody.
I then combined bits and pieces and came with my own criteria for Binary Options.
Please use and provide feedback.
Rules:
Fuschia Bar: Sell for next available 15 min expiry
Yellow Bar: Buy for next available 15 min expiry
Notes:
When Stoch is OB/OS avoid trade
Alert Capable
Avoid trading in low volume times or during new releases

Vdub BinaryPro 1*Update*Vdub BinaryPro 1 *UPDATE
2 channel options
//////////////////////////////////////
pro2
pro2.1

Vdub BinaryPro 2 Releasing due to overwhelming multiple requests
Binary Pro 2
With the additional Binary Pro 2.1

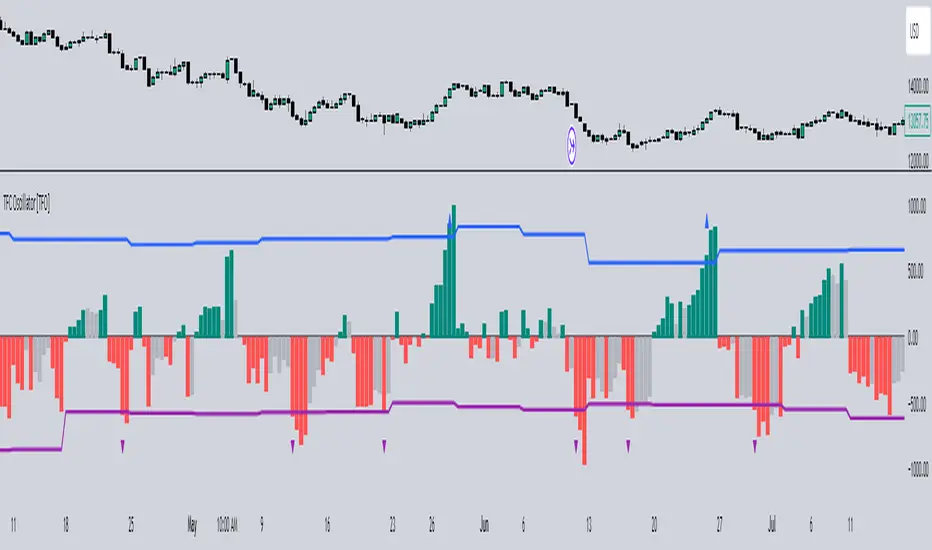
Timeframe Continuity Oscillator [TFO]This indicator is used to visualize timeframe continuity - a core concept of "The Strat" - along with some added logic for potential range limiters.
When discussing timeframe continuity, typically we are evaluating several timeframes to see if price is trading above or below the current open of each respective timeframe. If we are concerned with the 15m, 4h, and 1D for example, and price is trading above the current open of each of those timeframes, we can say that we have full timeframe continuity (FTFC) up. Conversely, if price is trading below the current open of each of those timeframes, we can say that we have FTFC down.
We can visualize this with an oscillator of sorts, where the zero line is anchored to the open price of the highest timeframe that we're concerned with. Using the prior example, this would be the 1D timeframe. As long as price is above the current 1D open, it is impossible to have FTFC down; and as long as price is below the current 1D open, it is impossible to have FTFC up. This is why we base the oscillator's values off of the highest timeframe's open (the values are simply how far price has traded from this open) - any value greater than zero tells us that there is potential to have FTFC up, and any value less than zero tells us that there is potential to have FTFC down.
There are a few ways we chose to visualize this data. First, we can choose the "Binary" option which simply uses one solid bullish color above the zero line, and one solid bearish color below the zero line.
Second, we can choose the "Gradient" option to help describe whether we have FTFC up or down. Values above the zero line will be a mix of the bullish color and mid color, where the mid color indicates no timeframe continuity up and the bullish color indicates FTFC up - sort of like a color spectrum of timeframe continuity to describe how many timeframes are in agreement. Similarly, values below the zero line will be a mix of the bearish color and the mid color, where the mid color again indicates no timeframe continuity down and the bearish color indicates FTFC down.
Lastly, we can choose the "FTFC Only" option which will only color the histogram bars as bullish if there is FTFC up, or bearish if there is FTFC down.
One more feature that we added is these upper and lower bands that aim to help describe the potential upper and lower limits that price may travel, relative to the highest timeframe's open. This is done by taking the standard deviation of some defined lookback period, for example, 2 standard deviations of the previous 10 weeks, assuming 1W is the highest timeframe enabled.
The concept is similar to that of an ADR (average daily range) as it can be used to estimate maximum range extensions for the largest timeframe. The arrows you see are plotted once the value exceeds either band - alerts can be enabled for these events as well through any alert() function call.
Om Boy CandlesUsed by me to play binary option.
A little project to help my nephew decide which candle to refer to make SNR lines

Binary Signals - MnetfGives binary options signals on NASDAQ.
Signals long or short positions on the current candle in the NAS100 index.
Is mostly perfect for long entry signals

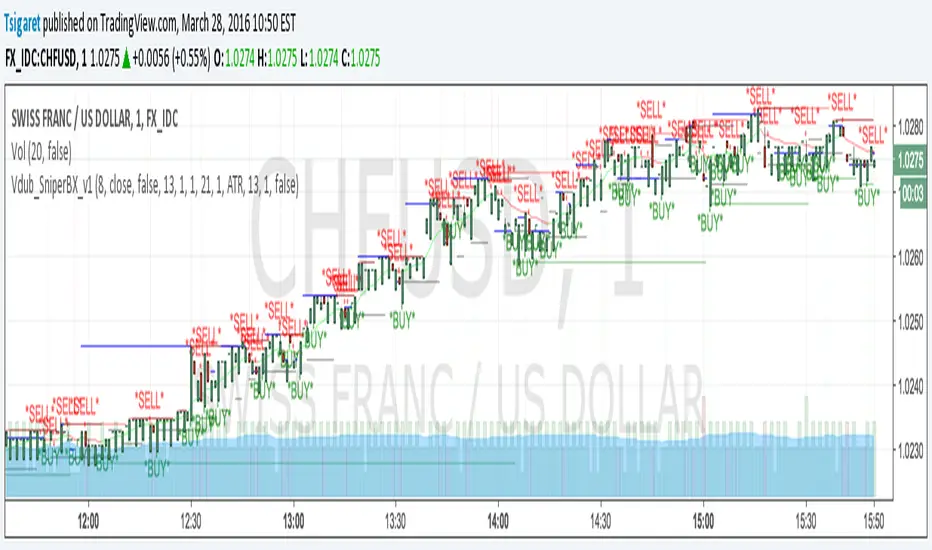
Binary Sniper StrategyBy using this indicator you can better view the MA indicators used by this strategy, as well as specifically waiting for the cross and close which gives you easy access to an arrow as one of the confirmations and having the ability to setup alerts on the flip so you can easily monitor multiple pairs at the same time, the Bands give you a general idea of the market flow, and volatility.
The Long Term EMA gives you higher probability trend for a easier binary clear, potentially without the need for a rollover.
This is best used alongside:
- Stochastic Indicator with the Settings of (5,3,3)
The confirmations are :
- Are we Above or Below the Long Term Trend EMA - (Above = 1 Confirmation for the Buy, Below = 1 Confirmation for the Sell)
- Are we at the Low or the High of the Bands ( Low = 1 Confirmation for the Buy, High = 1 Confirmation for the Sell)
- Are the MAs crossed up or down( Cross Up = 1 Confirmation for the Buy , Cross Down = 1 Confirmation for the Sell)
- Are we coming out of the Oversold or Overbought areas on the Stoch (Oversold = 1 Confirmation for the Buy, OverBought = 1 Confirmation for the Sell)
- Is the 15 min in Confluence ? = (Yes = 1 Confirmation in either direction)
Once You have at least 3 Confirmations one of them having to be the MA cross arrow popping up, you have a valid trade setup on the open of that candle, for Binary options, I personally like to wait a little bit after the arrow candle opens to potentially get a slight pullback so that i can buy/sell with a slightly better entry that i don't have to rollover on, I usually aim for 3 min clears, but sometimes i have to rollover.

binary angelMeasure angles of many indicators and create score base on this information, it can be use as helper for direction decision in binary option or classic trading

DXY Helper for Binary Option by MrTuanDoanThe US Dollar Index (DXY) is really important for Binary traders who looking for setups on USD pairs.
With this indicator, you dont need another chart or switching between your current USD-pair chart and DXY chart.
What's the different with normal DXY?
THE DAILY GAP
If you know what happens when there is a GAP in DXY, this is your indicator.
FYI: I'll wait for the GAP TO BE FILLED. That means other USD-pairs will follow that "filling" direction.
Functions:
Draw DXY chart on other chart
Added Double Bollinger Bands
Added Parabolic SAR for the trend
Added GAP detection on chart
Added alert for GAP
Please always follow your Risk Managment

Hybrid Overbought/Oversold Detector + Put/Call SignalsThere are many indicators of overbought/oversold conditions out there. Some of more common ones are:
- Bollinger Bands %B
- Money Flow Index (MFI)
- Relative Strength Index (RSI)
- Stochastic
This script uses a combination of these 4 oscillators to confirm overbought/oversold and filter the signals of market reverse which could be used for trading binary options.
You may select which oscillators you want to apply and of course change the source, the length of the calculations and the overbought/oversold levels.
Also the script will draw a combined graph which is the average of the selected oscillators in the options.
Send me your ideas!

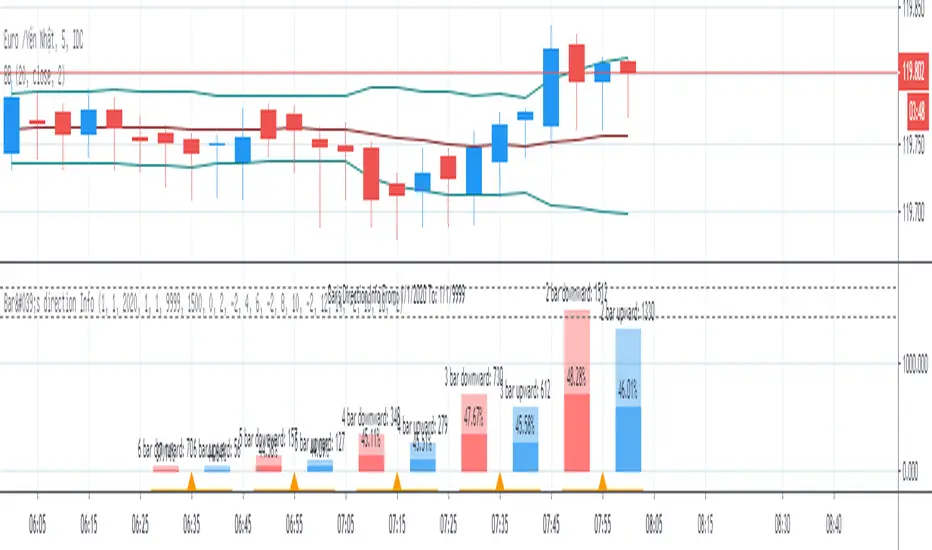
Bar's direction InfoBar's direction Info show number of case which bars have same direction and counting percent of next bar's direction.
This info may be useful to trade Binary Option.


Arrows Perfect BinaryThis is a binary options script for detecting the best flaws in the market and taking advantage.
Initially, the script was coded with Martingale in mind and no losses occur in 3-5 cycles but a revision was made and this is the current version 1.0 of the script. Use this script wisely, It's a powerful one and might be the Holy Grail or Account Blower.
If you think of something please lemme know so that I can improve the value of this script to the community.
I am open to wise contributions.
Enjoy, lucemanb

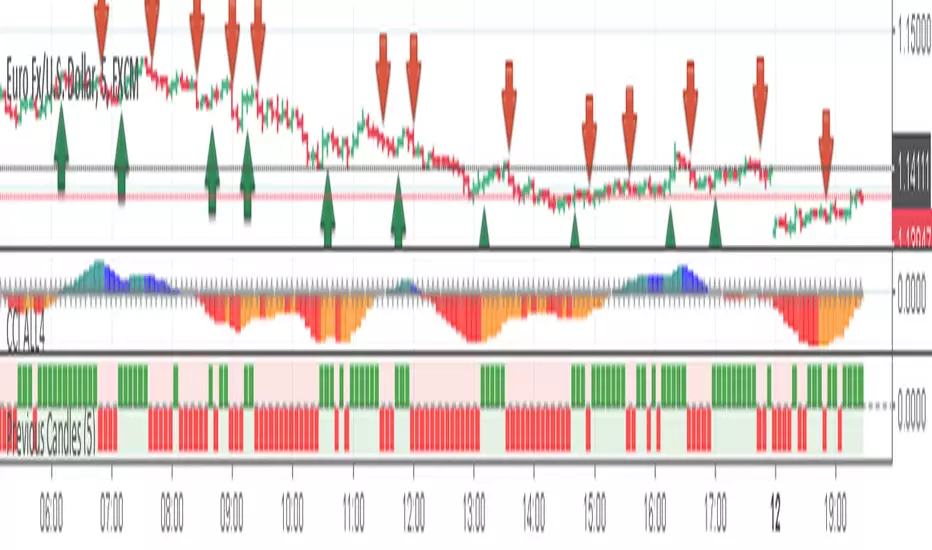
Previous CandlesThis is an indicator based on the average of the maximum and minimum of the past candle, and there is another strategy that makes the filter, it is very good for binary options, if you combine our indicator CCI and All4 it gets even better!
Currency: Any pair.
TimeFrame: 5m
Execute order: You can enter 1 minute or 5 minutes.
In the graph below the ICC, you can see the green and red squares, it works as follows.
Before giving any input you have to enter the change of a color.
Example: It was red and now it's green, so you could give the entry, but you must have at least 3 squares of red before, if only 1 squared has appeared, the hit percentage will be low!
The CCI indicator is for confirmation.
Any doubt I am available!
Note: This indicator does not make magic nor is it a holy grall, it is only an indicator to aid in binary operations!

Binary /Fx Fibonacci Bollinger BandsBinary /Fx Fibonacci Bollinger Bands
Very Strong, Powerful Indicator that is great for Binary Options and Forex traders.
This System is fantastic allowing my students to achieve quick easy profits with minimal effort. I have been working on this kind of system for over 3 years and now think that it's time to spread the work a little and help others.
This System uses the same effect as the famous Bollinger Bands but also incorporates Fibonacci into it too. I found that this creates an extremely accurate entry and exit points. After years of testing, I have found nothing like it.
Plus its really easy to use! :
First, do not take any trades until the candles hit either the top or bottom band.
Then, depending on which band is hit will then determine the direction you take a trade.
If the candlesticks hit the Red Line Sell/Put.
If the candlesticks hit the Green Line Buy/Call.
An effective money management system is required in order to increase your success rate.
That is all, please let me know if you are interested in testing the system and if you have any questions, also, please share.
I hope to hear how you get on with my system and wish you all the best.
Thanks :)

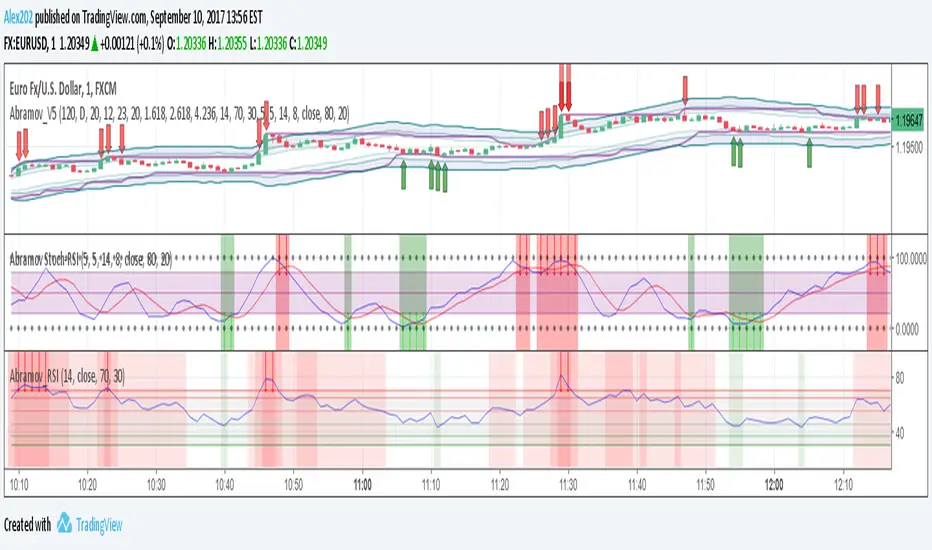
Abramov_V5Improved script Abramov_V4, has notifications
Recommended for binary options
Strategy is on my site
Multicurrency
Timeframe from 1 minute
Volatility - not lower than average
This indicator includes:
1. Bollinger waves 3 levels - incl. / off.
2. Moving averages 2 pieces - incl. / off.
3. Price channel - incl. / off.
4. Support and resistance level per day - incl. / off.
5. Support and resistance level for 120 minutes - incl. / off.
6. Arrows RSI + Stochastic buy / sell
7. Arrows to buy / sell on the price level in the channel
8. Customizable notifications from the indicator, now you do not need to waste time searching for a good entry point, notification comes in advance.
9. The indicator does not redraw!
Any of the indicators is configurable.
The optimal settings are set by default.
This indicator is suitable for several strategies.
Paid subscription to the indicator
When working with this indicator, it is necessary to avoid news and sudden jumps in the market
For additional signal filtering, I recommend:
Abramov_RSI - additional indicator
Abramov Stochastic-RSI - additional indicator
----------------------------------------------
Улучшенный скрипт Abramov_V4, имеет оповещения
Рекомендовано для бинарных опционов
Стратегия у меня на сайте
Мультивалютный
Таймфрейм от 1 минуты
Волатильность - не ниже среднего
Этот индикатор включает в себя:
1. Волны Боллинджера 3 уровня - вкл. / выкл.
2. Скользящие средние 2 штуки - вкл. / выкл.
3. Канал цены - вкл. / выкл.
4. Уровень поддержки и сопротивления за день - вкл. / выкл.
5. Уровень поддержки и сопротивления за 120 минут - вкл. / выкл.
6. Стрелки RSI+стохастик купить/продать
7. Стрелки купить/продать по уровню цены в канале
8. Настраиваемые уведомления от индикатора, теперь не нужно тратить время на поиски хорошей точки входа, уведомление приходит заранее.
9. Индикатор не перерисовывает!
Любой из индикаторов настраивается.
Оптимальные настройки устанавливаются по умолчанию.
Этот индикатор подходит для нескольких стратегий.
Платная подписка на индикатор
При работе с этим индикатором необходимо избегать новостей и резких скачков на рынке
Для дополнительной фильтрации сигналов рекомендую:
Abramov_RSI -дополнительный индикатор
Abramov Stochastic-RSI -дополнительный индикатор
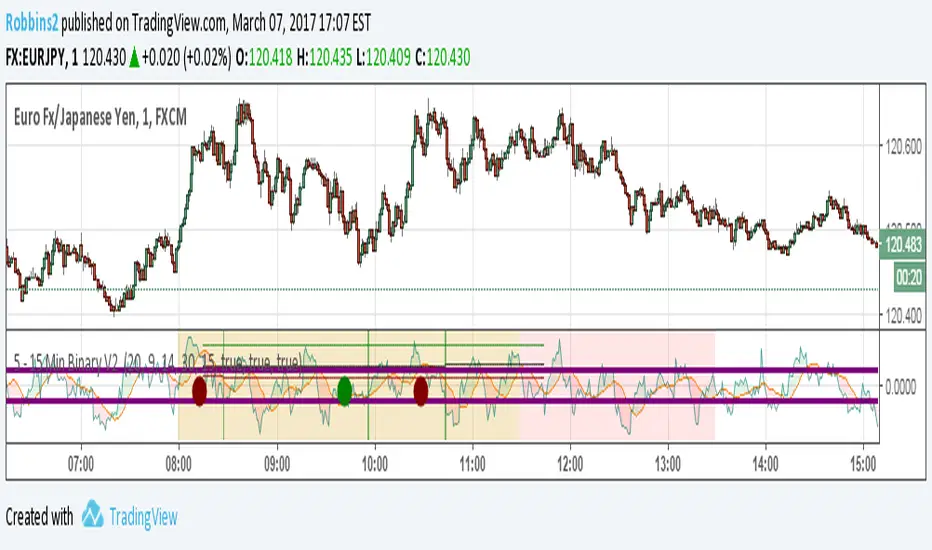
5 - 15 Min Binary V2 Hey guys
As promised back with the updated indicator without needing my blessing to use. Please post feedback so that I can perfect it.
Works great on EU/JP and USDCAD with a risk factor of 20 – 25. Use 1 time frame with 15 mins Expiry for nest results. Possible to get 90% ITM with this setup.
Updated Feature
Risk Factor: Higher the number lowers the risk but also means lower trade setups. Best between 20 – 25.
Added an additional Filter to minimize bad setups
No trading between 11.30 EST to 13.00 EST. Not worth the risk.
Displays ITM rate in Green, Red and total in Black.
Alert capable for Both, Call or Put
Please demo before you take it live. Also during normal trading hours I have not seen more than 3 consecutive loses, (unless there is a news release) so with money management you can greatly increase your total ITM rate.
If you like this indicator, feel free to donate some BTC at 18qrzku9LrQuMq9LyRYmiTbqUtC2bSAv3y
It does take considerable amount of tweaking and testing to put out something like this.
Post feedback so that everyone can benefit.
MM-Burj Khalifa IndicatorThis indicator uses several signals to visualize a "perfect candle" to enter a trade.
It colors the background to identify the zones of interest (multiple configurable high or low RSI zones). Underlying is a trendbar with the current MACD direction.
The indicator is using signals of:
--MACD
--RSI
--PVT
--ATR
--AD and DMI+/DMI-
When all 7 criterias are met it highlights the candle.
It also creates different colums with different height and width, so that you can see which signal is OK and which is maybe missing. When all signals are on GO you'll see a Burj-Khalifa-like figure. If not all signals are on GO you'see crippled versions.
To be clear:
it's not intended to detect trends or supertrends or reversals. It's purpose it's just to decide if this current candle is really going in the right direction.
The Burj-Khalifa indicator could help to confirm the entry point of an trade which was already planned.

Bollinger Bands NEW
var tradingview_embed_options = {};
tradingview_embed_options.width = 640;
tradingview_embed_options.height = 400;
tradingview_embed_options.chart = 's48QJlfi';
new TradingView.chart(tradingview_embed_options);
Vdub Binary Options SniperVX v1 by vdubus on TradingView.com