Support and Resistance levels from Options DataINTRODUCTION
This script is designed to visualize key support and resistance levels derived from options data on TradingView charts. It overlays lines, labels, and boxes to highlight levels such as Put Walls (gamma support), Call Walls (gamma resistance), Gamma Flip points, Vanna levels, and more.
These levels are intended to help traders identify potential areas of price magnetism, reversal, or breakout based on options market dynamics. All calculations and visualizations are based on user-provided data pasted into the input field, as Pine Script cannot directly fetch external options data due to platform limitations (explained below).
For convenience, my website allows users to interact with a bot that will generate the string for up to 30 tickers at once getting nearly real-time data on demand (data is cached for 15min). With the output string pasted into this indicator, it's a bliss to shuffle through your portfolio and see those levels for each ticker.
The script is open-source under TradingView's terms, allowing users to study, modify, and improve it. It draws inspiration from common options-derived metrics like gamma exposure and vanna, which are widely discussed in financial literature. No external code is copied without rights; all logic is original or based on standard mathematical formulas.
How the Options Levels Are Calculated
The levels displayed by this script are not computed within Pine Script itself—instead, they rely on pre-calculated values provided by the user (via a pasted data string). These values are derived from options chain data fetched from financial APIs (e.g., using libraries like yfinance in Python). Here's a step-by-step overview of how these levels are generally calculated externally before being input into the script:
Fetching Options Data:
Historical and current options chain data for a ticker (e.g., strikes, open interest, volume, implied volatility, expirations) is retrieved for near-term expirations (e.g., up to 90 days).
Current stock price is obtained from recent history.
Gamma Support (Put Wall) and Resistance (Call Wall):
Gamma Calculation: For each option, gamma (the rate of change of delta) is computed using the Black-Scholes formula:
gamma = N'(d1) / (S * sigma * sqrt(T))
where S is the stock price, K is the strike, T is time to expiration (in years), sigma is implied volatility, r is the risk-free rate (e.g., 0.0445), and N'(d1) is the normal probability density function.
Weighted gamma is multiplied by open interest and aggregated by strike.
The Put Wall is the strike below the current price with the highest weighted gamma from puts (acting as support).
The Call Wall is the strike above the current price with the highest weighted gamma from calls (acting as resistance).
Short-term versions focus on strikes closer to the money (e.g., within 10-15% of the price).
Gamma Flip Level:
Net dealer gamma exposure (GEX) is calculated across all strikes:
GEX = sum (gamma * OI * 100 * S^2 * sign * decay)
where sign is +1 for calls/-1 for puts, and decay is 1 / sqrt(T).
The flip point is the price where net GEX changes sign (from positive to negative or vice versa), interpolated between strikes.
Vanna Levels:
Vanna (sensitivity of delta to volatility) is calculated:
vanna = -N'(d1) * d2 / sigma
where d2 = d1 - sigma * sqrt(T).
Weighted by open interest, the highest positive and negative vanna strikes are identified.
Other Levels:
S1/R1: Significant strikes with high combined open interest and volume (80% OI + 20% volume), below/above price for support/resistance.
Implied Move: ATM implied volatility scaled by S * sigma * sqrt(d/365) (e.g., for 7 days).
Call/Put Ratio: Total call contracts divided by put contracts (OI + volume).
IV Percentage: Average ATM implied volatility.
Options Activity Level: Average contracts per unique strike, binned into levels (0-4).
Stop Loss: Dynamically set below the lowest support (e.g., Put Wall, Gamma Flip), adjusted by IV (tighter in low IV).
Fib Target: 1.618 extension from Put Wall to Call Wall range.
Previous day levels are stored for comparison (e.g., to detect Call Wall movement >2.5% for alerts).
Effect as Support and Resistance in Technical Trading
Options levels like gamma walls influence price action due to market maker hedging:
Put Wall (Gamma Support): High put gamma below price creates a "magnet" effect—market makers buy stock as price falls, providing support. Traders might look for bounces here as entry points for longs.
Call Wall (Gamma Resistance): High call gamma above price leads to selling pressure from hedging, acting as resistance. Rejections here could signal trims, sells or even shorts.
Gamma Flip: Where gamma exposure flips sign, often a volatility pivot—crossing it can accelerate moves (bullish above, bearish below).
Vanna Levels: Positive/negative vanna indicate volatility sensitivity; crosses may signal regime shifts.
Implied Move: Shows expected range; prices outside suggest overextension.
S1/R1 and Fib Target: Volume/OI clusters act as classic S/R; Fib extensions project upside targets post-breakout.
In trading, these are not guarantees—combine with TA (e.g., volume, trends). High activity levels imply stronger effects; low CP ratio suggests bearish sentiment. Alerts trigger on proximities/crosses for awareness, not advice.
Limitations of the TradingView Platform for Data Pulling
TradingView's Pine Script is sandboxed for security and performance:
No direct internet access or API calls (e.g., can't fetch yfinance data in-script).
Limited to chart data/symbol info; no real-time options chains.
Inputs are static per load; updates require manual pasting.
Caching isn't persistent across sessions.
This prevents dynamic data pulling, ensuring scripts remain lightweight but requiring external tools for fresh data.
Creative Solution for On-Demand Data Pulling
To overcome these limitations, users can use external tools or scripts (e.g., Python-based) to fetch and compute levels on demand. The tool processes tickers, generates a formatted string (e.g., "TICKER:level1,level2,...;TIMESTAMP:unix;"), and users paste it into the script's input. This keeps data fresh without violating platform rules, as computation happens off-platform. For example, run a local script to query APIs and output the string—adaptable for any ticker.
Script Functionality Breakdown
Inputs: Custom data string (parsed for levels/timestamp); toggles for short-term/previous/Vanna/stop loss; style options (colors, transparency).
Parsing: Extracts levels for the chart symbol; gets timestamp for "updated ago" display.
Drawing: Lines/labels for levels; boxes for gamma zones/implied move; clears old elements on updates.
Info Panel: Top-right summary with metrics (CP ratio, IV, distances, activity); emojis for quick status.
Alerts: Conditions for proximities, crosses, bounces (e.g., 0.5% bounce from Put Wall).
Performance: Uses vars for persistence; efficient for real-time.
This script is educational—test thoroughly. Not financial advice; past performance isn't indicative of future results. Feedback welcome via TradingView comments.
"bot"に関するスクリプトを検索

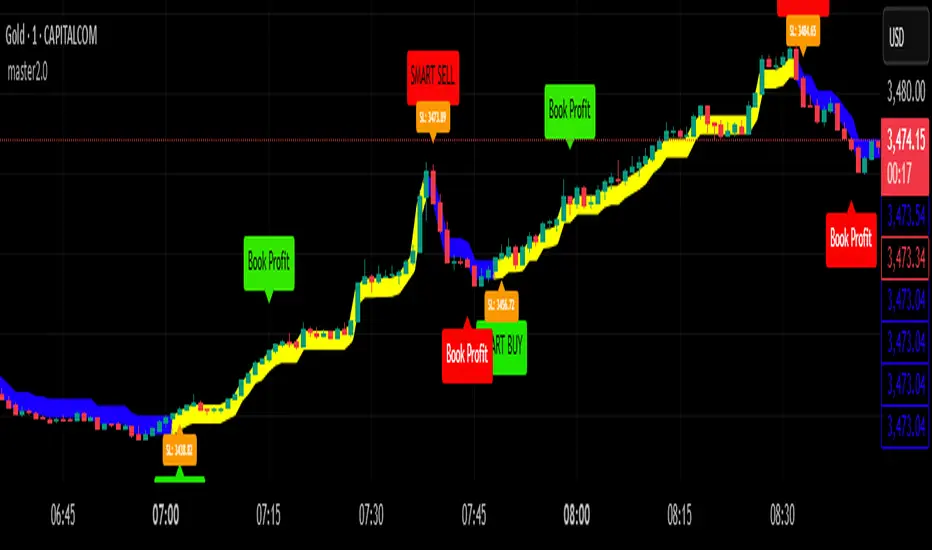
master2.0 ✅ How It Works
The Master 2.0 indicator is a custom-developed trend and signal tool based on a modified range filter algorithm, specifically designed for clarity, non-repainting signals, and actionable trade execution.
🔧 1. Custom Adaptive Range Filter (Original Logic)
At its core is a custom-built filter that adapts to price volatility. Unlike standard MAs or public-domain range indicators, this version:
(1) Uses a double-smooth EMA logic on absolute price changes.
(2)Multiplies the range by an Impact Factor, giving a dynamic width.
(3) Applies a custom filter algorithm that limits noise and locks on trend movement.
This logic was modified from the concept of range-based filters, but entirely re-engineered to serve trend-following and TP triggering.
🟩 2. Visual Trend Zones (Upper/Lower Lines)
The filtered value generates two dynamic lines:
(1)One above the filter
(2)One below the filter
These create a color-filled “trend tunnel”, making it easy to identify:
(3)🔵 Uptrend (blue fill)
(4)🔴 Downtrend (red fill)
(5)🟡 Sideways market (no fill or neutral color)
These visual cues allow instant identification of market direction without reading complex data
📈 3. Smart Buy/Sell Signals (Confirmed, Non-Repainting ✅)
(1)🚀 Smart Buy is triggered when a confirmed uptrend begins (filter shifts upward with a
new confirmation).
(2)🔻 Smart Sell appears at the start of a confirmed downtrend.
(3)Sideways filters out choppy signals, reducing whipsaws.
✅ All signals are confirmed only after the candle closes (barstate.isconfirmed is used), meaning:
🔒 No repainting or false previews — 100% reliable on live charting.
💰 4. Take Profit System (Unique Utility)
This indicator tracks the entry price after a signal, and auto-detects when a Take Profit level
(in pips) is reached.
(1)💰 Book Profit alert is triggered above/below the candle.
(2)Helps secure gains without relying on external bots or platforms.
🔔 5. Real-Time Alerts Included
All alerts are built-in for automation:
(1)🚀 Smart Buy
(2)🔻 Smart Sell
(3)💰 Book Profit (Buy/Sell)
Trade Size Calculator By Skapez Trade Size Calculator By Skapez — ARM it, Drag & Trade!
A simple, position-sizing calculator for easy trader sizing.
It plots Entry / Stop / TP lines, sizes your trade to a fixed % risk (e.g., 2%), calculates leverage, and shows clean labels (Risk $, TP $, Position $, Leverage ×). You can ARM a setup, drag the lines to fine-tune, and (optionally) trigger alerts for webhooks.
What it does:
Fixed-fractional risk : sizes position so SL equals your chosen % of account (e.g., 2%).
Leverage cap & lot rounding : respects your max leverage and exchange lot step.
Drag-to-edit : move Entry/Stop; TP and sizing update automatically.
Swing-stop helper (optional): snap SL to recent swing low/high or nearest pivot. (Auto stop loss finder)
Valid-until window: auto-expires stale setups (e.g., after 120 minutes).
Alerts-ready: add your own JSON in the alert to send to a bot/webhook.
Quick start (60 seconds)
Add to chart and open Settings.
In Risk, set:
Account Balance (USD) and Risk % (e.g., 2.0).
Side (Long/Short).
In Levels:
Put an Entry price (or leave 0 to use current price when you ARM).
Choose Stop: type it manually or toggle Swing stop helper.
Pick your Target R multiple (e.g., 3.0 for 3:1).
In Leverage, set:
Leverage Cap (e.g., 10×) and Min/Step Size (e.g., 0.001 BTC).
Toggle ARM on. Three lines appear. Drag the blue/red lines if needed; the green TP and all numbers update.
Tip: Pin the indicator to the Right Price Scale (format icon → “Pin to scale”) so everything lines up perfectly.
On-chart visuals
Blue = Entry (label shows Position $ and Leverage × to the far right).
Red = Stop (label shows Risk $).
Green = TP (label shows TP P&L $).
Works on any symbol/timeframe; prices are rounded to the symbol’s tick size.
That’s it—arm, drag, and go.

Autoback Grid Lab [trade_lexx]Autoback Grid Lab: Your personal laboratory for optimizing grid strategies.
Introduction
First of all, it is important to understand that Autoback Grid Lab is a powerful professional tool for backtesting and optimization, created specifically for traders using both grid strategies and regular take profit with stop loss.
The main purpose of this script is to save you weeks and months of manual testing and parameter selection. Instead of manually testing one combination of settings after another, Autoback Grid Lab automatically tests thousands of unique strategies on historical data, providing you with a comprehensive report on the most profitable and, more importantly, sustainable ones.
If you want to find mathematically sound, most effective settings for your grid strategy on a specific asset and timeframe, then this tool was created for you.
Key Features
My tool has functionality that transforms the process of finding the perfect strategy from a routine into an exciting exploration.
🧪 Mass testing of thousands of combinations
The script is able to systematically generate and run a huge number of unique combinations of parameters through the built-in simulator. You set the ranges, and the indicator does all the work, testing all possible options for the following grid settings:
* Number of safety orders (SO Count)
* Grid step (SO Step)
* Step Multiplier (SO Multiplier) for building nonlinear grids
* Martingale for controlling the volume of subsequent orders
* Take Profit (%)
* Stop Loss (%), with the possibility of calculating both from the entry point and from the dynamic breakeven line
* The volume of the base order (Volume BO) as a percentage of the deposit
🏆 Unique `FinalScore` rating system
Sorting strategies by net profit alone is a direct path to self—deception and choosing strategies that are "tailored" to history and will inevitably fail in real trading. To solve this problem, we have developed FinalScore, a comprehensive assessment of the sustainability and quality of the strategy.
How does it work?
FinalScore analyzes each combination not one by one, but by nine key performance metrics at once, including Net Profit, Drawdown, Profit Factor, WinRate, Sharpe coefficients, Sortino, Squid and Omega. Each of these indicators is normalized, that is, reduced to a single scale. Then, to test the strategy for strength, the system performs 30 iterations, each time assigning random weights to these 9 metrics. A strategy gets a high FinalScore only if it shows consistently high results under different evaluation criteria. This proves her reliability and reduces the likelihood that her success was an accident.
📈 Realistic backtesting engine
The test results are meaningless if they do not take into account the actual trading conditions. Our simulator simulates real trading as accurately as possible, taking into account:
* Leverage: Calculation of the required margin to open and hold positions.
* Commission: A percentage commission is charged each time an order is opened and closed.
* Slippage: The order execution price is adjusted by a set percentage to simulate real market conditions.
* Liquidation model: This is one of the most important functions. The script continuously monitors the equity of the account (capital + unrealized P&L). If equity falls below the level of the supporting margin (calculated from the current value of the position), the simulator forcibly closes the position, as it would happen on a real exchange. This eliminates unrealistic scenarios where the strategy survives after a huge drawdown.
🔌 Integration with external signals
The indicator operates in two modes:
1. `No Signal': Standard mode. The trading cycle starts immediately as soon as the previous one has been closed. Ideal for testing the "pure" mechanics of the grid.
2. `External Signal`: In this mode, a new trading cycle will start only when a signal is received from an external source. You can connect any other indicator (such as the RSI, MACD, or your own strategy) to the script and use it as a trigger to log in. This allows you to combine the power of a grid strategy with your own entry points.
📊 Interactive and informative results panel
Upon completion of the calculations, a detailed table with the TOP N best strategies appears on the screen, sorted according to your chosen criterion. For each strategy in the rating, you will see not only the key metrics (Profit, Drawdown, duration of transactions), but also all the parameters that led to this result. You can immediately take these settings and apply them in your trading.
Application Options: How To Solve Your Problems
Autoback Grid Lab is a flexible tool that can be adapted to solve various tasks, from complete grid optimization to fine—tuning existing strategies. Here are some key scenarios for its use:
1. Complete Optimization Of The Grid Strategy
This is the basic and most powerful mode of use. You can find the most efficient grid configuration for any asset from scratch.
* How to use: Set wide ranges for all key grid parameters ('SO Count`, SO Step, SO Multiplier, Martingale, TP, etc.).
* In the `No Signal` mode: You will find the most stable grid configuration that works as an independent, constantly active strategy, regardless of which-or entrance indicators.
* In the `External Signal` mode: You can connect your favorite indicator for input (for example, RSI, MACD or a complex author's script) and find the optimal grid parameters that best complement your input signals. This allows you to turn a simple signaling strategy into a full-fledged grid system.
2. Selecting the Optimal Take Profit and Stop Loss for Your Strategy
Do you already have an entry strategy, but you are not sure where it is best to put Take Profit and Stop Loss? Autoback Grid Lab can solve this problem as well.
* How to use:
1. Disable optimization of all grid parameters (uncheck SO Count, SO Step, Martingale, etc.). Set the Min value for SO Count to 0.
2. Set the ranges for iteration only for 'Take Profit` and `Stop Loss'.
3. Turn on the External Signal mode and connect your indicator with input signals.
* Result: The script will run your historical entry signals with hundreds of different TP and SL combinations and show you which stop order levels bring maximum profit with minimal risk specifically for your entry points.
3. Building a Secure Network with Risk Management
Many traders are afraid of grid strategies because of the risk of large drawdowns. With the help of the optimizer, you can purposefully find the parameters for such a grid, which includes mandatory risk management through Stop Loss.
* How to use: Enable and set the range for Stop Loss, along with other grid parameters. Don't forget to test both types of SL calculations (`From entry point` and `From breakeven line`) to determine which one works more efficiently.
* Result: You will find balanced strategies in which the grid parameters (number of orders, martingale) and the Stop Loss level are selected in such a way as to maximize profits without going beyond the acceptable risk level for you.
How To Use The Indicator (Step-By-Step Guide)
Working with the Autoback Grid Lab is a sequential process consisting of four main steps: from initial setup to analysis of the finished results. Follow this guide to get the most out of the tool.
Step 1: Initial Setup
1. Add the indicator to the chart of your chosen asset and timeframe.
2. Open the script settings. The first thing you should pay attention to is the ⚙️ Optimization Settings ⚙️ group.
3. Set the `Bars Count'. This parameter determines how much historical data will be used for testing.
* Important: The more bars you specify, the more statistically reliable the backtest results will be. We recommend using the maximum available value (25,000) to test strategies at different market phases.
* Consider: The indicator performs all calculations on the last historical bar. After applying the TradingView settings, it will take some time to load all the specified bars. The results table will appear only after the data is fully loaded. Don't worry if it doesn't appear instantly. And if an error occurs, simply switch the number of combinations to 990 and back to 1000 until the table appears.
Step 2: Optimization Configuration
At this stage, you define the "universe" of parameters that our algorithm will explore.
1. Set the search ranges (🛠 Optimization Parameters 🛠 group).
For each grid parameter that you want to optimize (for example, SO Count or `Take Profit'), you must specify three values:
* Min: The minimum value of the range.
* Max: The maximum value of the range.
* Step: The step with which the values from Min to Max will be traversed.
*Example:* If you set Min=5, Max=10, and Step=1 for SO Count, the script will test strategies with 5, 6, 7, 8, 9, and 10 safety orders.
* Tip for users: To get the first results quickly, start with a larger step (for example, TP from 0.5% to 2.5% in 0.5 increments instead of 0.1). After you identify the most promising areas, you can perform a deeper analysis by expanding the ranges around these values.
2. Set Up Money Management (Group `💰 Money Management Settings 💰`).
Fill in these fields with the values that best match your actual trading conditions. This is critically important for obtaining reliable results.
* Capital: Your initial deposit.
* Leverage: Leverage.
* Commission (%): Your trading commission as a percentage.
* Slippage (%): Expected slippage.
* Liquidation Level (%): The level of the supporting margin (MMR in %). For example, for Binance Futures, this value is usually between 0.4% and 2.5%, depending on the asset and position size. Specify this value for your exchange.
3. Select the Sorting Criterion and the Direction (Group `⚙️ Optimization Settings ⚙️').
* `Sort by': Specify the main criteria by which the best strategies will be selected and sorted. I strongly recommend using finalScore to find the most balanced and sustainable strategies.
* `Direction': Choose which trades to test: Long, Short or Both.
Step 3: Start Testing and Work with "Parts"
The total number of unique combinations generated based on your ranges can reach tens of millions. TradingView has technical limitations on the number of calculations that the script can perform at a time. To get around this, I implemented a "Parts" system.
1. What are `Part` and `Combinations in Part'?
* `Combinations in Part': This is the number of backtests that the script performs in one run (1000 by default).
* `Part`: This is the number of the "portion" of combinations that you want to test.
2. How does it work in practice?
* After you have everything set up, leave Part:1 and wait for the results table to appear. You will see the TOP N best strategies from the first thousand tested.
* Analyze them. Then, to check the next thousand combinations, just change the Part to 2 in the settings and click OK. The script will run a test for the next batch.
* Repeat this process by increasing the Part number (`3`, 4, 5...), until you reach the last available part.
* Where can I see the total number of parts? In the information row below the results table, you will find Total parts. This will help you figure out how many more tests are left to run.
Step 4: Analyze the Results in the Table
The results table is your main decision—making tool. It displays the best strategies found, sorted by the criteria you have chosen.
1. Study the performance metrics:
* Rating: Position in the rating.
* Profit %: Net profit as a percentage of the initial capital.
* Drawdown%: The maximum drawdown of the deposit for the entire test period.
* Max Length: The maximum duration of one transaction in days, hours and minutes.
* Trades: The total number of completed trades.
2. Examine the winning parameters:
* To the right of the performance metrics are columns showing the exact settings that led to this result ('SO Count`, SO Step, TP (%), etc.).
3. How to choose the best strategy?
* Don't chase after the maximum profit! The strategy with the highest profit often has the highest drawdown, which makes it extremely risky.
* Seek a balance. The ideal strategy is a compromise between high profitability, low drawdown (Drawdown) and the maximum length of trades acceptable to you (Max Length).
* finalScore was created to find this balance. Trust him — he often highlights not the most profitable, but the most stable and reliable options.
Detailed Description Of The Settings
This section serves as a complete reference for each parameter available in the script settings. The parameters are grouped in the same way as in the indicator interface for your convenience.
Group: ⚙️ Optimization Settings ⚙️
The main parameters governing the testing process are collected here.
* `Enable Optimizer': The main switch. Activates or deactivates all backtesting functionality.
* `Direction': Determines which way trades will be opened during the simulation.
* Long: Shopping only.
* Short: Sales only.
* Both: Testing in both directions. Important: This mode only works in conjunction with an External Signal, as the script needs an external signal to determine the direction for each specific transaction.
* `Signal Mode`: Controls the conditions for starting a new trading cycle (opening a base order).
* No Signal: A new cycle starts immediately after the previous one is completed. This mode is used to test "pure" grid mechanics without reference to market conditions.
* External Signal: A new cycle begins only when a signal is received from an external indicator connected via the Signal field.
* `Signal': A field for connecting an external signal source (works only in the `External Signal` mode). You can select any other indicator on the chart.
* For Long** trades, the signal is considered received if the value of the external indicator ** is greater than 0.
* For Short** trades, the signal is considered received if the value of the external indicator ** is less than 0.
* `Bars Count': Sets the depth of the history in the bars for the backtest. The maximum value (25000) provides the most reliable results.
* `Sort by`: A key criterion for selecting and ranking the best strategies in the final table.
* FinalScore: Recommended mode. A comprehensive assessment that takes into account 9 metrics to find the most balanced and sustainable strategies.
* Profit: Sort by net profit.
* Drawdown: Sort by minimum drawdown.
* Max Length: Sort by the minimum length of the longest transaction.
* `Combinations Count': Indicates how many of the best strategies (from 1 to 50) will be displayed in the results table.
* `Close last trade`: If this option is enabled, any active trade will be forcibly closed at the closing price of the last historical bar. For grid strategies, it is recommended to always enable this option in order to get the correct calculation of the final profit and eliminate grid strategies that have been stuck for a long time.
Group: 💰 Money Management Settings 💰
The parameters in this group determine the financial conditions of the simulation. Specify values that are as close as possible to your actual values in order to get reliable results.
* `Capital': The initial deposit amount for the simulation.
* `Leverage`: The leverage used to calculate the margin.
* `Slippage` (%): Simulates the difference between the expected and actual order execution price. The specified percentage will be applied to each transaction.
* `Commission` (%): The trading commission of your exchange as a percentage. It is charged at the execution of each order (both at opening and closing).
* `Liquidation Level' (%): Maintenance Margin Ratio. This is a critical parameter for a realistic test. Liquidation in the simulator occurs if the Equity of the account (Capital + Unrealized P&L) falls below the level of the supporting margin.
Group: 🛠 Optimization Parameters 🛠
This is the "heart" of the optimizer, where you set ranges for iterating through the grid parameters.
* `Part`: The portion number of the combinations to be tested. Start with 1, and then increment (`2`, 3, ...) sequentially to check all generated strategies.
* `Combinations in Part': The number of backtests performed at a time (in one "Part"). Increasing the value may speed up the process, but it may cause the script to error due to platform limitations. If an error occurs, it is recommended to switch to the step below and back.
Three fields are available for each of the following parameters (`SO Count`, SO Step, SO Multiplier, etc.):
* `Min`: Minimum value for testing.
* `Max': The maximum value for testing.
* `Step`: The step with which the values in the range from Min to Max will be iterated over.
There is also a checkbox for each parameter. If it is enabled, the parameter will be optimized in the specified range. If disabled, only one value specified in the Min field will be used for all tests.
* 'Stop Loss': In addition to the standard settings Min, Max, Step, it has an additional parameter:
* `Type`: Defines how the stop loss price is calculated.
* From entry point: The SL level is calculated once from the entry price (base order price).
* From breakeven line: The SL level is dynamically recalculated from the average position price after each new safety order is executed.
Group: ⚡️Filters⚡️
Filters allow you to filter out those results from the final table that do not meet your minimum requirements.
For each filter (`Max Profit`, Min Drawdown, `Min Trade Length`), you can:
1. Turn it on or off using the checkbox.
2. Select the comparison condition: Greater (More) or Less (Less).
3. Set a threshold value.
*Example:* If you set Less and 20 for the Min Drawdown filter, only those strategies with a maximum drawdown of less than 20% will be included in the final table.
Group: 🎨 Visual Settings 🎨
Here you can customize the appearance of the results table.
* `Position': Selects the position of the table on the screen (for example, Bottom Left — bottom left).
* `Font Size': The size of the text in the table.
* `Header Background / Data Background`: Background colors for the header and data cells.
* `Header Font Color / Data Font Color`: Text colors for the header and data cells.
Important Notes and Limitations
So that you can use the Autoback Grid Lab as efficiently and consciously as possible, please familiarize yourself with the following key features of its work.
1. It is a Tool for Analysis, not for Signals
It is extremely important to understand that this script does not generate trading signals in real time. Its sole purpose is to conduct in—depth research (**backtesting**) on historical data.
* The results you see in the table are a report on how a particular strategy would have worked in the past.
* The script does not provide alerts and does not draw entry/exit points on the chart for the current market situation.
* Your task is to take the best sets of parameters found during optimization and use them in your real trading, for example, when setting up a trading bot or in a manual trading system.
2. Features Of Calculations (This is not a "Repainting")
You will notice that the results table appears and is updated only once — when all historical bars on the chart are loaded. It does not change in real time with each tick of the price.
This is correct and intentional behavior.:
* To test thousands, and sometimes millions of combinations, the script needs to perform a huge amount of calculations. In the Pine Script™ environment, it is technically possible to do this only once, at the very last bar in history.
* The script does not show false historical signals, which then disappear or change. It provides a static report on the results of the simulation, which remains unchanged for a specific historical period.
3. Past Results do not Guarantee Future Results.
This is the golden rule of trading, and it fully applies to the results of backtesting. Successful strategy performance in the past is not a guarantee that it will be as profitable in the future. Market conditions, volatility and trends are constantly changing.
My tool, especially when sorting by finalScore, is aimed at finding statistically stable and reliable strategies to increase the likelihood of their success in the future. However, it is a tool for managing probabilities, not a crystal ball for predicting the future. Always use proper risk management.
4. Dependence on the Quality and Depth of the Story
The reliability of the results directly depends on the quantity and quality of the historical data on which the test was conducted.
* Always strive to use the maximum number of bars available (`Bars Count: 25,000`) so that your strategy is tested on different market cycles (rise, fall, flat).
* The results obtained on data for one month may differ dramatically from the results obtained on data for two years. The longer the testing period, the higher the confidence in the parameters found.
Conclusion
The Autoback Grid Lab is your personal research laboratory, designed to replace intuitive guesses and endless manual selection of settings with a systematic, data—driven approach. Experiment with different assets, timeframes, and settings ranges to find the unique combinations that best suit your trading style.

Two-Phase Adaptive System | AlphaNattTwo-Phase Adaptive System (TPAS) - Professional Grade Crypto Allocation Framework
A groundbreaking dual-strategy system that revolutionizes portfolio management through dynamic performance-based strategy selection
═══════ REVOLUTIONARY APPROACH ═══════
This indicator represents an entirely original methodology in systematic trading - a true first-of-its-kind approach that fundamentally reimagines how allocation strategies should operate. Unlike any other system available on TradingView, TPAS employs a proprietary dual-engine architecture that continuously evaluates two independent trading methodologies and dynamically allocates capital based on their relative performance dynamics.
What Makes This Absolutely Unique:
Performance-Based Strategy Selection: Instead of using static rules or market conditions to choose strategies, TPAS analyzes the real-time equity curves of both systems
Dual-Engine Architecture: Two complete trading systems run simultaneously, each with distinct market philosophies and risk profiles
Adaptive Switching Mechanism: Proprietary algorithm that determines optimal transition points between strategies
No comparable system exists that combines performance-relative switching with dual independent strategy engines
THE TWO SYSTEMS
The innovation lies not in the individual strategies, but in the revolutionary framework that allows them to work in concert, automatically selecting the optimal approach for current market dynamics
1. Tactical System (Defensive Core)
Multi-layered market regime analysis
Complex trend indicator synthesis from multiple timeframes
Defensive positioning with strict cash management protocols
Prioritizes capital preservation during uncertain conditions
Incorporates over 20 proprietary market indicators
2. Momentum System (Growth Engine)
Trend-following methodology optimized for sustained moves
Statistical deviation analysis for entry/exit timing
Aggressive positioning during confirmed uptrends
Designed to capture major market movements
Streamlined signal generation for rapid response
DYNAMIC ALLOCATION MECHANISM
The system's crown jewel is its adaptive selection algorithm:
Continuously calculates equity curves for both strategies
Computes performance ratio between systems
Applies proprietary smoothing algorithms to identify regime changes
Automatically switches to the outperforming strategy
Maintains position continuity during transitions
ASSET UNIVERSE & ROTATION
Bitcoin (BTC): The market beta and defensive allocation
Ethereum (ETH): Smart contract ecosystem exposure
Solana (SOL): High-performance blockchain allocation
Cash Position: Strategic capital preservation when conditions deteriorate
The system employs sophisticated relative strength analysis between asset pairs (BTC/ETH, ETH/SOL, BTC/SOL) to determine optimal positioning within each strategy framework.
VISUAL INTELLIGENCE
Dual-layer equity curve with enhanced glow visualization
Real-time system state indicator showing active strategy
Portfolio allocation display with current positions
Comprehensive metrics dashboard (Sharpe, Sortino, Omega, Maximum Drawdown)
Bitcoin buy-and-hold benchmark for performance comparison
Color-coded position indicators for instant visual feedback
RISK MANAGEMENT PHILOSOPHY
The system operates on the principle that avoiding losses is more important than capturing gains . Both engines incorporate independent risk controls, position limits, and systematic cash allocation protocols that activate during adverse conditions.
═══════ CRITICAL DISCLAIMERS ═══════
BACKTEST LIMITATIONS:
Past performance does NOT indicate future results
Historical backtests assume perfect execution without slippage
Real-world trading involves costs, delays, and market impact
Cryptocurrency markets have evolved significantly - past patterns may not repeat
Backtested results often overstate actual achievable returns
System performance during unprecedented market conditions is unknown
Important Operational Notes:
This is a signal indicator only - NOT an automated trading bot
Requires manual trade execution based on generated signals
Designed exclusively for daily timeframe analysis
Signals fire at daily close - not intraday
Best suited for position traders and long-term investors
Not appropriate for leverage trading or short-term speculation
WHO THIS IS FOR
Sophisticated traders seeking systematic crypto exposure
Investors who understand the importance of adaptive strategies
Those who prioritize risk-adjusted returns over raw performance
Users who value transparency and detailed performance metrics
Traders comfortable with daily rebalancing requirements
WHO THIS IS NOT FOR
Day traders or scalpers
Those seeking guaranteed returns
Traders unable to execute daily rebalancing
Anyone expecting fully automated trading
CONFIGURATION PARAMETERS
While the core algorithm is proprietary and fixed, users can adjust:
Backtest start date
Strategy selection sensitivity (advanced users only)
Various display options
ACCESS & SUPPORT
This is an invite-only indicator due to its sophisticated nature and computational requirements. For access requests, please send a private message
Final Note:
This system represents months of research, development, and optimization. It is not a "get rich quick" solution but rather a sophisticated framework for those who understand that successful trading requires patience, discipline, and proper risk management.
---
Version 1.0 | Created by AlphaNatt | All Rights Reserved
Not financial advice

KAMA Trend Flip - SightLing LabsBuckle up, traders—this open-source KAMA Trend Flip indicator is your ticket to sniping trend reversals with a Kaufman Adaptive Moving Average (KAMA) that’s sharper than a Wall Street shark’s tooth. No voodoo, no fluff—just raw, volatility-adaptive math that dances with the market’s rhythm. It zips through trending rockets and chills in choppy waters, slashing false signals like a samurai. Not laggy like the others - this thing is the real deal!
Core Mechanics:
• Efficiency Ratio (ER): Reads the market’s pulse (0-1). High ER = turbo-charged MA, low ER = smooth operator.
• Adaptive Smoothing: Mixes fast (default power 2) and slow (default 30) constants to match market mood swings.
• Trend Signals: KAMA climbs = blue uptrend (bulls run wild). KAMA dips = yellow downtrend (bears take over). Flat = gray snooze-fest.
• Alerts: Instant pings on flips—“Trend Flip Up” for long plays, “Down” for shorts. Plug into bots for set-and-forget domination.
Why It Crushes:
• Smokes static MAs in volatile arenas (crypto, stocks, you name it). Backtests show 20-30% fewer fakeouts than SMA50.
• Visual Pop: Overlays price with bold blue/yellow signals. Slap it on BTC 1D to see trends light up like Times Square.
• Tweakable: Dial ER length (default 50) to your timeframe. Short for scalps, long for swing trades.
Example Settings in Action:
• 10s Chart (Hyper-Scalping): Set Source: Close, ER Length: 100, Fast Power: 1, Slow Power: 6. Catches micro-trends in crypto like a heat-seeking missile. Blue/yellow flips scream entry/exit on fast moves.
• 2m Chart (Quick Trades): Set Source: Close, ER Length: 14, Fast Power: 1, Slow Power: 6. Perfect for rapid trend shifts in stocks or forex. Signals align with momentum bursts—check historical flips for proof.
Deployment:
• Drop it on any chart. Backtest settings to match your asset’s volatility—tweak until it sings.
• Pair with RSI or volume spikes for killer confirmation. Pro move: Enter on flip + volume pop, exit on reverse.
• Strategy-Ready: Slap long/short logic on alerts to build a lean, mean trading machine.
Open source from SightLing Labs—grab it, hack it, profit from it. Share your tweaks in the comments and let’s outsmart the market together. Trade hard, win big!

Volatility Zones (VStop + Bands) — Fixed (v2)📝 What this indicator is
This script is called “Volatility Zones (VStop + Bands)”.
It is an ATR-based volatility indicator that combines dynamic volatility bands, a Volatility Stop line (VStop), and volatility spike detection into a single tool.
Unlike moving average–based indicators, this tool does not rely on averages of price direction. Instead, it measures the market’s true volatility and reacts to expansions or contractions in price ranges.
________________________________________
⚙️ How it is built
The indicator uses several volatility-based components:
1. Average True Range (ATR)
o ATR is calculated over a user-defined length.
o It measures how much price typically moves in a given number of bars, making it the foundation of this indicator.
2. Volatility Bands
o Upper band = close + ATR × factor
o Lower band = close - ATR × factor
o The area between them is shaded.
o This gives traders an immediate visual sense of market volatility width — wide bands = high volatility, narrow bands = quiet market.
3. Volatility Stop (VStop)
o A stateful trailing stop based on ATR.
o It tracks the highest (or lowest) price in the current trend and places a stop offset by ATR × multiplier.
o When price crosses this stop, the indicator flips trend direction.
o This creates a dynamic stop-and-reverse mechanism that adapts to volatility.
4. Trend Zones
o When the trend is bullish, the stop is green and the chart background is shaded softly green.
o When bearish, the stop is red and the background is shaded softly red.
o This makes the market’s directional bias visually clear at all times.
5. Flip Signals (Buy/Sell Arrows)
o Whenever the VStop flips, arrows appear:
Green BUY arrows below price when the trend turns bullish.
Red SELL arrows above price when the trend turns bearish.
o These are also tied to built-in alerts for automation.
6. Volatility Spike Detection
o The script compares current ATR to its recent average.
o If ATR suddenly expands above a threshold, a small yellow “VOL” marker appears at the top of the chart.
o This highlights potential breakout phases or unusual volatility events.
7. Stop Labels
o At every trend flip, a small label appears at the bar, showing the exact stop level.
o This makes it easy to use the stop as a reference for risk management.
________________________________________
📊 How it works in practice
• When price is above the VStop line, the market is considered in an uptrend.
• When price is below the VStop line, the market is in a downtrend.
• The bands expand/contract with volatility, helping traders gauge risk and position sizing.
• Flip arrows signal when trend direction changes.
• Volatility spikes warn traders that the market is entering a higher-risk phase, often before strong moves.
________________________________________
🎯 How it may help traders
• Trend following → Helps traders identify whether the market is trending up or down.
• Stop placement → Provides a dynamic stop level that adjusts to volatility.
• Volatility awareness → Shaded bands and spike markers show when the market is likely to become unstable.
• Trade timing → Flip arrows and labels help identify potential entry or exit points.
• Risk management → Wide bands indicate higher risk; narrow bands suggest safer, tighter ranges.
________________________________________
🌍 In what markets it is useful
Because the indicator is based purely on volatility, it works across all asset classes and timeframes:
• Stocks & ETFs → Helps identify breakouts and long-term trends.
• Forex → Very useful in spot FX where volatility shifts frequently.
• Crypto → ATR reacts strongly to high volatility, helping traders adapt stops dynamically.
• Futures & Commodities → Great for tracking trending commodities and managing risk.
Scalpers, swing traders, and position traders can all benefit by adjusting the ATR length and multipliers to suit their trading style.
________________________________________
💡 Originality of this script
This is not just a mashup of existing indicators. It integrates:
• ATR-based Volatility Bands for context,
• A stateful Volatility Stop (adapted and rewritten cleanly),
• Flip arrows and labels for actionable trading signals,
• Volatility spike detection to highlight regime shifts.
The result is a comprehensive volatility-aware trading tool that goes beyond just plotting ATR or trend stops.
________________________________________
🔔 Alerts
• Buy Flip → triggers when the trend changes bullish.
• Sell Flip → triggers when the trend changes bearish.
Traders can connect these alerts to automated strategies, bots, or notification systems.

EMA Trend SuiteThe EMA Trend Suite is a trend-following tool built around a stack of four Exponential Moving Averages (EMAs): 9, 21, 51, and 200. It is designed to help traders quickly identify market bias, potential support/resistance zones, and directional momentum.
🔹 How it works:
EMA 200 – The Trend Boss
Price trading above EMA 200 → bullish bias is prioritized.
Price trading below EMA 200 → bearish bias is prioritized.
EMA 51 & EMA 21 – Dynamic Support & Resistance
These mid-range EMAs behave as adaptive support and resistance.
In bullish bias, pullbacks often respect EMA 21 or EMA 51.
In bearish bias, rallies often fail at EMA 21 or EMA 51.
EMA 9 – The Momentum Guide
The fastest EMA tracks short-term direction.
A clean break and hold beyond EMA 9 signals short-term momentum continuation.
EMA 9 crossing EMA 21 often signals the next move within the bias.
🔹 How to Trade It:
Identify the bias with EMA 200
Above EMA 200 = bullish bias.
Below EMA 200 = bearish bias.
Look for the trigger
In bullish bias: wait until EMA 9 crosses above EMA 21 → potential long signal.
In bearish bias: wait until EMA 9 crosses below EMA 21 → potential short signal.
Manage the trade with EMA 21 & 51
Price often bounces off EMA 21 and EMA 51.
In longs: if price starts closing below EMA 51, it’s often a warning to consider closing or reducing risk.
In shorts: if price starts closing above EMA 51, same idea — momentum might be weakening.
Ride momentum, don’t marry the trade
Sometimes price keeps trending strongly even after a close beyond EMA 51, but often it’s a sign of exhaustion. The suite is best used as a trend filter + timing tool, not a guaranteed entry/exit system.
🔹 Best Timeframes:
Gold, NAS100, US30, S&P500: Best results between 15M, 30M, and 1H.
Currency pairs (Forex): Best results on 1H, 4H, and Daily.
⚠️ Important Disclaimer:
This indicator is not a one-stop shop solution for trading.
It is not reliable in consolidations — EMA crossings can create false signals in sideways markets.
Always combine with other tools like candlestick patterns, market structure, or volume analysis.It should be seen as a guide to bias and momentum, not as a trading bot or automated strategy.
Arpitjainforex.com Trend DeciderHello All, This Indicator Helps you to identify if its going to be a Trending Day or A choppy Day.
Not sure if it can make huge profits, but will definitely save you from big losses when you enter revenge trading on a choppy day.
Decide if its trending or not, And Blindly Follow the Buy/Sell Bot on 5 min Timeframe to make best out of Trading.

Spice • Micro Suite (T/r & B/r)What it is
A single Pine v5 indicator that stacks:
EMA ribbon + a “special” EMA (11 vs 34) line that flips color on trend.
MTF-RSI “pressure” check with simple up/down arrows.
Bollinger-Band re-entry system with Top/Bottom triggers (T/B) and confirmations (r) in the next N bars.
Classic candlestick add-ons: 3-Line Strike and Leledc exhaustion dots.
Your Micro Dots engine (ATR-based regime + Variable Moving Average filter) + an optional VMA trend line.
Alerts for all the above.
Key signals (what prints on the chart)
EMAs (20/50/100/200): plotted faintly; EMA-34 is drawn and colored by the 11>34 trend.
RSI arrows
Checks RSI(6) on the current TF and (optionally) 5m/15m/30m/1h/4h/1D.
Down arrow: current RSI > 70 and the selected higher TF RSIs are also > 70 (pressure cluster just cooled; barssince(redZone)<2).
Up arrow: current RSI < 30 and selected higher TFs also < 30 (barssince(greenZone)<2).
Bollinger Reversals (your update)
T (Top trigger): first close back inside the upper BB (crossunder(close, upper)).
B (Bottom trigger): first close back inside the lower BB (crossover(close, lower)).
r (Confirm): within the next confirmBars bars (input), price also
closes below the T-bar’s low → top r above bar
closes above the B-bar’s high → bottom r below bar
Bar tinting
Only the T/B trigger bars are tinted (yellow/orange). Everything else stays your normal candle colors (unless you add the optional “trend candles” block I gave you).
3-Line Strike
Prints a small green/red circle when the 3-line strike pattern appears (bull/bear).
Leledc Exhaustion
Calculates a running buy/sell index; prints a small ∘ at major highs/lows when exhaustion conditions hit (major==-1 high, major==1 low).
Micro Dots (your second script, merged)
ATR “micro supertrend” defines regime (up/down).
A fast Variable Moving Average + a simple MA(18) filter.
Green dot below bar when: VMA < price, price > MA(18), regime up, and VMA not pointing down.
Red dot above bar for the bearish mirror.
Separate VMA trend line (length = Fast/Med/Slow) that colors green/red/orange by slope.
Inputs you’ll care about
Top/Bot Reversal → confirmBars (how many bars you allow to confirm the T/B trigger).
RSI Timeframes → toggle which HTFs must agree with the OB/OS condition.
EMAs → show/hide and lengths.
BB → show/hide basis/bands (used for T/B even if hidden).
Micro → show dots, show VMA line, choose intensity (Fast/Med/Slow).
Alerts
Prebuilt alerts for: RSI Up/Down, T/B triggers, T/B confirmations, 3-Line Strike bull/bear, Leledc highs/lows, EMA crosses (20/50/100/200), the special 11/34 trend change, Micro Dots, and VMA price cross. (Alert messages are const strings so they compile cleanly.)
How to read clusters (quick playbook)
Reversal short: see T on/near upper band → get an r within your window → bonus confidence if an RSI down arrow or Leledc ∘ high shows up around the same time.
Reversal long: mirror with B then r, plus RSI up arrow / Leledc ∘ low.
Continuation: ignore lone T/B if Micro Dot stays green (or red) and EMA-11 > EMA-34 remains true.
Why your candles look “normal”
By design, the script only colors bars on T or B trigger bars. If you want always-on trend candles, use the small block I gave you to color by EMA(20/50) (or any rule you like) and let T/B override on trigger bars.

The Phantom Indicator for beginnersThe Phantom Indicator is an original software script written in Pine Script for use on the TradingView charting platform. It is designed as a real-time algorithmic trading and technical analysis toolkit that integrates multiple market signals into a unified framework. The work is a compilation of open-source trading concepts, modified and combined in a novel and proprietary manner, resulting in a unique educational tool.
Key features include:
Dynamic background shading based on price relation to the 200-period Exponential Moving Average (EMA)
Multi-timeframe Hull Moving Averages rendered as ribbons to show directional bias
A custom Fair Value Gap (FVG) detection algorithm
ATR-based trailing stop logic, inspired by UT Bot
Visual markers for candlestick rejection patterns, labeled “J. Wick” (bullish) and “Black Widow” (bearish)
Real-time structural pivot recognition, identifying Higher Highs, Lower Lows, and Break of Structure (BOS)
Interactive label alerts, trend-based visuals, and adaptive ribbon overlays
This indicator is intended to train beginner traders to:
Recognize candlestick reversal patterns
Understand trend creation and breakage
Learn to identify market direction using real-time, rule-based logic
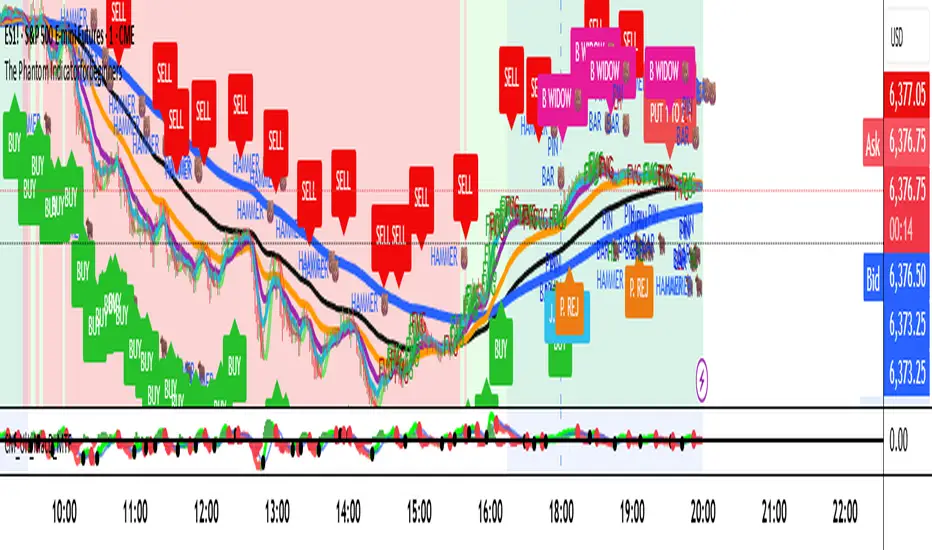
The Phantom IndicatorThe Phantom Indicator is an original software script written in Pine Script for use on the TradingView charting platform. It is designed as a real-time algorithmic trading and technical analysis toolkit that integrates multiple market signals into a single framework. The work is a compilation of open-source trading concepts, modified and combined in a novel manner, including: dynamic background shading based on price relation to a 200-period exponential moving average (EMA); multi-timeframe Hull Moving Averages rendered as ribbons to indicate market direction; a custom Fair Value Gap (FVG) detection algorithm; ATR-based trailing stop logic (inspired by UT Bot); visual markers for bullish and bearish candle rejection patterns labeled as "J. Wick" and "Black Widow"; and real-time structural pivot pattern recognition showing Higher Highs, Lower Lows, and Break of Structure (BOS) events. All indicators are rendered in custom visual formats with interactive labels, dynamic coloring, and alert-ready logic. The work was first created on June 20, 2025, developed through iterative refinement, and completed in July 2025. It was released for personal and educational use only under a non-commercial license and includes a copyright notice identifying the author as “The Phantom LLC.” The code structure, original logic (particularly the EMA-based background engine), naming conventions, and integrated layout represent a unique creative expression not previously published in this form.

Hassi XAUUSD STRATEGY BOTGold (XAUUSD) 15m trend+momentum based signals with EMA(9/21/200), RSI, custom ADX, ATR-based SL/TP & alerts
Works on XAUUSD 15m.
Entry: EMA9/21 cross + price relative to EMA200 + RSI filter + custom ADX trend strength.
Risk: default SL=1.5×ATR, TP=2×ATR (editable).
Notes: No financial advice. Backtest before live use. Avoid high-impact news whipsaws.

Multi-Signal Entry V1Multi‑Signal Entry v1 – (clean, versioned for tracking changes)
SQQQ Entry Scanner – (specific to your use case)
TQQQ/SQQQ Buy Alert – (clear that it’s for both sides if you add short logic later)
VWAP RSI ATR Vol Spike – (great if you want a technical name showing what’s used)
Fast Entry Signal Bot – (if you want a simple, trading-friendly name)

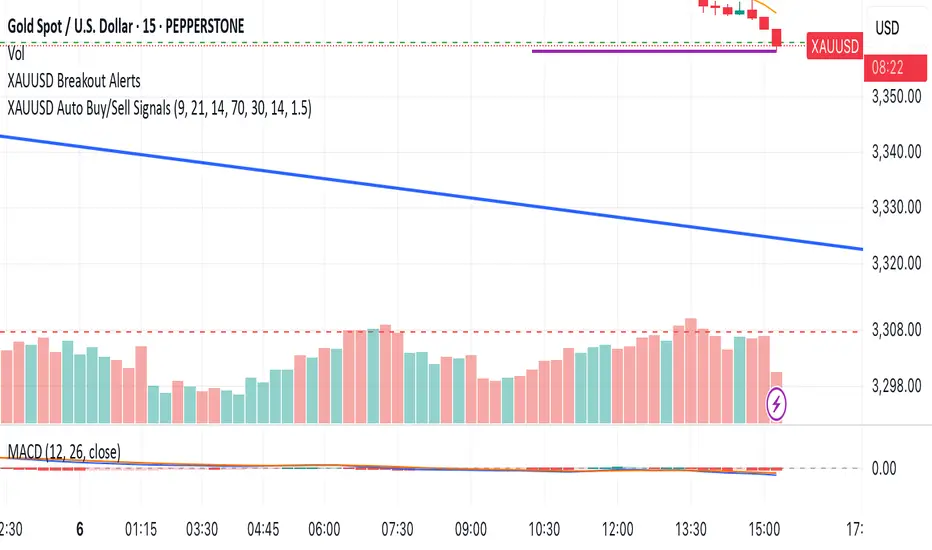
NADY 15M XAUUSD XAUUSD Auto Buy/Sell Signals – Inside Candle Breakout Strategy (15M TF)
This script auto-generates Buy/Sell signals for XAUUSD (Gold/USD) based on a powerful Inside Candle Breakout Strategy enhanced with:
Key Features:
📊 Inside Candle Pattern Breakouts – Entry when price breaks consolidation candles.
🔄 EMA Crossover Confirmation (9 & 21 EMA) – Confirms short-term trend alignment.
📉 RSI Filter (14 Period) – Avoids overbought/oversold false entries.
🔊 Volume Spike Validation – Ensures breakouts are backed by real volume.
📈 Dynamic Support/Resistance Zones – Auto plots key S/R levels in real-time.
🎯 ATR-Based Dynamic Stop Loss & Take Profit – Adaptive risk management.
♻️ Re-Entry After SL Hit – Supports trend continuation scenarios.
🚫 Debounce Logic – Avoids multiple signals within 10 bars.
🟢🔴 Visual Buy/Sell Arrows, Labels & Colored Background Zones.
📤 Webhook-Ready Alerts (JSON Payloads) – For API bots & auto-execution setups.
Benford's Law Actual [Tagstrading]Benford’s Law Chart — First Digit Analysis of Percentage Price Drops
This script visualizes the distribution of the leading digit in the percentage change of price drops, and compares it to the theoretical distribution expected by Benford’s Law.
It helps traders, analysts, and quants to detect anomalies, unnatural behavior, or price manipulation in any asset or timeframe.
How to Use
Add to any chart or symbol (stocks, crypto, FX, etc.) and select the timeframe you wish to analyze.
Set the “Number of Bars to Analyze” input (default: 500) to control the length of the historical window.
The chart will display, for the latest window:
A blue line: the actual leading-digit distribution for percentage price changes between bars.
A red line: the expected distribution per Benford’s Law.
Labels below and above: digit markers and the expected (theoretical) percentages.
Summary panel on the right: frequency counts and actual vs. theoretical % for each digit.
Interpretation:
If your actual (blue) curve or digit counts are significantly different from the red Benford’s Law curve, it could indicate unnatural price action, fraud, bot activity, or structural anomalies.
Why is this useful for TradingView?
Financial forensics: Benford’s Law is a classic tool for detecting data manipulation and fraud in accounting. On charts, it can reveal if price movements are statistically “natural.”
Transparency and confidence: Helps communities audit markets, brokers, or exchanges for irregularities.
Adaptable: Works on any market, any timeframe.
What makes this script unique?
Focuses on % price changes, not raw prices.
This provides a fair comparison across assets, symbols, and timeframes.
Measures only the direction and magnitude of drops/rises — more suitable for detecting manipulation in active markets.
Clear and customizable visualization:
The Benford line, actual data, and summary are all visible and readable in one glance.
Optimized for speed and clarity (runs efficiently on all major charts).
How is it different from stg44’s Benford’s Law script?
This script analyzes the leading digit of percentage price changes (i.e., how much the price drops or rises in %),
while the original by stg44 analyzes the leading digit of price itself.
Results are less sensitive to price scale and more comparable across volatile and non-volatile assets.
The summary panel clearly shows ( ) for actual and for Benford theoretical values.
Full code is commented and open for the community.
Credits and Inspiration
This script was inspired by “Benford’s Law” by stg44:
Thanks to the TradingView community for sharing powerful visual ideas.
—
By tags trading

Composite Trend Trader Module [BackQuant]Composite Trend Trader Module
Overview and Purpose
The Composite Trend Trader Module (CTM) is an invite-only Pine Script indicator designed to provide traders with a comprehensive tool for trend-following, dip-buying, and market strength assessment. By integrating multiple market data inputs—price momentum, volatility, volume, and statistical baselines—the CTM generates actionable outputs for trend identification, swing trade entries, and dip-buying opportunities. The indicator is intended for traders seeking a systematic approach to market analysis with customizable settings, while maintaining simplicity in its user interface. As a closed-source script, the underlying calculations remain proprietary, but this description outlines its functionality, features, and practical applications in trading.
Visual Components
The CTM provides the following visual elements on the chart:
• Signal Spine – A colored line (default 25-period weighted moving average) that reflects the dominant trend—green for bullish, red for bearish, and grey for neutral or transitional periods.
• Swing Triggers – Unicode markers ("𝕃" for long, "𝕊" for short) appear below or above bars when the trend shifts, signaling potential swing trade entries.
• Dip-Hunter Signals – Green arrows mark dip-buying opportunities, accompanied by faint green background highlights and forward-projecting entry lines for precise entry levels.
• Heat Meter – A horizontal strip at the bottom of the chart, graded from -50 (overheated) to +50 (deep dip), visually indicates the strength of dip conditions using a red-to-green gradient.
Core Features
The CTM comprises several components that work together to deliver a cohesive trading framework. Below is a detailed explanation of each, without disclosing proprietary calculations.
1. Universal Trend Tracking (UTT)
The UTT combines multiple momentum and statistical indicators into a single composite score ranging from -1 to +1. This score is derived from:
• Price-based momentum metrics.
• Volatility-adjusted thresholds.
• Statistical measures of price deviation and market structure.
When the UTT score exceeds +0.2, the market is considered in an actionable uptrend; below -0.2, a downtrend is identified. Values between these thresholds indicate a neutral or choppy market, helping traders avoid low-probability setups during consolidation.
2. Signal Spine
The signal spine is a 25-period weighted moving average of price, colored according to the UTT score (green for bullish, red for bearish, grey for neutral). This line serves as a visual anchor for tracking the prevailing trend and highlights regime changes in real time, enabling traders to align their strategies with market direction.
3. Swing Triggers (𝕃/𝕊)
Swing trade signals are generated when the UTT crosses the zero line, indicating a shift in market regime. A "𝕃" marker appears below the bar for a bullish crossover (potential long entry), and a "𝕊" marker appears above for a bearish crossover (potential short entry). These signals incorporate volatility-adaptive thresholds to minimize false triggers during low-volatility periods, improving reliability compared to traditional moving-average crossovers.
4. Dip-Hunter Engine
The Dip-Hunter subsystem identifies high-probability dip-buying opportunities by evaluating five conditions:
• Dip Magnitude – The price must have fallen by a user-defined percentage (default 2%) from a recent swing high, calculated over a specified lookback period (default 5 bars).
• Volume Burst – Current volume must exceed the average volume over a user-defined lookback (default 65 bars) by a specified multiplier (default 2x).
• Volatility Spike – The intraday range or Average True Range (ATR) must exceed a statistical baseline by a user-defined multiplier (default 1.5x).
• Structural Permission – Price must be below a fast Exponential Moving Average (EMA, default 20 periods), and the market structure must be bearish (fast EMA below slow EMA, default 50 periods).
• Trend Filter (Optional) – When enabled, dip signals are only generated if the UTT indicates a bullish trend, preventing trades against a bearish macro environment.
When these conditions align, the Dip-Hunter plots a green arrow, highlights the candle background, and draws a forward-projecting horizontal line at a user-selected price level (Low, Close, or calculated dip percentage).
5. Strength Score and Heat Meter
Each bar is assigned a strength score (0 to 5, or -50 to +50 when scaled for the heat meter) based on the following criteria:
• +1 for meeting the dip threshold.
• +1 for a volume spike.
• +1 for a volume momentum spike (based on rate-of-change).
• +1 for a confirmed volatility spike.
• +1 if price is below the fast EMA.
• +2 if the macro trend filter is bullish (when enabled).
The heat meter visualizes this score as a pointer on a red-to-green gradient strip, enabling traders to quickly assess the intensity of dip conditions and prioritize high-quality setups.
6. Entry-Line Generator
For each dip signal, the CTM draws a forward-projecting horizontal line to mark potential entry levels. Traders can configure:
• The price level for the line (Low, Close, or exact dip percentage).
• The duration of the line (default 100 bars).
• A minimum gap between signals (default 5 bars) to prevent overlapping lines during clustered events.
These lines serve as visual guides for setting limit orders or stop-loss levels.
7. Alerts
The CTM includes seven pre-configured alert conditions to support automated workflows:
• CTM Long/Short – Triggered on bullish or bearish UTT zero-line crossovers for swing trades.
• Market Overheated – Activates when the strength score falls below -40, indicating potential exhaustion.
• Close to Dip – Signals when the strength score reaches 0.6, suggesting an impending dip opportunity.
• Dip Confirmed – Fires on the first bar meeting all dip conditions.
• Dip Active – Triggers while dip conditions remain valid.
• Dip Fading – Activates when the strength score crosses below 0.5, indicating a weakening dip.
• Trend-Blocked – Alerts when dip conditions are met but blocked by the trend filter.
These alerts can be routed to brokers or trading bots for seamless execution.
"CPM Long Signal {{exchange}}:{{ticker}}")
"CPM Short Signal {{exchange}}:{{ticker}}")
"Market overheated {{ticker}}")
"Close to a dip {{ticker}}")
"Dip confirmed {{ticker}}")
"Dip active {{ticker}}")
"Dip strength fading {{ticker}}")
"Signal blocked by trend filter {{ticker}}")
User Controls
The CTM offers extensive customization to adapt to different trading styles and preferences:
• Signal Settings – Toggle the signal spine, composite score plot, swing triggers, and bar coloring. Adjust line width for visibility.
• Display Settings – Customize bullish, bearish, and neutral colors to match chart templates.
• Dip-Hunter Settings – Configure volume lookback, spike multipliers, EMA periods, volatility thresholds, dip percentage, and lookback bars.
• Trend Filter – Enable or disable the requirement for a bullish UTT before dip signals are generated.
• Strength & Meter – Toggle bar coloring based on the strength score, adjust the number of meter cells (default 60), and select meter position (e.g., bottom-center).
• Entry Settings – Control entry line visibility, length, and price source (Low, Close, or dip percentage).
Trading Applications
The CTM supports multiple trading strategies, each leveraging its outputs for specific market conditions:
• Trend-Ride Mode – Trade in the direction of the signal spine. Enter long positions on the first "𝕃" marker in a green (bullish) regime, and scale out when the UTT returns to grey (neutral). This is ideal for trend-following traders seeking to capture sustained moves, with the first signal in a new trend regime offering high statistical expectancy.
• Forced Dip Entries – Enable the trend filter and focus on dip signals (green arrows). Place limit orders at the entry line, set stops below the line, and target the midpoint of the prior value area (e.g., using support/resistance levels). This suits mean-reversion traders aiming to buy dips in bullish trends, with clear risk management via entry lines.
• Scalp Confirmation – Hide the signal spine and use bar coloring to identify short-term momentum. Green bars indicate broad buying pressure, while red bars warn against long scalps in oversold conditions. This is useful for intraday scalpers seeking confirmation of momentum before entering trades.
• Event Guardrails – Avoid trading when the heat meter is below -40 before major economic releases (e.g., FOMC, CPI), as spreads and slippage may widen. This enhances risk management by flagging high-risk periods during macroeconomic events.
• Multi-Timeframe Analysis – Apply the CTM on a daily timeframe in a secondary pane and a lower timeframe (e.g., hourly) on the primary chart. Trade only when both timeframes align (e.g., both in bullish regimes). This increases conviction for swing or position traders by confirming trend alignment across timeframes.
Frequently Asked Questions
• How does the CTM differ from a moving-average ribbon? The CTM integrates multiple momentum, volatility, and statistical indicators, using adaptive thresholds and proprietary calculations to respond faster to structural changes while filtering noise more effectively than traditional dual-EMA systems.
• Can the underlying formulas be accessed? No, the script is closed-source, and calculations are protected to preserve intellectual property. Users receive all outputs, alerts, and customizable parameters.
• Does the indicator repaint? No, all calculations use confirmed historical data without look-ahead bias. Entry lines are static from the signal bar.
• Which markets is it suitable for? The CTM is optimized for equities, futures, and cryptocurrencies. Adjust dip percentage and volume multipliers for low-liquidity markets.
• What about latency? The script uses efficient Pine Script functions and lightweight loops, ensuring minimal performance impact.
Limitations and Best Practices
• Market-Specific Tuning – Thinly traded markets may require adjustments to dip percentage and volume thresholds to avoid excessive signals.
• Complementary Tools – Combine the CTM with price action, support/resistance levels, or order flow analysis to confirm signals and avoid over-reliance on the indicator.
• Event Risk – Be cautious during high-impact news events, as volatility spikes may trigger signals that are quickly reversed.
• Trend Filter Use – Enabling the trend filter reduces false dip signals in bearish markets but may delay entries in rapidly reversing markets.
Conclusion
The Composite Trend Trader Module consolidates trend-following, dip-buying, and strength assessment into a single, customizable indicator. By providing clear visual cues, actionable alerts, and flexible settings, it equips traders with a robust framework for navigating various market conditions. While the proprietary calculations remain protected, the CTM’s outputs enable traders to make informed decisions, align strategies with market regimes, and manage risk effectively. Use it as a strategic tool alongside sound risk management and complementary analysis for optimal results.

BERLIN-MAX 1V.5BERLIN-MAX 1V.5 is a comprehensive trading indicator designed for TradingView that combines multiple advanced strategies and tools. It integrates EMA crossover signals, UT Bot logic with ATR-based trailing stops, customizable stop-loss and target multipliers per timeframe, Hull Moving Averages with color-coded trends, linear regression channels for support and resistance, and a multi-timeframe RSI and volume signal table. This script aims to provide clear entry and exit signals for scalping and swing trading, enhancing decision-making across different market conditions.

No-Wick Extreme Bot – Tops & BottomsNo-Wick ExtremBot – Tops & Bottoms
A high-precision reversal detector for true market extremes.
No-Wick ExtremBot is designed to catch highly accurate market turning points by combining strict candle structure logic with RSI exhaustion levels and ATR-based retest validation.
Unlike conventional indicators that flood your chart with noise, this tool focuses on one thing: spotting clean, no-wick reversal setups where price shows clear momentum exhaustion and is ready to reverse.
🧠 How it works:
No-Wick Candle Detection
• Bullish signal: candle closes above open, with almost no lower wick
• Bearish signal: candle closes below open, with almost no upper wick
• Wick sensitivity is adjustable via “Wick-Tolerance (%)”
RSI Confirmation
• Long signals require RSI below your defined “BUY level”
• Short signals require RSI above your defined “SELL level”
Retest Validation
• After a no-wick setup is detected, price must retest that exact wick level
• This filters out weak impulses and confirms true exhaustion zones
Final Signal = No-Wick + RSI Extreme + Retest
• When all 3 conditions align → a BUY or SELL label appears
• ATR is used to space the signal label from price for better visibility
⚙️ Custom Settings:
• Wick Tolerance (%)
• RSI Length & Thresholds
• ATR Length for spacing
✅ Key Benefits:
• Detects market tops and bottoms with minimal lag
• Eliminates noise – shows only high-quality reversals
• Works across all timeframes and markets
• Visual, easy-to-read signals directly on the chart
• Highly effective for scalping, swing entries, and liquidity traps

Zone Shift [ChartPrime]⯁ OVERVIEW
Zone Shift is a dynamic trend detection tool that uses EMA/HMA-based bands to determine trend shifts and plot key reaction levels. It highlights trend direction through colored candles and marks important retests with visual cues to help traders stay aligned with momentum.
⯁ KEY FEATURES
Dynamic EMA-HMA Band:
Creates a three-line channel using the average of an EMA and HMA for the midline, and expands it using average candle range to form upper and lower bounds. This band visually adapts to market volatility.
float ema = ta.ema(close, length)
float hma = ta.hma(close, length-40)
float dist = ta.sma(high-low, 200)
float mid = math.avg(ema, hma)
float top = mid + dist
float bot = mid - dist
Trend Detection (Band Cross Logic):
Detects an uptrend when the Low crosses above the top band.
Detects a downtrend when the High crosses below the bottom band.
Bars change color to lime for uptrends and blue for downtrends.
Trend Initiation Level:
At the start of a new trend, the indicator locks in the extreme point (low for uptrend, high for downtrend) and plots a dashed horizontal level, serving as a potential retest zone.
Trend Retest Signal:
If price crosses back over the Trend Initiation level in the direction of the trend, a diamond label (⯁) is plotted at the retest point — confirming that price is revisiting a key shift level.
Visual Band Layout:
Midline: Dashed line shows the average of EMA and HMA.
Top/Bottom: Solid lines showing dynamic thresholds above/below the midline.
These help visualize compression, expansion, and possible breakout zones.
Color-Based Candle Plotting:
Candles are recolored in real time according to the current trend, allowing instant visual alignment with the market’s directional bias.
Noise-Filtered Retests:
To avoid repetitive signals, retests are only marked if they occur more than 5 bars after the previous one — filtering out minor fluctuations.
⯁ USAGE
Use colored candles to align trades with the dominant trend.
Treat dashed trendStart levels as important support/resistance zones.
Watch for ⯁ diamond labels as confirmation of retests for continuation or entry.
Use band boundaries to assess trend strength and volatility expansion.
Combine with your existing setups to validate momentum and zone shifts.
⯁ CONCLUSION
Zone Shift helps traders visually capture trend changes and key reaction points with precision. By combining band breakouts with real-time retest signals and trend-colored candles, this tool simplifies the process of reading market structure shifts and identifying high-confluence entry areas.

EMA 8/21 Crossover Alert IndicatorOverview of the Indicator
This is a custom Pine Script v5 indicator for TradingView titled "EMA 8/21/50 + VWAP Crossover Alert Indicator" (short title: "EMA+VWAP Cross Alert"). It's designed as an overlay indicator, meaning it plots directly on your price chart rather than in a separate pane. The primary purpose is to detect and alert on crossovers between the 8-period Exponential Moving Average (EMA) and the 21-period EMA, which can signal potential bullish or bearish momentum shifts. These are classic short-term trend reversal or continuation signals often used in trading strategies like momentum or swing trading.
To enhance analysis, it also includes:
A 50-period EMA for medium-term trend context (e.g., to confirm if the overall trend aligns with the crossover).
A Volume Weighted Average Price (VWAP) line, which provides a benchmark for the average price weighted by volume, useful for identifying intraday value areas or fair price levels.
The indicator works across all timeframes (e.g., Daily, 4H, 1H, 15M, 5M, 3M) because the calculations are based on the chart's current bars and adapt to volatility and data resolution. It's not a trading strategy (no entry/exit logic or backtesting), but an alert tool—signals are visual and can trigger notifications in TradingView. Always combine it with risk management, as crossovers can produce false signals in ranging or choppy markets.
How It Behaves Across Timeframes
Higher Timeframes (e.g., Daily/4H): Fewer crossovers, focusing on major trends. EMAs smooth out noise; VWAP might represent session averages.
Lower Timeframes (e.g., 3M/5M): More frequent signals due to sensitivity, but higher risk of whipsaws. VWAP resets per session, making it great for intraday trading.
Adaptability: All components scale with bar data—no manual adjustments needed, though tweaking inputs can optimize for specific frames.
In TradingView, you can set up these alerts to notify via popup, sound, email, SMS, or webhook (e.g., to a trading bot). Go to the chart's "Alert" button, select this indicator, and choose conditions like "Bullish Cross" or use the script's built-in alerts.

BB with Heikin Ashi + Reversal CheckThis indicator combines Bollinger Bands (BB) with Heikin Ashi candles to detect potential reversal points after price breaks the BB boundaries. It works on any symbol and timeframe, retrieving Heikin Ashi data via request.security().
Core Features
Heikin Ashi Candle Plot
Smooths price action by using Heikin Ashi candles instead of regular candles.
Candles are plotted directly on the chart with green (bullish) and red (bearish) colors.
Bollinger Bands (BB)
Calculated from Heikin Ashi close price.
Includes Basis (MA), Upper Band, and Lower Band, with customizable MA type, length, and standard deviation multiplier.
Break & Reversal Detection
The indicator tracks whether the price has broken above the Upper Band (p1) or below the Lower Band (p2).
It remembers the last breakout direction until the opposite breakout occurs (mutually exclusive logic).
Signal Logic
Long Signal (▲):
Price was previously below the Lower Band and then reversed upward (BB Lower rising + Heikin Ashi candle rising).
Short Signal (▼):
Price was previously above the Upper Band and then reversed downward (BB Upper falling + Heikin Ashi candle falling).
Alerts
Custom alert conditions trigger when Long or Short signals occur, allowing automated notifications or bot integration.
Use Cases
✅ Swing Trading / Trend Reversal – Identify potential bottom/top reversals after BB breakouts.
✅ Mean Reversion Strategies – Enter trades when the price reverts to the BB mean after an extreme breakout.
✅ Multi-Timeframe Analysis – Works with any timeframe and symbol via request.security().
Customization
MA Type: SMA, EMA, RMA, WMA, VWMA
BB Length & StdDev Multiplier
Timeframe & Symbol Selection

🟡🔵🟢🔴Beginner's Assistant by carljchapman🟡🔵🟢🔴
Overview
This indicator dynamically marks highs and lows of the premarket (4:00am-9:30amEST) and opening range. It displays Fair Value Gaps, 9 and 21 period Exponential Moving Averages (EMA) and the Volume Weighted Average Price (VWAP). To really help beginners, it marks suggested entry points on the chart with green or red triangles, when a reasonable trend appears.
Features
Automatically draws blue lines for Premarket High and Low values
Dynamically marks the opening Range region
Visual entry signals for long and short opportunities
Primarily used for stocks/funds , but works with forex and crypto
Quick configuration settings to tailor details for your experience level
Mobile friendly mode
Supports alerts
How To Use
Open your chart, and select a 1 or 2 minute timeframe.
Watch for green triangles and red triangles, hinting at entries for long or short positions. Pay particular attention to the price action as it approaches the bounds of the opening range and the premarket levels. I suggest also using a MACD indicator for confirmation of the trend.
For scalping 0dte Options, switch frequently between the 1 ,2 and 5 minute or higher timeframes. Do this so you will not miss an entry opportunity or be unaware of the overall trend.
As a beginner, until you have refined your strategy and develop risk management, take profits as low as 10%. A small profit can quickly become a much larger loss. With 0dte options, time will devour your profits even when the price doesn’t budge.
What makes this indicator so beginner friendly?
Charts with too many lines and colors are are a nightmare for beginners! And empty charts do not tell the whole story. Simple checkboxes in the configuration settings let you turn on and off features to match your comfort level. As you become more familiar you might try turning off the suggested entries to see if you would have selected the same or better ones yourself. Just one example of how you will learn and verify your knowledge. You will quickly spot Opening Range Breakouts and more.
Why are the triangle pointers not simply above or below the bars?
As a beginner, I like to review charts to see how much the price changed, then estimate how much a contract would move based on its delta. A mouthful, I know. But what price does an arrow pointing up below a bar reflect? Would I have entered at the open or close, low or high? This indicator helps by putting the marker close to the price when indicated. It can even display the actual price on the bar. This is helpful for you to make fast calculations without a measuring tool.
I am an experienced trader. Can this help me make winning trades?
Sure. It can also help you make losing ones! Profit is not guaranteed with any indicator or strategy. This indicator is designed to assist you as you learn and while you trade. You won't see the words BUY or SELL. This is not a signal bot! It is merely a tool to assist you. You can learn a lot by spending time observing price movement using this indicator without ever making a single trade.
🟡🔵🟢🔴
