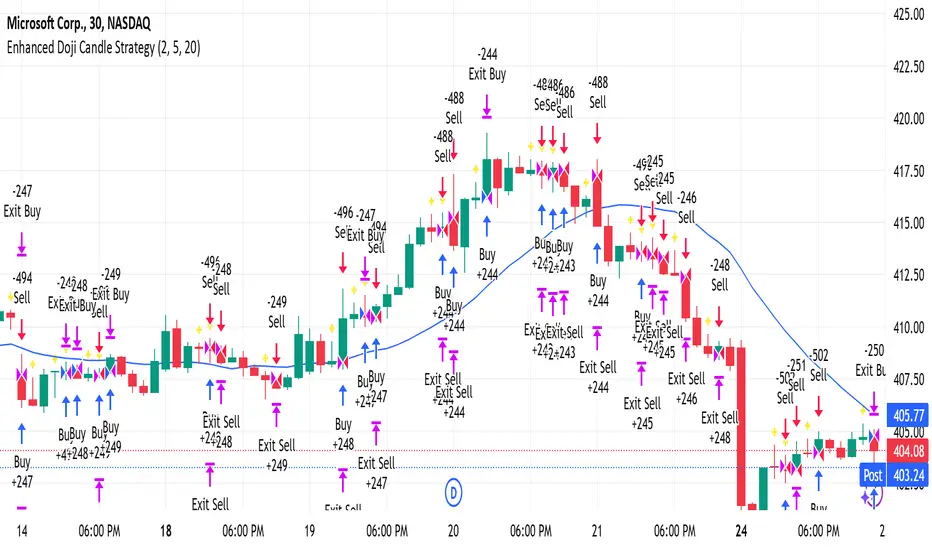
Enhanced Doji Candle StrategyYour trading strategy is a Doji Candlestick Reversal Strategy designed to identify potential market reversals using Doji candlestick patterns. These candles indicate indecision in the market, and when detected, your strategy uses a Simple Moving Average (SMA) with a short period of 20 to confirm the overall market trend. If the price is above the SMA, the trend is considered bullish; if it's below, the trend is bearish.
Once a Doji is detected, the strategy waits for one or two consecutive confirmation candles that align with the market trend. For a bullish confirmation, the candles must close higher than their opening price without significant bottom wicks. Conversely, for a bearish confirmation, the candles must close lower without noticeable top wicks. When these conditions are met, a trade is entered at the market price.
The risk management aspect of your strategy is clearly defined. A stop loss is automatically placed at the nearest recent swing high or low, with a tighter distance of 5 pips to allow for more trading opportunities. A take-profit level is set using a 2:1 reward-to-risk ratio, meaning the potential reward is twice the size of the risk on each trade.
Additionally, the strategy incorporates an early exit mechanism. If a reversal Doji forms in the opposite direction of your trade, the position is closed immediately to minimize losses. This strategy has been optimized to increase trade frequency by loosening the strictness of Doji detection and confirmation conditions while still maintaining sound risk management principles.
The strategy is coded in Pine Script for use on TradingView and uses built-in indicators like the SMA for trend detection. You also have flexible parameters to adjust risk levels, take-profit targets, and stop-loss placements, allowing you to tailor the strategy to different market conditions.
"candle"に関するスクリプトを検索
EMA Crossover Strategy with Take Profit and Candle HighlightingStrategy Overview:
This strategy is based on the Exponential Moving Averages (EMA), specifically the EMA 20 and EMA 50. It takes advantage of EMA crossovers to identify potential trend reversals and uses multiple take-profit levels and a stop-loss for risk management.
Key Components:
EMA Crossover Signals:
Buy Signal (Uptrend): A buy signal is generated when the EMA 20 crosses above the EMA 50, signaling the start of a potential uptrend.
Sell Signal (Downtrend): A sell signal is generated when the EMA 20 crosses below the EMA 50, signaling the start of a potential downtrend.
Take Profit Levels:
Once a buy or sell signal is triggered, the strategy calculates multiple take-profit levels based on the range of the previous candle. The user can define multipliers for each take-profit level.
Take Profit 1 (TP1): 50% of the previous candle's range above or below the entry price.
Take Profit 2 (TP2): 100% of the previous candle's range above or below the entry price.
Take Profit 3 (TP3): 150% of the previous candle's range above or below the entry price.
Take Profit 4 (TP4): 200% of the previous candle's range above or below the entry price.
These levels are adjusted dynamically based on the previous candle's high and low, so they adapt to changing market conditions.
Stop Loss:
A stop-loss is set to manage risk. The default stop-loss is 3% from the entry price, but this can be adjusted in the settings. The stop-loss is triggered if the price moves against the position by this amount.
Trend Direction Highlighting:
The strategy highlights the bars (candles) with colors:
Green bars indicate an uptrend (when EMA 20 crosses above EMA 50).
Red bars indicate a downtrend (when EMA 20 crosses below EMA 50).
These visual cues help users easily identify the market direction.
Strategy Entries and Exits:
Entries: The strategy enters a long (buy) position when the EMA 20 crosses above the EMA 50 and a short (sell) position when the EMA 20 crosses below the EMA 50.
Exits: The strategy exits the positions at any of the defined take-profit levels or the stop-loss. Multiple exit levels provide opportunities to take profit progressively as the price moves in the favorable direction.
Entry and Exit Conditions in Detail:
Buy Entry Condition (Uptrend):
A buy position is opened when EMA 20 crosses above EMA 50, signaling the start of an uptrend.
The strategy calculates take-profit levels above the entry price based on the previous bar's range (high-low) and the multipliers for TP1, TP2, TP3, and TP4.
Sell Entry Condition (Downtrend):
A sell position is opened when EMA 20 crosses below EMA 50, signaling the start of a downtrend.
The strategy calculates take-profit levels below the entry price, similarly based on the previous bar's range.
Exit Conditions:
Take Profit: The strategy attempts to exit the position at one of the take-profit levels (TP1, TP2, TP3, or TP4). If the price reaches any of these levels, the position is closed.
Stop Loss: The strategy also has a stop-loss set at a default value (3% below the entry for long trades, and 3% above for short trades). The stop-loss helps to protect the position from significant losses.
Backtesting and Performance Metrics:
The strategy can be backtested using TradingView's Strategy Tester. The results will show how the strategy would have performed historically, including key metrics like:
Net Profit
Max Drawdown
Win Rate
Profit Factor
Average Trade Duration
These performance metrics can help users assess the strategy's effectiveness over historical periods and optimize the input parameters (e.g., multipliers, stop-loss level).
Customization:
The strategy allows for the adjustment of several key input values via the settings panel:
Take Profit Multipliers: Users can customize the multipliers for each take-profit level (TP1, TP2, TP3, TP4).
Stop Loss Percentage: The user can also adjust the stop-loss percentage to a custom value.
EMA Periods: The default periods for the EMA 50 and EMA 20 are fixed, but they can be adjusted for different market conditions.
Pros of the Strategy:
EMA Crossover Strategy: A classic and well-known strategy used by traders to identify the start of new trends.
Multiple Take Profit Levels: By taking profits progressively at different levels, the strategy locks in gains as the price moves in favor of the position.
Clear Trend Identification: The use of green and red bars makes it visually easier to follow the market's direction.
Risk Management: The stop-loss and take-profit features help to manage risk and optimize profit-taking.
Cons of the Strategy:
Lagging Indicators: The strategy relies on EMAs, which are lagging indicators. This means that the strategy might enter trades after the trend has already started, leading to missed opportunities or less-than-ideal entry prices.
No Confirmation Indicators: The strategy purely depends on the crossover of two EMAs and does not use other confirming indicators (e.g., RSI, MACD), which might lead to false signals in volatile markets.
How to Use in Real-Time Trading:
Use for Backtesting: Initially, use this strategy in backtest mode to understand how it would have performed historically with your preferred settings.
Paper Trading: Once comfortable, you can use paper trading to test the strategy in real-time market conditions without risking real money.
Live Trading: After testing and optimizing the strategy, you can consider using it for live trading with proper risk management in place (e.g., starting with a small position size and adjusting parameters as needed).
Summary:
This strategy is designed to identify trend reversals using EMA crossovers, with customizable take-profit levels and a stop-loss to manage risk. It's well-suited for traders looking for a systematic way to enter and exit trades based on clear market signals, while also providing flexibility to adjust for different risk profiles and trading styles.

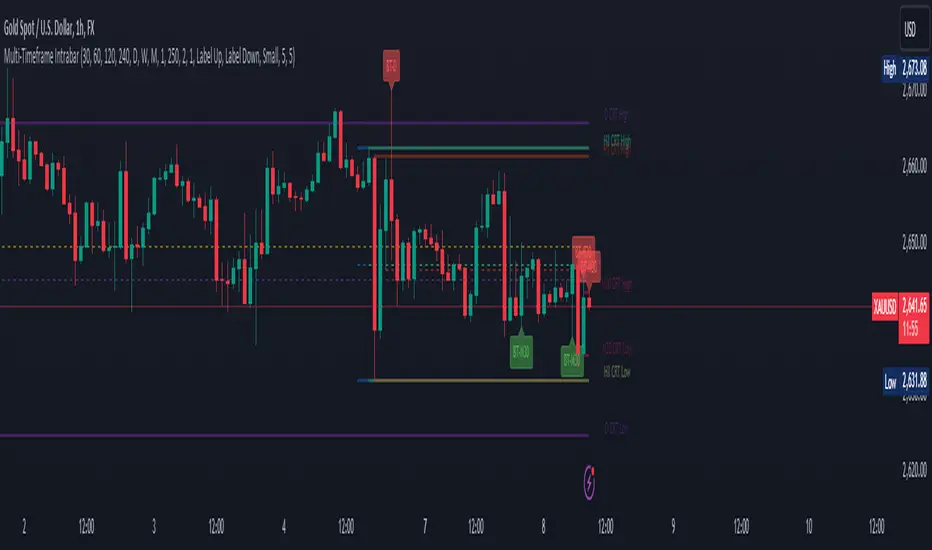
CRT candles Multi-Timeframe Intrabar(open Source ) # CRT candles Multi-Timeframe Intrabar Indicator( open source )
This advanced indicator visualizes Candle Range Theory (CRT) across multiple timeframes, providing traders with a comprehensive view of market structure and potential high-probability setups.
## Key Features:
- Supports 7 timeframes: 30 minutes, 1 hour, 2 hours, 4 hours, daily, weekly, and monthly
- Customizable color schemes for each timeframe
- Options to display mid-level (50%) lines for each range
- Bullish and bearish touch detection with customizable label display
- End-of-line labels for easy identification of CRT levels
- Flexible alert system for touch detections on each timeframe
- Adjustable minimum and maximum bar count for range validity
- Options for wick touch and body touch detection
## How It Works:
The indicator plots CRT ranges for each selected timeframe, identifying potential accumulation, manipulation, and distribution phases. It detects when price touches these levels, providing visual cues and optional alerts for potential trade setups.
snapshot
## Customization:
Users can fine-tune the indicator's appearance and functionality through various input options, including:
- Toggling timeframes on/off
snapshot
- Adjusting colors for range lines and mid-levels
- Controlling label display and count
- Setting alert preferences
- Adjusting line widths and label offsets
## Usage:
This indicator is designed for traders familiar with Candle Range Theory and multi-timeframe analysis. It can be used to identify potential entry and exit points, confirm trends, and spot potential reversals across different timeframes.
## Note:
This indicator is for educational and informational purposes only. Always combine with other forms of analysis and proper risk management when making trading decisions.
## Credits:
Inspired by Romeo's Candle Range Theory and developed to provide a comprehensive multi-timeframe analysis tool.
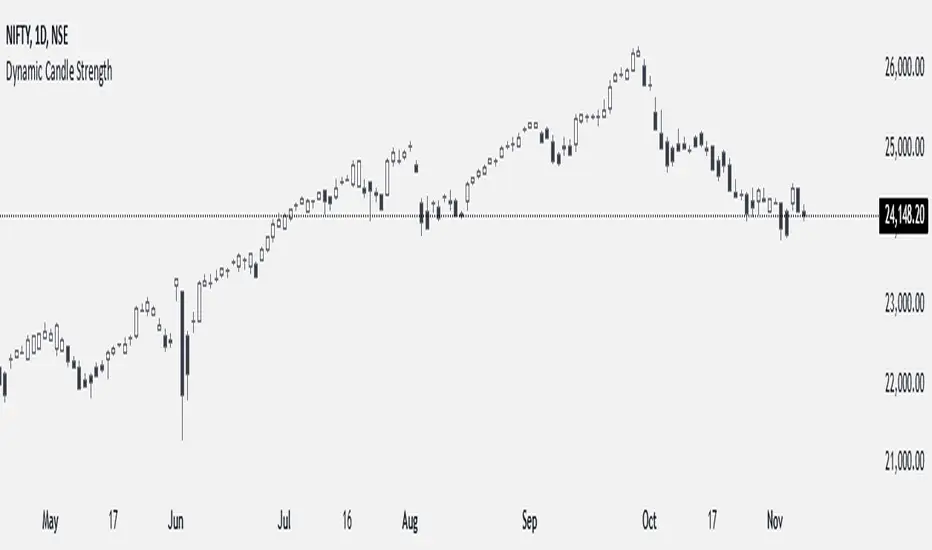
Dynamic Candle StrengthHow It Works
Initialization of Dynamic Levels:
The first candle's high and low are taken as the initial dynamic high and dynamic low levels.
If the next candle's close price is above the dynamic high, the candle is colored green, indicating bullish conditions.
If the next candle's close price is below the dynamic low, the candle is colored black, indicating bearish conditions.
If a candle's high and low crossed both the dynamic high and dynamic low, the dynamic high and low levels are updated to the high and low of that candle, but the candle color will continue with the same color as the previous candle.
Maintaining and Updating Dynamic Levels:
The dynamic high and low are only updated if a candle's close is above the current dynamic high or below the current dynamic low.
If the candle does not close above or below these levels, the dynamic high and low remain unchanged.
Visual Signals:
Green Bars: Indicate that the candle's close is above the dynamic high, suggesting bullish conditions.
Black Bars: Indicate that the candle's close is below the dynamic low, suggesting bearish conditions.
This method ensures that the dynamic high and low levels are adjusted in real-time based on the most recent significant price movements, providing a reliable measure of market sentiment.
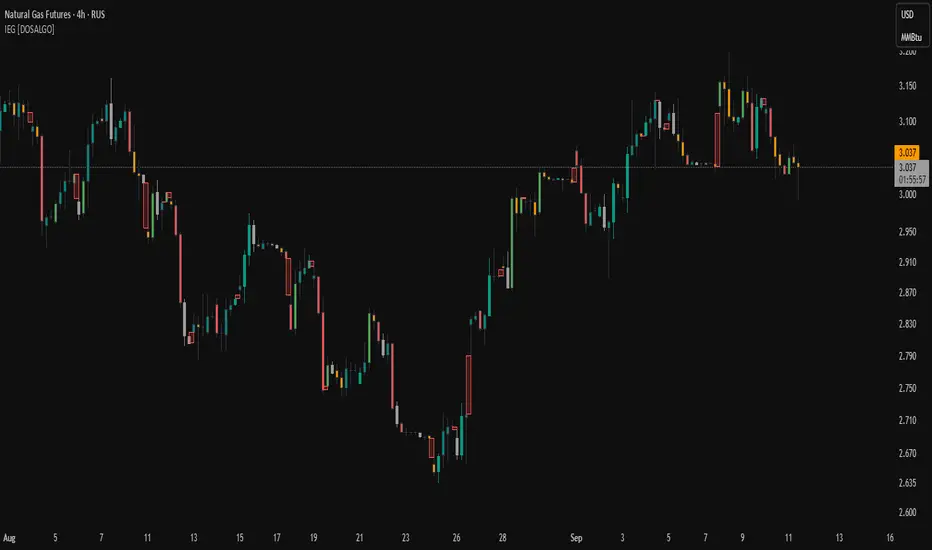
Indecisive and Explosive CandlesThe Explosive & Base Candle with Gaps Identifier is an indicator designed to enhance your market analysis by identifying critical candle types and gaps in price action. This tool aids traders in pinpointing zones of significant buyer-seller interaction and potential institutional activity, providing valuable insights for strategic trading decisions.
Main Features:
Base Candle Identification: This feature detects Base candles, also known as indecisive candles, within the price action. A Base candle is characterized by a body (the difference between the close and open prices) that is less than or equal to 50% of its total range (the difference between the high and low prices). These candles mark zones where buyers and sellers are evenly matched, highlighting areas of potential support and resistance.
Explosive Candle Identification: The indicator identifies Explosive candles, which are indicative of strong market moves often driven by institutional activity. An Explosive candle is defined by a body that is greater than 70% of its total range. Recognizing these candles helps traders spot significant momentum and potential breakout points.
Supply and Demand Zone Identification: Both Base and Explosive candles are essential for identifying supply and demand zones within the price action. These zones are crucial for traders to place their trades based on the likelihood of price reversals or continuations.
Gap Detection: The indicator also detects gaps, defined as the difference between the close price of one candle and the open price of the next. Gaps are significant because prices often return to these levels to "fill the gap," providing opportunities for traders to predict price movements and place strategic trades.
Visual Markings and Alerts: The indicator visually marks Base and Explosive candles as well as gaps directly on the chart, making them easily identifiable at a glance. Traders can also set customizable alerts to notify them when these key candle types and gaps appear, ensuring they never miss an important trading opportunity.
Customizable Settings: Tailor the indicator’s settings to match your trading style and preferences. Adjust the criteria for Base and Explosive candles, as well as how gaps are detected and displayed, to suit your specific analysis needs.
How to Use:
Add the Indicator: Apply the Explosive & Base Candle with Gaps Identifier to your TradingView chart.
Analyze Identified Zones: Observe the marked Base and Explosive candles and gaps to identify key areas of support, resistance, and potential price reversals or continuations.
Set Alerts: Customize and set alerts for the detection of Base candles, Explosive candles, and gaps to stay informed of critical market movements in real-time.
Integrate with Your Strategy: Use the insights provided by the indicator to enhance your existing trading strategy, improving your entry and exit points based on the identified supply and demand zones.
The Explosive & Base Candle with Gaps Identifier is an invaluable tool for traders aiming to refine their market analysis and make more informed trading decisions. By identifying critical areas of price action, this indicator supports traders in navigating the complexities of the financial markets with greater precision and confidence.
FVG Breakaway/3rd Candle (Arjo) [MK]Simple script to identify FVGs (Fair Value Gaps) on the current chart timeframe. The script differs from other FVG indicators on the Tradingview platform by using Arjos 3rd candle rule to identify which gaps are 'Breakway Gaps' and which Gaps are likely to be returned to.
NOTE: As with all 'trading rules' this theory is not 100% accurate.
default settings:
Breakaway Gaps = YELLOW
Gaps that price may return to = GREEN
Mitigated Gaps = 100% TRANSPARENT
What is a FVG:
A FVG is a price area defined by a 3 candle pattern. For a bullish FVG, the low of the 3rd candle must be higher than the high of the 1st candle. This then leaves an area that is drawn as in the example below:
A bearish FVG is defined by the high of the 3rd candle being lower than the low of the 1st candle, as shown in the example below:
FVGs can act like magnets where price will either retrace to or reach for, therefore they can be used as entry points and also for take profit target levels.
If for example, a trader would like to use an FVG for an entry, it would be useful to know which FVGs are more likely for price to re-enter and which FVG will be left un-touched. FVGs that are likely to be left un-touched by price are called 'Breakaway Gaps'.
How do we define a 'Breakaway Gap':
First we identify FVGs using the rules stated above, then we look to see where the 3rd candle closed in relation to the 2nd candle. For a bullish 'Breakaway Gap' we want to see the 3rd candle close above the high of the 2nd candle. An example of a bullish Breakaway Gap is shown in the example below:
A bearish 'Breakaway Gap' is defined by the close of the 3rd candle being lower than the low of the 2nd candle. An example is shown below:
How do we define an FVG that price may return to:
Any gap that does not meet the above rules for a 'Breakway Gap' is therefore considered an FVG that price may return to. So for a bullish FVG that price may return to we would look to see if the close of the 3rd candle is above the high of the 2nd candle. If it is not above the high of the 2nd candle then it more likely that price will retrace into the FVG before continuing higher. An example is shown below:
A bearish gap that price may return to is defined by the close of the 3rd candle not being lower than the low of the 2nd candle. An example is shown below:
The indicator is based on the teachings of 'Arjo'. Note: breakaway gaps will only remain 'breakaway' until a liquidity level is reached. Breakaways therefore do not remain 'breakaway' forever. Users of the indicators must fully comprehend this theory before using the indicator with live markets.
Users of the script should be fully aware of this concept and also have conducted thorough backtesting using a large data set before using this indicator with live accounts.

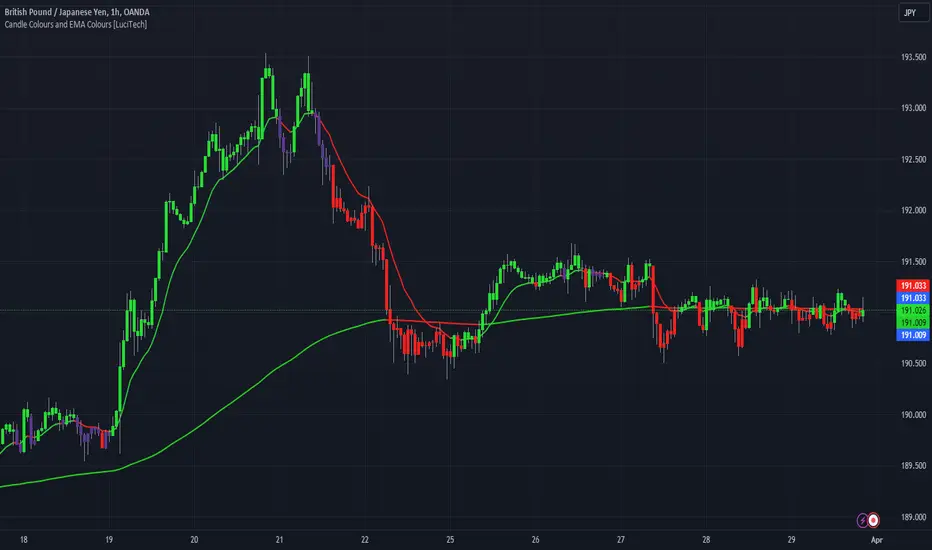
Candle Colours and EMA Colours [LuciTech]this indicator assigns a colour to each candle based on the relationship between the price and the EMAs, The indicator first checks whether the close price is above or below the first EMA, If the close price is above the first EMA the candle is coloured green. If the close price inbetween both EMAs the candle is colored gray. If the close price is below the second EMA, the candle is coloured red.
the indicator also colours the EMAs based on the closed price, if closed price is above the EMAs its coloured green and if price is closed below the EMA is coloured red.
The colours of the candles and EMAs can be changed in "style" and the periods of the EMAs can be changed in inputs.
% Change CandleThis script creates a trading indicator that shows how much the price of a financial instrument (like a stock or currency) changes within each trading period, represented by candles on a chart. Each candle shows the range of prices from the highest to the lowest within a specific time frame.
The indicator calculates the percentage difference between the highest and lowest prices for each candle. If the closing price of the candle is higher than the opening price, suggesting that the price has gone up during that period, the indicator will display this percentage increase as a green line. Conversely, if the closing price is lower than the opening price, indicating a price decrease, it will display the percentage decrease as a red line.
In simple terms, this indicator provides a visual way to see how much and in which direction the price is moving during each trading period, with green lines showing periods of price increase and red lines showing periods of price decrease.

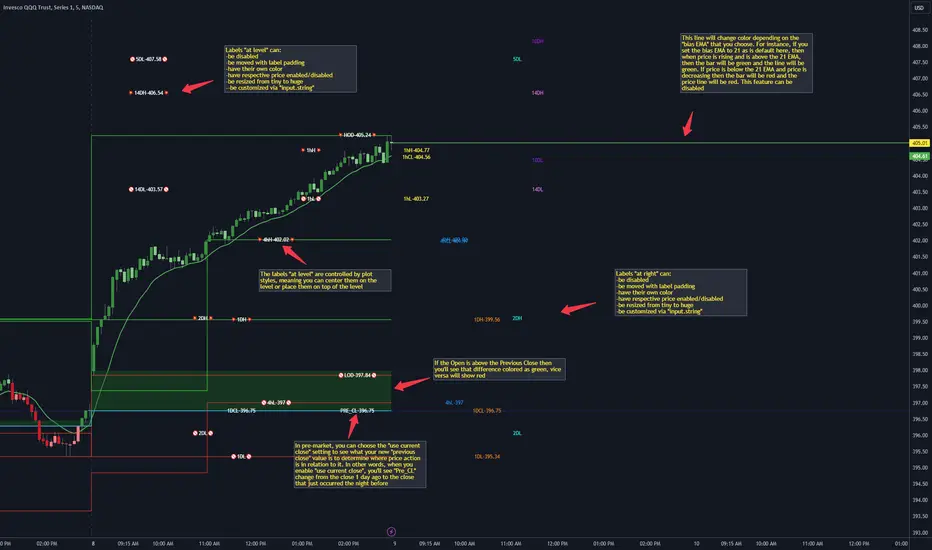
CANDLE LEVELS [PRO]This indicator provides you with 55 levels! with labels to help you identify quickly where current price is in relation to the OPEN, CLOSE, HIGH OF DAY and LOW OF DAY to a respective level. Choose from levels as low as the 5 minute time frame all the way up to 200 days. All of the levels except the day's OPEN, HIGH OF DAY AND LOW OF DAY use the PREVIOUS time frame's level. In other words, when you're looking at the "1 DAY HIGH", that's actually the previous day's HIGH OF DAY. Whether you're a scalper on the lower time frames or a swing trader that mainly uses the 1 hour and above, these candle levels can be an invaluable source of support and resistance; in other words you'll often see price bounce off of a level (whether price is increasing or decreasing) once or multiple times and that could be an indication of a price's direction. Another way that you could utilize this indicator is to use it in confluence with other popular signals, such as an EMA crossover. For instance, you could watch as price rises above the 21 EMA all the while price is also crossing up and over the previous day's HIGH OF DAY with a relative volume that's double that of the previous week's average. These are just a few of some potential bullish signals that you could look for to go long on a trade using the candle levels provided.
I've made this indicator extremely customizable:
⚡Each level has 2 labels: 1 "at level" and 1 "at right", each label and price can be disabled
⚡Each label has its own input for label padding. The "at right" label padding input allows you to zoom in and out of a chart without the labels moving along their respective axis
⚡Each label's text can be customized via an "input.string" code base
⚡Each level's label can be changed via a plot style setting to determine if the label is centered with it's respective level or rides along the top of it
⚡Significant figures input allows you to round price up or down
⚡A "bias EMA" tool that color codes the candles and price line to show you where price is in relation to the 21 EMA (or another value that you pick). As a result, this can be an effective visual to help reduce cognitive load
⚡A "fill level" where color is determined by price opening above or below the previous day's close
⚡A "use current close" setting that's great to use in pre-market as it shows you where price is in relation to the previous days' close
----------------------------------------------------------------------------------------------------------------------
🙏Thanks to (c)satymahajan for the inspiration behind the ATR "previous close" and "bias candle" code base
🙏Thanks to my mentor (c)SimpleCryptoLife for the libraries and extensive code to help create this indicator
Doji Candle _ ThaerAbusalahIdentify doji candles in heikin ashi .
the indicator will search for a doji candles that are same in upper and lower wick by 50% and more .

Extended Hour CandleThe Extended Hour Candle shows extended hour candle formations on the Daily chart. This indicator can be useful for those who want to analyse price movements during extended trading sessions without switching to intraday charts with "Extended trading hours" enabled.
How to Use:
Add the Extended Hour Candle indicator to a TradingView chart.
Adjust the color settings according to personal preferences, using the options to set the desired colors for up and down candles.
See the Candle during extended trading hours on the Daily chart

Boring Candles by BitcoinBailyBoring candlestick is a candlestick whose body is less than 50% of its total candlestick range, this candle is usually small in size.
This indicates that the price range between the open and close of this candle was relatively small, and that there was not a lot of volatility during that time period.

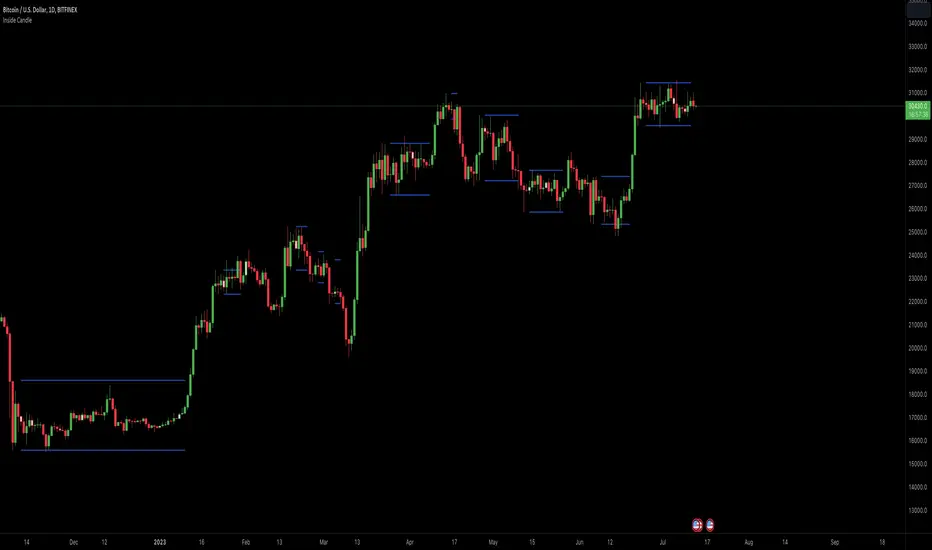
Inside Candle ViewerInside Candle Viewer
What it’s meant for:
- This indicator is used to identify inside candles that might generate an upcoming trading range
- Works best on large timeframe (Suggested from 2 days up to 1 week) and crypto asset (Index don't show much because of daily gaps)
How it works:
- It check for daily close (or the chosen timeframe), highlight inside candles and also plot trading range limits generated by inside pattern
- Trading range limits extend until candle closes are within those limits
- Usually the longer the trading range last, the stronger the following trend is when it break in any direction
Settings:
- Change color of inside bars and enable/disable from chart
- Change color of trading range and enable/disable from chart
Alerts:
- No alerts are defined at the moment
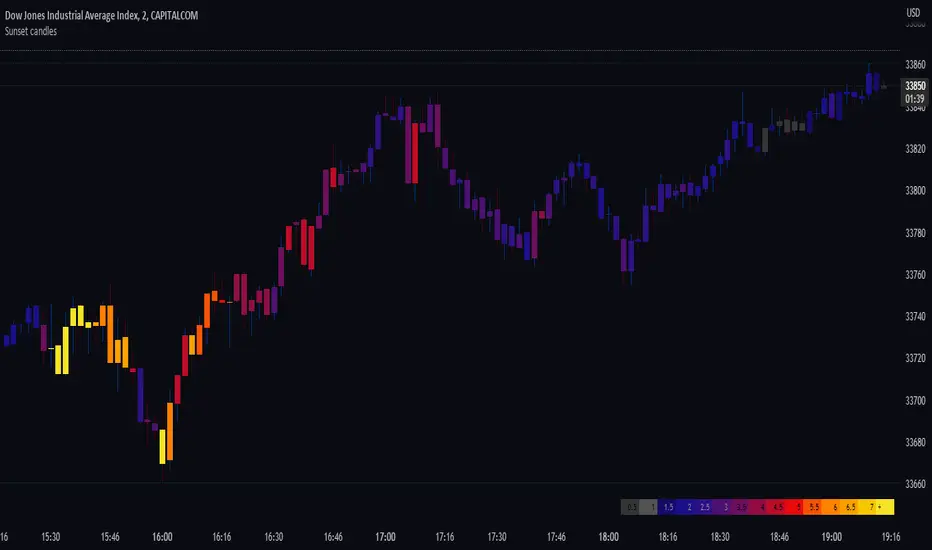
Sunset candlesDisplays the volume behind each candle with colors, to visualise their evolution over time, directly in the chart.
This indicator is best suited for dark mode (Suggested background color: #0a0c12).
The more intense is the color, the bigger is the volume.
The unit is a 400 periods moving average of the volume, considered as 1 volume.
Each color represents half of this volume. For ex: Grays indicate under (or equal) to the 400 MA (low volumes). Bright yellow represents above 7 times the 400 MA (very high volumes).
When there's no available volume datas, the candles turn bright green by default.
The wicks' colors stay the same, and can still indicate the direction of the candle.
In the settings, you can show/hide the gradient of the volume. By moving your chart over this gradient, it is possible to compare the candles to the colors, and read the corresponding volume number.
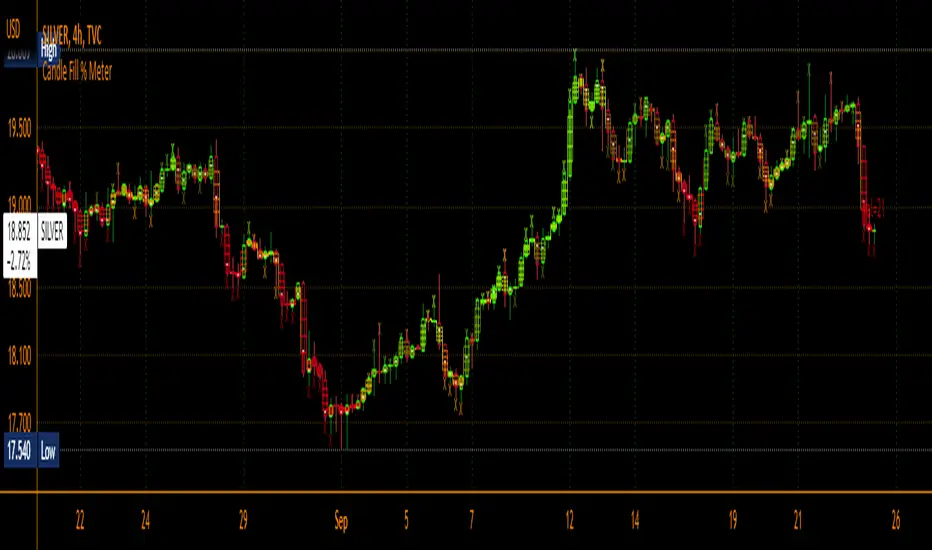
Candle Fill % MeterFor use with Hollow Candles
Fills Candles based on either the value of the RSI or coppock scaled to fit properly between the open and close. Makes for a compact visual with lot's of information given. Toggle bells and whistles in settings such as arrows to indicate the direction of the value being measured, dividing levels, fill from candle open all the time instead of the bottom up and more.
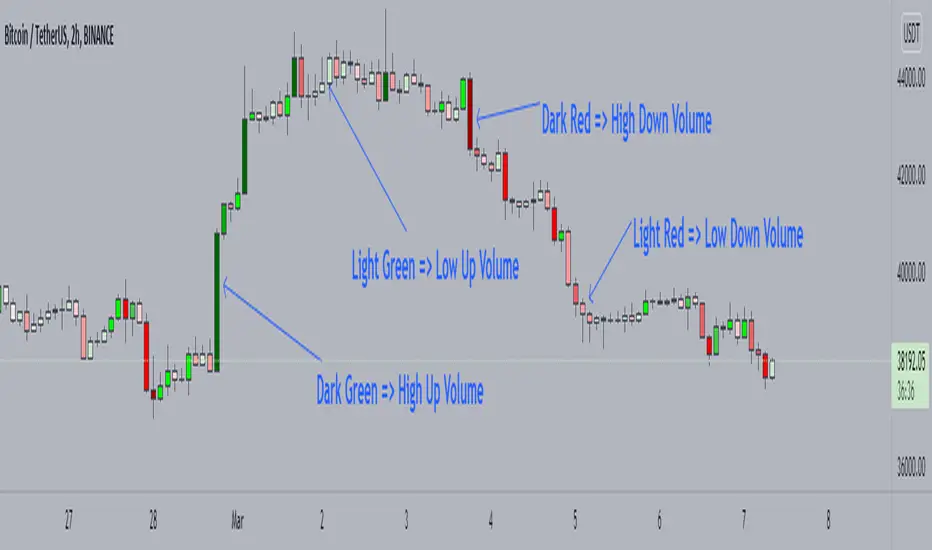
Candle Color by VolumeA simple but effective indicator that paints candles with different shades of colors based on the volume transacted.
-> Supports 6 levels of sensitivity at present. Might enhance the granularity later.
-> Darkest indicates the most volume transacted. Lightest, the least. Change it around however you see fit and based on your theme.
-> Use it for your Volume Spread Analysis and/or in conjunction with any other strategies that you employ.
-> Note that the volume ratio is calculated relative to the average volume of the last n candles ( EMA 20 by default).
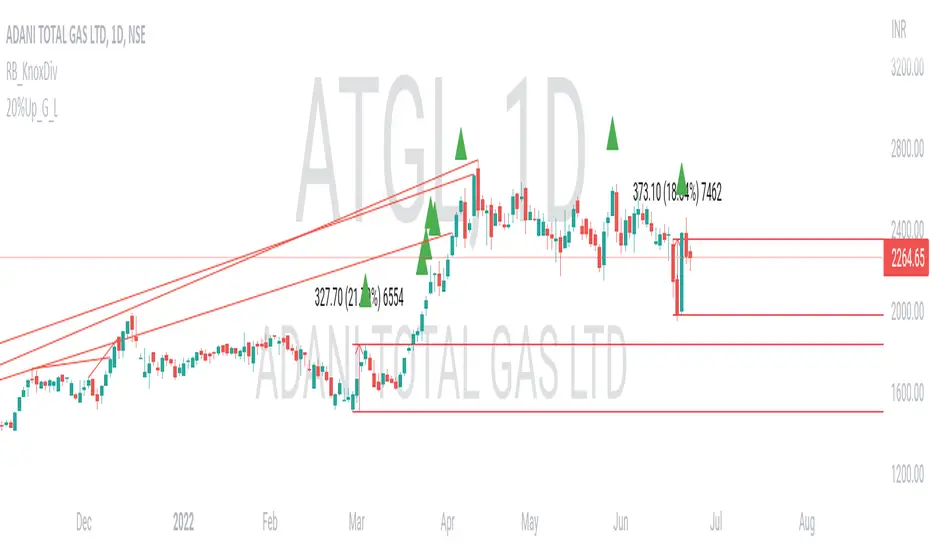
20% up with all continuously green candle: Lovevanshi It can be used to get the indication for 20% up movement among all continuously green candles formed in past. It is suitable for Indian company stock for short term trading plans.
[LixxChartz] Engulfing Candle Auto FinderProbably the most complicated script you have seen...
The Engulfing Candle Script that ACCTUALLY finds the engulfing candles.
This indicator is a part of my new script I am creating and I will be realising soon. Hope it helps.
I really don't understand why other people were making it so complicate LOL

Swing Highs/Lows & Candle Patterns [LuxAlgo]This script labels swing highs and swing lows as well as the candle pattern that occurred at that precise point. The script can detect the following 6 candle patterns: hammer, inverse hammer, bullish engulfing, hanging man, shooting star, and bearish engulfing.
This indicator by its very nature backpaints by default, meaning that the displayed components are offset in the past.
🔶 USAGE
It can be interesting to see if a top or bottom is associated with a specific candle pattern, this allows us to study the potential of such a pattern to indicate a reversal. You can hover on a label with a specific pattern to see more details about it.
The notations HH, HL, LH, and LL you can see on the labels are defined as follows:
HH : Higher high
HL : Higher low
LH : Lower high
LL : Lower low
🔶 SETTING
Length: Sensitivity of the swing high/low detection, with lower values returning the maximum/minimum of shorter-term price variations.

Candle Color GeneratorCandle Color Generator:
This indicator is designed to highlight the candle colors based on the combinations of Parabolic SAR (PSAR) and 2 Hull Moving Averages (HMA).
Colors:
Yellow, Red, and Green colors are used to describe the candle colors depends on its position to PSAR and 2 HMAs.
PSAR:
PSAR position above or below candle position is differentiated by Red and Green colors
HMAs:
As default settings 20 HMA is considered as lower period and 50 HMA is considered period for the calculation
Trade What You See:
This indicator will help to see how the setup of particular instrument coming up. Users/Traders can use and trade based on what they see and interpret from it.
Disclaimer:
Idea of publishing this script is to identify the strength of the instrument using multiple confirmation.
Using this indicator, changing inputs (show/hide/change period), and trading decisions are up to the users/traders.
Courtesy:
Thanks to inventors of HMA (Alan Hull), PSAR(Welles Wilder) as these inputs are used to make some calculations

HTF Candlestick Patterns [TradingView] vX by DGTCandlesticks are graphical representations of price movements for a given period of time. They are commonly formed by the opening, high, low, and closing prices of a financial instrument. They have their origins in the centuries-old Japanese rice trade and have made their way into modern day price charting.
It’s important to note that candlestick patterns aren’t necessarily a buy or sell signal by themselves. They are instead a way to look at market structure and a potential indication of an upcoming opportunity. It is always useful to look at candlestick patterns in context like any other market analysis tool and candlestick patterns are most useful when used in combination with other techniques. There are countless candlestick patterns that traders can use to identify areas of interest on a chart, where some candlestick patterns may provide insights into the balance between buyers and sellers, others may indicate a reversal, continuation, or indecision.
Reversal patterns are quite useful when used in context. Reversal patterns should form at the bottom of a downtrend or at the top of an uptrend. Otherwise, they are not a reversal patterns, but continuation patterns. Most reversal patterns require confirmation such as price move in the direction of reversal accompanied by appropriate trading volume. The reversal patterns can further be confirmed through other means of traditional technical analysis—like trend lines, momentum, oscillators, or volume indicators—to reaffirm buying or selling pressure. The patterns themselves do not guarantee that the trend will reverse. Investors should always confirm reversal by the subsequent price action before initiating a trade.
This study implements some of the most commonly used candlestick patterns in a context with directional movement indicator. On request users can adjust the strong trend threshold from dialog box, eighter can disabled correlation with directional movement indicator. To add additional sight to analysis the simple moving averages of 20, 50, 100 and 200 periods are added (configurable)
You may add additional indicators of your choice. Colored DMI, BB Cloud or Price Distance to its MAs may help
Enjoy it!
Disclaimer: The script is for informational and educational purposes only. Use of the script does not constitutes professional and/or financial advice. You alone the sole responsibility of evaluating the script output and risks associated with the use of the script. In exchange for using the script, you agree not to hold dgtrd tradingview user liable for any possible claim for damages arising from any decision you make based on use of the script

Candlestick Reversal SystemHello Traders,
In the book "Secrets of a Pivot Boss: Revealing Proven Methods for Profiting in the Market" by Franklin Ochoa, Four different types of reversal systems were introduced and candlestick patterns are used to find reversals. I will not write a lot about the book, you should get/read it for yourself. There are many great ideas in the book, Candlesetick Reversal System, Following Trend, Time Price Opportunity, Advanced Camarilla Concepts and much more.
Reversal systems mentioned in the book are :
- Wick Reversal System
- Exteme Reversal System
- Outside Reversal System
- Doji Reversal System
I tried to add these four reversal systems to the script. If you need detailed info you better read the book ;)
Enjoy!

BH - Candlestick Pattern DetectionThis is a script to help the beginners locate the candle patterns. It has a nice code that can be used in other scripts too. Easy to use with separated functions, simple patterns and complex patterns detections.
I have done some updates at the Candlestick Patterns Identified script by @repo32. Was a good start of my ideia. Tks for sharing repo.
It will be always under constant development but I want to share this first version to know what can be done to get better, improve, get more desired patterns, know what are you guys using that could be helpful.
I still need to check if all patterns are correct.
Any comments, help and suggestions will be appreciated.
Marcos Issler @ Isslerman
