HTF CandlesHTF Candles, Plot of a Higher/Lower Timeframe Candles on any chart.
This HTF / LTF candle plot displays the previous 3 daily candles with the current update of the price with reference to a lower time frame.
Candles includes 3 Candles of HTF
last HTF candle includes 4 previous candles from LTF
Candle High Low Open Close are plotted.
these OHLC values act as Support and Resistance With reference to current Price.
very useful in making HTF and LTF analysis with reference to current timeframe.
"candle"に関するスクリプトを検索

[ROC3] Rate of Change Candle ColorROC is a statistical indicator which tracks how much a security's price has changed over a certain period, showing whether momentum is picking up or slowing down. It’s a handy tool because it helps traders spot trend changes and understand how strong a trend is.
My ROC3 indicator will color the candlesticks based on the Rate of Change (ROC) and its Exponential Moving Average (EMA). This indicator helps traders visually identify bullish and bearish trends by applying color to the candles, making it easier to spot momentum shifts and trend changes.
How It Works:
Rate of Change (ROC): Calculates the percentage change in the price over a specified number of bars. This indicator measures the speed at which price changes.
EMA of ROC: Applies an Exponential Moving Average to the ROC values to provide a smoothed benchmark. The EMA helps to reduce noise and make trend identification more reliable.
Coloring Logic:
Bullish Candles (Green): When the current ROC is higher than the EMA of the ROC.
Bearish Candles (Red): When the current ROC is lower than the EMA of the ROC.
Settings:
ROC Length (Default: 60): The number of bars used to calculate the Rate of Change. Adjust this parameter to change the sensitivity of the ROC calculation.
ROC EMA Length (Default: 7): The number of bars used to calculate the Exponential Moving Average of the ROC. This length determines how smooth the EMA is. A shorter length reacts faster to price changes, while a longer length provides a smoother, slower response.
How to Use:
Apply the Indicator: Add the Rate of Change Candle Color indicator to your TradingView chart.
Interpret the Colors:
Green Candles: Indicate bullish momentum. The current ROC is greater than its EMA, suggesting upward pressure.
Red Candles: Indicate bearish momentum. The current ROC is less than its EMA, suggesting downward pressure.
Adjust Settings: Customize the ROC Length and ROC EMA Length based on your trading strategy. Shorter ROC lengths may capture more short-term trends, while longer lengths provide a broader view.
Combine with Other Indicators: Use the in conjunction with other technical indicators or chart patterns to enhance your trading analysis.
Example Use Case:
Trend Confirmation: Use the color changes to confirm bullish or bearish trends. Green candles can confirm uptrends, while red candles may signal downtrends or potential reversals.
Momentum Analysis: Monitor how frequently the ROC crosses above or below its EMA to gauge momentum strength and make informed trading decisions.
Note:
This indicator is designed to assist with trend analysis and should be used as part of a broader trading strategy. Always conduct your own research and analysis before making trading decisions.
Cherio...

L2 Candle Pattern ScalperLevel: 2
Background
Japanese candlesticks provide more detailed and accurate information about price movements compared to bar charts. They provide a graphical representation of the supply and demand behind the price promotions for each period. Each candlestick contains a central part that indicates the distance between the opening and closing of the security being traded, the area called the body.
Scalping is a trading strategy that aims to take advantage of minor changes in the stock price. Traders using this strategy place anywhere from 10 to a few hundred trades in a single day with the belief that small moves in the stock price are easier to catch than large ones. Traders who implement this strategy are known as scalpers. Lots of small wins can easily lead to big wins if a strict exit strategy is used to prevent big losses.
Function
L2 Candle Pattern Scalper utilizes candle pattern to decide long and short entry signal. It use inherent candles' relationship nearby to judge the market trend is up or down and decide to long or short.
Signal
buysmall --> long entry
exitred --> short entry
Pros and Cons
Pros:
1. its response is fast because OHLC candle is the raw source of market
2. it is suitable for scalping because it studies nearby candles to judge very short term trend change
Cons:
1. Mid-long term change is missing from this indicator, although I use fast and slow lines to indicate the mid-term trend.
2. No stop loss or take profit scheme is introduced.
Remarks
This is promising but need efforts to refine it.
Readme
In real life, I am a prolific inventor. I have successfully applied for more than 60 international and regional patents in the past 12 years. But in the past two years or so, I have tried to transfer my creativity to the development of trading strategies. Tradingview is the ideal platform for me. I am selecting and contributing some of the hundreds of scripts to publish in Tradingview community. Welcome everyone to interact with me to discuss these interesting pine scripts.
The scripts posted are categorized into 5 levels according to my efforts or manhours put into these works.
Level 1 : interesting script snippets or distinctive improvement from classic indicators or strategy. Level 1 scripts can usually appear in more complex indicators as a function module or element.
Level 2 : composite indicator/strategy. By selecting or combining several independent or dependent functions or sub indicators in proper way, the composite script exhibits a resonance phenomenon which can filter out noise or fake trading signal to enhance trading confidence level.
Level 3 : comprehensive indicator/strategy. They are simple trading systems based on my strategies. They are commonly containing several or all of entry signal, close signal, stop loss, take profit, re-entry, risk management, and position sizing techniques. Even some interesting fundamental and mass psychological aspects are incorporated.
Level 4 : script snippets or functions that do not disclose source code. Interesting element that can reveal market laws and work as raw material for indicators and strategies. If you find Level 1~2 scripts are helpful, Level 4 is a private version that took me far more efforts to develop.
Level 5 : indicator/strategy that do not disclose source code. private version of Level 3 script with my accumulated script processing skills or a large number of custom functions. I had a private function library built in past two years. Level 5 scripts use many of them to achieve private trading strategy.

Function To Candles - Another way to see indicatorsIntroduction
There are different and better way's to see price data, a candlestick chart is one of the best way to see the price since you have access to the open/high/low/close information, this is really efficient and can allow for naked non parametric trading strategies (candlesticks patterns) . But what about making candles out of indicators ? There are tons of studies about candlesticks patterns in price data but none (?) about candlestick patterns using indicator data, therefore i made this script in order to show candles from various indicators, i also made an heikin-ashi mode.
Rsi To Candles
All the indicators are use the open/high/low/close price as input in order to return candles. length control the indicator period.
Stochastic To Candles
The stochastic oscillator is restrained in a range of 0/100, therefore when equal to 0 or 100 the candles can be flat.
Rate Of Change To Candles
The rate of change don't distort price as heavily as other indicators since its based on differencing.
Center Of Gravity To Candles
The center of gravity (cog) is defined from tradingview as "an indicator based on statistics and the Fibonacci golden ratio", its not an indicator i'am familiar with and i don't know if its the same proposed by Elhers. The candles are smooth, high length can flatten the candles heavily making them hard to see.
Correlation Oscillator
In a range of -1/1 this indicator is quite smooth and can also flatten candles.
Patterns And Heikin-Ashi
There are tons of patterns that can be generated from candlesticks, they can be applied to this indicator as well.
The indicator can show an heikin-ashi mode, heikin-ashi candlestick use averaging to plot candles, this is why they appear smoother, some signals generated from heikin-ashi candles are :
Bullish body with no lower shadows = Strong Uptrend
Bearish body with no higher shadows = Strong Downtrend
High range and small body = Indecision/Risk of reversal
Conclusion
I made an indicator able to draw candles from other indicators, those candles contain various information that can generate decision from patterns. I hope you find a use to it, if its the case share your findings with me, maybe that you will even be able find a new candlestick pattern :)
Thanks for reading !

Smart Trader, Episode 02, by Ata Sabanci | Battle of Candles ⚠️ CRITICAL: READ BEFORE USING ⚠️
This indicator is 100% VOLUME-BASED and requires Lower Timeframe (LTF) intrabar data for accurate calculations. Please understand the following limitations before using:
📊 DATA ACCURACY LEVELS:
• 1T (Tick) — Most accurate, real volume distribution per tick
• 1S (1 Second) — Reasonably accurate approximation
• 15S (15 Seconds) — Good approximation, longer historical data available
• 1M (1 Minute) — Rough approximation, maximum historical data range
⚠️ BACKTEST & REPLAY LIMITATIONS:
• Replay mode results may differ from live trading due to data availability
• For longer back test periods, use higher LTF settings (15S or 1M)
• Not all symbols/exchanges support tick-level data
• Crypto and Forex typically have better LTF data availability than stocks
💡 A NOTE ON TOOLS:
Successful trading requires proper tools. Higher TradingView plans provide access to more historical intrabar data, which directly impacts the accuracy of volume-based calculations. More precise volume data leads to more reliable signals. Consider this when evaluating your trading infrastructure.
📌 OVERVIEW
Smart Trader Episode 02: Battle of Candles is an advanced educational indicator that combines multiple analysis engines to help traders identify market scenarios and understand market dynamics. This is NOT financial advice or a trading signal service — it's a learning tool designed to help you understand how institutional traders might interpret price action.
The indicator integrates 7 major analysis engines into a unified dashboard, providing real-time insights into volume flow, trend structure, market phases, and potential trade setups.
⚡ KEY FEATURES
🎯 16-Pattern Scenario Engine
Automatically detects and classifies market conditions into 16 distinct scenarios, from strong continuation moves to potential reversals and traps.
💰 Trade Advisor Panel
Aggregates all signals into actionable suggestions with confidence levels, suggested entry/SL/TP levels, and risk/reward calculations.
📊 Volume Engine
Splits volume into buy/sell components using either Geometry (candle shape) or Intrabar (LTF data) methods for precise delta analysis.
📈 CVD (Cumulative Volume Delta)
Tracks the running total of buying vs selling pressure to identify accumulation, distribution, and divergences.
🎯 Stop-Hunt Detection
Identifies potential stop-hunt patterns where price sweeps liquidity levels before reversing.
📐 Pure Structure Trend Engine
Zero-lag trend detection based on swing highs/lows (HH/HL/LH/LL) without any lagging indicators.
⚡ Effort vs Result Analysis
Measures energy spent (volume) versus ground taken (price movement) to detect stalls, breakthroughs, and exhaustion.
🎯 SCENARIO ENGINE — 16 Market Patterns
The Scenario Engine analyzes multiple factors (candle anatomy, volume, forces, CVD, wick analysis) to classify each candle into one of 16 scenarios:
Continuation Scenarios (1-3)
1. ⚔️ STRONG MOVE — Big body candle (>60%) with volume confirming direction. Indicates strong momentum continuation.
2. 🛡️ ABSORPTION — One side attacks but the other absorbs the pressure. Price holds despite volume. Continuation expected in the absorbing side's favor.
3. 📉 PULLBACK — Small move against the trend with low volume. Indicates a healthy retracement before trend continuation.
Reversal Scenarios (4-6, 13-16)
4. 💥 REJECTION — Big wick (>40%) with small body and high volume. Price was rejected
at a level, potential reversal.
5. 🪤 TRAP — Pin direction disagrees with delta. Extreme wick size. Looks bullish/bearish but the opposite may happen.
6. 😫 EXHAUSTION — High energy spent (volume) but low ground taken (price movement). Both sides active but momentum fading.
13. 🔄 CVD BULL DIV — Price falling but CVD rising. Hidden buying detected (accumulation). Potential bullish reversal.
14. 🔄 CVD BEAR DIV — Price rising but CVD falling. Hidden selling detected (distribution). Potential bearish reversal.
15. 🎯 STOP HUNT BULL — Shorts were liquidated below support. Price swept liquidity and reversed. Expect bullish move.
16. 🎯 STOP HUNT BEAR — Longs were liquidated above resistance. Price swept liquidity and reversed. Expect bearish move.
Range/Stalemate Scenarios (7-9)
7. ⚖️ DEADLOCK — Market in balance. Force ratio between 0.4-0.6. Low volume. No side winning.
8. 🔥 BATTLE — High volume fight in a range. Both sides attacking. Wicks on both ends of candle.
9. 🎯 WAITING — Building phase with quiet volume. Market is preparing but no trigger yet. Wait for breakout.
Pre-Breakout Scenarios (10-12)
10. 🚀 BULL SETUP — Buyers accumulating in a building phase. Positive delta building. Bullish pressure growing.
11. 💣 BEAR SETUP — Sellers distributing in a building phase. Negative delta building. Bearish pressure growing.
12. ⚡ BREAKOUT — Price at boundary with strong candle and volume supporting. Imminent breakout expected.
💰 TRADE ADVISOR ENGINE
The Trade Advisor aggregates all signals from the different engines into a single actionable output. It uses a weighted scoring system:
Scoring Weights:
• Scenario Signal: 30%
• Trend Alignment: 20%
• CVD Momentum: 15% + Divergence Bonus
• Pin Forces: 15%
• Liquidity Sweep: 12%
• Stop-Hunt Detection: 10%
• Effort vs Result: 10%
Possible Actions:
• ⏳ WAIT — Edge not strong enough (stay patient)
• 🟢 LONG ENTRY — Buyers have strong advantage + signals align
• 🔴 SHORT ENTRY — Sellers have strong advantage + signals align
• ⚠️ CLOSE LONG/SHORT — Position at risk (reversal/trend flip)
• 🛑 STOP LOSS — Price hit risk threshold
• 💰 TAKE PROFIT — Target threshold reached
📊 EXTENDED INFO PANEL (Detailed Explanations)
The Extended Info panel is hidden by default (toggle: Show Extended Info in settings). It provides detailed metrics that feed into the main engines:
CVD ANALYSIS
What is CVD?
Cumulative Volume Delta (CVD) is the running total of Buy Volume minus Sell Volume. It reveals the underlying buying/selling pressure that may not be visible in price alone.
CVD Value & Slope:
• ↗ Rising: CVD increasing = net buying pressure (bullish)
• ↘ Falling: CVD decreasing = net selling pressure (bearish)
• → Flat: No clear pressure direction
Accumulation vs Distribution:
• Accumulation %: Shows buying pressure strength (0-100). High accumulation with CVD rising = strong bullish bias.
• Distribution %: Shows selling pressure strength (0-100). High distribution with CVD falling = strong bearish bias.
Divergence Alerts:
• ⚠️ BULLISH DIVERGENCE: Price falling but CVD rising. Hidden buying = potential reversal UP.
• ⚠️ BEARISH DIVERGENCE: Price rising but CVD falling. Hidden selling = potential reversal DOWN.
WICK ANALYSIS
Wick Torque:
Torque measures the "rotational force" from wicks. It's calculated from wick length, volume, and body efficiency.
• Positive Torque (Bullish): Bottom wick power dominates. Buyers defended lower prices.
• Negative Torque (Bearish): Top wick power dominates. Sellers defended higher prices.
• ⚡ High Torque (>30): Strong signal, significant wick rejection occurred.
Stop-Hunt Detection:
The engine detects when price has likely swept stop-losses clustered at key levels:
• Stop Hunt Risk %: Likelihood score (0-100). Above 55% = confirmed hunt.
• "Shorts hunted": Price swept below support, liquidating shorts, expect bounce UP.
• "Longs hunted": Price swept above resistance, liquidating longs, expect drop DOWN.
LIQUIDITY SWEEPS
This section appears only when a liquidity sweep is detected. The engine monitors for price sweeping recent highs/lows and then reversing:
• 🎯 LIQUIDITY SWEPT ABOVE: Price broke recent highs but closed back below. Longs trapped, expect DOWN.
• 🎯 LIQUIDITY SWEPT BELOW: Price broke recent lows but closed back above. Shorts trapped, expect UP.
POWER BALANCE
The Power Balance meter shows the real-time strength comparison between buyers and sellers.
Force Ratio:
• 0% = Complete seller dominance
• 50% = Perfect balance
• 100% = Complete buyer dominance
Visual Bar:
• Left side (▓): Bear territory
• Right side (▓): Bull territory
• The bar is smoothed over recent history to reduce noise.
EFFORT vs RESULT
This section measures the efficiency of price movement relative to volume expended.
Energy:
How much volume was spent relative to the average. Energy > 1.0x means above-average volume activity.
Ground:
How much price movement occurred relative to average range. Ground > 1.0x means above-average price movement.
STALL Warning:
A STALL is detected when high energy is spent but low ground is taken (high effort, low result). This often indicates institutional battle, exhaustion, or imminent reversal.
MARKET PHASE
The Phase Engine classifies the current market regime:
RANGE : No clear trend. Price confined to middle of channel. Low ADX. Balanced forces. Trade breakouts with caution.
BUILDING : Compression/preparation phase. Channel tightening or boundary penetration without follow-through. Watch for breakout direction.
TRENDING : Active directional move. Clear slope, good efficiency, price on trending side of channel. Favor pullback entries.
Strength:
0-100% score combining slope, volume validity, and force/efficiency filters.
Bars: How many candles the current phase has persisted.
TRACK RECORD (Validation Panel)
Enable with Show Validation Panel in settings. This section tracks the historical accuracy of scenario predictions:
Accuracy: Percentage of validated predictions that were correct.
Best/Worst Scenario: Shows which scenarios have the highest and lowest accuracy on the current symbol.
Recent Signals: Last 5 predictions with their outcomes. ✓ = correct, ✗ = wrong, ⏳ = pending validation.
⚙️ SETTINGS GUIDE
📊 Volume Analysis
Volume Calculation: Choose Geometry (estimates from candle shape) or Intrabar (precise LTF data).
Intrabar Resolution: LTF for precise mode. Try 1S, 15S, or 1T. Must be lower than chart timeframe.
History Depth: Candles stored in memory (5-50). Higher = more context, slower.
Memory Lookback: Bars for moving averages and Z-scores (10-100).
🏷️ Market Phase
Range Zone Width: How much of channel center is considered "range" (0.1-0.8).
Trend Sensitivity: Minimum slope to detect trending. Lower = more sensitive.
Min Episode Length: Minimum bars before phase can change. Prevents flickering.
🎯 Scenarios
Min Confidence to Show: Only display scenarios above this confidence level (30-90).
Bars to Validate: How many bars to wait before checking if prediction was correct.
Success Move %: Minimum price movement to consider prediction successful.
💰 Trade Advisor
Min Confidence for Entry: Minimum confidence to suggest a trade entry (50-90).
Default Risk %: Stop loss distance as % of price (0.5-5.0).
Min Risk/Reward: Minimum acceptable R:R ratio (1.0-5.0).
🔔 ALERT CONDITIONS
The indicator provides the following alert conditions you can configure:
• 🟢 LONG Entry Signal
• 🔴 SHORT Entry Signal
• ⚠️ Close LONG Signal
• ⚠️ Close SHORT Signal
• 🛑 STOP LOSS Alert
• 💰 Take Profit Alert
• 🚨 High Urgency Signal
⚠️ IMPORTANT DISCLAIMER
EDUCATIONAL TOOL ONLY
This indicator is designed for educational purposes to help users identify different market scenarios and understand how various signals might be interpreted.
The Trade Advisor is NOT a recommendation to buy, sell, or invest.
• Past performance does not guarantee future results
• All trading involves risk of loss
• The creator is not a licensed financial advisor
• Always do your own research (DYOR)
• Consult a qualified financial advisor before making any investment decisions
By using this indicator, you acknowledge that you understand these risks and accept full responsibility for your trading decisions.

Big Candle Trend█ OVERVIEW
The "Big Candle Trend" indicator is a technical analysis tool written in Pine Script® v6 that identifies large signal candles on the chart and determines the trend direction based on the analysis of all candles within a specified period. Designed for traders seeking a simple yet effective tool to identify key market movements and trends, the indicator provides clarity and precision through flexible settings, trend line visualization, and retracement lines on signal candles.
█ CONCEPTS
The goal of the "Big Candle Trend" indicator was to create a tool based solely on the size of candle bodies and their relative positions, making it universal and effective across all markets (stocks, forex, cryptocurrencies) and timeframes. Unlike traditional indicators that often rely on complex formulas or external data (e.g., volume), this indicator uses simple yet powerful price action logic. Large signal candles are identified by comparing their body size to the average body size over a selected period, and the trend is determined by analyzing price changes over a longer period relative to the average candle body size. Additionally, the indicator draws horizontal lines on signal candles, aiding in setting Stop Loss levels or delayed entries.
█ FEATURES
Large Signal Candle Detection: Identifies candles with a body larger than the average body multiplied by a user-defined multiplier, aligned with the trend (if the trend filter is enabled). Signals are displayed as triangles (green for bullish, red for bearish).
Trend Analysis: Determines the trend (uptrend, downtrend, or neutral) by comparing the price change over a selected period (trend_length) to the average candle body size multiplied by a trend strength multiplier. The trend starts when:
Uptrend: The price change (difference between the current close and the close from an earlier period) is positive and exceeds the average candle body size multiplied by the trend strength multiplier (avg_body_trend * trend_mult).
Downtrend: The price change is negative and exceeds, in absolute value, the average candle body size multiplied by the trend strength multiplier.
Neutral Trend: The price change is below the required threshold, indicating no clear market direction.The trend ends when the price change no longer meets the conditions for an uptrend or downtrend, transitioning to a neutral state or switching to the opposite trend when the price change reverses and meets the conditions for the new trend. This approach differs from standard methods as it focuses on price dynamics in the context of candle body size, offering a more intuitive and direct way to gauge trend strength.
Smoothed Trend Line: Displays a trend line based on the average price (HL2, i.e., the average of the high and low of a candle), smoothed using a user-defined smoothing parameter. The trend line reflects the market direction but is not tied to breakouts, unlike many other trend indicators, allowing for more flexible interpretation.
Retracement Lines: Draws horizontal lines on signal candles at a user-defined level (e.g., 0.618). The lines are displayed to the right of the candle, with a width of one candle. For bullish candles, the line is measured from the top of the body (close) downward, and for bearish candles, from the bottom of the body (close) upward, aiding in setting Stop Loss or delayed entries.
Trend Option: Option to enable a trend filter that limits large candle signals to those aligned with the current trend, enhancing signal precision.
Customizable Visualization: Allows customization of colors for uptrend, downtrend, and neutral states, trend line style, and shadow fill between the trend line and price.
Alerts: Built-in alerts for large signal candles (bullish and bearish) and trend changes (start of uptrend, downtrend, or neutral trend).
█ HOW TO USE
Add to Chart: Apply the indicator to your TradingView chart via the Pine Editor or Indicators menu.
Configure Settings:
Candle Settings:
Average Period (Candles): Sets the period for calculating the average candle body size.
Large Candle Multiplier: Multiplier determining how large a candle’s body must be to be considered "large".
Trend Settings:
Trend Period: Period for analyzing price changes to determine the trend.
Trend Strength Multiplier: Multiplier setting the minimum price change required to identify a significant trend.
Trend Line Smoothing: Degree of smoothing for the trend line.
Show Trend Line: Enables/disables the display of the trend line.
Apply Trend Filter: Limits large candle signals to those aligned with the current trend.
Trend Colors:
Customize colors for uptrend (green), downtrend (red), and neutral (gray) states, and enable/disable shadow fill.
Retracement Settings:
Retracement Level (0.0-1.0): Sets the level for lines on signal candles (e.g., 0.618).
Line Width: Sets the thickness of retracement lines.
Interpreting Signals:
Bullish Signal: A green triangle below the candle indicates a large bullish candle aligned with an uptrend (if the trend filter is enabled). A horizontal line is drawn to the right of the candle at the retracement level, measured from the top of the body downward.
Bearish Signal: A red triangle above the candle indicates a large bearish candle aligned with a downtrend (if the trend filter is enabled). A horizontal line is drawn to the right of the candle at the retracement level, measured from the bottom of the body upward.
rend Line: Shows the market direction (green for uptrend, red for downtrend, gray for neutral). Unlike many indicators, the trend line’s color is not tied to its breakout, allowing for more flexible interpretation of market dynamics.
Alerts: Set up alerts in TradingView for large signal candles or trend changes to receive real-time notifications.
Combining with Other Tools: Use the indicator alongside other technical analysis tools, such as support/resistance levels, RSI, moving averages, or Fair Value Gaps (FVG), to confirm signals.
█ APPLICATIONS
Price Action Trading: Large signal candles can indicate key market moments, such as breakouts of support/resistance levels or strong price rejections. Use signal candles in conjunction with support/resistance levels or FVG to identify entry opportunities. Retracement lines help set Stop Loss levels (e.g., below the line for bullish candles, above for bearish) or delayed entries after price returns to the retracement level and confirms trend continuation. Note that large candles often generate Fair Value Gaps (FVG), which should be considered when setting Stop Loss levels.
Trend Strategies: Enable the trend filter to limit signals to those aligned with the dominant market direction. For example, in an uptrend, look for large bullish candles as continuation signals. The indicator can also be used for position pyramiding, adding positions as subsequent large candles confirm trend continuation.
Practical Approach:
Large candles with high volume may indicate strong market participation, increasing signal reliability.
The trend line helps visually assess market direction and confirm large candle signals.
Retracement lines on signal candles aid in identifying key levels for Stop Loss or delayed entries.
█ NOTES
The indicator works across all markets and timeframes due to its universal logic based on candle body size and relative positioning.
Adjust settings (e.g., trend period, large candle multiplier, retracement level) to suit your trading style and timeframe.
Test the indicator on various markets (stocks, forex, cryptocurrencies) and timeframes to optimize its performance.
Use in conjunction with other technical analysis tools to enhance signal accuracy.

Big Candle Touches Bollinger BandWhat It Does:
This indicator helps you spot important trading signals by combining Bollinger Bands with big candles.
Key Features:
Bollinger Bands: These bands show the average price (middle band) and the range of price movement (upper and lower bands) over a set period. The bands widen when prices are more volatile and narrow when they are less volatile.
Big Candle Detection: A "big candle" is a candle that has a larger body compared to the average price movement over a period. This is determined using the Average True Range (ATR), which measures market volatility.
How It Works:
Detects Big Candles: It checks if a candle’s body (the difference between its open and close prices) is bigger than usual, based on a multiplier of the ATR.
Touching Bollinger Bands: It looks for candles that touch or cross the upper or lower Bollinger Bands.
Highlights Important Signals:
Sell Signal: When a big candle touches the upper Bollinger Band, it marks it as a "Sell" signal with a red label.
Buy Signal: When a big candle touches the lower Bollinger Band, it marks it as a "Buy" signal with a green label.
Alerts:
You'll get alerts when a big candle touches the upper or lower Bollinger Bands, so you don’t miss these potential trading opportunities.
Visuals:
Bollinger Bands: Shown as three lines on the chart — the upper band (red), the lower band (green), and the middle band (blue).
Labels: Red labels for sell signals and green labels for buy signals when a big candle touches the bands.
This indicator helps you identify potential trading opportunities by focusing on significant price movements and how they interact with the Bollinger Bands.

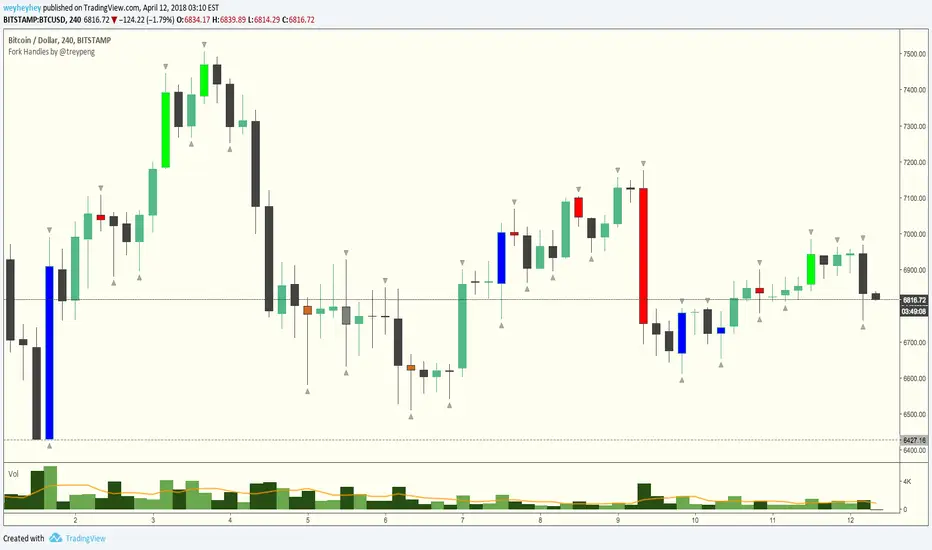
Fork Handles by @treypeng
Candle based indicator that shows swing highs and lows (pivots).
It draws an up or down arrow for simple three candle 'single' swings.
For stronger five candle 'double' swings, it colours the candle. Good for highlighting stronger reversals.
Both of these stylings can be toggled on/off individually.
Default colours
Swing HIGH on an UP candle: bright green
Swing HIGH on an DOWN candle: bright red
Swing LOW on an UP candle: blue
Swing LOW on an DOWN candle: brown
Double swings are grey or white.
Regular candles are just kept to your own default colours as specified in the chart settings.
👏 for anyone who gets the 'fork handles' joke reference.
Next Candle PredictorAdvanced TradingView Indicator for Precise Buy and Sell Signals
Overview:
The Predicta Futures - Next Candle Predictor is a cutting-edge TradingView indicator designed to forecast the next candle's direction in futures and cryptocurrency markets. Leveraging a multi-indicator confluence strategy, this tool provides traders with actionable long and short prediction percentages, enhanced by dynamic ADX-based thresholds and visual projection candles. Ideal for scalping, day trading, or swing trading on platforms like MEXC or Binance futures, it combines Supertrend, MACD, RSI, Stochastic, ADX, and volume analysis to deliver high-probability buy and sell signals while minimizing false positives.
Key Features:
• Multi-Indicator Confluence Scoring:
Integrates Supertrend for trend direction, EMAs (8, 21, 50) for alignment, MACD for momentum crossovers, RSI for overbought/oversold conditions, Stochastic for divergence detection, ADX for trend strength, and volume ratios for confirmation. A customizable confluence score (0-6) ensures signals meet user-defined criteria, reducing whipsaws in volatile markets.
• Dynamic Prediction Thresholds:
ADX-driven adjustments lower the required prediction percentage (e.g., 60% in strong trends) for "PERFECT TIME" entries, adapting to market conditions like ranging or trending phases.
• Visual Analysis Table:
A sleek, color-coded dashboard displays progress bars for each indicator, prediction percentages, and status (e.g., "PERFECT TIME" or "WAIT"). Supports long and short analyses with intuitive ASCII bars for quick scans.
• Projection Candles:
Simulates potential next-candle outcomes with volatility-scaled (via Bollinger Bands width) green long and red short candles, aiding in visualizing price targets.
• Buy/Sell Signals and Alerts:
Generates labeled "BUY" and "SELL" arrows on EMA crossovers within confirmed trends, with separate alerts for basic signals and high-confluence "PERFECT TIME" opportunities.
• Customizable Inputs:
Adjust ATR periods, Supertrend factors, minimum confluence scores, and volume ratios to tailor the indicator for stocks, forex, or crypto perpetual futures.
How It Works:
This TradingView script calculates long and short scores using weighted contributions from key indicators, normalizing them into prediction percentages. A confluence check—factoring trend, EMA alignment, MACD, Stochastic, volume, and ADX—triggers "PERFECT TIME" only when conditions align robustly. For example:
• In a downtrend (Supertrend red), with bearish MACD and Stochastic, and sufficient volume, the indicator highlights short opportunities.
• Dynamic thresholds ensure aggressive entries in strong trends (ADX >25) and conservative ones in weak trends.
• Backtested for reliability, it excels in identifying reversals and continuations, making it a must-have for traders seeking an edge in futures trading strategies.
Usage Instructions:
1. Add the indicator to your TradingView chart. (Search: Next Candle Predictor)
2. Customize settings via the inputs panel (e.g., set minConfluence to 5 for stricter signals).
3. Monitor the analysis table for predictions and confluence scores.
4. Act on "BUY/SELL" labels or "PERFECT TIME" alerts, combining with your risk management.
5. Enable projection candles for visual forecasting of the next bar.
Compatible with all timeframes, from 1-minute scalping to daily swings. Note: This is not financial advice; always verify signals with additional analysis.
Join thousands of traders enhancing their strategies—add it to your charts today and elevate your trading performance!
Please rate and review if it boosts your trades!
Thank you!

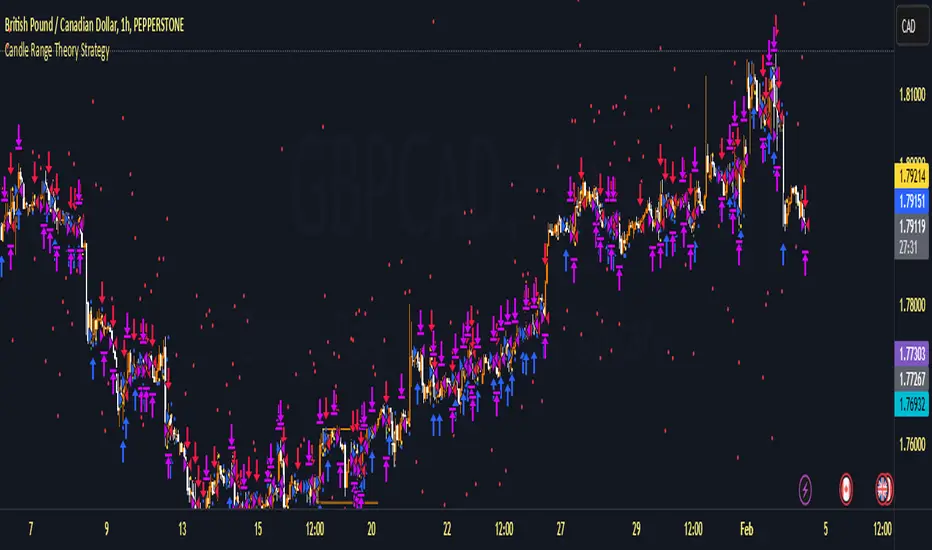
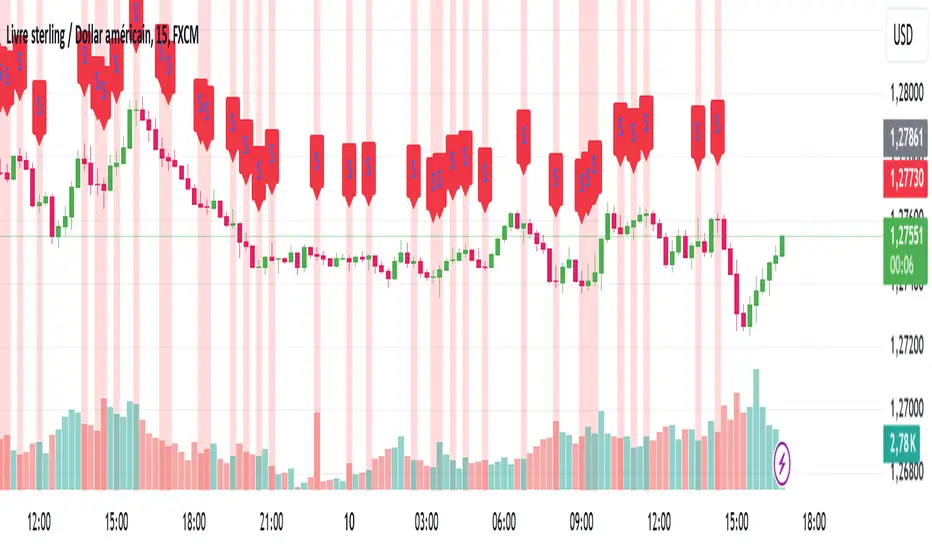
Candle Range Theory StrategyCandle Range Theory StrategyCandle Range Theory Strategy delves into the intricacies of price action analysis, focusing on the behavior of candlestick patterns within specific ranges. Traders employing this strategy aim to identify key support and resistance levels by analyzing the high and low points of significant candlesticks. The core principle lies in understanding that the range of a candle—defined by its opening, closing, high, and low prices—provides valuable insight into market sentiment and potential future movements.
To implement the Candle Range Theory Strategy effectively, one must first recognize the importance of different candle sizes. A long-bodied candle suggests strong momentum, pointing to a bullish or bearish bias, while a small-bodied candle indicates indecision or consolidation, often signaling potential reversals or breakouts. By plotting these candlesticks over a defined time frame, traders can ascertain whether the market is trending or range-bound.
Additionally, traders should consider the context in which these candles form. Analysis of the preceding price action can reveal whether current ranges are extensions of existing trends or indications of market fatigue. In particular, look for patterns such as engulfing candles, pin bars, or inside bars, as they often foreshadow forthcoming price fluctuations.
Moreover, combining the Candle Range Theory with other technical indicators, like moving averages or Fibonacci retracements, can offer a more comprehensive view of potential entry and exit points. By aligning candle patterns with broader market dynamics, traders can optimize their strategies, enhancing their probability of success while minimizing risk.
Lastly, maintaining a disciplined approach is crucial. Setting precise stop-loss and take-profit levels grounded in candle ranges can safeguard one's capital. Adhering to this framework allows traders to navigate the complexities of the market with greater confidence, ultimately leading to more informed and successful trading decisions. Embracing the nuances of Candle Range Theory not only sharpens analytical skills but also enriches one’s trading repertoire, paving the way for sustained profitability in the dynamic world of forex and equities.
High volume candles.
High Volume Candles Indicator:
This is a simple tool that shows you when there's a lot of action in the market. It highlights the candles with the highest trading volume on your chart.
What It Does:
Picks the Busiest Candle: It points out the candle with the most trading in your set time.
Shows Buying and Selling: Green for lots of buying, red for lots of selling.
You Choose the Time Frame: Whether it's a few candles or many, it's up to you.
Best Part - Alerts:
Get Notified: The cool thing? It'll alert you when these big volume candles happen. You won't miss the important moments.
Use this to keep track of when things are really moving in the market, without having to watch your screen all the time.

Adjustable Bull Bear Candle Indicator (V1.2)Indicator Description: Adjustable Bull Bear Candle Indicator
This indicator, named "Adjustable Bull Bear Candle Indicator ," is designed to assist traders in identifying potential bullish and bearish signals within price charts. It combines candlestick pattern analysis, moving average crossovers, and RSI (Relative Strength Index) conditions to offer insights into potential trading opportunities.
Disclaimer:
Trading involves substantial risk and is not suitable for every investor. This indicator is a tool designed to aid in technical analysis, but it does not guarantee successful trades. Always exercise your own judgment and seek professional advice before making any trading decisions.
Key Features:
Preceding Candles Analysis:
The indicator examines the behavior of the previous 'n' candles to identify specific patterns that indicate bearish or bullish momentum.
Candlestick Pattern and Momentum:
It considers the relationship between the opening and closing prices of the current candle to determine if it's bullish or bearish. The indicator then assesses the absolute price difference and compares it to the cumulative absolute differences of preceding candles.
Moving Averages:
The indicator calculates two Simple Moving Averages (SMAs) – Close SMA and Far SMA – to help identify trends and crossovers in price movement.
Relative Strength Index (RSI):
RSI is used as an additional measure to gauge momentum. It analyzes the current price's magnitude of recent gains and losses and compares it to past data.
Time Constraint:
If enabled, the indicator operates within a specific time window defined by the user. This feature can help traders focus on specific market hours.
Customizable Alerts:
The indicator includes an alert system that can be enabled or disabled. You can also adjust the specific alert conditions to align with your trading strategy.
How to Use:
This indicator generates buy signals when specific conditions are met, including a bullish candlestick pattern, positive price difference, closing price above the SMAs, RSI above a threshold, preceding bearish candles, and optionally within a specified time window. Conversely, short signals are generated under conditions opposite to those of the buy signal.
Disclosure and Risk Warning:
Educational Tool: This indicator is meant for educational purposes and to aid traders in their technical analysis. It's not a trading strategy in itself.
Risk of Loss: Trading carries inherent risks, including the potential for substantial loss. Always manage risk and consider using proper risk management techniques.
Diversification: Do not rely solely on this indicator. A well-rounded trading approach includes fundamental analysis, risk management, and proper diversification.
Consultation: It's strongly advised to consult with a financial professional before making any trading decisions.
Conclusion:
The "Bullish Candle after Bearish Candles with Momentum Indicator" can be a valuable tool in your technical analysis toolkit. However, successful trading requires a deep understanding of market dynamics, risk management, and continual learning. Use this indicator in conjunction with other tools and strategies to enhance your trading decisions.
Remember that past performance is not indicative of future results. Always be cautious and informed when participating in the financial markets.

FVG Maxing - Fair Value Gaps, Equilibrium, and Candle Patterns
What this script does
This open-source indicator highlights 3-candle fair value gaps (FVGs) on the active chart timeframe, draws their midpoint ("equilibrium") line, tracks when each gap is mitigated, and optionally marks simple candle patterns (engulfing and doji) for confluence. It is intended as an educational tool to study how price interacts with imbalances.
3-candle bullish and bearish FVG zones drawn as forward-extending boxes.
Equilibrium line at 50% of each gap.
Different styling for mitigated vs unmitigated gaps.
Compact statistics panel showing how many gaps are currently active and filled.
Optional overlays for bullish/bearish engulfing patterns and doji candles.
1. FVG logic (3-candle gaps)
The script focuses on a strict 3-candle definition of a fair value gap:
Three consecutive candles with the same body direction.
The wick of candle 3 is separated from the wick of candle 1 (no overlap).
A bullish gap is created when price moves up fast enough to leave a gap between candle 1 and 3. A bearish gap is the mirror case to the downside.
In Pine, the core detection looks like this:
// Three candles with the same body direction
bull_seq = close > open and close > open and close > open
bear_seq = close < open and close < open and close < open
// Wick gap between candle 1 and candle 3
bull_gap = bull_seq and low > high
bear_gap = bear_seq and high < low
// Final FVG flags
is_bull_fvg = bull_gap
is_bear_fvg = bear_gap
For each detected FVG:
Bullish FVG range: from high up to low (gap below current price).
Bearish FVG range: from low down to high (gap above current price).
Each zone is stored in a custom FVGData structure so it can be updated when price later trades back inside it.
2. Equilibrium line (0.5 of the gap)
Every FVG box gets an optional equilibrium line plotted at the midpoint between its top and bottom:
eq_level = (top + bottom) / 2.0
right_index = extend_boxes ? bar_index + extend_length_bars : bar_index
bx = box.new(bar_index - 2, top, right_index, bottom)
eq_ln = line.new(bar_index - 2, eq_level, right_index, eq_level)
line.set_style(eq_ln, line.style_dashed)
line.set_color(eq_ln, eq_color)
You can use this line as a neutral “fair value” reference inside the zone, or as a simple way to think in terms of premium/discount within each gap.
3. Mitigation rules and styling
Each FVG stays active until price trades back into the gap:
Bullish FVG is considered mitigated when the low touches or moves below the top of the gap.
Bearish FVG is considered mitigated when the high touches or moves above the bottom of the gap.
When that happens, the script:
Marks the internal FVGData entry as mitigated.
Softens the box fill and border colors.
Optionally updates the label text from "BULL EQ / BEAR EQ" to "BULL FILLED / BEAR FILLED".
Can hide mitigated zones almost completely if you only want to see unfilled imbalances.
This allows you to distinguish between current areas of interest and zones that have already been traded through.
4. Candle pattern overlays (engulfing and doji)
For additional confluence, the script can mark simple candle patterns on top of the FVG view:
Bullish engulfing — current candle body fully wraps the previous bearish body and is larger in size.
Bearish engulfing — current candle body fully wraps the previous bullish body and is larger in size.
Doji — candles where the real body is small relative to the full range (high–low).
The detection is based on basic body and range geometry:
curr_body = math.abs(close - open)
prev_body = math.abs(close - open )
curr_range = high - low
body_ratio = curr_range > 0 ? curr_body / curr_range : 1.0
bull_engulfing = close > open and close < open and open <= close and close >= open and curr_body > prev_body
bear_engulfing = close < open and close > open and open >= close and close <= open and curr_body > prev_body
is_doji = curr_range > 0 and body_ratio <= doji_body_ratio
On the chart, they appear as:
Small triangle markers below bullish engulfing candles.
Small triangle markers above bearish engulfing candles.
Small circles above doji candles.
All three overlays are optional and can be turned on or off and recolored in the CANDLE PATTERNS group of inputs.
5. Inputs overview
The script organizes settings into clear groups:
DISPLAY SETTINGS : Show bullish/bearish FVGs, show/hide mitigated zones, box extension length, box border width, and maximum number of boxes.
EQUILIBRIUM : Toggle equilibrium lines, color, and line width.
LABELS : Enable labels, choose whether to label unmitigated and/or mitigated zones, and select label size.
BULLISH COLORS / BEARISH COLORS : Separate fill and border colors for bullish and bearish gaps.
MITIGATED STYLE : Opacity used when a gap is marked as mitigated.
STATISTICS : Toggle the on-chart FVG statistics panel.
CANDLE PATTERNS : Show engulfing patterns, show dojis, colors, and the body-to-range threshold that defines a doji.
6. Statistics panel
An optional table in the corner of the chart summarizes the current state of all tracked gaps:
Total number of FVGs still being tracked.
Number of bullish vs bearish FVGs.
Number of unfilled vs mitigated FVGs.
Simple fill rate: percentage of tracked FVGs that have been marked as mitigated.
This can help you study how a particular market tends to treat gaps over time.
7. How you might use it (examples)
These are usage ideas only, not recommendations:
Study how often your symbol mitigates gaps and where inside the zone price tends to react.
Use higher-timeframe context and then refine entries near the equilibrium line on your trading timeframe.
Combine FVG zones with basic candle patterns (engulfing/doji) as an extra visual anchor, if that fits your process.
Hope you enjoy, give your feedback in the comments!
- officialjackofalltrades

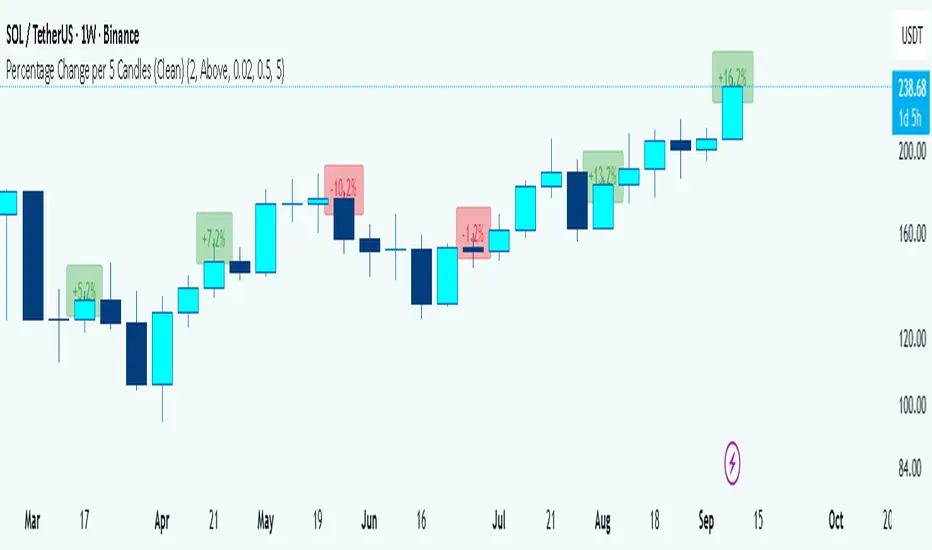
Percentage Change per 5 Candles
🔎 What this indicator does
This indicator calculates and displays the percentage change of each candlestick directly on the chart.
• If a candle closed higher than it opened (bullish candle), it shows a positive % change (green).
• If a candle closed lower than it opened (bearish candle), it shows a negative % change (red).
• Small moves below your chosen threshold (e.g., 0.1%) are ignored to avoid clutter.
• The labels are placed above, below, or in the center of the candle (you choose).
So essentially, every candle “tells you in numbers” exactly how much it changed relative to its opening price.
________________________________________
⚙️ How it operates (the logic inside)
1. Calculate the change
o Formula:
\text{% Change} = \frac{(\text{Close} - \text{Open})}{\text{Open}} \times 100
o Example: If a candle opens at 100 and closes at 105, that’s a +5% change.
2. Round it nicely
o You can control decimals (e.g., show 2 decimals → +5.23%).
3. Filter out noise
o If a candle barely moved (say 0.02%), the label won’t appear unless you reduce the threshold.
4. Style the labels
o Bullish = green text, slightly transparent green background.
o Bearish = red text, slightly transparent red background.
o Neutral (0%) = gray.
5. Place the labels
o Options: above the candle, below the candle, or centered.
o Small vertical offset is applied so labels don’t overlap the candle itself.
________________________________________
📊 How this helps traders
This indicator turns visual candles into quantifiable numbers at a glance. Instead of guessing whether a move was “big” or “small,” you see it clearly.
Key Benefits:
1. Quick volatility analysis
o You can instantly see if candles are making big % swings or just small moves.
o This is especially useful on higher timeframes (daily/weekly) where moves can be large.
2. Pattern confirmation
o For example, you might spot a strong bullish engulfing candle — the % change label helps confirm whether it was truly significant (e.g., +4.5%) or just modest (+0.7%).
3. Noise filtering
o By setting a minimum % threshold, you only see labels when moves are meaningful (say > 0.5%). This keeps focus on important candles.
4. Backtesting & comparison
o You can compare moves across time:
“How strong was this breakout candle compared to the last one?”
“Are today’s bearish candles weaker or stronger than yesterday’s bullish candles?”
5. Better decision-making
o If you’re trading breakouts, reversals, or trend-following, knowing the % size of each candle helps confirm if the move has enough momentum.
________________________________________
✅ In short:
This indicator quantifies price action. Instead of just seeing “green” or “red” candles, you now know exactly how much the price changed in percentage terms, directly on the chart, in real time. It helps you distinguish between strong and weak moves and makes your analysis more precise.
________________________________________
squeeze candles with volume Function :
This indicator was designed to detect specific candles called “squeeze”. These candles are characterized by a relatively small body (the difference between the opening and closing price) and long shadows (the distance between the high and low prices), accompanied by significant volume. They often indicate a period of increased volatility or a potential trend reversal.
Use :
Visual detection:
Candles identified as "squeeze" are highlighted in red on the chart.
An “S” icon appears above each detected squeeze candle.
Alerts:
The indicator emits an audible and visual alert when a squeeze candle with high volume is detected (if alerts are enabled).
Market analysis:
This indicator is particularly useful for identifying trading opportunities during periods when the market is showing signs of compression or impending volatility.
Customizable settings:
Minimum volume: Defines the threshold at which the volume is considered high.
Maximum body/shadow ratio: Allows you to adjust the sensitivity to detect squeeze candles (the lower the ratio, the smaller the detected candles will have in relation to their shadows).
Benefits :
Provides accurate alerts on key market candles.
Helps anticipate large movements through analysis of volume and candle characteristics.
Adaptable to different strategies thanks to adjustable parameters.
Ideal for:
Traders who want to identify areas of potential volatility or reversal signals in the market, regardless of the asset or time frame used.
Control Candle Range [UkutaLabs]Control Candle Range
█ OVERVIEW
The Control Candle Range is a powerful trading tool that automatically identifies control candles in real time. The versatile ranges drawn by this indicator can be used in a variety of trading strategies because they can be used as ranges as well as areas of support and resistance.
The purpose of this script is to simplify the trading experience of users by automatically identifying and displaying Control Candle Ranges.
█ USAGE
A Control Candle is a candle that is followed by two consecutive inside candles. When this pattern is detected, this indicator will automatically identify it and draw a range in real time. This range will continue to extend as long as candles continue to close within the range of the Control Candle. It is important to note that a Control Candle is still valid if the price action exits its range as long as it closes within its range.
This script also supports higher time frame mapping, allowing you to draw Control Candle Ranges from higher timeframes onto lower timeframe charts. This is a powerful feature that allows users to see multiple timeframes worth of information at a glance on one single chart.
Each Control Candle Range will also be displayed with a label to allow users to understand at a glance which timeframe the range is being drawn from. These labels can be turned off in the settings.
The user also has the ability to adjust the color of each timeframe’s ranges.
█ SETTINGS
Configuration
• Show Labels: Determines whether or not identifying labels are displayed on ranges.
• Label Size: Determines the size of labels.
• Text Alignment: Determines where labels are drawn on ranges.
• Max Display: Determines the maximum number of ranges that can be drawn from each timeframe.
Current Timeframe
• Display (On/Off): Determines whether or not ranges from the current timeframe will be drawn on the chart.
• Color: Determines the color of ranges drawn from the current timeframe.
5 Minute (Higher Timeframe)
• Display (On/Off): Determines whether or not ranges from the 5 minute timeframe will be drawn on the chart.
• Color: Determines the color of ranges drawn from the 5 minute timeframe.
15 Minute (Higher Timeframe)
• Display (On/Off): Determines whether or not ranges from the 15 minute timeframe will be drawn on the chart.
• Color: Determines the color of ranges drawn from the 15 minute timeframe.
30 Minute (Higher Timeframe)
• Display (On/Off): Determines whether or not ranges from the 30 minute timeframe will be drawn on the chart.
• Color: Determines the color of ranges drawn from the 30 minute timeframe.
60 Minute (Higher Timeframe)
• Display (On/Off): Determines whether or not ranges from the 60 minute timeframe will be drawn on the chart.
• Color: Determines the color of ranges drawn from the 60 minute timeframe.
240 Minute (Higher Timeframe)
• Display (On/Off): Determines whether or not ranges from the 240 minute timeframe will be drawn on the chart.
• Color: Determines the color of ranges drawn from the 240 minute timeframe.
Daily (Higher Timeframe)
• Display (On/Off): Determines whether or not ranges from the daily timeframe will be drawn on the chart.
• Color: Determines the color of ranges drawn from the daily timeframe.
