Bollinger Bands %B + ATR This indicator is best suitable for the 30-minutes interval OIL charts, due to ATR accuracy.
BB%B is great for showing oversold/overbought market conditions and offers excellent entry/exit opportunities for Day Trading (30 minutes chart), as well as reliable convergence/divergence patterns. ATR is conveniently combined and shows potential market volatility levels for the day when used in 30-minutes charts, thus demarcating your day trade exit point.
To use the ATR on this indicator: Just read the ATR value of the lowest (for a new bull trend) or the highest (for a new bear trend) candlestick of the newly formed trend leg. Let's suppose the ATR reads 0.2891, then you project a move of 2.891 points towards the given trend direction using the ruler tool (30-minutes charts). That's all, and there you have your take profit target!
Good Luck!!!
"charts"に関するスクリプトを検索
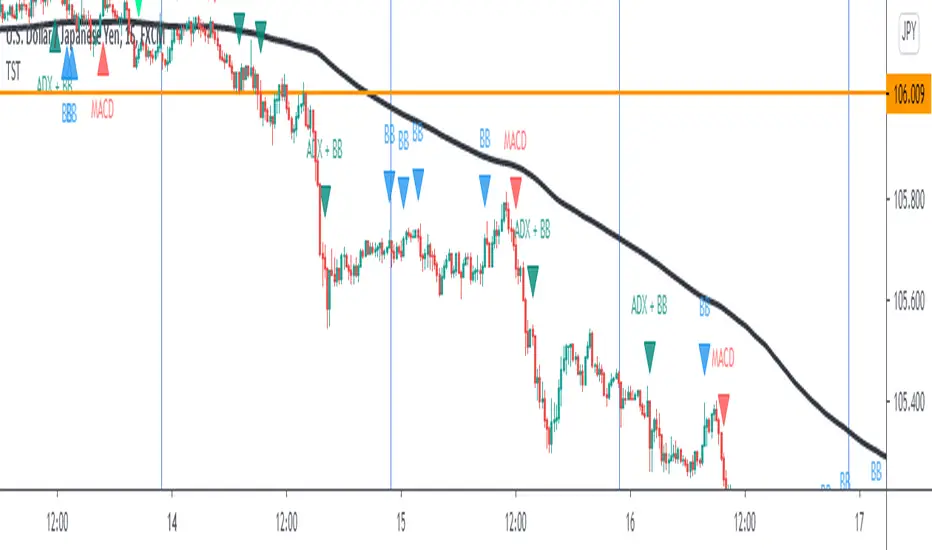
TST Signals & AlertsThis is an unofficial script for strategies tested on Trading Strategy Testing Youtube channel. Over time, most successful strategies will be added with an option to set strategy-specific alerts . TST Signals & Alerts will draw signals on the chart when the entry conditions are met. You can also opt for displaying indicators .
My script is meant for beginners but can be used by veterans too. Just pick one or two strategies, you don't want to flood your chart with conflicting signals. You may want to support your trades with a proper analysis. Is the market trending? Is there a fundament around the corner?
If a new signal occurs when there is still an open position, you are not supposed to take another.
The current version includes MACD and ADX + BB and BB strategies.
MACD strategy:
►Buy, when MACD crosses below the signal line when it is negative. The price must also be above 200 EMA.
►Sell, when MACD crosses above the signal line when it is positive. The price must also be below 200 EMA.
►This strategy was tested on 15-minute charts of EURUSD with reward-to-risk ratio 1,5 and win rate of 61% over 100 trades.
►►►MACD has to be added to your chart separately because it needs a new window. Ticking display indicators will not add MACD to your chart.
►►►MACD was also tested by a different channel I made a script for. You can view the results and the script here:
ADX + BB strategy:
►Buy, when the price is above 200 EMA and ADX becomes higher than 25.
►Sell, when the price is below 200 EMA and ADX becomes higher than 25.
►Stop-loss is either 200 EMA or Bollinger Bands level. Check the channel for more information.
►This strategy was tested on 5-minute charts of EURUSD, USDJPY, AUDUSD with reward-to-risk ratio 1,2 and win rate of 56% over 100 trades in total.
BB strategy:
►Buy, when the price is above 200 EMA and candle's low is below the lower Bollinger Band.
►Sell, when the price is below 200 EMA and candle's high is above the upper Bollinger Band.
►This strategy was tested on 15-minute charts of EURUSD with reward-to-risk ratio 1,5 and win rate of 52% over 100 trades in total.
►►►Due to the relatively low win rate of this strategy, you need to filter out potentially harmful signals with a proper analysis.
Bear in mind that backtesting performance doesn't guarantee future profitability. • Most systematic strategies are not suitable for each timeframe - if you use the different timeframe than the one it was tested on, the result can differ significantly. • You should perform your own backtest to base your trades on more data & to establish confidence in the selected strategy. • This script is not a replacement for proper analysis.
New strategies will be added when I have time. If I see multiple people asking for the same feature, I might agree to release it with a new version. I am not going to add input options in this script, it could come as a separate script though. I am in no way affiliated with the Youtube channel, so if you find the script helpful, shot me a message or send me some TradingView coins >)
If you encounter any bug, you can report it in a message or in comments. Support it with screenshot and relevant information such as a time when it occurred and what options were on etc.
Dekidaka-Ashi - Candles And Volume Teaming Up (Again)The introduction of candlestick methods for market price data visualization might be one of the most important events in the history of technical analysis, as it totally changed the way to see a trading chart. Candlestick charts are extremely efficient, as they allow the trader to visualize the opening, high, low and closing price (OHLC) each at the same time, something impossible with a traditional line chart. Candlesticks are also cleaner than bars charts and make a more efficient use of space. Japanese peoples are always better than everyone at an incredible amount of stuff, look at what they made, the candlesticks/renko/kagi/heikin-ashi charts, the Ichimoku, manga, ecchi...
However classical candlesticks only include historical market price data, and won't include other type of data such as volume, which is considered by many investors a key information toward effective financial forecasting as volume is an indicator of trading activity. In order to tackle to this problem solutions where proposed, the most common one being to adapt the width of the candle based on the amount of volume, this method is the most commonly accepted one when it comes to visualizing both volume and OHLC data using candlesticks.
Now why proposing an additional tool for volume data visualization ? Because the classical width approach don't provide usable data regarding volume (as the width is directly related to the volume data). Therefore a new trading tool based on candlesticks that allow the trader to gain access to information about the volume is proposed. The approach is based on rescaling the volume directly to the price without the direct use of user settings. We will also see that this tool allow to create support and resistances as well as providing signals based on a breakout methodology.
Dekidaka-Ashi - Kakatte Koi Yo!
"Dekidaka" (出来高) mean "Volume" in a financial context, while "Ashi" (足) mean "leg" or "bar". In general methods based on candlesticks will have "Ashi" in their name.
Now that the name of the indicator has been explained lets see how it works, the indicator should be overlayed directly to a candlestick chart. The proposed method don't alter the shape of the candlesticks and allow to visualize any information given by the candles. As you can see on the figure below the candle body of the proposed tool only return the border of the candle, this allow to show the high/low wick of the candle.
The body size of the candle is based on two things : the absolute close/open difference, and the volume, if the absolute close/open difference is high and the volume is high then the body of the candle will be clearly visible, if the volume is high but the absolute close/open difference is low, then the body will be less visible. This approach is used because of the rescaling method used, the volume is divided by the sum between the current volume value and the precedent volume value, this rescale the volume in a (0,1) range, this result is multiplied by the absolute close/open difference and added/subtracted to the high/low price. The original approach was based on normalization using the rolling maximum, but this approach would have led to repainting.
You have access to certain settings that can help you obtain a better visualization, the first one being the body size setting, with higher values increasing the body amplitude.
In green body with size 2, in red with size 1. The smooth parameter will smooth the volume data before being used, this allow to create more visible bodies.
Here smooth = 100.
Making Bands From The Dekidaka-Ashi
This tool is made so it output two rescaled volume values, with the highest value being denoted as "Dekidaka-high" and the lowest one as "Dekidaka-low". In order to get bands we must use two moving averages, one using the Dekidaka-high as input and the other one using Dekidaka-low, the body size parameter should be fairly high, therefore i will hide the tool as it could cause trouble visualizing the bands.
Bands with both MA's of period 20 and the body size equal to 20. Larger periods of the MA's will require a larger amount of body size.
Breakout Signals
There is a wide variety of signals that can be made from candles, ones i personally like comes from the HA candles. The proposed tool is no exception and can produce a wide variety of signals. The signals generated are basic ones based on a breakout methodology, here is each signal with their associated label :
Strong Bullish signal "⇈" : The high price cross the Dekidaka-high and the closing price is greater than the opening price
Strong Bearish signal "⇊" : The low price cross the Dekidaka-low and the closing price is lower than the opening price
Weak Bullish signal "↑" : The high price cross the Dekidaka-high and the closing price is lower than the opening price
Weak Bearish signal "↓" : The low price cross the Dekidaka-low and the closing price is greater than the opening price
Uncertain "↕" : The high price cross the Dekidaka-high and the low price cross the the Dekidaka-low
In order to see the signals on the chart check the "Show signals" option. Note that such signals are not based on an advanced study, and even if they are based on a breakout methodology we can see that volatile movement rarely produce signals, therefore signals mostly occur during low volume/volatility periods, which isn't necessarily a great thing.
Conclusion
A trading tool based on candlesticks that aim to include volume information has been presented and a brief methodology has been introduced. A study of the signals generated is required, however i'am not confident at all on their accuracy, i could work on that in the future. We have also seen how to make bands from the tool.
Candlesticks remain a beautiful charting technique that can provide an enormous amount of information to the trader, and even if the accuracy of patterns based on candlesticks is subject to debates, we can all agree that candlesticks will remain the most widely used type of financial chart.
On a side note i mostly use a dark color for a bullish candle, and a light gray for a bearish candle, with the border color being of the same color as the bullish candle. This is in my opinion the best setup for a candlestick chart, as candles using the traditional green/red can kill the eyes and because this setup allow to apply a wide variety of colors to the plot of overlayed indicators without the fear of causing conflict with the candles color.
Thanks for reading ! :3 Nya
A Word
This morning i received some hateful messages on twitter, the users behind them certainly coming from tradingview, so lets be clear, i know i'am not the most liked person in this community, i know that perfectly, but no one merit to be receive hateful messages. I'am not responsible for the losses of peoples using my indicators, nor is tradingview, using technical indicators does not guarantee long term returns, your ability to be profitable will mostly be based on the quality and quantity of knowledge you have.

[NG] Indicator - Altcoin Alpha - v1(Created for Client)
Alpha (Unique price action of asset) indicator for ALTcoins implementation, taking `BINANCE:BTCUSDT` as the market reference. Can be improved by adding more BTC charts from more sources, so as to get a unified chart of BTC for market representation.
Set `alpha period` to a value, wherein you want to see the unique price action of the asset. For short term trend, a value of 24 is good for `1H` charts (1 day), and value of 168 is good for long term trends on `1H` charts (1 week trend).
Corresponding values of `beta period` should be `168` (1 week for 1 day alpha) and `720` (1 month for 1 week alpha period).
You can set `alpha` and `beta` period as per your requirements.
Regards,

Bitfinex Longs/Shorts [m59]This indicator diplays the total value of long positions and short positions for an asset on Bitfinex. For example, for the Bitfinex BTCUSD symbol, a value of 30000 longs means the total value of all margin long contracts on Bitfinex is 30000 BTC.
"resolve_error" is normal and expected, depending on how you're using the indicator. I use it on the BitMEX XBTUSD chart for BTC, which required the "Symbol Selection Method" option to be set to "Manual".
If there is Bitfinex long/short data available on tradingview for the symbol of your chart and you're on a Bitfinex chart or a chart with a matching symbol, "Auto" will work. Otherwise, you need to enter the symbol manually.
You can search for "Longs" or "Shorts" in the TradingView symbols to see what is available.
See the options for various ways to render this indicator to get the view you're looking for. You may also want to click the indicator's title with the downward triangle/arrow and select "Merge Up" to overlay the indicator with the price.
PRINTED VALUES
Longs Value (green) | Shorts Value (red) | Longs Percent (green) | Shorts Percent (red)
OPTIONS
- Symbol Selection Method:
- Auto: Use the current chart's symbol. Only works for pairs that have margin data available on TradingView, and only on Bitfinex charts or charts with the same pair names, i.e. ZRXETH, XMRBTC, etc)
- Manual: Enter the Bitfinex pair/symbol manually
- Manual Symbol Choice: The Bitfinex pair/symbol to use when Symbol Selection Method" is set to "Manual"
- Render Longs / Render Shorts: Rendering both longs and shorts at the same time causes both to be indiscernible due to scaling.
I suggest adding the indicator to your chart twice, then toggle off "Render Shorts" on one and toggle off "Render Longs" on the other one.
- Display Type:
- Absolute: Render the regular, absolute values of the positions.
- Percent: Render the percentage of longs and shorts of the total value of both. Higher resolution charts offer better views of this.
- Highlight Extremes: Change the background color when longs or shorts are considerably unbalanced (see "Extreme Theshold" and "Interpretation").
- Extreme Threshold: The percentage value at which longs or shorts are considered extreme. 60% longs can signify overbought and 60% shorts can signify oversold.
INTERPRETATION
See the excellent material by Bitcoin Trading Challenge on YouTube: www.youtube.com
- Background (unless "Highlight Extremes" option is disabled):
- Green: The percentage of shorts is equal to or greater than the extreme threshold.
- Red: The percentage of longs is equal to or greater than the extreme threshold.
Tick Tick BoomThis is THE tick tick boom method from the GOLD MINDS group!
When we enter a trade the line changes color.
If your charts are not in UTC time then you can adjust the UTC offset time. If your charts are in UTC-9 then set this to 9, if you are in UTC+1 set this to -1, if your charts are un UTC then set this to 0.
I noticed daily pivots, support, and resistance levels are pretty useful targets here. Uncheck the box if you would like to see the levels.
Many thanks to Dimitri Wallace!

EMA Spread Exhaustion DetectorEMA Spread Exhaustion – Reversal Scalper's Tool
Identifies trend exhaustion for high-probability counter-trend entries. Triggers when EMA(4/9/20) stack is fully aligned and spread stretches beyond ±ATR threshold. Ideal confluence for TDI hooks + strong rejection candles on 15s charts. Visual markers, fills, and alerts for quick scalps.

FVG Early AlertThis is an indicator for those who depend on FVGs for their trading strategy but are not typically staring at charts. This indicator will alert you when a candle closes higher than the previous candle's high or lower than the previous candle's low. In essence, it will alert you when the first 2 candles of a potential 3-candle Fair Value Gap pattern has printed so you can get to your desk and be there for the 3rd candle close.

Ultimate Major Contextual Dashboard (Multi-Asset)Overview : The Ultimate Major Dashboard is a performance-optimized market overview tool designed to provide a consolidated snapshot of the 7 major Forex pairs and Gold. It aggregates correlation, trend, momentum, and volatility data into a single, clean table, allowing users to view broader market context without switching charts.
Technical Logic & Components : This indicator utilizes a modular function to analyze EURUSD, GBPUSD, USDJPY, USDCHF, AUDUSD, USDCAD, NZDUSD, and XAUUSD across four key dimensions:
Intermarket Correlation (Pearson Coefficient): Uses ta.correlation() to compare each asset against the symbol currently on your main chart.
Logic: Values above 0.7 (Dark Green) suggest a strong positive relationship, while values below -0.7 (Dark Red) suggest inverse behavior. This is calculated over a rolling 50-period window to balance stability with current market sensitivity.
Trend Bias (EMA-200): Evaluates the long-term trend by checking price position relative to the 200-period Exponential Moving Average.
Visuals: An upward arrow (⬆) indicates price is above the EMA; a downward arrow (⬇) indicates it is below.
Momentum (RSI-14): Calculates the Relative Strength Index. The dashboard automatically highlights readings above 70 (OB) or below 30 (OS) to help identify potential momentum extremes.
Volatility (ATR-14): Displays the Average True Range as a reference for the current active range of each market, helping users compare volatility levels across the majors.
How to Interpret the Dashboard
Asset Alignment: Correlation values help identify when pairs are moving in "unison" versus when a specific currency is diverging from the group.
Directional Context: Combining the Trend (EMA) and Momentum (RSI) columns provides a quick view of whether a market is trending strongly or reaching an exhaustion point.
Volatility Benchmarking: The ATR values offer perspective on which pairs are currently the most active, assisting in market comparison based on volatility preference.
Data Handling & Customization
Multi-Symbol Sync: Data is fetched using request.security(). The calculations are synchronized with the chart's current bar state for real-time accuracy.
Dynamic TF: Users can select the analysis timeframe (60, 240, D, W) via the settings menu.
Flexibility: The dashboard position can be toggled between all four corners of the chart to avoid overlapping with price action.
Disclaimer
This tool is provided for analytical and educational purposes only. It does not generate trading signals and should not be considered financial advice.

IV Rank & Percentile Suite V1.0What This Indicator Does
The IV Rank & Percentile Suite provides the volatility context options traders need to time entries. It calculates two complementary metrics—IV Rank and IV Percentile—using historical volatility as a proxy, then displays clear visual zones to identify favorable conditions for premium selling strategies.
Stop guessing if volatility is "high" or "low." This indicator tells you exactly where current volatility sits relative to recent history.
The Two Metrics Explained
IV Rank (0-100) Measures where current volatility sits within its 52-week high-low range.
IV Rank = (Current HV - 52w Low) / (52w High - 52w Low) × 100
70 means current volatility is 70% of the way between the yearly low and high
Sensitive to extreme spikes (a single high reading affects the range)
IV Percentile (0-100) Measures what percentage of days in the lookback period had lower volatility than today.
IV Percentile = (Days with lower HV / Total days) × 100
70 means volatility was lower than today on 70% of days in the past year
More stable, less affected by outlier spikes
Why Both?
IV Rank reacts faster to volatility changes. IV Percentile is more stable and statistically robust. When both agree (e.g., both above 50), you have stronger confirmation. Divergence between them can signal transitional periods.
Zone System
The indicator divides readings into three zones:
Zone ------- Default Range ---- Meaning ------------------ Premium Selling
🟢 High ≥ 50 Elevated volatility Favorable
🟡 Neutral 25-50 Normal volatility Selective
🔴 Low ≤ 25 Compressed volatility Avoid
An additional Extreme threshold (default 75) highlights prime conditions when volatility is significantly elevated.
Zone thresholds are fully customizable in settings.
How to Use It
For Premium Sellers (Iron Condors, Credit Spreads, Strangles)
Wait for IV Rank to enter the green zone (≥50)
Confirm IV Percentile agrees (also elevated)
Enter premium selling positions when both metrics align
Avoid initiating new positions when in the red zone
For Premium Buyers (Long Options, Debit Spreads)
Low IV Rank/Percentile means cheaper options
Red zone can favor directional debit strategies
Avoid buying premium when both metrics are in the green zone
General Principle:
Sell premium when volatility is high (it tends to revert to mean). Buy premium when volatility is low (if you have a directional thesis).
Inputs
Volatility Calculation
HV Period — Lookback for historical volatility calculation (default: 20)
Trading Days/Year — 252 for stocks, 365 for crypto
Lookback Periods
IV Rank Lookback — Period for high/low range (default: 252 = 1 year)
IV Percentile Lookback — Period for percentile calculation (default: 252)
Zone Thresholds
High IV Zone — Readings above this are highlighted green (default: 50)
Low IV Zone — Readings below this are highlighted red (default: 25)
Extreme High — Threshold for "prime" conditions alert (default: 75)
Display Options
Toggle IV Rank, IV Percentile, and raw HV display
Show/hide zone backgrounds
Show/hide info panel
Panel position selection
Info Panel
The panel displays:
Field ------- Description
IV Rank ------- Current reading with color coding
IV Pctl ------- Current percentile with color coding
HV 20d ------- Raw historical volatility percentage
52w Range ------- Lowest to highest HV in lookback period
Zone ------- Current zone status
Premium ------- Signal quality for premium selling
Lookback ------- Days used for calculations
R/P Spread ------- Difference between Rank and Percentile
Alerts
Six alerts are available:
Zone Transitions
IV Entered High Zone — Favorable for premium selling
IV Reached Extreme Levels — Prime conditions
IV Dropped to Low Zone — Caution for premium sellers
Threshold Crosses
IV Rank Crossed Above High Threshold
IV Rank Crossed Below Low Threshold
IV Percentile Above 75
IV Percentile Below 25
Set up alerts to get notified when conditions change without watching charts.
Technical Notes
Volatility Calculation Method
This indicator uses close-to-close historical volatility as an IV proxy:
Calculate log returns: ln(Close / Previous Close)
Take standard deviation over HV Period
Annualize: multiply by √(Trading Days)
This method correlates well with implied volatility for most liquid instruments. On highly liquid options underlyings (SPY, QQQ, major stocks), HV and IV tend to move together, making this a reliable proxy for IV Rank analysis.
Non-Repainting
All calculations use confirmed bar data. Values are fixed once a bar closes.
Lookback Requirement
The indicator needs sufficient history to calculate accurately. For a 252-day lookback, ensure your chart has at least 300+ bars of data.
Best Used On
ETFs: SPY, QQQ, IWM, DIA
Indices: SPX, NDX
High-volume stocks: AAPL, TSLA, NVDA, AMD, META
Timeframe: Daily (recommended), Weekly for longer-term view
The indicator works on any instrument but is most meaningful on underlyings with active options markets.
Important Notes
⚠️ This indicator uses historical volatility as a proxy for implied volatility. While HV and IV are correlated, they are not identical. For precise IV data, consult your options broker's platform.
⚠️ High IV Rank does not guarantee profitable premium selling. It indicates favorable conditions, not guaranteed outcomes. Position sizing and risk management remain essential.
⚠️ Past volatility patterns do not guarantee future behavior. Volatility regimes can shift, and historical ranges may not predict future ranges.
Suggested Workflow
Add to daily chart of your preferred underlying
Set up alert for "IV Entered High Zone"
When alerted, check both IV Rank and IV Percentile
If both elevated, evaluate premium selling opportunities
Use your broker's actual IV data for final entry decisions
Questions? Leave a comment below.

[GYTS] VolatilityToolkit LibraryVolatilityToolkit Library
🌸 Part of GoemonYae Trading System (GYTS) 🌸
🌸 --------- INTRODUCTION --------- 🌸
💮 What Does This Library Contain?
VolatilityToolkit provides a comprehensive suite of volatility estimation functions derived from academic research in financial econometrics. Rather than relying on simplistic measures, this library implements range-based estimators that extract maximum information from OHLC data — delivering estimates that are 5–14× more efficient than traditional close-to-close methods.
The library spans the full volatility workflow: estimation, smoothing, and regime detection.
💮 Key Categories
• Range-Based Estimators — Parkinson, Garman-Klass, Rogers-Satchell, Yang-Zhang (academically-grounded variance estimators)
• Classical Measures — Close-to-Close, ATR, Chaikin Volatility (baseline and price-unit measures)
• Smoothing & Post-Processing — Asymmetric EWMA for differential decay rates
• Aggregation & Regime Detection — Multi-horizon blending, MTF aggregation, Volatility Burst Ratio
💮 Originality
To the best of our knowledge, no other TradingView script combines range-based estimators (Parkinson, Garman-Klass, Rogers-Satchell, Yang-Zhang), classical measures, and regime detection tools in a single package. Unlike typical volatility implementations that offer only a single method, this library:
• Implements four academically-grounded range-based estimators with proper mathematical foundations
• Handles drift bias and overnight gaps, issues that plague simpler estimators in trending markets
• Integrates with GYTS FiltersToolkit for advanced smoothing (10 filter types vs. typical SMA-only)
• Provides regime detection tools (Burst Ratio, MTF aggregation) for systematic strategy integration
• Standardises output units for seamless estimator comparison and swapping
🌸 --------- ADDED VALUE --------- 🌸
💮 Academic Rigour
Each estimator implements peer-reviewed methodologies with proper mathematical foundations. The library handles aspects that are easily missed, e.g. drift independence, overnight gap adjustment, and optimal weighting factors. All functions include guards against edge cases (division by zero, negative variance floors, warmup handling).
💮 Statistical Efficiency
Range-based estimators extract more information from the same data. Yang-Zhang achieves up to 14× the efficiency of close-to-close variance, meaning you can achieve the same estimation accuracy with far fewer bars — critical for adapting quickly to changing market conditions.
💮 Flexible Smoothing
All estimators support configurable smoothing via the GYTS FiltersToolkit integration. Choose from 10 filter types to balance responsiveness against noise reduction:
• Ultimate Smoother (2-Pole / 3-Pole) — Near-zero lag; the 3-pole variant is a GYTS design with tunable overshoot
• Super Smoother (2-Pole / 3-Pole) — Excellent noise reduction with minimal lag
• BiQuad — Second-order IIR filter with quality factor control
• ADXvma — Adaptive smoothing based on directional volatility
• MAMA — Cycle-adaptive moving average
• A2RMA — Adaptive autonomous recursive moving average
• SMA / EMA — Classical averages (SMA is default for most estimators)
Using Infinite Impulse Response (IIR) filters (e.g. Super Smoother, Ultimate Smoother) instead of SMA avoids the "drop-off artefact" where volatility readings crash when old spikes exit the window.
💮 Plug-and-Play Integration
Standardised output units (per-bar log-return volatility) make it trivial to swap estimators. The annualize() helper converts to yearly volatility with a single call. All functions work seamlessly with other GYTS components.
🌸 --------- RANGE-BASED ESTIMATORS --------- 🌸
These estimators utilise High, Low, Open, and Close prices to extract significantly more information about the underlying diffusion process than close-only methods.
💮 parkinson()
The Extreme Value Method -- approximately 5× more efficient than close-to-close, requiring about 80% less data for equivalent accuracy. Uses only the High-Low range, making it simple and robust.
• Assumption: Zero drift (random walk). May be biased in strongly trending markets.
• Best for: Quick volatility reads when drift is minimal.
• Parameters: smoothing_length (default 14), filter_type (default SMA), smoothing_factor (default 0.7)
Source: Parkinson, M. (1980). The Extreme Value Method for Estimating the Variance of the Rate of Return. Journal of Business, 53 (1), 61–65. DOI
💮 garman_klass()
Extends Parkinson by incorporating Open and Close prices, achieving approximately 7.4× efficiency over close-to-close. Implements the "practical" analytic estimator (σ̂²₅) which avoids cross-product terms whilst maintaining near-optimal efficiency.
• Assumption: Zero drift, continuous trading (no gaps).
• Best for: Markets with minimal overnight gaps and ranging conditions.
• Parameters: smoothing_length (default 14), filter_type (default SMA), smoothing_factor (default 0.7)
Source: Garman, M.B. & Klass, M.J. (1980). On the Estimation of Security Price Volatilities from Historical Data. Journal of Business, 53 (1), 67–78. DOI
💮 rogers_satchell()
The drift-independent estimator correctly isolates variance even in strongly trending markets where Parkinson and Garman-Klass become significantly biased. Uses the formula: ln(H/C)·ln(H/O) + ln(L/C)·ln(L/O).
• Key advantage: Unbiased regardless of trend direction or magnitude.
• Best for: Trending markets, crypto (24/7 trading with minimal gaps), general-purpose use.
• Parameters: smoothing_length (default 14), filter_type (default SMA), smoothing_factor (default 0.7)
Source: Rogers, L.C.G. & Satchell, S.E. (1991). Estimating Variance from High, Low and Closing Prices. Annals of Applied Probability, 1 (4), 504–512. DOI
💮 yang_zhang()
The minimum-variance composite estimator — both drift-independent AND gap-aware. Combines overnight returns, open-to-close returns, and the Rogers-Satchell component with optimal weighting to minimise estimator variance. Up to 14× more efficient than close-to-close.
• Parameters: lookback (default 14, minimum 2), alpha (default 1.34, optimised for equities).
• Best for: Equity markets with significant overnight gaps, highest-quality volatility estimation.
• Note: Unlike other estimators, Yang-Zhang does not support custom filter types — it uses rolling sample variance internally.
Source: Yang, D. & Zhang, Q. (2000). Drift-Independent Volatility Estimation Based on High, Low, Open, and Close Prices. Journal of Business, 73 (3), 477–491. DOI
🌸 --------- CLASSICAL MEASURES --------- 🌸
💮 close_to_close()
Classical sample variance of logarithmic returns. Provided primarily as a baseline benchmark — it is approximately 5–8× less efficient than range-based estimators, requiring proportionally more data for the same accuracy.
• Parameters: lookback (default 14), filter_type (default SMA), smoothing_factor (default 0.7)
• Use case: Comparison baseline, situations requiring strict methodological consistency with academic literature.
💮 atr()
Average True Range -- measures volatility in price units rather than log-returns. Directly interpretable for stop-loss placement (e.g., "2× ATR trailing stop") and handles gaps naturally via the True Range formula.
• Output: Price units (not comparable across different price levels).
• Parameters: smoothing_length (default 14), filter_type (default SMA), smoothing_factor (default 0.7)
• Best for: Position sizing, trailing stops, any application requiring volatility in currency terms.
Source: Wilder, J.W. (1978). New Concepts in Technical Trading Systems . Trend Research.
💮 chaikin_volatility()
Rate of Change of the smoothed trading range. Unlike level-based measures, Chaikin Volatility shows whether volatility is expanding or contracting relative to recent history.
• Output: Percentage change (oscillates around zero).
• Parameters: length (default 10), roc_length (default 10), filter_type (default EMA), smoothing_factor (default 0.7)
• Interpretation: High values suggest nervous, wide-ranging markets; low values indicate compression.
• Best for: Detecting volatility regime shifts, breakout anticipation.
🌸 --------- SMOOTHING & POST-PROCESSING --------- 🌸
💮 asymmetric_ewma()
Differential smoothing with separate alphas for rising versus falling volatility. Allows volatility to spike quickly (fast reaction to shocks) whilst decaying slowly (stability). Essential for trailing stops that should widen rapidly during turbulence but narrow gradually.
• Parameters: alpha_up (default 0.1), alpha_down (default 0.02).
• Note: Stateful function — call exactly once per bar.
💮 annualize()
Converts per-bar volatility to annualised volatility using the square-root-of-time rule: σ_annual = σ_bar × √(periods_per_year).
• Parameters: vol (series float), periods (default 252 for daily equity bars).
• Common values: 365 (crypto), 52 (weekly), 12 (monthly).
🌸 --------- AGGREGATION & REGIME DETECTION --------- 🌸
💮 weighted_horizon_volatility()
Blends volatility readings across short, medium, and long lookback horizons. Inspired by the Heterogeneous Autoregressive (HAR-RV) model's recognition that market participants operate on different time scales.
• Default horizons: 1-bar (short), 5-bar (medium), 22-bar (long).
• Default weights: 0.5, 0.3, 0.2.
• Note: This is a weighted trailing average, not a forecasting regression. For true HAR-RV forecasting, it would be required to fit regression coefficients.
Inspired by: Corsi, F. (2009). A Simple Approximate Long-Memory Model of Realized Volatility. Journal of Financial Econometrics .
💮 volatility_mtf()
Multi-timeframe aggregation for intraday charts. Combines base volatility with higher-timeframe (Daily, Weekly, Monthly) readings, automatically scaling HTF volatilities down to the current timeframe's magnitude using the square-root-of-time rule.
• Usage: Calculate HTF volatilities via request.security() externally, then pass to this function.
• Behaviour: Returns base volatility unchanged on Daily+ timeframes (MTF aggregation not applicable).
💮 volatility_burst_ratio()
Regime shift detector comparing short-term to long-term volatility.
• Parameters: short_period (default 8), long_period (default 50), filter_type (default Super Smoother 2-Pole), smoothing_factor (default 0.7)
• Interpretation: Ratio > 1.0 indicates expanding volatility; values > 1.5 often precede or accompany explosive breakouts.
• Best for: Filtering entries (e.g., "only enter if volatility is expanding"), dynamic risk adjustment, breakout confirmation.
🌸 --------- PRACTICAL USAGE NOTES --------- 🌸
💮 Choosing an Estimator
• Trending equities with gaps: yang_zhang() — handles both drift and overnight gaps optimally.
• Crypto (24/7 trading): rogers_satchell() — drift-independent without the lag of Yang-Zhang's multi-period window.
• Ranging markets: garman_klass() or parkinson() — simpler, no drift adjustment needed.
• Price-based stops: atr() — output in price units, directly usable for stop distances.
• Regime detection: Combine any estimator with volatility_burst_ratio().
💮 Output Units
All range-based estimators output per-bar volatility in log-return units (standard deviation). To convert to annualised percentage volatility (the convention in options and risk management), use:
vol_annual = annualize(yang_zhang(14), 252) // For daily bars
vol_percent = vol_annual * 100 // Express as percentage
💮 Smoothing Selection
The library integrates with FiltersToolkit for flexible smoothing. General guidance:
• SMA: Classical, statistically valid, but suffers from "drop-off" artefacts when spikes exit the window.
• Super Smoother / Ultimate Smoother / BiQuad: Natural decay, reduced lag — preferred for trading applications.
• MAMA / ADXvma / A2RMA: Adaptive smoothing, sometimes interesting for highly dynamic environments.
💮 Edge Cases and Limitations
• Flat candles: Guards prevent log(0) errors, but single-tick bars produce near-zero variance readings.
• Illiquid assets: Discretisation bias causes underestimation when ticks-per-bar is small. Use higher timeframes for more reliable estimates.
• Yang-Zhang minimum: Requires lookback ≥ 2 (enforced internally). Cannot produce instantaneous readings.
• Drift in Parkinson/GK: These estimators overestimate variance in trending conditions — switch to Rogers-Satchell or Yang-Zhang.
Note: This library is actively maintained. Suggestions for additional estimators or improvements are welcome.

VWAP Bias (STRONG ONLY) + Alerts (Time Window)VWAP Bias + NO TRADE Discipline Label
Clean, execution-focused indicator that removes decision noise.
Shows LONG / SHORT bias based on price vs VWAP, upgraded to STRONG or WEAK using VWAP slope and EMA(9/20) alignment.
A separate NO TRADE label appears when conditions are weak or neutral, enforcing discipline and preventing low-quality entries.
Designed for day trading VWAP pullbacks and momentum, especially on 1m–5m charts.
No oscillators, no clutter — just directional clarity and risk control.

HTF Double BOS + Inducement (XAU) ebenThis indicator is a market structure and inducement scanner designed to assist discretionary traders.
It identifies:
• Higher-timeframe market regime using a double Break of Structure (BOS) on the Daily and 4H timeframes.
• Lower-timeframe Break of Structure (BOS).
• Valid inducement based on a minimum 70% retracement rule.
The script is intended to be used as a confirmation and alert tool, not as a standalone buy/sell system.
⸻
How It Works
1. The indicator first confirms directional bias using Daily and 4H BOS alignment.
2. When higher-timeframe bias is valid, it scans the active chart timeframe for:
• a Break of Structure,
• followed by inducement using a retracement-based rule.
3. When conditions align, the script displays a visual marker and can trigger an alert.
⸻
Important Notes
• This indicator does not predict price.
• It does not automatically execute trades.
• It should be used in conjunction with proper risk management and personal analysis.
• Signals may appear less frequently due to strict filtering logic.
⸻
Recommended Usage
• Best suited for trend-following strategies.
• Works well on Gold (XAUUSD) and other liquid markets.
• Designed for use on 30m, 15m, and 5m charts.
• Alerts should be treated as areas of interest, not direct trade instructions.
⸻
Disclaimer
This script is provided for educational and analytical purposes only.
The author is not responsible for trading losses. Use at your own risk.

BE-QuantFlow: Adaptive Momentum Trading█ Overview: QuantFlow: Adaptive Momentum Trading
QuantFlow is a sophisticated algorithmic momentum trading method designed specifically for indices and high-beta stocks. However, its logic is universal; with appropriate parameter tuning, it adapts to various asset classes and timeframes.
While the standard momentum indicators (like RSI or MACD) simply measure how fast price is moving (Velocity), QuantFlow analyzes the quality and conviction of the trend . Features like Dynamic Volatility Filtering and Trend Shielding, combined with volatility weighting and a "Dual-Line" approach to distinguish between a sustainable institutional trend and a temporary retail spike, make the indicator unique and more powerful.
█ Why QuantFlow ?
Quant (The Engine): This replaces subjective guessing with objective math.
Instead of just seeing that the price is "up," we measure "how it got there". For example, a stock that rises 1 currency value every day for 10 days (smooth trend) gets a much higher score than a stock that jumps 10 currency value in one minute and does nothing else (erratic noise). This mathematical rigor provides the structure.
█ Core Logic & Philosophy
To understand how QuantFlow calculates momentum, imagine a "Tug-of-War" between Buyers (Bulls) and Sellers (Bears). Most indicators (like RSI) use a single line. If RSI is at 50, it means "Neutral." But "Neutral" can mean two very different things:
Peace: Nothing is happening. No one is buying or selling.
War: Buyers are pushing hard, but Sellers are pushing back equally hard. Volatility is massive.
A single line hides this reality. QuantFlow splits the market into two separate scores:
Bull Score (Green Line): How hard are the buyers pushing?
Bear Score (Red Line): How hard are the sellers pushing?
The Layman's Advantage:
If both lines are low = Sleepy Market (Avoid).
If Green is high and Red is low = Clean Uptrend (Buy).
If Red is high and Green is low = Clean Downtrend (Sell).
If both lines are high = Chaos/War Zone (Wait).
█ How it Weight "Sustenance" (The Critical Quality Check)
This is the most unique aspect of QuantFlow: Trend direction alone is not enough; Sustenance is weighed equally . Standard indicators treat every 10 currency value movements the same way with no distinction. However, QuantFlow asks, "Did you hold the ground you gained?"
Scenario A (High Sustenance) : A stock opens at 100, marches to 110, and closes at 110.
Verdict : Buyers pushed up and sustained the price.
QuantFlow Weight : 100%. This is a high-quality move.
Scenario B (Low Sustenance) : A stock opens at 100, spikes to 110, but gets sold off to close at 102.
Verdict : Buyers pushed up (Trend is Up), but failed to sustain it (Long Wick).
QuantFlow Weight : 20%. This is treated as "Noise" or a trap.
By mathematically weighing the Close Location Value (where the candle closes relative to its high/low), QuantFlow filters out "Gap-and-Fade" traps and exhaustion spikes that fool traditional indicators.
Comparisons: QuantFlow vs. The Rest
Calculation Logic : Standard RSI/MACD measures simple price change over time. QuantFlow measures Price Change 'times (x)' Conviction (Sustenance Weighting).
Visual Output : Standard tools show a single line (0-100), often hiding market conflict. QuantFlow displays Dual Lines (Bull vs Bear Intensity) to reveal the true state of the battle.
Trap Handling : Standard indicators are often fooled by sharp spikes. QuantFlow ignores "Gap-and-Fade" moves with poor closing conviction.
Adaptability : Standard tools use static levels (e.g., Overbought > 70). QuantFlow uses Dynamic Bands that adjust automatically to recent volatility.
█ Dynamic Volatility Filtering
Unlike standard indicators that use fixed levels (e.g., "Buy if RSI > 50"), QuantFlow acknowledges that "50" means something different in a quiet market versus a crashing market. This section explains the statistical engine driving the signals.
The Problem with Static Levels : In a low-volatility environment, a momentum score of 55 might indicate a massive breakout. In a high-volatility environment, a score of 55 might just be random noise. A fixed threshold cannot handle both scenarios.
The Solution: Adaptive Statistics : The script maintains a memory of the Momentum Events. It doesn't just look at price; it looks at where the momentum occurred in the past and draws a "Noise Zone" (Grey Band). This logic acts as a "Smart Gatekeeper" for trade entries:
Scenario A: Inside the Noise (The Filter)
If a new momentum signal happens inside the Noise Zone, the script assumes it is likely chop or noise.
Action : It forces a wait period. The signal is delayed until the trend sustains itself for Confirm Bars; else the signal is cancelled. This filters out ~70% of false signals in sideways markets.
Scenario B: Outside the Noise (The Breakout)
If a new momentum signal happens outside the Noise Zone (or the momentum score smashes through the Upper Band), it is statistically significant (an outlier event).
Action: It triggers an Immediate Entry. No waiting is required because the move is powerful enough to escape the historical noise zone.
█ The ⚠️ "Warning" System (Heads-up for Smart Reversals)
While you are directional if there is potential reversal signal, it provides the heads-up warning for a better decision-making
█ Special Utility: Ghost Mode
For intraday traders, the biggest disruption to "Flow" is the mandatory broker square-off at 3:15 PM (considering Indian Market). Often, a trend continues overnight, and the trader misses the gap-up opening the next morning because their algo was flat.
Ghost Mode is a unique feature that runs silently in the background:
At Square-off: The strategy closes your official position to satisfy the broker.
In the Background: It keeps the trade "alive" virtually (Ghost).
Next Morning: If the market opens in the trend's favor, the strategy re-enters the trade automatically. This approach ensures you capture the full swing of the trend, even if you are forced to exit at the previous session.
█ Advice on this indicator:
Parameter Calibration: The default settings are optimized for BankNifty on 5-minute charts. If you trade stocks, crypto, commodities, or any higher timeframes (e.g., 15-min or hourly), you must adjust these.
Low Volatility Assets: Reduce Stop Multiplier to 2.0.
High Volatility Assets: Increase Momentum Lookback to 50 to filter noise.
Confluence (Additional Confirmation): While QuantFlow is a complete system, using it alongside Key Support/Resistance Levels or Volume Profile provides the highest probability setups.

Simple ATR Trailing StopThis Pine Script v6 indicator overlays a Chandelier Exit-style ATR trailing stop on TradingView charts. It calculates volatility using ATR(14) with a customizable multiplier (default 3.0), plotting green long stops below highs and red short stops above lows. Ideal for swing trading, it dynamically adjusts exits to lock in profits while adapting to market volatility—toggle lines for longs/shorts as needed.

Simple ATR Trailing StopThis Pine Script v6 indicator overlays a Chandelier Exit-style ATR trailing stop on TradingView charts. It calculates volatility using ATR(14) with a customizable multiplier (default 3.0), plotting green long stops below highs and red short stops above lows. Ideal for swing trading, it dynamically adjusts exits to lock in profits while adapting to market volatility—toggle lines for longs/shorts as needed.

Session Lines + ATR AnalyticsDescription:
Overview:
A comprehensive trading tool that combines session visualization with real-time ATR analytics. Perfect for intraday traders who need precise timing and volatility measurements.
Features:
Session Markers
Visual indicators for Asia (00:00-08:00), London (07:00-15:00), and New York (13:00-21:00) trading sessions
Color-coded session bands at the bottom of the chart for quick identification
Fully customizable session times and colors
Hourly Vertical Lines
Automatic vertical lines drawn at the start of each hour (works on 1-minute charts)
Multiple line styles available: solid, dotted, dashed, arrows
Adjustable color and width settings
Helps identify exact timing of price movements
ATR Tool
Real-time candle range measurement
Modified ATR calculation (excludes current candle for accuracy)
Customizable ATR length and multiplier
Live countdown timer showing time remaining in current timeframe
Floating label with adjustable offset and styling
Date & Timeframe Display
Bottom-right watermark showing current date in LA timezone
Displays current timeframe with proper units (1m, 5m, 1H, etc.)
Useful for backtesting to confirm you're viewing the correct date
Best Used For:
Day trading and scalping (especially on 1-minute charts)
Session-based trading strategies
Volatility analysis using ATR
Time-based entry and exit planning
Settings:
All elements are fully customizable through the indicator settings panel, including colors, sizes, visibility toggles, and calculation parameters.

Sensex / Nifty Trend + Pullback (High Probability)Below is a Sensex / Nifty–optimized, error-proof, copy-paste ready Pine Script (v5) using a Trend + Pullback strategy.
This is designed for index trading, avoids repainting, and works cleanly on 15m / 30m / 60m charts.

Anya1This script is a **Trend-Following Momentum Strategy** specifically designed for **Gold (XAUUSD)** but applicable to other assets. It combines an oscillator (to find entry points) with two moving averages (to ensure you are trading with the trend).
Here is a breakdown of how the logic works and how to read the signals on your chart.
---
### 1. The Strategy "Gears" (The Filters)
The script uses a "triple-filter" system. A signal is only generated when all three of these conditions click into place at the exact same time:
* **Gear 1: Momentum (Cipher Twister):** This oscillator looks for "turning points." It identifies when the market is exhausted.
* **Buy:** The momentum lines cross while **below the zero line** (recovering from oversold).
* **Sell:** The momentum lines cross while **above the zero line** (dropping from overbought).
* **Gear 2: Medium-Term Trend (MA 25):** The price must be on the "correct" side of the **Yellow Line**. This ensures that the immediate price action is moving in your favor.
* **Gear 3: Macro Trend (MA 150):** This is the final gatekeeper (the **White Line**). You are forbidden from buying if the price is below this line, and forbidden from selling if it is above. This keeps you on the right side of the "Big Picture."
---
### 2. How to Read the Signals
| Signal | Chart Visual | Rule |
| --- | --- | --- |
| **BUY** | **Green "BUY" Label** | Price is above the Yellow & White lines + Oscillator crossed below zero. |
| **SELL** | **Red "SELL" Label** | Price is below the Yellow & White lines + Oscillator crossed above zero. |
**Visual Confirmation:** The script will also highlight the background in **Lime** for a Buy and **Red** for a Sell to make it impossible to miss.
---
### 3. Risk Management (The Exit)
This version is built as a **Strategy**, meaning it has a built-in "Exit Plan" for every trade:
* **Stop Loss (SL):** 100 Pips ($10.00 move in Gold).
* **Take Profit (TP):** 120 Pips ($12.00 move in Gold).
When a trade is entered, TradingView will automatically track the price. If it hits your target, the trade closes in profit. If it hits your stop, it closes to protect your capital.
---
### 5. Best Use Cases
* **Trending Markets:** This script thrives when Gold is in a clear uptrend or downtrend.
* **Timeframes:** It is most effective on the **15-minute (15M)** or **1-hour (1H)** charts. Lower timeframes (like the 1M) may hit the Stop Loss too frequently due to market noise.
**Would you like me to add a "Trailing Stop" feature, so the strategy locks in profits automatically as the price moves in your favor?**

Algomist - Adaptive Velocity Cross🚀 Algomist: The Adaptive Velocity Cross (AVC)
Automate Your Edge
This strategy transcends the limitations of classic Moving Average (MA) crossovers. The Adaptive Velocity Cross (AVC) is a state-of-the-art trend-following system designed for automated execution, filtering out low-probability whipsaws and prioritizing high-momentum breakouts in volatile markets.
It's not just a signal generator; it's a fully automated, risk-managed trading plan that delivers structured trade signals directly to your Algomist account.
🔥 Key Features & Technology
Adaptive Hull Moving Averages (HMA): Utilizes the Hull MA to significantly reduce lag compared to standard EMAs and SMAs. The faster and slower HMAs provide a highly responsive gauge of short-term and medium-term trend direction.
Multi-Layer Volatility Filtering: Trades are strictly prohibited during flat, low-volatility market conditions.
Current Timeframe Filter (ATRMinFilter): Ensures trades only fire when current market momentum is strong enough to carry the trend.
Higher Timeframe Filter: Checks the ATR on a higher timeframe (e.g., 1H) to confirm the structural trend strength, preventing entries during tight squeezes.
Visual Trend Velocity: The space between the Fast (Blue) and Slow (Pink) HMAs is colored and filled, providing an immediate visual cue for trend direction and strength (width of the band).
Asymmetric Risk Management: Uses the dynamic Average True Range (ATR) to calculate Stop Loss and Take Profit levels, ensuring risk and reward are proportional to current market volatility.
⚙️ How It Works (The Logic)
The AVC only executes a trade when all three high-conviction criteria are met:
Trend Signal: The Fast $\text{HMA}$ crosses the Slow $\text{HMA}$ (Crossover).
Volatile Market Confirmation: The market must be sufficiently volatile on both the current timeframe and the higher structural timeframe ($\text{ATR}$ filters passed).
Risk Management: A defined $\text{SL}$ (Stop Loss) and $\text{TP}$ (Take Profit) are calculated based on the current market $\text{ATR}$ to manage the position before entry.
🤖 Automation Ready
The strategy is built with automation as the priority. Upon a confirmed entry, the script sends a cleanly formatted JSON string via a TradingView Webhook alert to Algomist. Create your account and get your own web hook @ www.algomist.app
Example Alert Output:
{
"symbol": "ETHUSDC",
"side": "LONG",
"entry_price": 67500.0,
"stop_loss": 66000.0,
"take_profit": 70000.0,
"timestamp": 1766715660462
}
This signal is ready for immediate consumption by your Algomist execution engine, ensuring lightning-fast and error-free order placement.
📊 Recommended Use
Asset Class: Highly effective on high-liquidity, high-volatility assets (e.g., Crypto Majors, Forex Pairs, Indices).
Timeframes: Works best on 1m to 15 min charts.
Risk Profile: Medium-to-High frequency trend-following system.
Disclaimer: The strategy code provided is for informational and educational purposes. Past performance is not indicative of future results. Always backtest and forward-test any automated strategy extensively before using real capital.

GCM Quantum Strike: VMDPB & MarubozuTitle Field: GCM Quantum Strike: VMDPB & Marubozu
Description:
GCM Quantum Strike is a comprehensive technical analysis suite designed to visualize Momentum (Marubozu), Trend (Ribbons/DEMA), and Key Levels (PDHL/VWAP) on a single overlay.
The core innovation of this script is the "Phantom Mode" Marubozu Engine, a custom coding technique designed to solve the issue of color transparency mixing on overlay charts.
Originality & Concept
Standard scripts often struggle when highlighting specific candle patterns; drawing a highlight over an existing candle results in muddy, mixed colors due to transparency blending.
GCM Quantum Strike solves this using a unique logic flow:
1. Detection: It scans price action for Marubozu candles based on strict ATR (Volatility) and Percentage (Body/Wick) requirements.
2. Phantom Mode: When a signal is found, the script programmatically turns the original chart bar 100% invisible (color.rgb(0,0,0,100)).
3. Reconstruction: It instantly draws a new, Solid (100% Opacity) custom candle in that exact space.
This results in crisp, "Quantum" styled signals that pop off the screen without blending with the background or previous themes.
How it Works & Key Features
1. The Marubozu Engine (GM / RM)
• Logic: A candle is identified as a Marubozu if:
o Size: The range exceeds a user-defined multiple of the ATR (14).
o Body: Occupies >80% (default) of the total range.
o Wicks: Occupy <10% (default) of the total range.
• Visuals:
o GM (Green Marubozu): Signals strong Bullish influx.
o RM (Red Marubozu): Signals strong Bearish influx.
o Both are rendered in solid Neon Green/Red.
2. Trend Ribbons & Averages
• EMA Ribbons: A visual ribbon formed by EMA 5, 9, 15, and SMA 20. The color intensity changes based on the slope alignment, helping identify the strength of the immediate trend.
• VWMA 20 (Volume Weighted): Plots in Light Blue (Rising) or Orange (Falling). This helps confirm if price moves are backed by volume.
• DEMA 100 (Step-Line): A Double EMA plotted as a step-line to act as a clear, non-noisy baseline for the long-term trend.
3. Institutional Levels
• PDH / PDL: The Previous Day's High and Low are fetched from daily data (non-repainting) and plotted as "Cross" markers. These often act as strong intraday magnets or reversal points.
• VWAP: The classic Session Volume Weighted Average Price (Yellow).
• Bollinger Bands: Standard 2.0 deviation bands to visualize volatility expansion and contraction.
How to Use
This script is designed for "Confluence Trading." Do not rely on one signal alone; look for agreement among the indicators.
1. The Setup: Wait for the EMA Ribbons and VWMA 20 to align in color (e.g., Green/Blue for Buy).
2. The Trigger: Look for a GM (Green Marubozu) label. This indicates a high-momentum breakout or trend continuation candle.
3. The Validation: Ensure the GM candle closes outside the EMA ribbons or above the VWAP.
4. The Targets: Use the PDH (Red Crosses) or Upper Bollinger Band as logical take-profit zones.
Settings
• Marubozu Settings: Fully adjustable. You can change the Min Body %, Max Shadow %, and ATR Multiplier to filter out smaller candles during choppy markets.
• Moving Averages: Adjust lengths for VWMA, SMA, and DEMA.
• Toggles: Every component (PDHL, BB, Ribbons) can be toggled on/off to keep your chart clean.

deKoder | Whale Prints [WP]deKoder | Whale Prints | Large Trade Orderflow Detection
This open-source indicator is a clean, precision tool for revealing hidden large-volume activity directly on your chart. By scanning ultra-low timeframes while you view higher ones, it projects statistically significant volume spikes as intuitive markers giving you a clear window into institutional orderflow without visually overwhelming the price action.
Key Features & Strengths
True Intra-Bar Detection | Monitors lower timeframes down to 1-second bars, catching aggressive block trades and absorption that occur within a single higher-TF candle.
Accurate Trade Levels | Markers are placed at the actual hl2 price of the aggressive lower-TF bar, providing a far more accurate estimate of where the large trade executed than typical mid-candle approximations.
Multiple Trades Per Bar | If several significant volume spikes occur inside one higher-TF candle, all qualifying levels are displayed individually – offering greater granularity and context.
Adaptive Thresholding | Uses higher-TF volume standard deviation (stable baseline) intelligently scaled to the lower timeframe, reducing noise in quiet markets while remaining sensitive to genuine outliers.
Clean Visual Hierarchy | Three tiers (Small 🞉 / Medium ⏣ / Large 🞊) with dynamic symbol size, line thickness, transparency, and user-definable bullish/bearish coloring based on LTF candle direction.
How to Use It as an Orderflow Tool
Large volume spikes often mark the footprints of institutional players. This indicator helps you read those footprints in real time.
Small (🞉) | Moderate excess volume: early interest, probing, or building positions.
Medium (⏣) | Strong spike: increasing conviction, potential momentum shift.
Large (🞊) | Extreme outlier: frequently climactic volume signalling exhaustion or major absorption.
Why Price Often Reverses at These Levels
Large players frequently place limit orders in areas rich with liquidity – commonly just beyond recent highs/lows where retail stop-losses cluster. When price sweeps those zones:
Stop hunts trigger a cascade of forced exits, creating liquidity for larger participants to fill their limit orders.
Breakout traders who entered on the move are trapped offside and become forced buyers/sellers when price reverses.
Institutions use this liquidity to execute large orders at favorable prices with minimal immediate market impact.
The result is aggressive volume at the extreme, followed by reversal as smart money finishes filling and price returns toward fair value. Clusters of medium/large markers at swing points are classic signs of this dynamic.
Practical Analysis Tips
Reversals/Absorption | Clusters of large markers at swing highs/lows (especially opposing-color spikes) signal potential turns – buyers or sellers stepping in aggressively.
Level Defense | Trades piling up at key support/resistance suggest institutions protecting or building positions.
Trapped Traders | Large spikes beyond range pivots followed by reversal back into the range often highlight trapped breakout traders who add fuel to a move when they are forced to liquidate their positions.
Use Offset (-3 to +3) to shift markers away from current price for clearer viewing.
Pro tip: Zoom into the lower TF occasionally to see how these projected levels align exactly with aggressive candles.
Recommended Pairings
This is designed as a pure orderflow overlay to be layered with your existing setup:
Support & Resistance (horizontals, pivots, Volume Profile POC/VAH/VAL)
Market Structure tools (swing points, order blocks, fair value gaps)
Trend filters (EMAs, SuperTrend, higher-TF bias)
Momentum oscillators for timing confluence
Best Suited For
Scalping & day trading (1–15 min charts with 5–30S lower TF)
Swing trading entries (1H–4H charts with 1–5 min lower TF)
High-liquidity markets: crypto perpetuals, forex majors, volatile stocks
Add this indicator to start seeing the hidden aggression driving price and expose the hidden edges beyond the noise.
☠ FR33FA11 | deKoder ☠
Released January 2025 | Open Source

PVSRA High Volume Lines MTF - DailyThis indicator identifies Daily candles with significant volume activity based on the traditional PVSRA calculation.
When a high-volume Daily candle is detected, the indicator plots support and resistance levels at the high and low of that specific candle.
These Daily-based levels are then projected onto lower timeframes, allowing traders to visualize higher-timeframe support and resistance zones directly on intraday charts.
The indicator focuses only on days with elevated volume, rather than plotting levels for every Daily candle.
