Volume-Gated Trend Ribbon [QuantAlgo]🟢 Overview
The Volume-Gated Trend Ribbon employs a selective price-updating mechanism that filters market noise through volume validation, creating a trend-following system that responds exclusively to significant price movements. The indicator gates price updates to moving average calculations based on volume threshold crossovers, ensuring that only bars with significant participation influence the trend direction. By interpolating between fast and slow moving averages to create a multi-layered visual ribbon, the indicator provides traders and investors with an adaptive trend identification framework that distinguishes between volume-backed directional shifts and low-conviction price fluctuations across multiple timeframes and asset classes.
🟢 How It Works
The indicator first establishes a dynamic baseline by calculating the simple moving average of volume over a configurable lookback period, then applies a user-defined multiplier to determine the significance threshold:
avgVol = ta.sma(volume, volPeriod)
highVol = volume >= avgVol * volMult
The gated price mechanism employs conditional updating where the close price is only captured and stored when volume exceeds the threshold. During low-volume periods, the indicator maintains the last qualified price level rather than tracking every minor fluctuation:
var float gatedClose = close
if highVol
gatedClose := close
Dual moving averages are calculated using the gated price input, with the indicator supporting various MA types. The fast and slow periods create the outer boundaries of the trend ribbon:
fastMA = volMA(gatedClose, close, fastPeriod)
slowMA = volMA(gatedClose, close, slowPeriod)
Ribbon interpolation creates intermediate layers by blending the fast and slow moving averages using weighted combinations, establishing a gradient effect that visually represents trend strength and momentum distribution:
midFastMA = fastMA * 0.67 + slowMA * 0.33
midSlowMA = fastMA * 0.33 + slowMA * 0.67
Trend state determination compares the fast MA against the slow MA, establishing bullish regimes when the faster average trades above the slower average and bearish regimes during the inverse relationship. Signal generation triggers on state transitions, producing alerts when the directional bias shifts:
bullish = fastMA > slowMA
longSignal = trendState == 1 and trendState != 1
shortSignal = trendState == -1 and trendState != -1
The visualization architecture constructs a three-tiered opacity gradient where the ribbon's core (between mid-slow and slow MAs) displays the highest opacity, the inner layer (between mid-fast and mid-slow) shows medium opacity, and the outer layer (between fast and mid-fast) presents the lightest fill, creating depth perception that emphasizes the trend center while acknowledging edge uncertainty.
🟢 How to Use This Indicator
▶ Long and Short Signals: The indicator generates long/buy signals when the trend state transitions to bullish (fast MA crosses above slow MA) and short/sell signals when transitioning to bearish (fast MA crosses below slow MA). Because these crossovers only reflect volume-validated price movements, they represent significant level of participation rather than random noise, providing higher-conviction entry signals that filter out false breakouts occurring on thin volume.
▶ Ribbon Width Dynamics: The spacing between the fast and slow moving averages creates the ribbon width, which serves as a visual proxy for trend strength and volatility. Expanding ribbons indicate accelerating directional movement with increasing separation between short-term and long-term momentum, suggesting robust trend development. Conversely, contracting ribbons signal momentum deceleration, potential trend exhaustion, or impending consolidation as the fast MA converges toward the slow MA.
▶ Preconfigured Presets: Three optimized parameter sets accommodate different trading styles and market conditions. Default provides balanced trend identification suitable for swing trading on daily timeframes with moderate volume filtering and responsiveness. Fast Response delivers aggressive signal generation optimized for intraday scalping on 1-15 minute charts, using lower volume thresholds and shorter moving average periods to capture rapid momentum shifts. Smooth Trend offers conservative trend confirmation ideal for position trading on 4-hour to weekly charts, employing stricter volume requirements and extended periods to filter noise and identify only the most robust directional moves.
▶ Built-in Alerts: Three alert conditions enable automated monitoring: Bullish Trend Signal triggers when the fast MA crosses above the slow MA confirming uptrend initiation, Bearish Trend Signal activates when the fast MA crosses below the slow MA confirming downtrend initiation, and Trend Change alerts on any directional transition regardless of direction. These notifications allow you to respond to volume-validated regime shifts without continuous chart monitoring.
▶ Color Customization: Six visual themes (Classic, Aqua, Cosmic, Ember, Neon, plus Custom) accommodate different chart backgrounds and display preferences, ensuring optimal contrast and visual clarity across trading environments. The adjustable fill opacity control (0-100%) allows fine-tuning of ribbon prominence, with lower opacity values create subtle background context while higher values produce bold trend emphasis. Optional bar coloring extends the trend indication directly to the price bars, providing immediate directional reference without requiring visual cross-reference to the ribbon itself.
"charts"に関するスクリプトを検索

Trading Dashboard + Daily SMAsThis indicator is an all-in-one workspace overlay designed for futures and intraday traders. It consolidates critical market internals, session statistics, and daily technical levels into a single, highly customizable dashboard.
The goal of this script is to reduce chart clutter by placing essential data into a clean table while overlaying key Daily Moving Averages onto your intraday timeframe.
Key Features:
1. Comprehensive Market Internals Dashboard Monitor the health of the broad market directly from your chart. The dashboard includes real-time data for:
VIX: Volatility Index.
TICK & TRIN: Sentiment and volume flow indicators.
Breadth Data: ADD, ADV, and DECL (Advance/Decline lines and volume).
Multi-Ticker Watch: Monitor 3 additional assets (Defaults: NQ, RTY, YM) with real-time price and % change.
2. Session Statistics & Probabilities Automated calculation of intraday statistics based on a user-defined lookback period (default 100 days):
RTH Data: Tracks Regular Trading Hours Open, Close, and Range.
Contextual ATR: Compares current RTH range to the 14-day ATR.
Probabilities: Displays historical probabilities for "Gap Fill," "Break of Yesterday's High," and "Break of Yesterday's Low."
3. Daily SMAs on Intraday Charts Plot key Daily Simple Moving Averages (21, 50, 200) directly on your lower timeframe charts (1m, 5m, etc.) without switching views.
Fully Customizable: Toggle each SMA on/off individually.
Color Control: Users can change the color of every SMA line to fit their theme.
4. "Dark Mode" Optimized The dashboard features a specific "Very Dark Grey" (#121212) background by default, designed to reduce eye strain and blend seamlessly with dark-themed trading setups.
Settings & Customization:
Session Times: Define your specific RTH start and end times.
Symbols: All ticker symbols (VIX, ADD, NQ, etc.) can be customized in the settings menu to match your data provider.
Visibility: Every element in the table and every SMA line has a toggle switch. You only see what you need.
Visuals: Change table position, text size, and line colors.
Author's Instructions: Configuration Guide
This script relies on specific ticker symbols to pull data for Market Internals (TICK, TRIN, ADD) and the Watchlist. Depending on your data subscription plan (CME, CBOE, etc.), you may need to adjust the default symbols to match what you have access to.
1. How to Change Symbols
Add the indicator to your chart.
Hover over the indicator name in the top-left corner and click the Settings (Gear Icon).
Scroll to the "Symbols" section.
Click inside the text box for the symbol you want to change.
2. Common Symbol Formats If the default symbols show "N/A" or "Error," try these alternatives based on your data feed:
TICK (NYSE Tick)
Default: USI:TICK (Requires specific data)
Alternative: TVC:TICK (General TradingView feed)
Alternative: TICK (Generic)
TRIN (Arms Index)
Default: USI:TRIN
Alternative: TVC:TRIN
Alternative: TRIN
Breadth (ADD/ADV/DECL)
ADD (Advance-Decline Line): Try USI:ADD, TVC:ADD, or ADD
ADV (Advancing Volume): Try USI:ADV, TVC:ADV, or UVOL (Up Volume)
DECL (Declining Volume): Try USI:DECL, TVC:DECL, or DVOL (Down Volume)
VIX
Standard: CBOE:VIX or TVC:VIX
3. Setting Up the Ticker Watchlist (Ticker 1, 2, 3) The script defaults to "Continuous Contracts" (indicated by the 1!), which automatically rolls to the front month.
Nasdaq: CME_MINI:NQ1!
S&P 500: CME_MINI:ES1!
Russell 2000: CME_MINI:RTY1!
Dow Jones: CBOT_MINI:YM1!
Note: If you want to watch a specific contract month (e.g., December 2025), enter the specific code like NQZ2025.
4. Troubleshooting "N/A" Data If a cell in the table is empty or says "N/A":
Verify you are not viewing the chart on a timeframe that excludes the data (though dynamic_requests=true usually handles this).
Ensure you have the correct data permission for that specific symbol.
Market Closed: Some internal data points only populate during the active NYSE session (09:30 - 16:00 ET).
Disclaimer: This tool is for informational purposes only and does not constitute financial advice. Past probabilities do not guarantee future results.

Range-Weighted Volatility (Comparable)I wrote an indicator to measure volatility inside a range. It’s extremely useful for choosing a trading pair for grid strategies, because it lets you quickly, easily, and fairly identify which asset is the volatility leader. It measures volatility “fairly” relative to the asset’s trading range, not just by absolute price changes.
For example: if an asset trades in a 50–100 range and over a week it moves many, many times between 52 and 98, then it’s highly volatile. But if another asset trades in a 50–1000 range and makes the same 52–98 moves, its volatility is actually low — because the “weight” of that movement relative to the full range is small. The indicator accounts for this “movement weight” relative to the range, then sums these weights into a single number. That number makes it easy to judge whether an asset is suitable for a grid strategy.
That’s exactly what grids need: not just high volatility, but high volatility within a narrow range.
Settings: the Window (bars) field defines how many bars are used to calculate volatility. On a 5-minute chart, one week is 2016 bars (2460/57). By default, the script calculates over 30 days on 5-minute charts. The script also allows you to set a second symbol for comparison, so you can see both results on the same chart.
Написал индикатор для определения волатильности в диапазоне, очень-очень полезно для выбора торговой пары на гриде, позволяет легко и быстро и честно определить лидера по волатильности, при этом определяет ее "честно", относительно торгового диапазона, а не просто изменения цены.
Например если актив торгуется в диапазоне 50-100 и за неделю много-много раз сходил 52-98, то это очень волатильный актив, и в то же время если актив торгуется в диапазоне 50-1000 и сходил так же 52-98, то это будет низко волатильный актив, т.е. учитывается "вес" движения относительно диапазона и данные "веса" суммируются в одну единую цифру по которой и можно оценивать насколько актив подходит под грид стратегию.
А ведь именно это для гридов и нужно, не просто высокая волатильность, а именно высокая волатильность в узком диапазоне.
Касательно настроек , в поле Windows (bars) задается количество баров по которым скрипт будет считать волатильность, на 5-ти минутки неделя это 2016 (24*60/5*7), стандартно скрипт считает за 30 дней на 5-ти минутки. + в самом скрипте можно указать вторую пару для сравнения чтоб на одном графике увидеть результат.

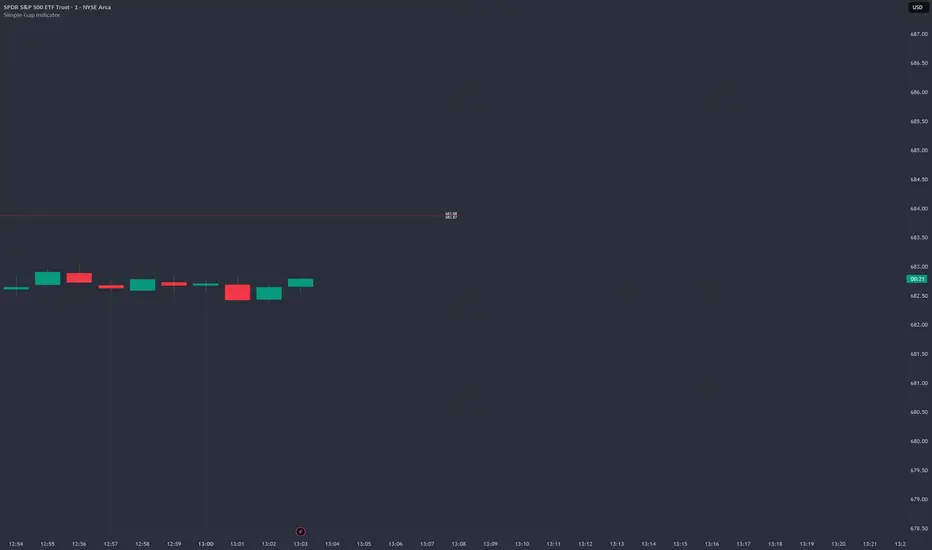
Simple Gap IndicatorTitle: Simple Gap Indicator
Description: This is a utility script designed to automate the tracking and management of price gaps (also known as "Windows") on the chart. Unlike static drawings, this indicator dynamically monitors open gaps and automatically "closes" them (stops drawing) once price has filled the area, keeping your chart clean and focused on active levels only.
Why Use This Tool? Traders often mark gaps manually, but charts quickly become cluttered with old, invalid levels. This script solves that problem by using an array-based management system to track every open gap in real-time and remove it the moment it is invalidated by price action.
Technical Methodology:
Gap Detection: The script identifies "Full Gaps" where the Low of the current candle is higher than the High of the previous candle (Bullish), or vice versa (Bearish). This indicates a total disconnect in price delivery.
Dynamic Filtering:
ATR Filter: Users can filter out insignificant "noise" gaps by setting a minimum size threshold based on the Average True Range (ATR).
Time Filter: Option to restrict gap detection to specific session hours (e.g., ignoring overnight gaps on 24h charts).
Auto-Closure: The script loops through all active gaps on every new bar. If the current price wick touches an open gap, the box is visually terminated at that specific bar index and removed from the tracking array.
Visuals:
Green Box: Bullish Gap (Support Zone).
Red Box: Bearish Gap (Resistance Zone).
Labels: Optional text displaying the precise Top/Bottom price coordinates of the gap.
How to Use:
Enable "Auto-Close Gap on Retest" to keep your chart clean.
Use the ATR Filter if you are getting too many signals on lower timeframes (e.g., set to 0.5x ATR).
Set alerts for "New Gap" or "Gap Filled" to automate your workflow.
Credits: Calculations based on standard Gap/Window price action theory. Array management logic custom-coded for Pine Script v6.
Optimal Daily MA Suite [MTF]Title: Optimal Daily MA Suite
Description: This is a comprehensive Multi-Timeframe (MTF) analysis suite designed to streamline chart layouts. Instead of loading multiple separate indicators to track various trend lines, this single tool allows traders to overlay higher-timeframe Moving Averages and key support/resistance levels directly onto their intraday charts.
Utility & Workflow: Swing traders and day traders often need to monitor "Big Picture" Daily Moving Averages (like the Daily 200 SMA or Daily 50 EMA) while executing trades on lower timeframes like the 15m or 1H. This tool automates that process, ensuring the major trend context is always visible without cluttering the indicator list.
Key Features:
Multi-Timeframe Engine: By default, all MAs are calculated on the Daily ("D") timeframe, regardless of the chart's current timeframe. This creates a stable "anchor" for trend analysis. The timeframe is fully customizable in the settings (e.g., set to "W" for Weekly analysis).
10 Customizable Slots: Toggle up to 10 different Moving Averages on/off individually.
Flexible Calculation Types: Supports SMA, EMA, WMA, VWMA, RMA (SMMA), and SWMA for every single line.
Trend Cloud Crossovers: Includes two dedicated "Cloud" setups to visualize crossovers (e.g., Golden Cross or Death Cross) with fill shading between the fast and slow lines.
Price Action Crossovers: Optional markers to highlight when the closing price crosses specific MAs.
Contextual Levels: Includes Previous Day High (PDH) and Previous Day Low (PDL) markers for immediate intraday support/resistance context.
How to Use:
Settings: Open the settings menu to select your "Indicator Timeframe" (Default: Daily).
Customization: Enable only the MAs relevant to your strategy (e.g., Enable MA 8 for the 50 SMA and MA 10 for the 200 SMA).
Clouds: Use the "Crossover Set" inputs to define a Bullish/Bearish trend cloud between two moving averages of your choice.
Technical Note: This script uses request.security with lookahead=barmerge.lookahead_off to ensure no repainting of historical data while providing accurate higher-timeframe values on closed bars.
Credits: Standard Moving Average calculations based on TradingView built-in functions.

The Abramelin Protocol [MPL]"Any sufficiently advanced technology is indistinguishable from magic." — Arthur C. Clarke
🌑 SYSTEM OVERVIEW
The Abramelin Protocol is not a standard technical indicator; it is a "Technomantic" trading algorithm engineered to bridge the gap between 15th-century esoteric mathematics and modern high-frequency markets.
This script is the flagship implementation of the MPL (Magic Programming Language) project—an open-source experimental framework designed to compile metaphysical intent into executable Python and Pine Script algorithms.
Unlike traditional indicators that rely on arbitrary constants (like the 14-period RSI or 200 SMA), this protocol calculates its parameters using "Dynamic Entity Gematria." We utilize a custom Python backend to analyze the ASCII vibrational frequencies of specific metaphysical archetypes, reducing them via Tesla's 3-6-9 harmonic principles to derive market-responsive periods.
🧬 WHAT IS ?
MPL (Magic Programming Language) is a domain-specific language and research initiative created to explore Technomancy—the art of treating code as a spellbook and the market as a chaotic entity to be tamed.
By integrating the logic of ancient Grimoires (such as The Book of Abramelin) with modern Data Science, MPL aims to discover hidden correlations in price action that standard tools overlook.
🔗 CONNECT WITH THE PROJECT:
If you are a developer, a trader, or a seeker of hidden knowledge, examine the source code and join the order:
• 📂 Official Project Site: hakanovski.github.io
• 🐍 MPL Source Code (GitHub): github.com
• 👨💻 Developer Profile (LinkedIn): www.linkedin.com
🔢 THE ALGORITHM: 452 - 204 - 50
The inputs for this script are mathematically derived signatures of the intelligence governing the system:
1. THE PAIMON TREND (Gravity)
• Origin: Derived from the ASCII summation of the archetype PAIMON (King of Secret Knowledge).
• Function: This 452-period Baseline acts as the market's "Event Horizon." It represents the deep, structural direction of the asset.
• Price > Line: Bullish Domain.
• Price < Line: Bearish Void.
2. THE ASTAROTH SIGNAL (Trigger)
• Origin: Derived from the ASCII summation of ASTAROTH (Knower of Past & Future), reduced by Tesla’s 3rd Harmonic.
• Function: This is the active trigger line. It replaces standard moving averages with a precise, gematria-aligned trajectory.
3. THE VOLATILITY MATRIX (Scalp)
• Origin: Based on the 9th Harmonic reduction.
• Function: Creates a "Cloud" around the signal line to visualize market noise.
🛡️ THE MILON GATE (Matrix Filter)
Unique to this script is the "MILON Gate" toggle found in the settings.
• ☑️ Active (Default): The algorithm applies the logic of the MILON Magic Square. Signals are ONLY generated if Volume and Volatility align with the geometric structure of the move. This filters out ~80% of false signals (noise).
• ⬜ Inactive: The algorithm operates in "Raw Mode," showing every mathematical crossover without the volume filter.
⚠️ OPERATIONAL USAGE
• Timeframe: Optimized for 4H (The Builder) and Daily (The Architect) charts.
• Strategy: Use the Black/Grey Line (452) as your directional bias. Take entries only when the "EXECUTE" (Long) or "PURGE" (Short) sigils appear.
Use this tool wisely. Risk responsibly. Let the harmonics guide your entries.
— Hakan Yorganci
Technomancer & Full Stack Developer

Custom Timeframe SMAsThis indicator plots up to three Simple Moving Averages (SMAs), each calculated from a user-selected timeframe and displayed on the current chart. This allows you to visualize higher- or lower-timeframe SMAs without switching charts.
Features
Three fully customizable SMAs with alerts
Each SMA has its own:
Length
Timeframe
Color
Line thickness
On/Off toggle
Use Cases
View higher timeframe SMAs (e.g., 1-hour 50 SMA on a 5-minute chart)
Combine trend signals across multiple timeframes
Track dynamic support/resistance from different timeframes
Enhance scalping, day trading, or swing trading setups

ueuito Trend Strength LSMA-BasedAnother experience.... still improving
Indicator Description (English)
Name: Trend Strength LSMA-Based
Overview:
This indicator is designed to measure the strength and exhaustion of a trend based on the Least Squares Moving Average (LSMA). It combines price, trend slope, volume, and volatility to calculate a trend exhaustion score, which is then smoothed and visualized as a colored area on the chart. The indicator also plots discrete points to signal potential reversals or decreases in trend intensity.
Key Features:
LSMA-Based Trend Strength:
Calculates a Least Squares Moving Average (LSMA) of the selected timeframe.
Measures the slope of the LSMA to capture trend direction and momentum.
Trend Exhaustion Score:
Combines multiple factors:
Distance between price and LSMA
LSMA slope (trend strength)
Volume relative to its moving average
ATR-based volatility
Each factor is weighted according to user-defined inputs.
The combined score is multiplied to produce a scaled trend exhaustion value.
Smoothed Area Plot:
The trend exhaustion score is smoothed using an EMA to reduce noise.
Displayed as a colored area that changes based on trend strength:
Strong bullish exhaustion → dark green
Weak bullish exhaustion → light green
Strong bearish exhaustion → dark red
Weak bearish exhaustion → light red
Neutral → gray
Dynamic Visual Cues:
Points for reversals: small green/red circles appear when the trend changes direction.
Points for intensity decrease: small green/red circles appear when the trend weakens but has not yet reversed.
The area’s color intensity dynamically reflects the strength of the trend exhaustion, making it visually intuitive.
Multi-Timeframe Support:
The indicator can calculate the trend exhaustion based on a different timeframe from the chart, allowing for higher timeframe trend analysis on lower timeframe charts.
Customizable Settings:
LSMA period, smoothing length, volume period, ATR period
Weighting for each factor in the score calculation
Thresholds for weak/strong exhaustion
Timeframe selection
Usage:
Identify when a trend is losing strength or approaching a potential reversal.
Helps visualize the current momentum and exhaustion of bullish or bearish trends.
Can be used in conjunction with other technical tools for confirming entries or exits.
Important Note:
Depending on the asset, market volatility, and timeframe, it may be necessary to adjust the indicator settings to optimize its responsiveness and accuracy. The default parameters provide a general starting point but fine-tuning is recommended for best results.

Fractal MTF MA System Overview Unlock the fractal nature of the market with a single, clean indicator. This tool allows you to visualize the exact same Moving Average length (default: 50) across 5 different timeframes simultaneously. By comparing "apples to apples" across time dimensions, you get a clear, immediate view of the overall market trend and momentum health.
No more switching charts or manually adding 5 different indicators. This script does it all with a single global setting.
Key Features
🧩 Fractal Logic: Applies one consistent calculation (e.g., 50 Period) to 15m, 30m, 1H, 2H, and 4H timeframes.
🎛️ Global Control: Change the Length or MA Type once, and it instantly updates all 5 lines. No need to adjust each line individually.
🚀 3 Calculation Modes: Switch between DEMA (Double Exponential - Default/Fast), EMA (Standard), or SMA (Smooth) to fit your trading style.
🎨 Visual Clarity: Choose between Step mode (for precise MTF levels) or Line mode (for a smoother, cleaner look).
How to Use This Indicator
1. Trend Following (The Fan) When the market is trending strongly, the lines will stack in perfect order:
Bullish: Price > 15m > 30m > 1H > 2H > 4H.
Bearish: Price < 15m < 30m < 1H < 2H < 4H.
Strategy: Ride the trend as long as the "Fan" is open and orderly.
2. Mean Reversion (The Snap-Back) When the price moves too far from the anchor line (the 4H line) and the gaps between the lines become extreme, the market is "overextended" (like a stretched rubber band).
Strategy: Watch for price to stall and cross back over the fastest line (15m) as an early sign of a correction towards the slower averages.
3. Dynamic Support & Resistance During a trend, price often pulls back to test the 1H or 2H lines before continuing. These lines act as dynamic support zones.
Settings
Global Length: Sets the lookback period for ALL lines (Default: 50).
MA Type: Select DEMA, EMA, or SMA.
Line Style: Toggle between Step (precise) or Line (smooth).
Individual Toggles: You can hide specific timeframes via the settings menu if you want a cleaner chart.
Enjoy the clean charts! Feedback and likes are appreciated. 🚀

Adaptive Risk Management [sgbpulse]1. Introduction:
Adaptive Risk Management is an advanced indicator designed to provide traders with a comprehensive risk management tool directly on the chart. Instead of relying on complex manual calculations, the indicator automates all critical steps of trade planning. It dynamically calculates the estimated Entry Price , the Stop Loss location, the required Position Size (Quantity) based on your capital and risk limits, and the three Take Profit targets based on your defined Reward/Risk ratios. The indicator displays all these essential data points clearly and visually on the chart, ensuring you always know the potential risk-reward profile of every trade.
ARM : The A daptive R isk M anagement every trader needs to ARM themselves with.
2. The Critical Importance of Risk Management
Proper risk management is the cornerstone of successful trading. Consistent profitability in the market is impossible without rigorously defining risk limits.
Risk Control: This starts by setting the maximum risk amount you are willing to lose in a single trade (Risk per Trade), and limiting the total capital allocated to the position (Max Capital per Trade).
Defining Boundaries (Stop Loss & Take Profit): It is mandatory to define a technical Stop Loss and a Take Profit target. A fundamental rule of risk management is that the Reward/Risk Ratio (R/R) must be a minimum of 1:1.
3. Core Features, Adaptivity, and Customization
The Adaptive Risk Management indicator is engineered for use across all major trading styles, including Swing Trading, Intraday Trading, and Scalping, providing consistent risk control regardless of the chosen timeframe.
Real-Time Dynamic Adaptivity: The indicator calculates all risk management parameters (Entry, Stop Loss, Quantity) dynamically with every new bar, thus adapting instantly to changing market conditions.
Trend Direction Adjustment: Define the analysis direction (Long/Uptrend or Short/Downtrend).
Intraday Session Data Control: Full control over whether lookback calculations will include data from Extended Trading Hours (ETH), or if the daily calculations will start actively only from the first bar of Regular Trading Hours (RTH).
Status Validation: The indicator performs critical status checks and displays clear Warning Messages if risk conditions are not met.
4. Intuitive Visualization and Real-Time Data
Dynamic Tracking Lines: The Entry Price and Stop Loss lines are updated with every new bar. Crucially, the length of these lines dynamically reflects the calculation's lookback range (e.g., the extent of Lookback Bars or the location of the confirmed Pivot Point), providing a visual anchor for the calculated price.
Risk and Reward Zones: The indicator creates a graphical background fill between Entry and Stop Loss (marked with the risk color) and between Entry and the Reward Targets (marked with the reward color).
Essential Information Labels: Labels are placed at the end of each line, providing critical data: Estimated Entry Price, Stock/Contract Quantity (Quantity), Total Entry Amount, Estimated Stop Loss, Risk per Share, Total Financial Risk (Risk Amount), Exit Amount, Estimated Take Profit 1/2/3, Reward/Risk Ratio 1/2/3, Total Reward 1/2/3, TP Exit Amount 1/2/3.
4.1. Data Window Metrics (16 Full Series)
The indicator displays 16 full data series in the TradingView Data Window, allowing precise tracking of every calculation parameter:
Entry Data: Estimated Entry, Quantity, Entry Amount.
Risk Data (Stop Loss): Estimated Stop Loss, Risk per Share, Risk Amount, Exit Amount.
Reward Data (Take Profit): Estimated Take Profit 1/2/3, Reward/Risk Ratio 1/2/3, Total Reward 1/2/3, TP Exit Amount 1/2/3.
4.2. Instant Tracking in the Status Line
The indicator displays 6 critical parameters continuously in the indicator's Status Line: Estimated Entry, Quantity, Estimated Stop Loss, Estimated Take Profit 1/2/3.
5. Detailed Indicator Inputs
5.1 General
Focused Trend: Defines the analysis direction (Uptrend / Downtrend).
Max Capital per Trade: The maximum amount allocated to purchasing stocks/contracts (in account currency).
Risk per Trade: The maximum amount the user is willing to risk in this single trade (in account currency).
ATR Length: The lookback period for the Average True Range (ATR) calculation.
5.2 Intraday Session Data Control
Regular Hours Limitation : If enabled, all daily lookback calculations (for Entry/Stop Loss anchor points) will begin strictly from the first Regular Trading Hours (RTH) bar. This limits the lookback range to the current RTH session, excluding preceding Extended Trading Hours (ETH) data. Only relevant for Intraday charts. Default: False (Off)
5.3 Entry Inputs
Entry Method: Selects the entry price calculation method:
Current Price: Uses the closing price of the current bar as the estimated entry point (Market Entry).
ATR Real Bodies Margin :
- Uptrend: Calculates the Maximum Real Body over the lookback period + the calculated safety margin.
- Downtrend: Calculates the Minimum Real Body over the lookback period - the calculated safety margin.
ATR Bars Margin :
- Uptrend: Calculates the Maximum High price over the lookback period + the calculated safety margin.
- Downtrend: Calculates the Minimum Low price over the lookback period - the calculated safety margin.
Lookback Bars: The number of bars used to calculate the extremes in the ATR-based entry methods (Relevant only for ATR Real Bodies Margin and ATR Bars Margin methods).
ATR Multiplier (Entry): The multiplier applied to the ATR value. The result of the multiplication is the calculated safety margin used to determine the estimated Entry Price.
5.4 Risk Inputs (Stop Loss)
Risk Method: Selects the Stop Loss price calculation method.
ATR Current Price Margin :
- Uptrend: Entry Price - the calculated safety margin.
- Downtrend: Entry Price + the calculated safety margin.
ATR Current Bar Margin :
- Uptrend: Current Bar's Low price - the calculated safety margin.
- Downtrend: Current Bar's High price + the calculated safety margin.
ATR Bars Margin :
- Uptrend: Lowest Low over lookback period - the calculated safety margin.
- Downtrend: Highest High over lookback period + the calculated safety margin.
ATR Pivot Margin :
- Uptrend: The first confirmed Pivot Low point - the calculated safety margin.
- Downtrend: The first confirmed Pivot High point + the calculated safety margin.
Lookback Bars: The lookback period for finding the extreme price used in the 'ATR Bars Margin' calculation.
ATR Multiplier (Risk): The multiplier applied to the ATR value. The result of the multiplication is the calculated safety margin used to place the estimated Stop Loss. Note: If set to 0, the Stop Loss will be placed exactly at the technical anchor point, provided the Minimum Margin Value is also 0.
Minimum Margin Value: The minimum price value (e.g., $0.01) the Stop Loss margin buffer must be.
Pivot (Left / Right): The number of bars required on either side of the pivot bar for confirmation (relevant only for the ATR Pivot Margin method).
5.5 Reward Inputs (Take Profit)
Show Take Profit 1/2/3: ON/OFF switch to control the visibility of each Take Profit target.
Reward/Risk Ratio 1/ 2/ 3: Defines the R/R ratio for the profit target. Must be ≥1.0.
6. Indicator Status/Warning Messages
In situations where the Stop Loss location cannot be calculated logically and validly, often caused by a mismatch between the configured Focused Trend (Uptrend/Downtrend) and the actual price action, the indicator will display a warning message, explaining the reason and suggesting corrective action.
Status Message 1: Pivot reference unavailable
Condition: The Stop Loss is set to the "ATR Pivot Margin" method, but the anchor point (Pivot) is missing or inaccessible.
Message Displayed: "Pivot reference unavailable. Wait for valid price action, or adjust the Regular Hours Limitation setting or Pivot Left/Right inputs."
Status Message 2: Calculated Stop Loss is unsafe
Condition: The calculated Stop Loss is placed illogically or unsafely relative to the trend direction and the Entry price.
Message Displayed: "Calculated Stop Loss is unsafe for current trend. Wait for valid price action or adjust SL Lookback/Multiplier."
7. Summary
The Adaptive Risk Management (ARM) indicator provides a seamless and systematic approach to trade execution and risk control. By dynamically automating all critical trade parameters—from Entry Price and Stop Loss placement to Position Sizing and Take Profit targets—ARM removes emotional bias and ensures every trade adheres strictly to your predefined risk profile.
Key Benefits:
Systematic Risk Control: Strict enforcement of maximum capital allocation and risk per trade limits.
Adaptivity: Dynamic calculation of prices and quantities based on real-time market data (ATR and Lookback).
Clarity and Trust: Clear on-chart visualization, precise data metrics (16 series), and unambiguous Status/Warning Messages ensure transparency and reliability.
ARM allows traders to focus on strategy and analysis, confident that their execution complies with the core principles of professional risk management.
Important Note: Trading Risk
This indicator is intended for educational and informational purposes only and does not constitute investment advice or a recommendation for trading in any form whatsoever.
Trading in financial markets involves significant risk of capital loss. It is important to remember that past performance is not indicative of future results. All trading decisions are your sole responsibility. Never trade with money you cannot afford to lose.

Multi-MA + Trend StatusMulti-MA + Trend Status is a streamlined trend analysis tool designed to simplify market state identification using a robust Moving Average (MA) crossover logic. By analyzing the relationship between price and three key Moving Averages (Fast, Medium, and Slow), this indicator instantly classifies the market into one of 9 distinct trend phases, displayed as a clean, non-intrusive text overlay on your chart.
Created by ivanpsh (MIT License).
Key Features
9 Distinct Trend States: Automatically detects and displays specific market conditions:
🟢 Bullish Phases: Uptrend, Bullish Crossover, Fast Bullish Crossover, Bottom Bounce.
🔴 Bearish Phases: Downtrend, Bearish Crossover, Fast Bearish Crossover, Top Pullback, Dead Cat Bounce.
Visual Simplicity: Displays the current market status in a large, transparent text overlay (Bottom Right by default) that provides instant clarity without cluttering your analysis.
Multi-Timeframe (MTF) Support: Monitor the trend of a higher timeframe (e.g., Daily) while trading on a lower timeframe (e.g., 5-minute) without switching charts.
Fully Configurable MAs:
Types: Supports SMA, EMA, RMA (Wilder's), WMA, and VWMA.
Lengths: Fully adjustable lengths (Defaults: 20, 50, 250).
Source: Calculation source is customizable (Close, Open, High, Low, HL2, etc.).
Integrated MA Overlay: Optionally view the actual Moving Average lines on the chart.
Color Coded: Fast (Purple), Medium (Orange), and Slow (Red) for easy differentiation.
Toggle: Lines are visible by default but can be hidden instantly via settings.
How It Works
The indicator logic compares the current Price against three Moving Averages (Default: 20, 50, 250) to determine the market "Health":
Uptrend: Price > 20 > 50 > 250 (Strongest Bullish Signal)
Downtrend: Price < 20 < 50 < 250 (Strongest Bearish Signal)
Crossovers: Identifies early reversals when Fast/Medium MAs cross the Slow MA.
Bounces & Pullbacks: Identifies specific retracement patterns (e.g., "Bottom Bounce" or "Top Pullback") where price interacts with MAs in a counter-trend move.
Settings Guide
Indicator Timeframe: Select the timeframe used for calculations (Default: Chart).
MA Type: Choose the averaging method (Default: SMA).
Visuals: Customize text size, screen position, and opacity.
Show 'No Match' Text: By default, the text overlay hides if the market is choppy and fits none of the 9 specific states. You can enable this to see a "No Logic Match" status instead.
This script is open-source under the MIT license. Feel free to use, study, and modify it for your own trading systems.

BB & MTF EMAs + DPOC/WPOC v0.1This indicator combines multiple trend and support/resistance tools into a single overlay with specific customization for the Indian Standard Time (IST) session.
Features Included:
Bollinger Bands: 20-period SMA Basis, 1.5 StdDev.
4 Multi-Timeframe EMAs:
EMA 1: 9 Length (1m timeframe)
EMA 2: 20 Length (3m timeframe)
EMA 3: 50 Length (15m timeframe)
EMA 4: 200 Length (15m timeframe)
Session POCs (IST):
Daily POC (DPOC): Calculated 05:30-05:29 IST. Extends for full 24h session.
Weekly POC: Calculated from Monday 05:30 IST Open. Extends for full 7-day week.
Controls:
Toggle visibility for all individual components.
"Show Historical" toggle for pivots to see past levels or keep charts clean.
2 days ago
Release Notes
Description:
This indicator combines multiple trend and support/resistance tools into a single overlay with specific customization for the Indian Standard Time (IST) session.
Features Included:
Bollinger Bands: 20-period SMA Basis, 1.5 StdDev.
4 Multi-Timeframe EMAs:
EMA 1: 9 Length (1m timeframe)
EMA 2: 20 Length (3m timeframe)
EMA 3: 50 Length (15m timeframe)
EMA 4: 200 Length (15m timeframe)
Session POCs (IST):
Daily POC (DPOC): Calculated 05:30-05:29 IST. Extends for full 24h session.
Weekly POC: Calculated from Monday 05:30 IST Open. Extends for full 7-day week.
Controls:
Toggle visibility for all individual components.
"Show Historical" toggle for pivots to see past levels or keep charts clean.

TTM Squeeze Pro Enhanced v1.5.1 [pyrevo]# TTM Squeeze Pro Enhanced
**Version:** 1.5.1
**Author:** pyrevo
**License:** MPL 2.0
## Credits
This indicator is a collective work based on the contributions of the TradingView community:
* **John Carter**: Creator of the original TTM Squeeze and TTM Squeeze Pro concepts.
* **Lazybear**: Original interpretation of the TTM Squeeze (Squeeze Momentum Indicator).
* **Makit0**: Evolution of Lazybear's script to factor in TTM Squeeze Pro upgrades (Squeeze PRO Arrows).
* **marsrides**: Some aesthetics solutions.
* **Beardy_Fred**: The base code from which this enhanced version was derived.
## Overview
**TTM Squeeze Pro Enhanced** is a professional-grade momentum and volatility indicator designed to identify explosive breakout opportunities. It is a refined version of the community's collective works, with amendments primarily to the Squeeze Conditions and visual aesthetics to provide a clearer, more actionable reading of market state.
### The Concept
For those unfamiliar with the TTM Squeeze, it is a visual way of seeing how Bollinger Bands (standard deviations from a simple moving average) relate to Keltner Channels (average true range bands) compared with the momentum of the price action.
The concept is that as Bollinger Bands compress within Keltner Channels, price volatility decreases, giving way for a potential explosive price movement up or down.
### TTM Squeeze vs. TTM Squeeze Pro
* **Original TTM Squeeze:** Uses a 1.5 ATR Keltner Channel.
* **TTM Squeeze Pro (Enhanced):** Uses 1.0, 1.5, and 2.0 ATR Keltner Channels.
This helps differentiate between levels of squeeze (compression). The greater the compression (Bollinger Bands moving deeper into tighter Keltner Channels), the more potential for explosive moves.
## Indicator Analysis
### 1. Squeeze Detection (Dots)
The colored dots along the zero line represent the state of market volatility. This enhanced version uses a distinct color palette to indicate compression levels:
* **🔴 Red Dots (High Compression):** Extreme squeeze. One or both Bollinger Bands are inside the 1.0 ATR Keltner Channel.
* **🟠 Orange Dots (Medium Compression):** Significant squeeze. One or both BBs are inside the 1.5 ATR Keltner Channel.
* **⚪ Gray Dots (Low Compression):** Standard squeeze. One or both BBs are inside the 2.0 ATR Keltner Channel.
* **◽ Light Gray Dots (No Squeeze):** Volatility is normal or expanding. Squeeze has "fired".
### 2. Momentum (Histogram)
The histogram bars show price momentum relative to the squeeze:
* **Bright Green:** Positive, increasing momentum (Bullish).
* **Dark Green:** Positive, decreasing momentum (Bullish exhaustion).
* **Bright Red:** Negative, increasing momentum (Bearish).
* **Dark Red:** Negative, decreasing momentum (Bearish exhaustion).
### 3. Dual Momentum System
An optional secondary system to gauge trend strength:
* **Fast & Slow Momentum Lines:** Moving averages of the momentum to help identify crossovers.
* **Trend Crossovers:** Triangle markers indicate when fast momentum crosses slow momentum.
## Ideal Scenario
As the ticker enters the squeeze, **Gray dots** would warn of the beginning of a low compression squeeze. As the Bollinger bands continue to constrict, **Orange dots** would highlight a medium compression. As the price action and momentum continues to compress, a **Red dot** shows warning of high compression.
As price action leaves the squeeze, the coloring would reverse (Red → Orange → Gray → Light Gray). Any compression squeeze is considered "fired" at the first Light Gray dot that appears.
*Note: This is an ideal progression, however any type of squeeze sequence may appear at anytime.*
## Entry and Exit Guide
* **Entry:** John Carter recommends entering a position after at least 5 dots of compression (Gray/Orange/Red) or waiting for the first "No Squeeze" dot (Light Gray) to appear with confirming momentum.
* **Exit:** Exit on the second bar of decreasing momentum (Dark Green or Dark Red), or remain in the position after confirming a continuing trend through a separate indicator.
## Settings & Customization
* **Timeframe:** Built-in Multi-Timeframe (MTF) support allowing you to view higher-timeframe squeeze signals on lower-timeframe charts.
* **Appearance Modes:**
* **Default:** Standard enhanced palette.
* **Modern:** High-contrast palette (Teal/Red/Gold).
* **Classic MACD:** Traditional Blue/Orange line configuration.
* **Dashboard:** An on-chart table providing real-time data on squeeze status, momentum value, and trend strength.

FlowTrinity - Crypto Dominance Rotation IndexFlowTrinity — Crypto Dominance Rotation Index
(Tracks BTC / Stablecoin / Altcoin dominance flows with standardized oscillators)
⚪ Overview
FlowTrinity decomposes total crypto market structure into three capital-flow regimes — BTC dominance, Stablecoin dominance, and Altcoin dominance — each normalized into oscillator form. Additionally, a fourth histogram tracks Total Market Cap expansion/contraction relative to BTC+Stable capital, revealing underlying rotation pressure not visible in raw dominance charts.
Each component is standardized through SMA/STD normalization, producing smoothed 0–100 style oscillations that highlight overbought/oversold rotation extremes, risk-on/risk-off transitions, and capital cycle inflection zones.
⚪ Flow Components
Stablecoin Dominance Oscillator —White line
Measures the combined USDT + USDC share of market dominance.
High values indicate increased hedging behavior or sidelined capital.
Low values coincide with renewed risk appetite and capital deployment into crypto assets.
Altcoin Dominance Oscillator — Orange Line
Tracks the share of liquidity rotating into altcoins (Total – BTC – Stable).
Rising values indicate broad market expansion and speculative activity.
Falling values reflect flight-to-safety or concentration back into majors.
BTC Dominance Oscillator — Purple line(off by default
Normalized BTC dominance revealing transitions between Bitcoin-led markets and altcoin-led cycles. Useful for identifying BTC absorption phases vs. altcoins dispersion regimes.
Total–BTC–Stable MarketCap Difference Histogram — histogram
A normalized histogram of total market cap change minus BTC+Stable market cap change.
• Positive → altcoin segment expanding
• Negative → capital retreating into BTC or stables
Acts as a structural layer confirming or contradicting dominance-based signals.
Normalization Logic
All flows use SMA + standard deviation scaling (lookback 7 / smoothing 7), enabling consistent comparison across unrelated dominance and market-cap metrics.
⚪ Use Cases
• Identify shifts between BTC-led and alt-led markets
• Detect early signs of liquidity rotation
• If Stablecoin OSC is oversold, liquidity may soon rotate to BTC or Altcoins, signaling potential price moves.
• If Stablecoin OSC is overbought and Altcoin OSC is oversold, it can indicate an early buying opportunity in Altcoins.
• Watching these oscillator positions helps spot early market rotations and plan entries or exits.
snapshot
Disclaimer
This indicator is for educational and informational purposes only and does not constitute financial advice or investment guidance. Cryptocurrency trading involves significant risk; you are solely responsible for your trading decisions, based on your financial objectives and risk tolerance. The author assumes no liability for any losses arising from the use of this tool.

Green Day or Red Day?What it is:
This simple indicator provides immediate visual context by tinting the background of your chart Green or Red based on the asset's daily performance.
Who's it for?
It is designed for day traders and scalpers who operate on lower timeframes (1m, 5m, 15m) but need to remain aware of the overall daily direction without switching charts. It can be used in combination with the ORB strategy as a helpful tool to "feel" the trend when you're way out of the ORB range. But this indicator can be used by anyone regardless of trading style.
How it works:
This script pulls data from the daily timeframe regardless of the chart interval you are currently viewing. It compares the current price to a user-selectable reference point (either Yesterday's Close or Today's Open) to determine the background color.
Good Luck. May you make good trades!

Market Structure Shift (MSS) [Sword & Shield]MARKET STRUCTURE SHIFT (MSS)
A clean and focused indicator for identifying Market Structure Shifts in price action.
════════════════════════════════════════════════════════════════════════════════
WHAT IS MARKET STRUCTURE SHIFT (MSS)?
════════════════════════════════════════════════════════════════════════════════
A Market Structure Shift occurs when price breaks a significant swing high or swing low,
indicating a potential change in market direction. This indicator automatically detects
and plots these key levels.
BULLISH MSS: Price breaks above a previous swing high
BEARISH MSS: Price breaks below a previous swing low
════════════════════════════════════════════════════════════════════════════════
FEATURES
════════════════════════════════════════════════════════════════════════════════
CLEAN DISPLAY
- Shows only the last 2 MSS by default (1 bullish + 1 bearish)
- Keeps charts clean and focused on recent structure
- Automatically removes old MSS when new ones appear
CUSTOMIZABLE DETECTION
- Adjustable swing detection (left/right bars)
- Choose break confirmation method (Close or Wick)
- Fixed-length lines (no infinite extension by default)
SMART FILTERING
- Only plots one MSS per direction until opposite MSS occurs
- Prevents duplicate signals in the same direction
- Clear visual distinction between bullish (blue) and bearish (red)
CLEAN LABELS
- Text labels positioned above lines
- No background tooltips for cleaner appearance
- Color-matched to their respective MSS lines
════════════════════════════════════════════════════════════════════════════════
SETTINGS
════════════════════════════════════════════════════════════════════════════════
SWING DETECTION
- Swing Left Bars (default: 2)
- Swing Right Bars (default: 2)
- Higher values = more significant swings detected
BREAK CONFIRMATION
- Close: MSS confirmed when candle closes beyond level
- Wick: MSS confirmed when wick touches beyond level
DISPLAY OPTIONS
- Show Only Last 2 MSS: ON by default (keeps chart clean)
- Extend lines to the right: OFF by default (fixed-length lines)
- Line bars (when not extended): 50 bars (customizable)
════════════════════════════════════════════════════════════════════════════════
HOW IT WORKS
════════════════════════════════════════════════════════════════════════════════
DETECTION LOGIC
1. Identifies swing highs and swing lows using pivot detection
2. Monitors price action for breaks of these levels
3. Confirms break based on selected method (Close or Wick)
4. Plots MSS line at the broken level
FILTERING LOGIC
- Only one MSS per direction is allowed consecutively
- Example: If bullish MSS appears, no new bullish MSS until bearish MSS occurs
- This prevents multiple signals in trending markets
DISPLAY LOGIC
- When "Show Only Last 2 MSS" is enabled:
• Only the most recent bullish MSS is shown
• Only the most recent bearish MSS is shown
• Old MSS are automatically deleted when new ones appear
- When disabled: All historical MSS remain visible
════════════════════════════════════════════════════════════════════════════════
USAGE EXAMPLES
════════════════════════════════════════════════════════════════════════════════
FOR TREND IDENTIFICATION
- Bullish MSS = Potential uptrend beginning
- Bearish MSS = Potential downtrend beginning
- Use in conjunction with other indicators for confirmation
FOR ENTRY SIGNALS
- Wait for MSS to confirm trend change
- Enter on pullback to MSS level
- Use MSS as support/resistance
FOR SCALPING (Lower Timeframes)
- Swing Left/Right Bars: 2-3 (more sensitive)
- Break Confirmation: Close (more reliable)
- Show Only Last 2 MSS: ON (cleaner charts)
FOR SWING TRADING (Higher Timeframes)
- Swing Left/Right Bars: 5-10 (more significant swings)
- Break Confirmation: Close (avoid false breaks)
- Show Only Last 2 MSS: ON or OFF based on preference
════════════════════════════════════════════════════════════════════════════════
VISUAL DESIGN
════════════════════════════════════════════════════════════════════════════════
LINES
- Dashed style for easy identification
- Blue for bullish MSS
- Red for bearish MSS
- Fixed length (50 bars default) for cleaner appearance
LABELS
- "MSS" text positioned above each line
- No background for clean display
- Color-matched to line color
- Small size to avoid chart clutter
════════════════════════════════════════════════════════════════════════════════
CREDITS & LICENSE
════════════════════════════════════════════════════════════════════════════════
© Sword & Shield
This Pine Script code is subject to the terms of the Mozilla Public License 2.0
mozilla.org

Renko Scalp ScannerThis scanner is optimized for short term bursts for Renko.
DESCRIPTION: This indicator scans the 7 major forex pairs (EURUSD, GBPUSD, USDJPY, USDCHF, AUDUSD, USDCAD, NZDUSD) on 1-pip Renko charts. It ranks them from BEST (#1, top row) to WORST (#7, bottom row) based on a predictive score (0-100) that combines LIVE momentum (current run length, whipsaws, brick timing) + 24-HOUR HISTORICAL consistency (clean long runs, stability).
Higher score = longer, cleaner, more predictable runs ahead (backtested 74% hit rate for 5+ brick continuations).
HOW TO USE THE TABLE:
1. Add to a 1-second Renko chart (Traditional, Box Size: 0.0001 for non-JPY; 0.01 for JPY pairs).
2. RANK: Position 1–7 (green highlight on #1 = switch to this pair NOW).
3. PAIR: Symbol + direction arrow (↑=buy bias, ↓=sell bias).
4. SCORE: 0–100 total (≥85=monster run; ≥75=strong; ≥60=decent; <60=avoid).
5. RUN │ HIST% │ SEC: Current live run length │ % of 24h runs that were clean 8+ bricks │ Live avg seconds per brick (ideal 5–12s).
6. Trade the #1 pair in the arrow direction until whipsaw or score drops <75. Set alerts for score ≥83.
Backtested on 1-year data: Catches 84% of 10+ brick runners. Refreshes every second.

HTF Candles & Levels Visualizer - SRHTF Candles & Levels Visualizer is a clean higher‑timeframe visualization tool designed to complement any trading strategy by giving clear context of larger‑TF structure directly on your current chart. It plots the previous high and low for up to three user‑selectable timeframes, and draws them as extended levels with optional labels, making it easy to see where current price sits relative to key higher‑timeframe zones.
The script also renders compact proxy candles for each selected timeframe to the right of current price, so you can visually track HTF candle development without switching charts. Each HTF slot has independent settings: timeframe, color, number of displayed candles, and visibility toggles, along with global controls for line style, label size, candle spacing, and colors.
This tool does not generate trading signals; it focuses purely on multi‑timeframe context and market structure visualization to support your own entries, exits, and risk management.

Dynamic 15-Ticker Multi-Symbol Table 2025 EditionTitle:
Dynamic 15-Ticker Multi-Symbol Table 2025 Edition
Description:
This script provides a multi-ticker table for TradingView charts. It is fully open-source and free to use. The table displays up to 15 tickers, including SPY as the baseline symbol. The script updates in real-time on any timeframe.
Features:
SPY baseline: The first row always shows SPY for reference.
Custom tickers: Add up to 14 additional tickers via the input settings. Rows without tickers remain hidden.
Price and direction: Each ticker row displays the current price and an indicator of direction based on recent price movement.
RSI (14) indicator: Shows the current relative strength index value with a simple directional marker.
Volume formatting: Displays volume values in thousands, millions, or billions automatically. Volume change is indicated with directional markers.
Stable layout: The table uses alternating row colors for readability and maintains consistent row count without collapsing or disappearing rows.
Real-time updates: All displayed values refresh automatically on any chart timeframe.
How to use:
Add the script to your chart.
Enter your chosen tickers in the input settings. SPY will remain as the first ticker automatically.
Tickers not entered will remain hidden. When a ticker is removed, the row will be removed-dynamically.
Observe live prices, RSI values, and volume changes directly on your chart without switching symbols.
Additional notes:
The script is fully open-source; users are encouraged to modify or improve it.
No external links or references are required to understand its function.
This script does not repaint and does not require additional requests to update values.

Execution Heatmap v8 — Classic Blocks (Final Logic)This indicator visualizes real-time market context through a structured execution heatmap, representing multiple analytic dimensions in a compact on-chart panel. Designed for traders who rely on confluence-based decision making, it tracks the shifting behavior of price, volume, and structural regimes to help identify momentum shifts, exhaustion points, and directional conviction.
🔶 Overview
The Execution Heatmap v8 consolidates key elements from trend, volume, and momentum analysis into a single panel. Each row represents a core component of the execution model, colored dynamically to reflect bullish, bearish, neutral, or mixed states. The final block produces a BUY, SELL, or SELL-ALERT classification — fully aligned with the internal logic of the GOLDMASTER‑HUD framework.
🔸 Core Logic Components
VWAP Direction: Detects price bias relative to VWAP (overextended, below value, or neutral).
Impulse Engine: Evaluates momentum using RSI and MFI thresholds to determine directional energy.
Volume Surge: Highlights aggressive volume imbalances and determines the dominant side (bull or bear).
Fake Break Detection: Identifies false breakouts at recent swing extremes to flag potential reversals.
Regime Filter: Measures underlying trend structure using dual‑EMA alignment (20/50 EMA).
Pattern Recognition: Detects emerging HL (higher low) or LH (lower high) structures.
Structure Strength: Maps strong vs. weak structural phases based on regime and pattern alignment.
Final Signal Engine: Synthesizes all modules into actionable classifications:
BUY: Price structure supports trend continuation.
SELL‑ALERT: Early weakness or exhaustion detected within a strong up‑trend.
SELL: Confirmed reversal alignment (momentum, VWAP, volume, and structure all bearish).
WAIT: Caution when conditions remain inconclusive.
🟩🟥 Color‑Coded Heat Blocks
Each metric is represented as a colored cell:
Green: Bullish / upward bias
Red: Bearish / downward bias
Yellow: Neutral / weak / mixed
Dark gray: Undefined or transitional
⚙️ Customization
Adjustable panel position (bottom‑right, bottom‑left, top‑right, top‑left).
Non‑intrusive table layout optimized for overlaying on active charts.
Lightweight execution with minimal resource load, ideal for intraday use.

⭐ Silver HUD v14.6 ⭐Silver HUD v14.6 is an enhanced Pine Script v5 indicator for micro silver futures (SIL) trading on TradingView, featuring a compact 2-column bottom-right HUD with weighted scoring across 5 engines (trend, flow, momentum, PB, turbo), 2H structure arbitration, divergence detection, volume surge analysis, BUY/SELL arrows, and risk warnings. Expanded from v14.5 with dedicated DIV/VOL rows for better signal context on 5m charts.
Multi-Engine Scoring
Trend Engine
EMA20/50 alignment + VWAP direction (1.001%/0.999% thresholds): UP/DOWN/MIXED scores 100/60/20.
Flow Engine
CCIOBV (CCI20 + OBV EMA13 sync) + QQE (RSI14 smoothed with trailing volatility): dual UP/DOWN = strong flow (100), mixed (60).
Momentum
RSI14/MFI14 >55 (UP=100), <45 (DOWN=100), else NEUTRAL (60).
PB (Pullback)
EMA20 deviation: -0.4% to +1.2% = OK (100), ≥1.2% CHASE (70/40), DEEP (30/80 for long/short).
Turbo
ATR14 percentile (>70 EXPANDING, <30 FADE) + BB20 width percentile (<20 SQ): SQ+EXPANDING=BREAKOUT (100).
Weighted Totals
BUY: flow(30%)+mom(25%)+PB(25%)+trend(10%)+turbo(10%); SELL adjusts turbo(20%)/PB(15%). Thresholds: BUY≥75, SELL≥72.
Advanced Features
2H Arbitration
Swing HH/HL/LL/LH detection resolves BUY/SELL conflicts; UP (HH/HL) favors longs, DOWN (LL/LH) shorts.
Divergence
RSI-based: price HH without RSI HH = BEAR DIV; price LL without RSI LL = BULL DIV.
Volume Surge
2x 20-SMA or 80th percentile: BULL/BEAR SURGE (directional), SURGE (neutral).
Signals & Risk
Raw triggers filtered (no DEEP PB BUY, no DOWN trend BUY, UP flow required); final uses 2H tiebreaker. RISK flags DIV, surges, DEEP PB, trend conflicts, score ties. Tiny BUY/SELL arrows on raw signals.
HUD Layout
14-row table: TREND/FLOW/MOM/PB/TURBO/FINAL/BUY*/SELL*/2H/DIV/VOL/RISK/Threshold. Stars rate scores (★★★★★=90+), color-coded statuses, gold FINAL. Perfect for SIL scalpers needing confluence + risk at a glance.

FX OSINT - Institutional Midnight Intelligence For ForexFX OSINT — Institutional Midnight Intelligence For Forex
See Your FX Charts Like an Intelligence Briefing, Not a Guess
If you’ve ever stared at EURUSD or GBPJPY and thought:
Where is the real liquidity?
Is this move sponsored by smart money or just noise?
Am I buying into premium or discount?
…then FX OSINT is designed for you.
FX OSINT (Forex Open Source Intelligence) treats the FX market the way an analyst treats an investigation:
Collect open‑source signals from price, time, and volatility.
Map out liquidity, structure, and sessions in a repeatable way.
Present them in a clean, non‑cluttered dashboard so you can read context quickly.
No rainbow spaghetti. No 12 indicators stacked on top of each other. Just structured information, midnight visuals, and a clear read on what the market is doing right now.
Why FX OSINT Exists
Many FX traders run into the same problems:
Overloaded charts – multiple indicators fighting for space, none talking to each other.
Signals with no context – arrows that ignore structure, sessions, and liquidity.
Tools not tuned for FX – generic indicators that don’t care what pair you are on.
FX OSINT brings this together into one FX‑focused framework that:
Understands structure : BOS/CHOCH, swings, and trend across multiple timeframes.
Respects liquidity : sweeps, order blocks, and FVGs with controlled visibility.
Reads volatility & ADR : how far today’s range has developed.
Knows the clock : London, New York, and key killzones.
Scores confluence : a 0–100 engine that summarizes how much is lining up.
FX OSINT is built for traders who want structured, institutional‑style logic with a disciplined, midnight‑themed UI —not flashing buy/sell buttons.
1. Midnight Dashboard — Top‑Right Intelligence Panel
This panel acts as your compact “situation room”:
CONFLUENCE — 0–100 score blending trend alignment, volatility regime, sessions, liquidity events, order blocks, FVGs, and ADR context.
REGIME — Low / Building / Normal / Expansion / Extreme, driven by ATR relationships, so you know if you’re in chop, trend, or expansion.
HTF / MTF / LTF TREND — Higher‑, medium‑, and current‑timeframe bias in one place, so you see if you are trading with or against the larger flow.
ADR USED — How much of today’s typical range has already been consumed in percentage terms.
PIP VALUE — Approximate pip size per pair, including JPY‑style pairs.
Everything is bold, legible, and color‑coded, but the layout stays minimal so you can:
Look once → understand the context.
2. Structure, BOS, CHOCH — Smart‑Money‑Style Skeleton
FX OSINT tracks swing highs and lows, then shows how structure evolves:
Trend logic based on evolving swings, not just a moving average cross.
BOS (Break of Structure) when price expands in the direction of trend.
CHOCH (Change of Character) when behavior flips and the market structure changes.
Labels are selective, not spammy . You don’t get a tag on every minor wiggle—only when structure meaningfully shifts, so it’s easier to answer:
"Are we continuing the current leg, or did something actually change here?"
3. Liquidity Sweeps, Order Blocks & FVGs — The OSINT Layer
FX OSINT treats liquidity as a key information layer:
Liquidity sweeps — Detects when price spikes through recent highs/lows and then snaps back, flagging potential stop runs.
Order blocks — The last opposite candle before a displacement move, drawn as controlled boxes with limited lifespan to avoid clutter.
Fair Value Gaps (FVGs) — Three‑candle imbalances rendered as precise zones with a cap on how many can exist at once.
Under the hood, boxes are managed so your chart does not become a wall of old zones:
// Draw Order Blocks with overlap prevention
if isBullishOB and showOrderBlocks
if array.size(obBoxes) >= maxBoxes
oldBox = array.shift(obBoxes)
box.delete(oldBox)
newBox = box.new(bar_index , low , bar_index + obvLength, high ,
border_color = bullColor, bgcolor = bullColorTransp,
border_width = 2, extend = extend.none)
array.push(obBoxes, newBox)
Box limits keep the number of zones under control.
Borders and transparency are tuned so you still see price clearly.
You end up with a curated liquidity map , rather than a chart buried under every level price has ever touched.
4. Volatility, ADR & Sessions — Time and Range Intelligence
FX OSINT runs a Volatility Regime Analyzer and an ADR engine in the background:
Volatility regime — Five states (Low → Extreme) derived from fast vs. slow ATR.
ADR bands — Daily high/mid/low projected from the current daily open.
ADR used % — How far today’s move has traveled relative to its typical range.
On the time side:
Asia, London, New York sessions are softly highlighted with a single active background to avoid overlapping colors.
Killzones (e.g., London and New York opens) can be emphasized when you want to focus on where significant moves often begin.
Together, this helps you answer:
"What time is it in the trading day?"
"How stretched are we?"
"Is expansion just starting, or are we late to the move?"
5. ICT‑Style Add‑Ons — BOS/CHOCH, Premium/Discount, and Confluence
For modern FX / ICT‑inspired workflows, FX OSINT includes:
BOS / CHOCH labels — Clear structural shifts based on swings.
Premium / Discount zones — 25%, 50%, 75% levels of the daily range, so you know if you are buying discount in an uptrend or selling premium in a downtrend.
Confluence score — A single number summarizing how many conditions line up in the current context.
Instead of replacing your plan, FX OSINT compresses your checklist into the chart:
Structure
Liquidity
Session / Time
Volatility / ADR
Higher‑timeframe alignment
When these agree, the dashboard reflects it. When they don’t, it stays neutral and lets you see the conflict.
How To Use FX OSINT
FX OSINT is not a signal bot. It is an information engine that organizes context so you can apply your own plan.
A typical workflow might look like:
Start on higher timeframes (e.g., H4/D1) to form directional bias from structure, volatility regime, and ADR context.
Move to intraday timeframes (e.g., M15/H1) around your chosen sessions (London and/or New York).
Look for confluence :
HTF / MTF / LTF trends aligned.
Price in discount for longs or premium for shorts.
Recent liquidity sweep into a meaningful OB or FVG.
Confluence score at or above a level you consider significant.
Then refine entries using BOS/CHOCH on lower timeframes according to your own risk and execution rules.
FX OSINT aims to make sure you do not enter a trade without seeing:
Where you are in the day (ADR and sessions).
Where you are in the volatility cycle (regime).
Who currently appears in control (structure and trend).
Which liquidity was just targeted (sweeps and zones).
Design Choices and Scope
FX OSINT was designed around a few clear constraints:
FX‑focused — Logic and filters tuned for FX majors, minors, exotics, and metals. It is intended for FX markets, not for every possible asset class.
Open‑source — The full Pine Script code is available so you can read it, learn from it, and adapt it to your own workflow if needed.
Clear themes — Two main visual styles (e.g., dark institutional “midnight” and a lighter accent variant) with a focus on readability, not visual noise.
Chart‑friendly — Panels use fixed areas, session highlights avoid overlapping, and boxes are capped/pruned so the chart remains usable.
FX OSINT is for only Forex pairs, not anything else!
Hope you enjoyed and remember your Open Source Intelligence Matters 😉!
-officialjackofalltrades

12M Return Strategy This strategy is based on the original Dual Momentum concept presented by Gary Antonacci in his book “Dual Momentum Investing.”
It implements the absolute momentum portion of the framework using a 12-month rate of change, combined with a moving-average filter for trend confirmation.
The script automatically adapts the lookback period depending on chart timeframe, ensuring the return calculation always represents approximately one year, whether you are on daily, weekly, or monthly charts.
How the Strategy Works
1. 12-Month Return Calculation
The core signal is the 12-month price return, computed as:
(Current Price ÷ Price from ~1 year ago) − 1
This return:
Plots as a histogram
Turns green when positive
Turns red when negative
The lookback adjusts automatically:
1D chart → 252 bars
1W chart → 52 bars
1M chart → 12 bars
Other timeframes → estimated to approximate 1 calendar year
2. Trend Filter (Moving Average of Return)
To smooth volatility and avoid noise, the strategy applies a moving average to the 12M return:
Default length: 12 periods
Plotted as a white line on the indicator panel
This becomes the benchmark used for crossovers.
3. Trade Signals (Long / Short / Cash)
Trades are generated using a simple crossover mechanism:
Bullish Signal (Go Long)
When:
12M Return crosses ABOVE its MA
Action:
Close short (if any)
Enter long
Bearish Signal (Go Short or Go Flat)
When:
12M Return crosses BELOW its MA
Action:
If shorting is enabled → Enter short
If shorting is disabled → Exit position and go to cash
Shorting can be enabled or disabled with a single input switch.
4. Position Sizing
The strategy uses:
Percent of Equity position sizing
You can specify the percentage of your portfolio to allocate (default 100%).
No leverage is required, but the strategy supports it if your account settings allow.
5. Visual Signals
To improve clarity, the strategy marks signals directly on the indicator panel:
Green Up Arrows: return > MA
Red Down Arrows: return < MA
A status label shows the current mode:
LONG
SHORT
CASH
6. Backtest-Ready
This script is built as a full TradingView strategy, not just an indicator.
This means you can:
Run complete backtests
View performance metrics
Compare long-only vs long/short behavior
Adjust inputs to tune the system
It provides a clean, rule-driven interpretation of the classic absolute momentum approach.
Inspired By: Gary Antonacci – Dual Momentum Investing
This script reflects the absolute momentum side of Antonacci’s original research:
Uses 12-month momentum (the most statistically validated lookback)
Applies a trend-following overlay to control downside risk
Recreates the classic signal structure used in academic studies
It is a simplified, transparent version intended for practical use and educational clarity.
Disclaimer
This script is for educational and research purposes only.
Historical performance does not guarantee future results.
Always use proper risk management.
