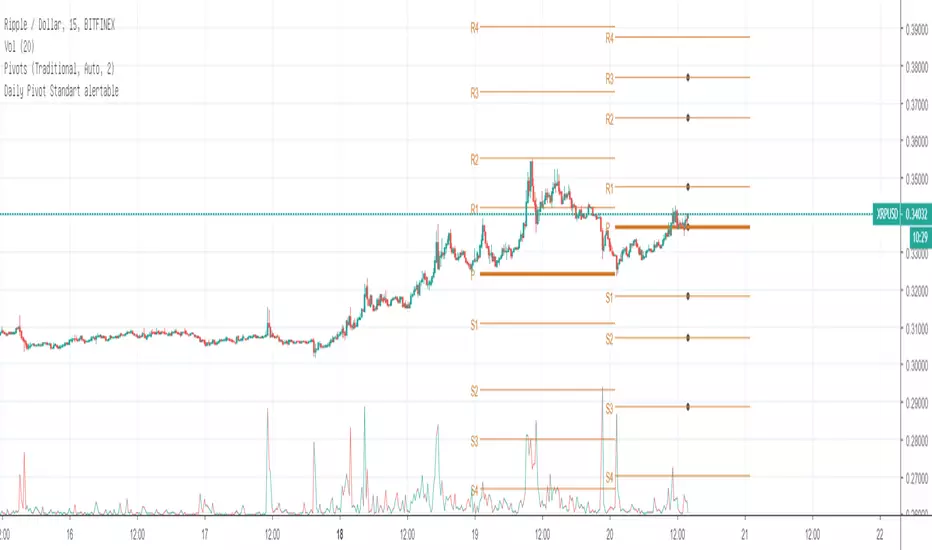
Daily Pivot Standart alertableWith this Indicator u can set allert between the Pivot points s15.directupload.net
So it is useful for scalping
"daily"に関するスクリプトを検索
Daily Moving Average to Intraday Chart BradleyRUses Robertob's Script with Mike's colors for Warrior Pro Students.


BTC Swinger v1Daily interval swing trading algorithm based on momentum techniques using ATR Stops. Made by Kory Hoang from Stably.
Shout out to the Advanced Crypto Asset Trading crew! ;)

MY_CME eod OI vs CFTC eow OIDaily e-o-d Open Interest as published by CME.
As CFTC COT Open Interest relates to last Tuesday, here you can have an idea how things evolved day-by-day since then.
As CME total OI is not accessibl as data, here I sum OI of the next 9 outstanding contracts, which gives a fair idea of the trend in OI


MTF EMA Combo with Background ColorDaily/Weekly EMA combo for longer term trend direction, with combo background color for varying trend direction.


Daily Average True Range OverlayPlots the upper and lower average true range away from the previous days close on all time frames.

Daily Deviations (Lazy Edition)
Plots the standard deviation resistance/support lines.
Uses Previous days close and the VIX as the volatility factor.
credit to u/UberBotMan and u/Living_Granger for the idea and formulas

Daily Deviations (Self Input Version)
Plots the standard deviation resistance/support levels.
Input the previous settlement price and the implied volatility.
credit to u/UberBotMan and u/Living_Granger for the idea and formulas
(preview example is using settlement of 2420 and IV of 11)


Daily Returns & STDWhat happened last time when xx increased by xx%? - Start collecting some stats!
You can choose the ticker and the timeframe you're interested in

RSI Oversold/UndersoldThe study script will place GREEN BUY arrows BELOW oversold conditions and RED SHORT arrows ABOVE overbought conditions. You can configure the period
Most RSI(14) indicators use a 14-period, I prefer a 5-period. The period, overbought and oversold periods are settings that can easily be changed by adding this study to your chart and clicking the "gear" icon next to the study inside your chart.


Daily SMAThis pine script on intraday chart is exactly the same SMA as built-in MovingAverage on a 1Day chart (with the same lengths)


CME Gold Dynamic Circuit Breaker & Prop Firm Buffer (6%-8%-10%)
Overview This indicator is designed specifically for Gold Futures (GC) and other assets subject to CME's Dynamic Circuit Breaker rules. Unlike Equity Indices (e.g., NQ, ES) which have fixed price limits based on the previous day's close, Gold uses a "Dynamic" limit that moves with the market.
Many prop firm traders lose their accounts not because of the daily percentage drop, but because of sudden intraday volatility that triggers trailing drawdown rules. This indicator helps you visualize the invisible "kill zones" calculated from the highest/lowest prices of the last 60 minutes.
Key Features
Dynamic Logic: Calculates limits based on the previous day's settlement price (Variant) applied to the Highest/Lowest price of the last 60 minutes.
Prop Firm Safety Buffer:
🟠 6% (Warning): Early warning line. Volatility is expanding; consider reducing position size.
🔴 8% (Critical): Danger zone. If price touches this level, you are at high risk of hitting prop firm trailing drawdowns or maximum loss limits.
🔵 10% (Hard Limit): CME Official Circuit Breaker level (Market Halt).
Real-time Visualization:
Extended Lines: Horizontal lines extend to the right of the chart for immediate visibility.
Clear Labels: Displays the exact percentage and price level at the current moment.
Stepline History: Shows historical limit levels to help analyze past volatility spikes.
How to Use
Do not rely on "Daily % Change": Even if Gold is only down -3% on the day, a sudden drop from a recent high can trigger the dynamic limit.
Respect the Orange Line (6%): When the price approaches the orange line, avoid chasing the trend. The risk of a sudden reversal or liquidity gap increases significantly.
Stay away from the Red Line (8%): This is the "No-Trade Zone" for prop traders.
Disclaimer This tool is for educational and informational purposes only. Always verify official margin requirements and trading rules with your specific broker or prop firm.
개요 이 지표는 골드 선물(GC) 및 CME 동적 서킷브레이커(Dynamic Circuit Breaker) 룰이 적용되는 상품을 위해 설계되었습니다. 나스닥(NQ)과 같은 지수 선물이 전일 종가 기준 '고정된' 제한폭을 가지는 것과 달리, 골드는 시장 가격 움직임에 따라 제한폭이 계속 변하는 '동적' 룰을 따릅니다.
많은 프랍 트레이더들이 일일 등락률만 보고 안심하다가, 순간적인 급등락으로 인해 '트레일링 드로우다운(Trailing Drawdown)'에 걸려 계좌를 잃곤 합니다. 이 지표는 직전 60분간의 고점/저점을 기준으로 보이지 않는 "위험 구간"을 시각화해 줍니다.
주요 기능
동적 계산 로직: **전일 정산가(Settlement)**를 기준으로 변동폭(Variant)을 계산하여, 직전 60분간의 최고가/최저가에 실시간으로 적용합니다.
프랍펌 안전 버퍼 (3단계 경보):
🟠 6% (Warning): 조기 경보 라인입니다. 변동성이 확대되고 있으므로 비중 축소를 고려해야 합니다.
🔴 8% (Critical): 위험 구간입니다. 이 라인에 근접하면 프랍펌의 트레일링 드로우다운이나 허용 손실 한도에 도달할 확률이 매우 높습니다. 진입을 자제하십시오.
🔵 10% (Hard Limit): CME 공식 서킷브레이커(거래 중단) 라인입니다.
실시간 시각화:
우측 연장선: 차트 우측 여백까지 선을 길게 뻗어, 현재 가격과 위험선 사이의 거리를 직관적으로 보여줍니다.
명확한 라벨: 현재 시점의 정확한 %와 가격을 표시합니다.
과거 내역: 과거에 위험선이 어떻게 움직였는지 계단식 선(Stepline)으로 보여주어 복기할 수 있습니다.
사용 팁
"일일 등락률"을 믿지 마십시오: 하루에 -3%밖에 안 빠졌더라도, 고점에서 급격하게 떨어졌다면 동적 제한선은 바로 밑까지 쫓아와 있을 수 있습니다.
오렌지색 선(6%)을 존중하십시오: 가격이 이 선에 닿으면 추격 매매를 멈추십시오. 유동성이 부족해지거나 급반등이 나올 수 있는 구간입니다.
빨간색 선(8%)은 "매매 금지 구역"입니다: 이 구간은 프랍 트레이더에게 생존이 걸린 마지노선입니다.
면책 조항 이 지표는 교육 및 정보 제공의 목적으로만 사용되어야 합니다. 실제 매매 시에는 반드시 본인이 사용하는 증권사나 프랍펌의 공식 규정을 확인하시기 바랍니다.

[TehThomas] - Order Blocks█ OVERVIEW
This Order Blocks indicator identifies institutional-level support and resistance zones using fractal pattern recognition combined with Fair Value Gap (FVG) filtering. Order blocks represent areas where large institutional orders have been placed, creating significant price reactions when retested. This indicator uses a 5-bar fractal pattern to detect market structure breaks and highlights the last bearish or bullish candle before a strong impulse move.
█ KEY FEATURES
- Fractal-Based Detection: Uses 5-candle fractal patterns to identify key market structure highs and lows
- FVG Filtering: Optional Fair Value Gap confirmation ensures order blocks are followed by true market imbalances
- Automatic Mitigation: Order blocks are automatically removed when price breaks through them
- Overlap Prevention: Prevents cluttered charts by avoiding overlapping order block zones
- Customizable Display: Full control over colors, labels, line heights (body/wick), and maximum blocks shown
- Dual Polarity: Detects both bullish (OB+) and bearish (OB-) order blocks independently
█ HOW IT WORKS
The indicator scans price action for fractal patterns where the middle candle forms a local extreme (highest high or lowest low among 5 bars). When price breaks above a fractal high or below a fractal low, the script identifies the last opposing candle in the impulse move as the order block.
For bearish order blocks, it finds the highest bullish candle before a fractal low is broken, marking institutional selling pressure. For bullish order blocks, it locates the lowest bearish candle before a fractal high is breached, indicating institutional buying.
When FVG filtering is enabled, the indicator confirms that a Fair Value Gap (a 3-candle imbalance where price leaves an unfilled gap) occurred within the specified distance from the order block. This combination increases the probability that institutional traders are present in these zones.
█ SETTINGS
Bullish Order Block Settings
- Show/hide bullish order blocks
- Customize fill color and border color
- Toggle OB+ label display
Bearish Order Block Settings
- Show/hide bearish order blocks
- Customize fill color and border color
- Toggle OB- label display
Label Settings
- Label size: Tiny, Small, Normal, or Large
- Label text color customization
General Settings
- Bars Back to Check (10-200): Lookback period for order block detection
- Filter by FVG: Requires Fair Value Gap confirmation
- Max Bars Between OB and FVG (1-6): Distance tolerance for FVG filtering
- Line Height: Choose between Body or Wick for order block boundaries
- Prevent Overlapping OBs: Avoids drawing overlapping zones
- Max Order Blocks to Display (1-50): Limits active blocks on chart
- Length of Boxes (10-100): Horizontal projection length
█ HOW TO USE
1. Add the indicator to your TradingView chart
2. Configure settings based on your trading timeframe and style
3. Watch for OB+ labels (bullish order blocks) as potential support zones where price may bounce
4. Watch for OB- labels (bearish order blocks) as potential resistance zones where price may reverse
5. Wait for price retracement to the order block zone before taking entries
6. Use confirmation signals like volume spikes or reversal patterns at the order block
7. Place stop loss just outside the order block boundary to manage risk
8. Monitor mitigation: Order blocks disappear when price breaks through them completely
█ TRADING STRATEGY EXAMPLES
Bullish Order Block Strategy
Wait for a market structure shift from bearish to bullish. When price creates a bullish impulse breaking a fractal high, identify the OB+ zone. Enter long positions when price retraces to test the bullish order block, placing stop loss 10-20 pips below the zone's low. Target previous highs or resistance levels.
Bearish Order Block Strategy
Monitor for market structure shift from bullish to bearish. After price creates a bearish impulse breaking a fractal low, locate the OB- zone. Enter short positions when price retraces to test the bearish order block, placing stop loss 10-20 pips above the zone's high. Target previous lows or support levels.
FVG-Confirmed Entries
Enable FVG filtering to only display order blocks validated by Fair Value Gaps. These aligned setups increase probability as they combine institutional order placement with market inefficiencies. Trade retracements to these high-confluence zones for better risk-reward ratios.
█ IDEAL FOR
- ICT Traders: Follows Inner Circle Trader methodology for institutional order flow
- Smart Money Concepts: Tracks where large players place orders
- Swing Traders: Identifies key support/resistance for multi-day holds
- Price Action Traders: Pure chart-based approach without lagging indicators
- Breakout Traders: Confirms structure breaks with fractal patterns
- Forex, Crypto, and Stock Markets: Works on all liquid markets and timeframes
█ TECHNICAL SPECIFICATIONS
- Max Boxes: 500
- Max Labels: 500
- Detection Method: 5-bar fractal pattern recognition
- Mitigation Logic: Automatic removal when price breaks order block boundaries
- Time Projection: Uses time offset calculations for box extension
- Array Management: Dynamic array cleanup to prevent memory issues
█ NOTES & DISCLAIMERS
- Order blocks work best when combined with overall market context and trend analysis
- Not all order blocks result in price reversals; use proper risk management
- FVG filtering may reduce the number of signals but increases quality
- Fractal patterns require 5 bars to form, causing a 2-bar delay in detection
- Works optimally on higher timeframes (4H, Daily) for institutional footprints
- This indicator does not guarantee profitable trades; always use stop losses
- Past performance of order blocks does not predict future results
- Compatible with other ICT concepts like liquidity sweeps and market structure

Sniper Swing Clean v6 (mobile-safe) updated version Professional Description
How to Use Sniper Swing — Clean v6 (Mobile-Safe)
Purpose
Sniper Swing — Clean v6 is a trend-aligned swing indicator designed to help traders identify high-probability entries and exits while minimizing noise. It works best in trending or gently rotating markets and is optimized for mobile charting.
A. Chart Setup
Recommended:
Timeframes: 5m–1h for active trading, 4h–Daily for swing trading
Instruments: Liquid equities, indices, and major ETFs
The indicator plots:
SMA 9 (entry trigger)
EMA 20 (trend and momentum)
Optional SMA 50 (higher-timeframe bias)
B. Buy (Long) Signal — How to Act
A BUY label appears when price reclaims short-term structure.
How to trade it:
Wait for price to cross above the SMA 9
Confirm EMA 20 is rising (and above SMA 50 if enabled)
Optional: Confirm price is closing above EMA 20
Enter on:
The close of the signal candle, or
A minor pullback that holds above SMA 9
Best context:
Higher lows
EMA 20 sloping upward
RSI not overbought
C. Sell / Short Signal — How to Act
The indicator offers two sell modes:
1) CrossUnder SMA 9 (Fast Exit)
Use in strong trends or fast markets
Exit longs or enter shorts when price loses SMA 9
2) AccuSell (Structure-Based)
Use in choppy or topping markets
Requires:
Loss of SMA 9 plus
Structural weakness (lower highs/lows, RSI < 50, or EMA 20 turning down)
How to trade it:
Exit longs when sell label appears
Aggressive traders may enter short positions
Conservative traders wait for follow-through
D. RSI Arrows — Context Only
OB arrows warn of potential exhaustion
OS arrows suggest relief or bounce zones
RSI does not trigger trades — it informs patience and risk
E. Position Coloring & State
Green candles = long bias
Purple candles = short bias
Background tint reinforces short exposure
Coloring persists until the opposite signal prints
This helps visually manage trades without staring at labels.
F. Risk Management (User-Defined)
The indicator does not manage stops or targets.
Common approaches:
Stop below recent swing low (longs)
Stop above recent swing high (shorts)
Scale partials near RSI OB/OS zones
G. When Not to Use It
Extremely low-volume chop
News-driven spikes
Range-bound micro consolidations
2. Explain It Like You’re 10 👶📈
Imagine the chart is a road, and the price is a car.
🟢 Green = Go
When the car drives above the yellow line, that means it’s probably going up.
The indicator says:
“Okay, the car looks like it wants to go forward. You can hop in.”
That’s a BUY.
🟣 Purple = Uh-Oh
When the car falls below the yellow line, it might start going down.
The indicator says:
“Careful… the car is slowing down or turning around.”
That’s a SELL.
🔵 Blue Line = Wind Direction
The blue line shows which way the wind is blowing.
If the wind blows up → going up is easier
If the wind blows down → going down is easier
You want to go with the wind, not fight it.
🔺 Red & Green Arrows = Too Fast / Too Slow
Red arrow = “The car is going too fast, might need a break”
Green arrow = “The car is tired, might bounce”
They don’t tell you to go or stop — they just say “pay attention.”
🎨 Colors Help You Remember
Green bars = you’re riding up
Purple bars = you’re riding down
Gray = nothing exciting happening
🚨 Important Rule
This tool doesn’t drive the car for you.
It just says: “Now might be a good time.”
You still decide when to get in and when to get out.
