Always show daily EMAThis script will always plot the daily EMA regardless of which timeframe you are on.
"daily"に関するスクリプトを検索

Average Daily Range - without open barBasic ADR-indicator that is showing the daily range on lower timeframes as well, without using the current open daily bar for calculation.
Also plots as line in a separate indicator window. Updates displayed value when hovering over the candles on the chart to see historical Numbers.

[naoligo] Pivot Points (Daily)Suporte/Resistência do Pivot diário para gráficos intraday
Marcação do S/R tradicional e S/R Fibonacci
Daily Pivot Point Support/Resistances on intraday charts
Both Traditional and Fibonacci methods plotted


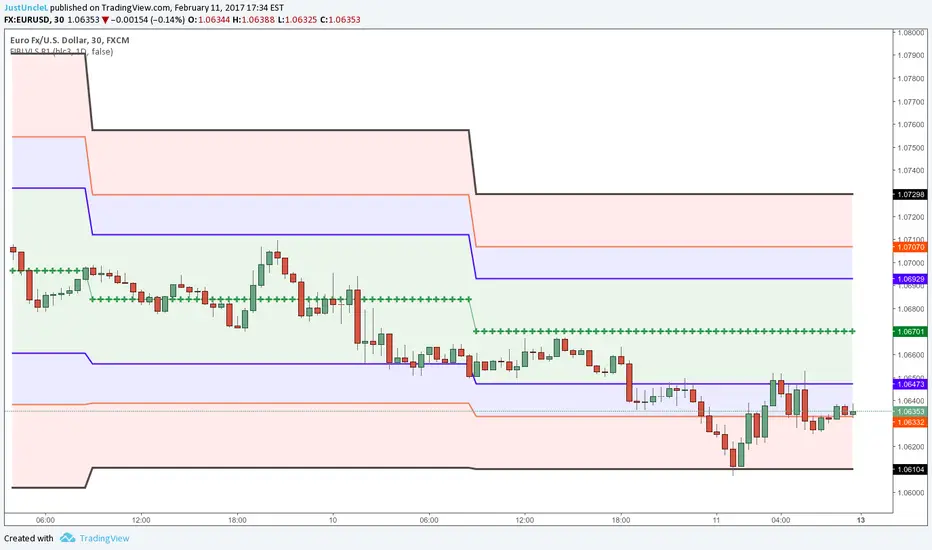
Auto Daily Fib Levels R2 by JustUncleLThis study is a variation of my "Automatic Daily Fibonnacci" indicator. This variation automatically draw Fibonacci Pivot levels (or optionally Classic Pivots) based on the previous day's highest and lowest points. The HLC3 is used as the default Daily Pivot level.
Unlike the "Automatic Daily Fibonnacci", this indicator does not redraw/update levels on current day even if the price goes past the R3/S3 levels.
Timeframe: is just a text string and is not checked, so needs to be a valid resolution eg: 60, 120, 240, 360, 480, 720, 1D, 1W, 1M, 2D, 2W, 3M
Pivot LEVELS:
Green = Pivot and Pivot Zone
Blue = R1,S1 Levels and Zone
Red = R2,S2 Levels and Zone
Black = R3,S3 Levels

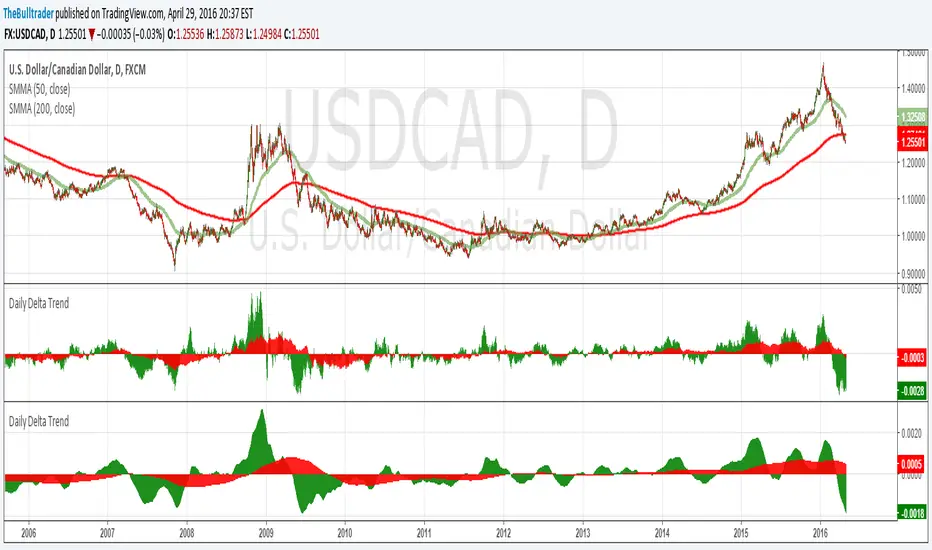
Daily Delta TrendDaily Delta Trend is a useful exponential moving average of the 50 day and 200 day simple moving average. In the first Daily Delta Trend I realized that the simple moving averages were pretty choppy as they were buy then sell over short period of times. So I thought taking an average of another average would smooth my results and give it buy and sell signals more clearly. In chart 1, you can see that it is choppy, and in chart 2 is much smoother.
The way I've been interpreting the chart is to trade it only when the 50-day average (GREEN) Trades with 200-day average (RED). For example, when red and green are both >0 = Buy and both <0 = Sell.
Just from a little of pretesting, I was able to find solid trades from multiple pairs.
DISCLAIMER, I have not actually traded this indicator as I just wrote it for the past few hours, But I thought it was interesting and maybe I might trade it. Feel free to play with it and comment back :P
CD_Average Daily Range Zones- highs and lows of the dayUses daily average ranges of 5 and 10 (most used) as buy (support) and highs (resistance) areas - half ranges used in calculations for a more accurate "forecast" of the H and L . Uses open but not close, so it does not repaint - experimental

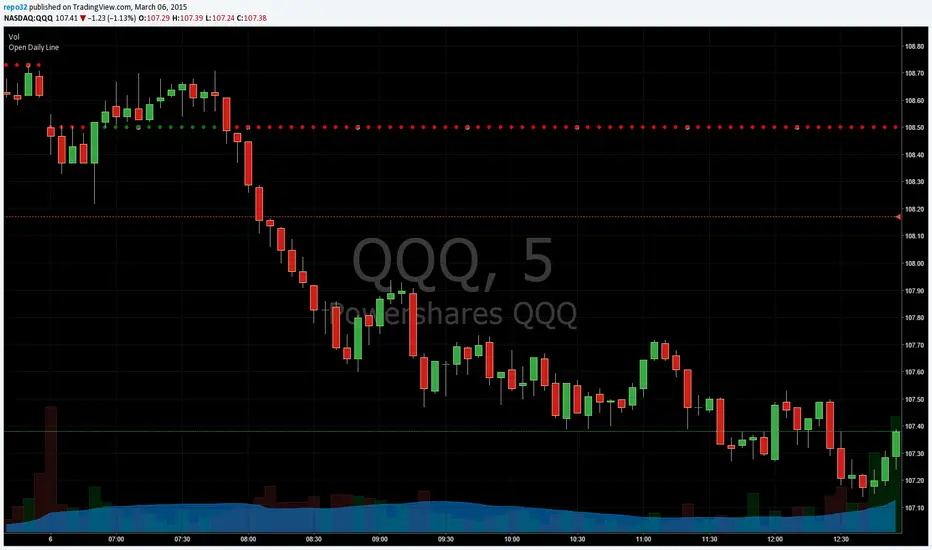
Open Close Daily LineThis will place circles on your chart for the opening daily price. If price is above, the circles are green. If price is below, the circles are red. I wanted to be able to see the opening price a bit easier while in smaller time frames.
I decided to add the previous daily closing line to the original script. Basically looking for good support / resistance

Open Daily LineThis will place circles on your chart for the opening daily price. If price is above, the circles are green. If price is below, the circles are red. I wanted to be able to see the opening price a bit easier while in smaller time frames.
Consecutive Candle CountAdaptation of www.fxcmapps.com from FXCM's Marketscope
Coded by David Rodriguez, Quantitative Strategist for DailyFX.com


Daily/Weekly EMAs on Lower TimeframesThis indicator allows traders to view Daily and Weekly EMAs (Exponential Moving Averages) directly on lower timeframes such as 1m, 5m, 15m, or 1h charts — providing a higher timeframe perspective without switching charts.
The script includes individual checkboxes for each EMA length — 5, 8, 9, 21, 50, and 200 — organized into two clear sections:
🟢 Daily EMAs
🔵 Weekly EMAs
You can selectively enable or disable any EMA to match your trading style and reduce chart clutter.
Each EMA is color-coded for clarity and consistency:
5 EMA: Green
8 EMA: Blue
9 EMA: Blue
21 EMA: Orange
50 EMA: Purple
200 EMA: Red
Weekly EMAs appear slightly transparent to distinguish them from daily ones.
This makes it easy to visualize higher timeframe trend direction, confluence zones, and dynamic support/resistance levels while trading intraday.
💡 Key Features
View Daily and Weekly EMAs on smaller timeframes.
Individual checkbox toggles for all 6 EMA lengths.
Separate sections for Daily and Weekly EMAs.
Color-coded lines for easy visual recognition.
Works seamlessly on any symbol or timeframe below Daily.

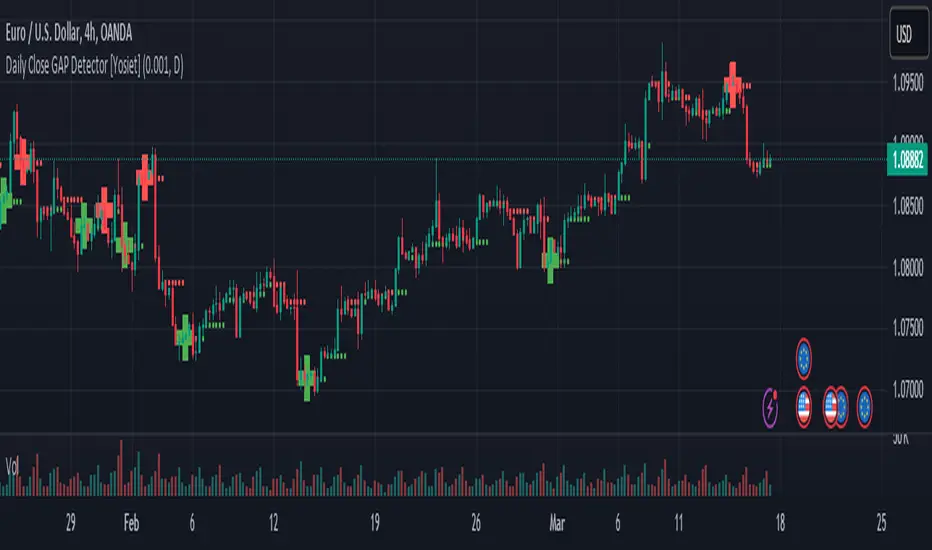
Daily Close GAP Detector [Yosiet]User Manual for "Daily Close GAP Detector "
Overview
This script is designed to help traders identify and react to significant gaps in daily market prices. It plots daily open and close prices and highlights significant gaps with a cross. The script is particularly useful for identifying potential breakouts or reversals based on these gaps.
Configuration
GAP Close Threshold: This input allows you to set a threshold for the gap size that you consider significant. The default value is 0.001.
Timeframe Seeker: This input lets you choose the timeframe for the gap detection. The default is 'D' for daily.
Features
Daily Open and Close Lines: The script plots daily open and close prices. If the close price is lower than the open price, the line is colored red; otherwise, it's green.
Gap Detection: It calculates the difference between the current day's close and the previous day's close, both adjusted for the selected timeframe. If this difference exceeds the threshold, it's considered a significant gap.
Significant Gap Indicator: A cross is plotted on the chart to indicate significant gaps. The color of the cross indicates whether the gap is a short or long gap: red for short gaps and green for long gaps.
Alert Conditions: The script sets up alert conditions for short and long gap breakouts. You can customize the alert messages to include details like the ticker symbol, interval, price, and exchange.
How to Use
Add the Script to Your Chart: Copy the script into the Pine Script editor on TradingView and add it to your chart.
Configure Inputs: Adjust the "GAP Close Threshold" and "Timeframe Seeker" inputs as needed.
Review the Chart: The script will overlay daily open and close prices on your chart, along with crosses indicating significant gaps.
Set Alerts: Use the script's alert conditions to set up alerts for short and long gap breakouts. You can customize the alert messages to suit your trading strategy.
Extending the Code
To extend this script, you can modify the gap detection logic, add more indicators, or integrate it with other scripts for a more comprehensive trading strategy. Remember to test any changes thoroughly before using them in live trading.
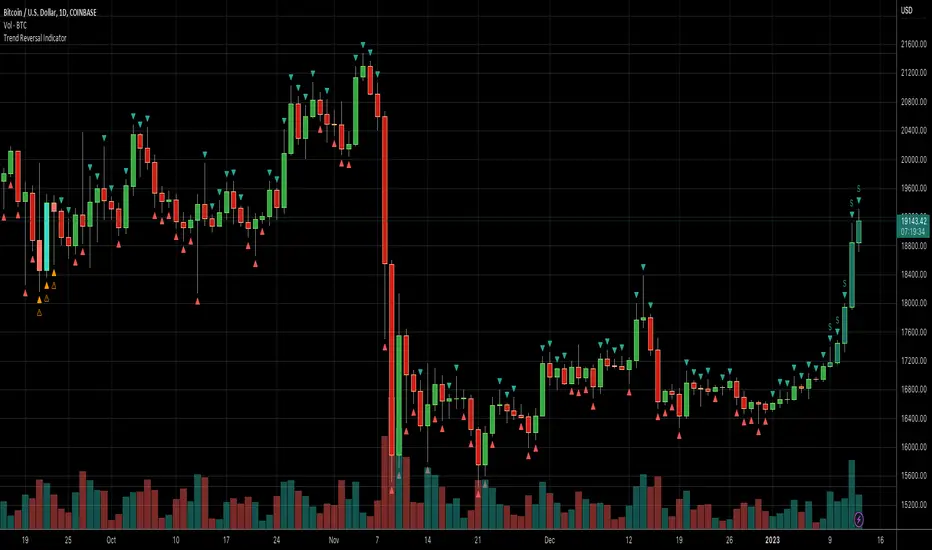
Daily Number/Trend Reversal IndicatorIndicator identifies potential price trend exhaustion.
Compares this period against the 4th prior period for the condition.
9 periods (or more) with the same condition is an indicator that the trend is ending soon.
Daily Session Windows background highlight indicatorIn intraday studies of stock indexes and Forex I have this weird habit of highlighting premarket, core session, lunch break and extended session with different backgrounds. If done by hand, this is tedious work that has to be repeated daily.
I think this feature should be built-in in TradingView. But it isn't.
For a few months now, I have been using this tiny indicator that does precisely that job. It saved me literally hours of focus time and mistakes. I have decided to revamp it and release it. I'm sure it can be useful to others.
Features:
Background color highlighting for premarket , core session , lunch hour and extended session of the trading day.
Session timing preset to match US session, but can be customized.
Can be enabled or disabled on a day of the week basis, including week-end.
Timezone is selectable, matches the chart's instrument but can be set independently to track a different timezone.
Not affected by the timezone you decided to assign to the chat's time scale.
Ready for stock indexes, but can be used to highlight Forex sessions too.

Daily Levels Suite + Market BreadthThere are many levels suites out there but many of them use the line series and/or label series to create multiple levels. Pine v5 provides the capability to use line arrays and labels so I wanted to create some code that is extensible to add additional lines/levels and labels to an array of lines with very little effort.
There is also some Market Breadth info that can be shown in the corners of the chart to allow a user to understand how the broader markets are moving compared to the security they are charting.
Current Levels provided are as follows:
Today's Open
Previous Days Close
Previous Days High/Low
Previous Days 50%
T+2 High/Low
All levels and the market breadth table is configurable to be hidden or shown based upon the user's desire.


Daily DashboardThe Daily Dashboard indicator provides a quick, at-a-glance view of essential daily market statistics directly on your TradingView chart.
Features:
- Daily High & Low: Track the highest and lowest prices of the current trading day.
- Total Daily Volume: Monitor the total trading volume accumulated during the day.
- Previous Day Breakouts: See if today’s price has broken the previous day’s high or low.
- Automatic Updates: All values refresh automatically at the start of a new trading day.
- Pinned Table Layout: Fixed in the top-right corner of the chart for easy reference, independent of price movements.
- Clean Design: White text on a semi-transparent blue background for maximum readability.
Use Cases:
- Day traders needing a quick overview of daily market activity.
- Swing traders monitoring key levels and breakout potential.
- Traders wanting a professional, lightweight dashboard without cluttering the chart.
How It Works:
- Tracks daily high, low, and volume in real time.
- Compares today’s price to the previous day’s high and low to identify breakouts.
- Displays all data neatly in a fixed table pinned to the chart.
Customization:
- Table position is fixed in the top-right corner.
- Background transparency and colors can be adjusted in the script if desired.
Pro Tip:
Combine this dashboard with trend or momentum indicators to create a complete trading setup.

Daily 50 per cent (High Low Dinamic)📊 Daily 50% Mid – Dynamic High/Low
🔎 Description
The Daily 50% Mid is a clean and objective indicator that plots the daily equilibrium level, calculated as 50% of the distance between the daily high and daily low.
Unlike static levels, this indicator is fully dynamic: as new daily highs or lows are formed, the 50% level is recalculated in real time throughout the trading session.
⚙️ How it works
Automatically detects:
📈 Daily High
📉 Daily Low
Calculates the daily midpoint:
(
𝐷
𝑎
𝑖
𝑙
𝑦
𝐻
𝑖
𝑔
ℎ
+
𝐷
𝑎
𝑖
𝑙
𝑦
𝐿
𝑜
𝑤
)
/
2
(Daily High+Daily Low)/2
Continuously updates the levels while the trading day is in progress.
📐 What the indicator plots
🔴 Daily High line
🟢 Daily Low line
🟡 50% of the Daily Range (Daily Mid) line
🎯 Trading applications
The 50% daily midpoint is widely used as:
A daily balance / equilibrium zone
A pullback level in trending days
A rejection area in range-bound markets
A confluence level with:
VWAP
Daily open
Volume Profile
Price structure
⏱️ Recommended timeframes
Designed for intraday charts
(1m, 5m, 15m, etc.)
Ideal for day trading
Not recommended for daily charts
🧠 Notes
Works on any asset (indices, stocks, forex, crypto)
Automatically resets at the start of each trading day
No future repainting

Daily Bias Trade Manager [MarkitTick]💡 The Daily Bias Trade Manager is a sophisticated technical analysis suite designed to automate the identification of high-probability intraday setups based on liquidity concepts and structural shifts. By synthesizing Previous Day High/Low (PDH/PDL) interactions with momentum confirmation and strict risk management protocols, this tool assists traders in navigating the "Daily Bias." It moves beyond simple signal generation by offering a complete trade management visualization system, projecting entries, stop losses, and take-profit levels directly onto the chart in real-time.
✨ Originality and Utility
This script distinguishes itself by integrating institutional price action theory—specifically Liquidity Sweeps and Change in State of Delivery (CISD)—with mechanical filtering. While many indicators simply highlight highs and lows, the Daily Bias Trade Manager validates these levels by analyzing what happens *after* price tests them.
It solves a common problem for intraday traders: "Analysis Paralysis." By automating the detection of structure breaks (MSS) and Fair Value Gaps (FVG) following a sweep of daily liquidity, it provides an objective framework for entry. Furthermore, the built-in "Position Box" feature removes the guesswork from trade execution by instantly calculating risk-to-reward ratios and visualizing them, allowing traders to see the feasibility of a trade before execution.
🔬 Methodology and Concepts
The core logic operates on a sequential detection model:
Liquidity Identification: The script first plots the Previous Day High (PDH) and Previous Day Low (PDL). These are critical institutional reference points where stop-loss orders (liquidity) often reside.
The Sweep: A "Sweep" is confirmed when price breaches a PDH/PDL but fails to sustain the breakout, closing back inside the previous day's range. This suggests a "Fake-out" or liquidity grab, often a precursor to a reversal.
Change in State of Delivery (CISD): Following a sweep, the script monitors local market structure. It looks for a decisive close past a recent swing point (Swing High for shorts, Swing Low for longs) within a user-defined bar window. This confirms that the counter-trend move has momentum.
Confluence Filtering: To reduce false positives, the engine applies optional filters:
RVOL (Relative Volume): Ensures the sweep occurred on significant volume (Climax behavior).
RSI Momentum: Verifies that momentum supports the reversal direction.
Trend Filter: Uses a long-term EMA to ensure trades align with the broader market direction.
Entry Model: Upon validation, the script calculates an entry at the close (or optionally at a Fair Value Gap), places a Stop Loss at the sweep extreme, and projects three Take Profit targets based on configurable R:R ratios.
🎨 Visual Guide
The indicator uses a distinct color-coded system to keep the chart clean yet informative:
● Liquidity Levels & Sweeps
Orange/Blue Lines: Represent the PDH (Previous Day High) and PDL (Previous Day Low).
Teal Shaded Zones: Indicate a "Buy-Side Sweep" (Price took highs and rejected).
Red Shaded Zones: Indicate a "Sell-Side Sweep" (Price took lows and rejected).
● Position Management Boxes
When a signal triggers, a structured box appears:
Solid Gray Line: The theoretical Entry Price.
Solid Red Line: The Stop Loss (SL), typically placed at the swing high/low of the sweep.
Dashed Blue Lines: Represent TP1, TP2, and TP3 targets based on Reward-to-Risk settings.
Labels: Data tags on the right side of the box show exact price coordinates for Entry, SL, and Targets.
● Signals & Clouds
Green "BUY" Labels: Appear below the bar when a bullish sweep and structural shift are confirmed.
Red "SELL" Labels: Appear above the bar when a bearish sweep is validated.
Yellow Clouds: Highlight Fair Value Gaps (FVG) used for entry confluence or retests.
● Multi-Timeframe (MTF) Dashboard
A panel (default: Top Right) displays the status of up to three higher timeframes.
Trend: Shows "BULL" or "BEAR" based on EMA alignment.
Liquidity: Indicates if the timeframe is "Taking Buy Liq", "Taking Sell Liq", or "Inside Range".
📖 How to Use
● Bullish Reversal Setup
Wait for price to drop below the Blue PDL Line.
Look for a Red Sell-Side Sweep Zone to form, indicating price has rejected lower prices.
Wait for the Green BUY Signal . This confirms a shift in structure (CISD) back to the upside.
Observe the Position Box. If the Risk/Reward is favorable (targets are within reasonable reach), consider the trade.
Optional: Use the "Dynamic Targets" setting to target the previous swing high instead of a fixed ratio.
● Bearish Reversal Setup
Wait for price to rally above the Orange PDH Line.
Look for a Teal Buy-Side Sweep Zone .
Wait for the Red SELL Signal confirming the rejection.
Ensure the dashboard shows alignment (e.g., Higher Timeframe Trend is Bearish) for higher probability.
● Trade Management
Enable the "ATR Trailing Stop" in settings to have the Stop Loss line dynamically adjust as price moves in your favor, locking in potential gains.
⚙️ Inputs and Settings
● General & Display
Show Daily Liquidity: Toggles the PDH/PDL lines.
Max Signals/Zones: Limits the visual clutter by restricting historical shapes.
● Detection Logic
Swing Detection Length: Controls the sensitivity of pivot points. Higher numbers = fewer, more significant swings.
CISD Window: How many bars after a sweep are allowed for the structure shift to occur.
Use FVG Entry: If true, the signal waits for a retest of a gap rather than entering immediately at the close.
● Filters
Volume (RVOL): Requires the sweep candle volume to be X times larger than average.
Trend Filter: Only allows Buy signals above the EMA and Sell signals below it.
Session Filter: Restricts signals to specific hours (e.g., New York Killzone).
● Targets & Management
Target R:R: Sets the multiplier for TP1, TP2, TP3 relative to the stop loss distance.
Use Dynamic Targets: Targets structural liquidity (Previous Highs/Lows) instead of fixed math ratios.
ATR Trailing Stop: Activates the trailing stop mechanism.
🔍 Deconstruction of the Underlying Scientific and Academic Framework
This indicator is grounded in the principles of Market Microstructure and Mean Reversion theory .
1. Liquidity Pools & Stop Runs:
Academic literature on market microstructure suggests that order flow clusters around obvious visual references (PDH/PDL). Large market participants often utilize this "resting liquidity" to fill large block orders with minimal slippage. The "Sweep" logic detects this absorption phase.
2. Volatility Breakout vs. Fake-out:
The script differentiates between a genuine breakout and a mean-reverting "fake-out" by analyzing the Close relative to the Range . A close back within the prior day's range after a breach signifies a failure of auction in the new territory, statistically increasing the probability of a reversion to the mean (equilibrium).
3. Momentum Validation (RSI & RVOL):
By integrating Relative Volume (RVOL) and RSI, the script applies statistical significance testing to the price action. High volume at a range extreme without price progress (the sweep) indicates "Stopping Volume" or absorption, a key concept in Volume Spread Analysis (VSA).
🙏 Gratitude
I would like to express my gratitude to harry040708 for sharing the insightful idea that made this script possible.
⚠️ Disclaimer
All provided scripts and indicators are strictly for educational exploration and must not be interpreted as financial advice or a recommendation to execute trades. I expressly disclaim all liability for any financial losses or damages that may result, directly or indirectly, from the reliance on or application of these tools. Market participation carries inherent risk where past performance never guarantees future returns, leaving all investment decisions and due diligence solely at your own discretion.

Daily & Intraday Trend Alignment Strategy (KOSPI)This strategy is designed for the KOSPI market, focusing on the synergy between daily price action and intraday momentum. It is specifically backtested on KODEX 200 Leverage (122630) with a realistic capital of 10,000,000 KRW.
Key Logic:
Trend Alignment: The script identifies the daily trend by comparing the current price with the previous day's close.
Execution: It enters a position only when the intraday candle (15M or 60M) aligns with the daily trend.
LONG: Daily Bullish + Intraday Bullish Close.
SHORT: Daily Bearish + Intraday Bearish Close.
Risk Management: - Follows TradingView House Rules by limiting risk to 10% of equity per trade.
Includes realistic 0.04% commission and 2-tick slippage.
Features built-in Stop Loss and Take Profit levels.
Intraday Focus: Automatically closes all positions at 14:50 KST to avoid overnight market gaps.

Daily Relative Strength (Daily Update)📊 Daily Relative Strength Rank Table (Crypto / Multi-Asset)
This indicator provides a daily relative strength ranking of multiple assets using normalized percentage returns (Z-Scores). It is designed to help traders quickly identify which tokens are outperforming or underperforming the group, both today (live) and yesterday (finalized).
🔍 How It Works
Each asset’s daily percentage return is calculated from the daily close.
Returns are then normalized (Z-score) across the selected group, showing how far each asset deviates from the group average.
Assets are ranked from strongest to weakest based on today’s normalized score.
📈 Table Columns
Rank – Relative position vs other assets (higher = stronger)
Token – Asset symbol
Today Z – Live, intraday relative strength (updates in real time)
Yday Z – Frozen relative strength from the previous daily close
The Yesterday score does not repaint and remains constant throughout the day, allowing for clear comparison between today’s performance and the prior session.
🎯 Why Use This Indicator?
Quickly spot leaders and laggards
Compare assets on a percent-based, normalized scale
Avoid price bias (low-price and high-price assets are treated equally)
Ideal for rotation strategies, momentum trading, and market strength analysis
⚙️ Customization
All symbols can be changed directly in the indicator settings
Works on any timeframe (daily logic is handled internally)
Designed for crypto, but works with stocks, forex, or indices
🧠 Best Use Cases
Identifying top outperformers
Confirming trend continuation
Comparing sector or basket strength
Improving timing and capital allocation decisions
