Value RangeHere is another attempt to chase value based on technical analysis.
This is extended version of PE range script published earlier.
Instead of just PE, this script contains several other factors which defines value. You can chose which factor to look at from input dialog:
Possible value factors included in this script are:
Price to Earnings
Price to Sales
Price to Book
PE - Forwarding
PS - Forwarding
Price to Cashflow
Enterprise Value to EBITDA
Enterprise Value to Cashflow
Some of these can be added to chart directly from financials. But, the script also calculate range based on donchian channel or bollinger bands. Instead of short periods, we are looking for periods in terms of years. Rest of things remain same.
"donchian"に関するスクリプトを検索

Relative Channel BandwidthThis indicator uses different volatility channels - Bollinger Band, Donchian Channel and Keltner Channel width to measure volatility.
Indicator plots channel bandwidth percentage with respect to close price.
This is not same as Bollinger Percent B - which is measure of where price is with respect to band. Instead this indicator is similar to ATR Percent indicator published here:
Plotting is color coded to indicate volatility zone:
Red : Extreme volatility
Orange : High volatility
Lime : Low volatility
Green : Extreme low volatility
These levels are again derived by long period bollinger bands

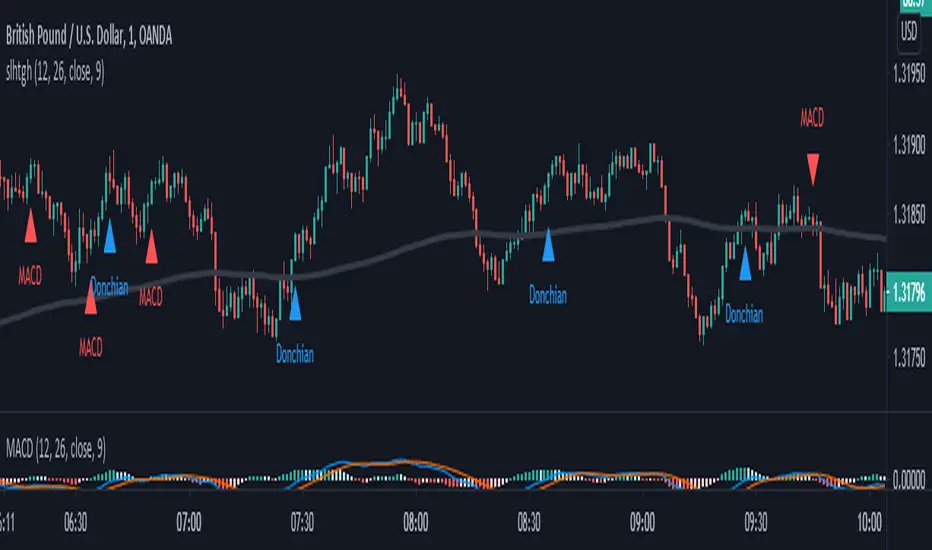
SALEH All in One Strategythis script is based on MACD strategy
for MACD:
when we have an uptrend ( the price is above the EMA 200) & the macd line cross up the signal line while they are both under the 0 level of histogram it generates buy signals.
when we have a downtrend ( the price is below the EMA 200) & the macd line cross below the signal line while they are both above the 0 level of histogram it generates sell signals.
donchian channel works as a confirmation for the macd signal.
this strategy works best at London session.
feel free to comment
best regards Forexsquad2020
[M2J] Indicator | Turtle Atom Duck Signal Turtle Atom Duck shows potential buy and sell
It consist of 3 indicators
Turtle - Donchian Channel
- bullish when price close above previous 1 bar high
- bearish when price close below previous 1 bar low
Atom - Bollinger Band
- bullish when price close above upper band
- bearish when price close below lower band
Duck - Moving Average (Default 50-period EMA)
- bullish when price close above moving average
- bearish when price close below moving average
When all 3 are bullish, buy signal appears
When all 3 are bearish, sell signal appears
Screener Turtle Atom Duck
Example:
FBMKLCI
Technology Sector
Health Sector
TOPGLOV
BINTAI
XOX
PRLEXUS
JCY
EURUSD
XAUUSD

GM All-purposeThis script plots multiple EMA's also it shows you when a particular EMA crosses up or below another EMA. You can customize the EMA's based on your setups or preferences.
This script basically will help you easily identify when a particular EMA has crossed over or crossed under another EMA at one glance.
Particularly useful when there is a lot of entanglement of the EMA's
There is also dual Bollinger Bands & Donchian Channels that are available to check the volatility of that particular scrip, which will help you stay in the trade or exit based on your criteria.

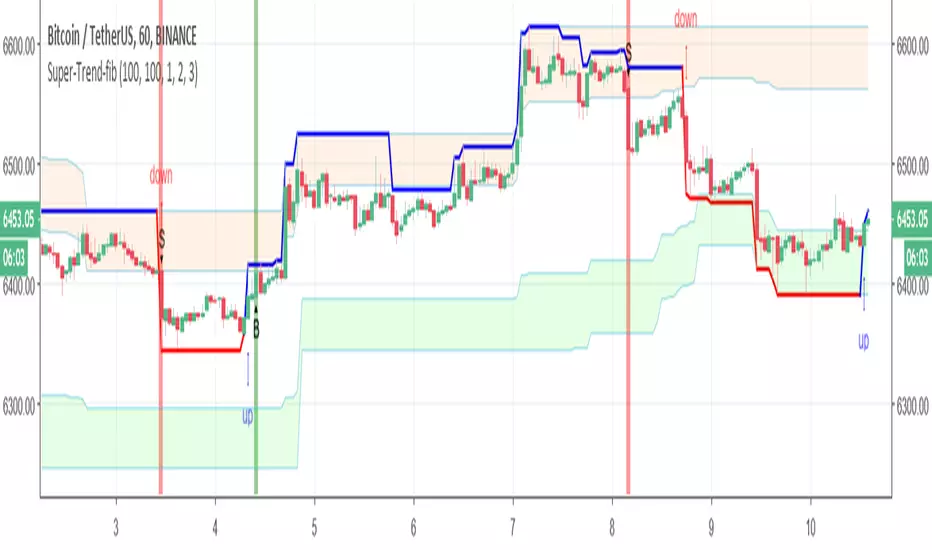
Super-Trend-fibIn this model we have fib Donchian channel with super trend alerts (B=buy) S =sell
and trailing volume system up trend alert and down trend alert
so have fun

RSI ZonesThis is a combination of a couple ideas I saw on here. The result is from three configurable EMA smoothed RSI overbought/oversold zones. The default is set to Donchian Channel mode where the highs/lows of the RSI's are plotted. An optional basis line derived from the slowest RSI is also included. Toggling this mode off gives you different results.
You'll want to play with different lengths for your own preferences and to see what works best for you.
Being able to see price bounce between these zones should hopefully give you some ideas on how you could potentially use this.
Credit to LazyBear for the initial idea.
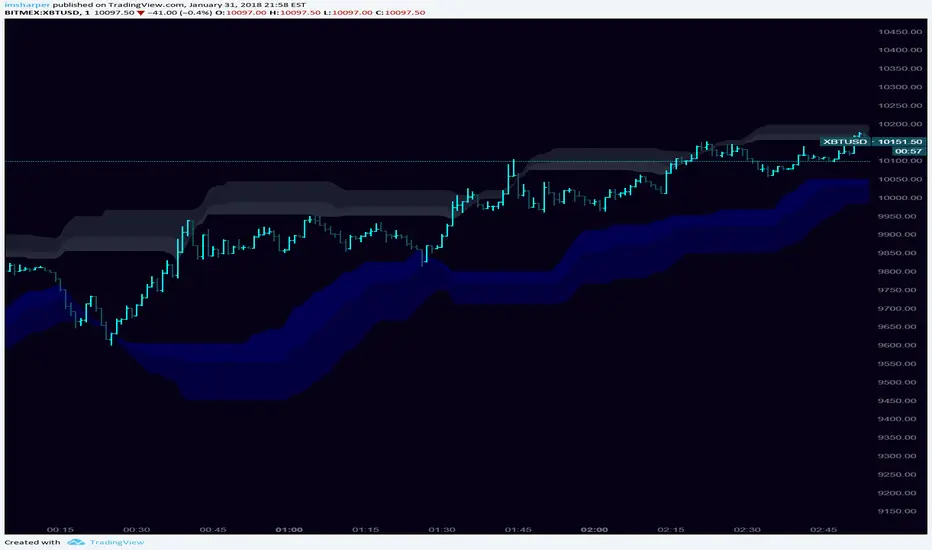
Highest/Lowest Channel Multi-Time FramePlots the Highest and Lowest source price for N bars back. Similar to Donchian Channels except any price source can be used (best results: close ). Can be set to any interval independent of the chart interval. Repainting will occur if the chart interval is less than the indicator interval.

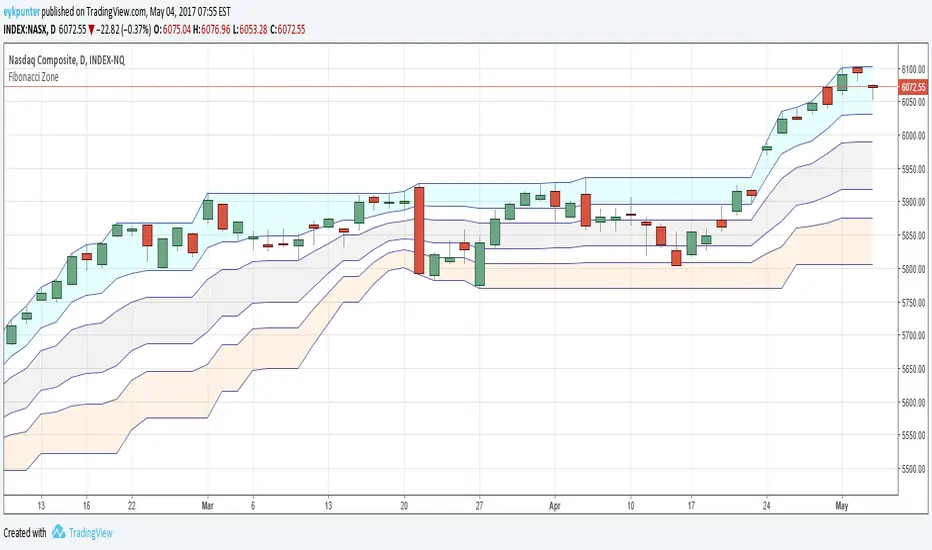
Fibonacci ZoneMy first attempt in Pine.
It is a Donchian Channel, but in stead of the median line I added the four Fibonacci lines and colored three of the five ensuing zones in suggestive colors.
The blue zone is up trend zone
The gray zone is ranging zone
The orange zone is down trend zone.
The white zones are 'in betweens'
For the fibs to function properly it needs to be a 20 - 30 period channel.
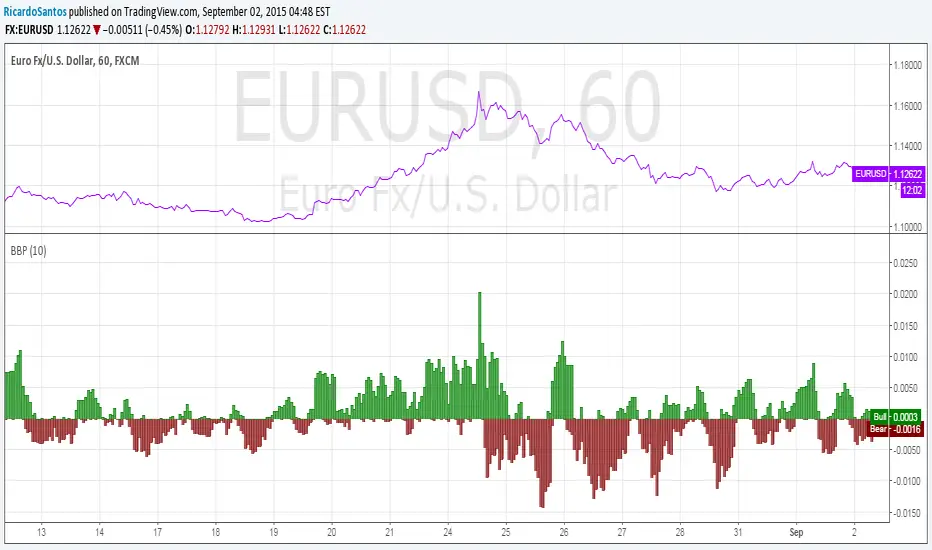
[RS]Linear Regression Bull and Bear Power Accumulation V1EXPERIMENTAL:
Bull and Bear power based on linear regression (this is a non lagging oscillator, the parameter are for the lookup window for the donchian extremes)
this indicator can also be used for convergence/divergence.
(accidentjev2) added multi timeframe support (indicator may repaint values)

[RS]Linear Regression Bull and Bear Power V0EXPERIMENTAL:
Bull and Bear power based on linear regression (this is a non lagging oscillator, the parameter are for the lookup window for the donchian extremes)
this indicator can also be used for convergence/divergence.
CapnsSurferThis is a simple RMA Trend that may help you decide for SL or TP. Similar to CapnsBands this uses Donchian Channels.. but remember. Your Trade Your Money
Howto Read Capns Surfer - I will write more later
First of all this is NOT a BUY or SELL indicator. However with this you can define sweet spots for ENTRIES, or TRAILING STOPS and recognize the trend.
Sweetspots

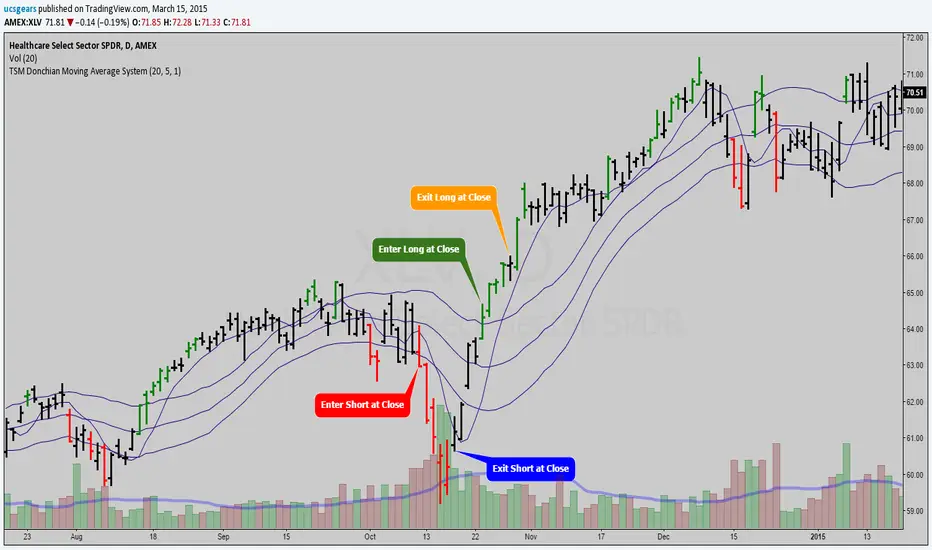
TSM Donchian Moving Average System_by_ucsgearsThis is just the raw code for the system / strategies.
Will Complete this when I get more time.
Green - Setup Long
Red - Setup Short
CM_Donchian Channels Modified_V2 - Alert CapableCM_Donchian Channels Modified_V2 With Alert Capability
***This Indicator was created by user Request to Add Alerts Capabilities for Donchian Channels.
New Features:
***Alerts Work - Ability To Create Alerts From Main Indicator.
***Can Also Be Used In Conjunction with Lower Indicator - CM_Donchian Channels Modified_V2_Lower_Alert
***Added Ability To Turn On/Off Highlight Bars.
***Added Ability to Turn On/Off Donch Channel Midline
***Added Ability to Turn On/Off Triangles That Plot At Top and Bottom Of Chart When Breakout Condition is TRUE.
Special Indicator Features:
***Ability To Use Different LookBack Period on Upper and Lower Donch Channel Lines.
How To Create Alerts:
***Create Alert by selecting Indicator - Either the name of the Upper Or Lower Indicator...
***Then select either Alert Breakout Upside or Downside(To The Right Of Indicator Name)
***Select Greater Than
***Select Value
***For Value put .99
Original Post Explaining Indicator is -
***If You Need Help Getting Custom Indicators to Trigger Alerts then View This Post.

CM_Donchian Channels Modified_V2_Lower_Alert***This Indicator was created by user Request to Add Alerts Capabilities for Donchian Channels.
New Features:
***Alerts Work - Ability To Create Alerts From Main Indicator.
***Can Also Be Used In Conjunction with Upper Indicator - CM_Donchian Channels Modified_V2 With Alert Capability
***Added Ability To Turn On/Off Highlight Bars.
***Added Ability to Turn On/Off Donch Channel Midline
***Added Ability to Turn On/Off Triangles That Plot At Top and Bottom Of Chart When Breakout Condition is TRUE.
Special Indicator Features:
***Ability To Use Different LookBack Period on Upper and Lower Donch Channel Lines.
How To Create Alerts:
***Create Alert by selecting Indicator - Either the name of the Upper Or Lower Indicator...
***Then select either Alert Breakout Upside or Downside(To The Right Of Indicator Name)
***Select Greater Than
***Select Value
***For Value put .99
Original Post Explaining Indicator is -
***If You Need Help Getting Custom Indicators to Trigger Alerts then View This Post.

ICT Donchian Smart Money Structure (Expo)█ Concept Overview
The Inner Circle Trader (ICT) methodology is focused on understanding the actions and implications of the so-called "smart money" - large institutions and professional traders who often influence market movements. Key to this is the concept of market structure and how it can provide insights into potential price moves.
Over time, however, there has been a notable shift in how some traders interpret and apply this methodology. Initially, it was designed with a focus on the fractal nature of markets. Fractals are recurring patterns in price action that are self-similar across different time scales, providing a nuanced and dynamic understanding of market structure.
However, as the ICT methodology has grown in popularity, there has been a drift away from this fractal-based perspective. Instead, many traders have started to focus more on pivot points as their primary tool for understanding market structure.
Pivot points provide static levels of potential support and resistance. While they can be useful in some contexts, relying heavily on them could provide a skewed perspective of market structure. They offer a static, backward-looking view that may not accurately reflect real-time changes in market sentiment or the dynamic nature of markets.
This shift from a fractal-based perspective to a pivot point perspective has significant implications. It can lead traders to misinterpret market structure and potentially make incorrect trading decisions.
To highlight this issue, you've developed a Donchian Structure indicator that mirrors the use of pivot points. The Donchian Channels are formed by the highest high and the lowest low over a certain period, providing another representation of potential market extremes. The fact that the Donchian Structure indicator produces the same results as pivot points underscores the inherent limitations of relying too heavily on these tools.
While the Donchian Structure indicator or pivot points can be useful tools, they should not replace the original, fractal-based perspective of the ICT methodology. These tools can provide a broad overview of market structure but may not capture the intricate dynamics and real-time changes that a fractal-based approach can offer.
It's essential for traders to understand these differences and to apply these tools correctly within the broader context of the ICT methodology and the Smart Money Concept Structure. A well-rounded approach that incorporates fractals, along with other tools and forms of analysis, is likely to provide a more accurate and comprehensive understanding of market structure.
█ Smart Money Concept - Misunderstandings
The Smart Money Concept is a popular concept among traders, and it's based on the idea that the "smart money" - typically large institutional investors, market makers, and professional traders - have superior knowledge or information, and their actions can provide valuable insight for other traders.
One of the biggest misunderstandings with this concept is the belief that tracking smart money activity can guarantee profitable trading.
█ Here are a few common misconceptions:
Following Smart Money Equals Guaranteed Success: Many traders believe that if they can follow the smart money, they will be successful. However, tracking the activity of large institutional investors and other professionals isn't easy, as they use complex strategies, have access to information not available to the public, and often intentionally hide their moves to prevent others from detecting their strategies.
Instantaneous Reaction and Results: Another misconception is that market movements will reflect smart money actions immediately. However, large institutions often slowly accumulate or distribute positions over time to avoid moving the market drastically. As a result, their actions might not produce an immediate noticeable effect on the market.
Smart Money Always Wins: It's not accurate to assume that smart money always makes the right decisions. Even the most experienced institutional investors and professional traders make mistakes, misjudge market conditions, or are affected by unpredictable events.
Smart Money Activity is Transparent: Understanding what constitutes smart money activity can be quite challenging. There are many indicators and metrics that traders use to try and track smart money, such as the COT (Commitments of Traders) reports, Level II market data, block trades, etc. However, these can be difficult to interpret correctly and are often misleading.
Assuming Uniformity Among Smart Money: 'Smart Money' is not a monolithic entity. Different institutional investors and professional traders have different strategies, risk tolerances, and investment horizons. What might be a good trade for a long-term institutional investor might not be a good trade for a short-term professional trader, and vice versa.
█ Market Structure
The Smart Money Concept Structure deals with the interpretation of price action that forms the market structure, focusing on understanding key shifts or changes in the market that may indicate where 'smart money' (large institutional investors and professional traders) might be moving in the market.
█ Three common concepts in this regard are Change of Character (CHoCH), and Shift in Market Structure (SMS), Break of Structure (BMS/BoS).
Change of Character (CHoCH): This refers to a noticeable change in the behavior of price movement, which could suggest that a shift in the market might be about to occur. This might be signaled by a sudden increase in volatility, a break of a trendline, or a change in volume, among other things.
Shift in Market Structure (SMS): This is when the overall structure of the market changes, suggesting a potential new trend. It usually involves a sequence of lower highs and lower lows for a downtrend, or higher highs and higher lows for an uptrend.
Break of Structure (BMS/BoS): This is when a previously defined trend or pattern in the price structure is broken, which may suggest a trend continuation.
A key component of this approach is the use of fractals, which are repeating patterns in price action that can give insights into potential market reversals. They appear at all scales of a price chart, reflecting the self-similar nature of markets.
█ Market Structure - Misunderstandings
One of the biggest misunderstandings about the ICT approach is the over-reliance or incorrect application of pivot points. Pivot points are a popular tool among traders due to their simplicity and easy-to-understand nature. However, when it comes to the Smart Money Concept and trying to follow the steps of professional traders or large institutions, relying heavily on pivot points can create misconceptions and lead to confusion. Here's why:
Delayed and Static Information: Pivot points are inherently backward-looking because they're calculated based on the previous period's data. As such, they may not reflect real-time market dynamics or sudden changes in market sentiment. Furthermore, they present a static view of market structure, delineating pre-defined levels of support and resistance. This static nature can be misleading because markets are fundamentally dynamic and constantly changing due to countless variables.
Inadequate Representation of Market Complexity: Markets are influenced by a myriad of factors, including economic indicators, geopolitical events, institutional actions, and market sentiment, among others. Relying on pivot points alone for reading market structure oversimplifies this complexity and can lead to a myopic understanding of market dynamics.
False Signals and Misinterpretations: Pivot points can often give false signals, especially in volatile markets. Prices might react to these levels temporarily but then continue in the original direction, leading to potential misinterpretation of market structure and sentiment. Also, a trader might wrongly perceive a break of a pivot point as a significant market event, when in fact, it could be due to random price fluctuations or temporary volatility.
Over-simplification: Viewing market structure only through the lens of pivot points simplifies the market to static levels of support and resistance, which can lead to misinterpretation of market dynamics. For instance, a trader might view a break of a pivot point as a definite sign of a trend, when it could just be a temporary price spike.
Ignoring the Fractal Nature of Markets: In the context of the Smart Money Concept Structure, understanding the fractal nature of markets is crucial. Fractals are self-similar patterns that repeat at all scales and provide a more dynamic and nuanced understanding of market structure. They can help traders identify shifts in market sentiment or direction in real-time, providing more relevant and timely information compared to pivot points.
The key takeaway here is not that pivot points should be entirely avoided or that they're useless. They can provide valuable insights and serve as a useful tool in a trader's toolbox when used correctly. However, they should not be the sole or primary method for understanding the market structure, especially in the context of the Smart Money Concept Structure.
█ Fractals
Instead, traders should aim for a comprehensive understanding of markets that incorporates a range of tools and concepts, including but not limited to fractals, order flow, volume analysis, fundamental analysis, and, yes, even pivot points. Fractals offer a more dynamic and nuanced view of the market. They reflect the recursive nature of markets and can provide valuable insights into potential market reversals. Because they appear at all scales of a price chart, they can provide a more holistic and real-time understanding of market structure.
In contrast, the Smart Money Concept Structure, focusing on fractals and comprehensive market analysis, aims to capture a more holistic and real-time view of the market. Fractals, being self-similar patterns that repeat at different scales, offer a dynamic understanding of market structure. As a result, they can help to identify shifts in market sentiment or direction as they happen, providing a more detailed and timely perspective.
Furthermore, a comprehensive market analysis would consider a broader set of factors, including order flow, volume analysis, and fundamental analysis, which could provide additional insights into 'smart money' actions.
█ Donchian Structure
Donchian Channels are a type of indicator used in technical analysis to identify potential price breakouts and trends, and they may also serve as a tool for understanding market structure. The channels are formed by taking the highest high and the lowest low over a certain number of periods, creating an envelope of price action.
Donchian Channels (or pivot points) can be useful tools for providing a general view of market structure, and they may not capture the intricate dynamics associated with the Smart Money Concept Structure. A more nuanced approach, centered on real-time fractals and a comprehensive analysis of various market factors, offers a more accurate understanding of 'smart money' actions and market structure.
█ Here is why Donchian Structure may be misleading:
Lack of Nuance: Donchian Channels, like pivot points, provide a simplified view of market structure. They don't take into account the nuanced behaviors of price action or the complex dynamics between buyers and sellers that can be critical in the Smart Money Concept Structure.
Limited Insights into 'Smart Money' Actions: While Donchian Channels can highlight potential breakout points and trends, they don't necessarily provide insights into the actions of 'smart money'. These large institutional traders often use sophisticated strategies that can't be easily inferred from price action alone.
█ Indicator Overview
We have built this Donchian Structure indicator to show that it returns the same results as using pivot points. The Donchian Structure indicator can be a useful tool for market analysis. However, it should not be seen as a direct replacement or equivalent to the original Smart Money concept, nor should any indicator based on pivot points. The indicator highlights the importance of understanding what kind of trading tools we use and how they can affect our decisions.
The Donchian Structure Indicator displays CHoCH, SMS, BoS/BMS, as well as premium and discount areas. This indicator plots everything in real-time and allows for easy backtesting on any market and timeframe. A unique candle coloring has been added to make it more engaging and visually appealing when identifying new trading setups and strategies. This candle coloring is "leading," meaning it can signal a structural change before it actually happens, giving traders ample time to plan their next trade accordingly.
█ How to use
The indicator is great for traders who want to simplify their view on the market structure and easily backtest Smart Money Concept Strategies. The added candle coloring function serves as a heads-up for structure change or can be used as trend confirmation. This new candle coloring feature can generate many new Smart Money Concepts strategies.
█ Features
Market Structure
The market structure is based on the Donchian channel, to which we have added what we call 'Structure Response'. This addition makes the indicator more useful, especially in trending markets. The core concept involves traders buying at a discount and selling or shorting at a premium, depending on the order flow. Structure response enables traders to determine the order flow more clearly. Consequently, more trading opportunities will appear in trending markets.
Structure Candles
Structure Candles highlight the current order flow and are significantly more responsive to structural changes. They can provide traders with a heads-up before a break in structure occurs
-----------------
Disclaimer
The information contained in my Scripts/Indicators/Ideas/Algos/Systems does not constitute financial advice or a solicitation to buy or sell any securities of any type. I will not accept liability for any loss or damage, including without limitation any loss of profit, which may arise directly or indirectly from the use of or reliance on such information.
All investments involve risk, and the past performance of a security, industry, sector, market, financial product, trading strategy, backtest, or individual's trading does not guarantee future results or returns. Investors are fully responsible for any investment decisions they make. Such decisions should be based solely on an evaluation of their financial circumstances, investment objectives, risk tolerance, and liquidity needs.
My Scripts/Indicators/Ideas/Algos/Systems are only for educational purposes!

ADX with Donchian Channels
The "ADX with Donchian Channels" indicator combines the Average Directional Index (ADX) with Donchian Channels to provide traders with a powerful tool for identifying trends and potential breakouts.
Features:
Average Directional Index (ADX):
The ADX is used to quantify the strength of a trend. It helps traders determine whether a market is trending or ranging.
Adjustable parameters for ADX smoothing and DI length allow traders to fine-tune the sensitivity of the trend strength measurement.
Donchian Channels on ADX:
Donchian Channels are applied directly to the ADX values to highlight the highest high and lowest low of the ADX over a specified period.
The upper and lower Donchian Channels can signal potential trend breakouts when the ADX value moves outside these bounds.
The middle Donchian Channel provides a reference for the average trend strength.
Visualization:
The indicator plots the ADX line in red to clearly display the trend strength.
The upper and lower Donchian Channels are plotted in blue, with a green middle line to represent the average.
The area between the upper and lower Donchian Channels is filled with a blue shade to visually emphasize the range of ADX values.
Default Settings for Scalping:
Donchian Channel Length: 10
Standard Deviation Multiplier: 1.58
ADX Length: 2
ADX Smoothing Length: 2
These default settings are optimized for scalping, offering a quick response to changes in trend strength and potential breakout signals. However, traders can adjust these settings to suit different trading styles and market conditions.
How to Use:
Trend Strength Identification: Use the ADX line to identify the strength of the current trend. Higher ADX values indicate stronger trends.
Breakout Signals: Monitor the ADX value in relation to the Donchian Channels. A breakout above the upper channel or below the lower channel can signal a potential trend continuation or reversal.
Range Identification: The filled area between the Donchian Channels provides a visual representation of the ADX range, helping traders identify when the market is ranging or trending.
This indicator is designed to enhance your trading strategy by combining trend strength measurement with breakout signals, making it a versatile tool for various market conditions.

Williams Fractals Ultimate (Donchian Adjusted)Williams Fractals Ultimate (Donchian Adjusted)
Understanding Williams Fractals
Williams Fractals are a simple yet powerful tool used to identify potential turning points in the market. They highlight local highs (up fractals) and local lows (down fractals) based on a set period.
An up fractal appears when a price peak is higher than the surrounding prices.
A down fractal appears when a price low is lower than the surrounding prices.
Fractals help traders spot support and resistance levels, potential trend reversals, and price breakout zones.
Why Adjust Fractals with the Donchian Channel?
The standard Williams Fractals method identifies local highs and lows without considering broader market context. This script enhances fractal accuracy by integrating the Donchian Channel, which tracks the highest highs and lowest lows over a set period.
- The Donchian Baseline is calculated as the average of the highest high and lowest low over a selected period.
- Fractals are filtered based on this baseline:
Up Fractals are only shown if they are above the Donchian baseline.
Down Fractals are only shown if they are below the Donchian baseline.
This filtering method removes weak signals and ensures that only relevant fractals aligned with market structure are displayed.
Key Features of the Script
Customizable Fractal & Donchian Periods – Allows traders to fine-tune fractal sensitivity.
Donchian-Based Filtering – Reduces noise and highlights meaningful fractals.
Fractal ZigZag Line (Optional) – Helps visualize price swings more clearly.
Why Is This So Effective?
Stronger trend signals – Filtering with the Donchian baseline eliminates unreliable fractals.
Clearer price action – The optional ZigZag line visually connects significant highs and lows.
Easy trend identification – Helps traders confirm breakout zones and key price levels.
This script is a technical analysis tool and does not guarantee profitable trades. Always combine it with other indicators and risk management strategies before making trading decisions.

OBV Apex: Donchian-Bollinger Dual Resonance (DBDR)以下是为您定制的 **OBV Apex: DBDR (Donchian-Bollinger Dual Resonance)** 指标双语简介。
---
## 指标简介 / Indicator Overview
**OBV Apex: Donchian-Bollinger Dual Resonance (DBDR)** 是一款专为捕捉高概率趋势反转和波动率爆发而设计的尖端量价指标。它打破了传统指标单一维度的局限,将基于绝对价格区间的**唐奇安通道逻辑**与基于统计学概率分布的**布林带动能逻辑**深度融合,旨在为交易者提供“跨维度共振”的决策依据。
**OBV Apex: Donchian-Bollinger Dual Resonance (DBDR)** is a cutting-edge volume-price indicator designed to capture high-probability trend reversals and volatility breakouts. It breaks the limitations of single-dimensional indicators by integrating **Donchian Channel logic** (based on absolute price ranges) with **Bollinger Band momentum logic** (based on statistical probability distribution), providing traders with a "cross-dimensional resonance" framework for decision-making.
---
## 核心功能与视觉识别 / Key Features & Visual Identification
### **1. 智能变色主线 / Intelligent Multi-Color Main Line**
指标 OBV 主线根据当前动能状态实时切换颜色。
* **白色 (极端区)**:当 OBV 触碰或刺破唐奇安通道轨道时变为白色,提示动能进入超买或超卖的极端区域。
* **绿色/红色 (趋势区)**:代表 OBV 突破了中轨缓冲区,确认了当前的上涨或下跌趋势。
* **黄色 (噪音区)**:OBV 处于缓冲区内部,提示市场处于震荡或无方向阶段。
The main OBV line switches colors in real-time based on momentum states.
* **White (Extreme)**: Turns white when OBV touches or pierces Donchian boundaries, signaling extreme overbought/oversold momentum.
* **Green/Red (Trend)**: Indicates OBV has broken out of the mid-rail buffer, confirming an uptrend or downtrend.
* **Yellow (Noise)**: OBV stays within the buffer zone, suggesting a sideways or directionless market.
### **2. 波动率挤压背景 / Volatility Squeeze Background**
当唐奇安通道大幅收窄,代表市场进入蓄力阶段。此时离散区域(Dispersion Area)会变为**深紫色**,这是即将发生大级别变盘的重要视觉信号。
When the Donchian Channel narrows significantly, it represents a market accumulation phase. The Dispersion Area turns **Deep Purple**, providing a crucial visual signal for an impending major volatility breakout.
---
## 详细用法说明 / Detailed Usage Instructions
### **1. 逻辑共振星号 (⭐) 的实战意义 / Strategic Meaning of the Resonance Star (⭐)**
这是本指标最具价值的核心信号。
* **基础信号 (R/H)**:当唐奇安系统检测到结构性背离时产生。
* **共振信号 (⭐)**:仅当后台隐藏的布林带算法也同时检测到逻辑背离时,信号后才会附带 ⭐。
* **用法**:普通 R 信号仅代表价格结构的衰竭,而 **R⭐** 则代表空间结构与波动率动能的**双重衰竭**。在实战中,带有星号的信号具有极高的反转成功率,是摸顶抄底的核心参考。
This is the most valuable core signal of the indicator.
* **Basic Signals (R/H)**: Generated when the Donchian system detects structural divergence.
* **Resonance Signal (⭐)**: A star is appended only when the hidden Bollinger Band algorithm also detects logical divergence simultaneously.
* **Usage**: A standard R signal represents structural exhaustion, while **R⭐** signifies **dual exhaustion** of both space structure and volatility momentum. In practice, signals with stars offer significantly higher reversal success rates.
### **2. 顶点爆发策略 (突破交易) / The Apex Explosion Strategy (Breakout)**
* **观察**:寻找背景出现持续**深紫色**填充的区域(挤压期)。
* **入场**:当 OBV 主线由黄转绿(多头突破)或由黄转红(空头突破)并脱离紫色区域时,是爆发性行情的起始点。
* **Observation**: Look for areas with continuous **Deep Purple** background filling (Squeeze phase).
* **Entry**: When the OBV line shifts from yellow to green (Bullish breakout) or red (Bearish breakout) and exits the purple zone, it marks the start of an explosive trend.
### **3. 双重共振反转策略 (反转交易) / Double Resonance Reversal Strategy**
* **确认条件**:OBV 主线变为**白色**进入极端区,随后出现带有 **⭐** 的背离标签。
* **辅助确认**:观察 KDJ 标签。如果共振星号出现后,KDJ 产生顺势的大写 **B (Buy)** 或 **S (Sell)** 标签,则反转的确定性进一步增强。
* **Confirmation**: The OBV line turns **White** (Extreme zone), followed by a divergence label with a **⭐**.
* **Secondary Confirmation**: Monitor KDJ labels. If an uppercase **B (Buy)** or **S (Sell)** appears after the resonance star, the certainty of the reversal is further enhanced.
---
## 下一步建议 / Next Step
您现在可以根据此简介进行实盘复盘。如果您需要我将**警报逻辑 (Alerts)** 进一步细化,例如针对“带星号的背离”设置专门的推送提醒,请随时告诉我。
You can now use this overview for backtesting. If you need me to further refine the **Alert logic**, such as setting specific push notifications for "Divergence with Star," please let me know.

Contrarian Donchian Channel Indicator with Alerts and VisualsTitle: Contrarian Donchian Channel Indicator with Alerts and Visuals
Description:
The Contrarian Donchian Channel Indicator is designed for traders who seek to implement a contrarian approach using the time-tested Donchian Channel method. This indicator not only signals potential entry points but also enhances trading visualization by marking hypothetical stop loss and take profit levels.
Key Features:
Donchian Channel Signals: Utilizes the Donchian Channel to identify potential reversal points in the market. The indicator generates buy signals when the price touches or breaches the lower band, suggesting a potential upward reversal. Conversely, sell signals are generated when the price touches or exceeds the upper band, indicating a possible downward reversal.
Pause After Stop Loss: Incorporates a unique feature that pauses signal generation for a user-defined number of candles after a stop loss is hit. This helps in avoiding immediate re-entries in volatile market conditions.
Stop Loss and Take Profit Visualization: For each signal, the indicator draws dashed lines on the chart to represent the hypothetical stop loss (red) and take profit (green) levels. These levels are calculated based on user-input percentages for stop loss and the risk-reward ratio.
Alerts for Entry Signals: Traders can set up alerts for buy and sell signals, allowing them to stay informed of potential trading opportunities.
How to Use:
Entry Signal: A triangle symbol (green for buy, red for sell) accompanied by an alert (if set) indicates a potential entry point.
Stop Loss and Take Profit Lines: Use the drawn lines as a guide for setting stop loss and take profit levels if the signal aligns with your trading strategy.
Pause Feature: After a stop loss is triggered, observe the pause period before considering new signals to avoid overtrading in choppy markets.
Suitable For:
Traders who prefer a contrarian approach.
Those who use Donchian Channels as part of their trading strategy.
Traders who appreciate visual aids for better decision-making.
Customization Options:
Length of the Donchian Channel.
Risk/Reward Ratio.
Stop Loss Percentage.
Pause duration after a stop loss is hit.
DISCLAIMER:
This indicator is intended for educational and informational purposes only and should not be construed as financial advice. Trade responsibly and always consider your risk tolerance and investment objectives.

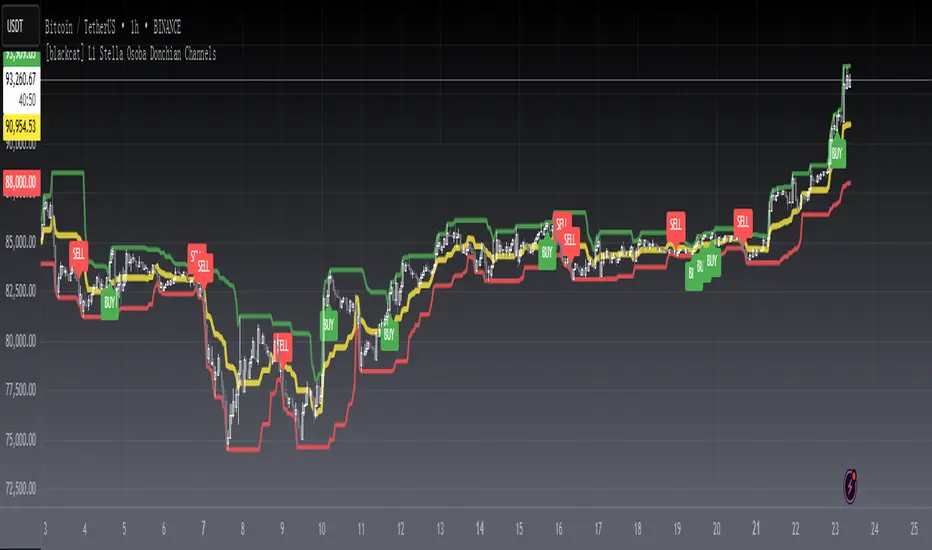
[blackcat] L1 Stella Osoba Donchian ChannelsLevel 1
Background
On Jul, 2023, Stella Osoba proposed a price channel idea in the article of “Using Price Channels”.
Function
In Stella Osoba's article "Using Price Channels" in the 2023 bonus issue, author Stella Osoba describes why many analysis techniques are based on the concept of price channels. In her explanation of the Donchian channels, she explains that they are used to identify the trend and that the prices for the last period are not included in the calculations. I rewrote this idea in the PINE version presented here, allowing the user to optionally include the most recent period. To not include the most recent period, set the IncludeRecentPeriod input to false.
Richard Donchian, a futures trader, created the Donchian Channel as a trend indicator. He was later dubbed the "father of trend following." Several trading methods based on Donchian channels have been established, but day traders can create their own as the indicator is versatile and can be interpreted in different ways. The renowned Turtle Traders also used a variation of the Donchian technique.
The Donchian Channel draws a line between the high and low price of an asset over a period of time, generally using candlesticks as a clock. Candlesticks are chart areas on charts that show the open, high, low, and close price and time frame of a particular stock. They owe their name to their shape. When the indicator is applied to a chart, the lines form a channel around the current price.
When day trading, Donchian channels are useful for highlighting trends and range periods. A third line can be added between the top and bottom lines if required. The upper and lower channel lines are averaged to form this center band. The indicator can be used on all timeframes, including one-minute and five-minute charts (where a bar forms every one or five minutes), and it can be used for forex, stock, futures, and options trading .
Remarks
Feedbacks are appreciated.
Double Donchian Channel + T3 MA (Dynamic Color)This indicator combines a **Double Donchian Channel** with a **dynamic T3 Moving Average** to provide a clear view of market structure, volatility, and trend direction on a single chart. The **fast Donchian channel** tracks short-term price extremes, making it useful for identifying breakouts, pullbacks, and momentum shifts. The **slow Donchian channel** represents higher-timeframe structure and acts as a dynamic support and resistance zone, helping traders understand the broader trend context and avoid trading against dominant market pressure.
At the center of the system is the **T3 Moving Average**, a highly smoothed moving average designed to reduce noise while remaining responsive to trend changes. The T3 line **changes colour automatically based on its slope**: it turns **green when rising**, signaling bullish momentum, and **red when falling**, signaling bearish momentum. This colour change allows traders to visually identify trend direction and transitions without relying on lagging crossover signals.
When price trades above a rising (green) T3 and remains within or above the slow Donchian channel, market conditions favor continuation trades and long-side bias. Conversely, when price is below a falling (red) T3 and breaking or respecting the lower Donchian boundaries, bearish continuation setups are favored. Overall, this indicator is best suited for **trending and volatility-expanding markets**, and it works especially well when combined with volume-based tools or regime filters to avoid ranging conditions.
