ALI-2-OptionsEntry strategy and indicator on the contracts chart only, 5-minute frame, by crossing the green line + the average
"entry"に関するスクリプトを検索

Entry ChecklistThis Pine Script creates a checklist table displayed in the bottom-right corner of the chart. It shows:
1. Whether the next earnings date is within the next 2 weeks
2. Whether the current month is a traditionally weak month (May, August, or September)
Each row includes:
• A check title
• The current value (e.g., date or month)
• A ❌ red cross if the condition is met (warning signal)
Useful for quickly assessing seasonal and earnings-related risks.

ENTRY CONFIRMATION V2An indicator from candle man. Helps determine whether supply and demand zone are truly supply or demand.

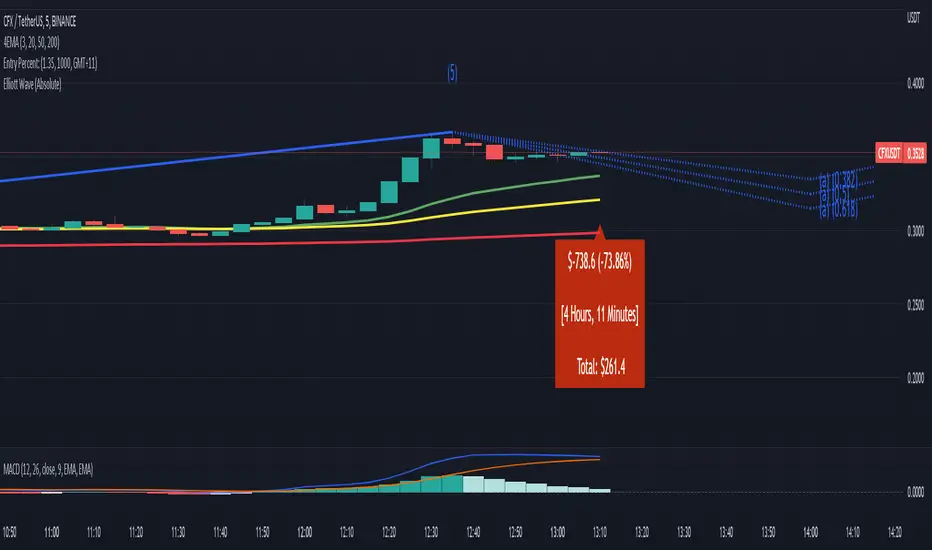
Entry Percent: EssamThis Pine Script code is designed to perform the task of computing and showcasing the profit percentage, profit value, and the duration for which a specific asset is held, all in real-time. The script effectively leverages the built-in resources to provide a seamless and robust experience, as it presents the calculated figures in an easily readable format on the chart, without causing any lag or disruptions to the chart.
Positional Swings by Batman TradesEntry and Exit Signals for higher timeframes based on Ema & Sma with RSI overbought/oversold plots for possible reversal indication.
It can be used for booking profit in the existing trade and take fresh position once the new candle breaks the high/low of alert candle depending upon the side.
Best work with high timeframes. (>1 Hour)
Best recommended for stocks

Entry Size 1barCalculates how many lots (100) you should buy/sell for any given bar with a fixed risk in USD and shows if Long (L), Short (S) or wait (w) with a label.
Requires max loss per week, trading days per day and lossing trading per day.

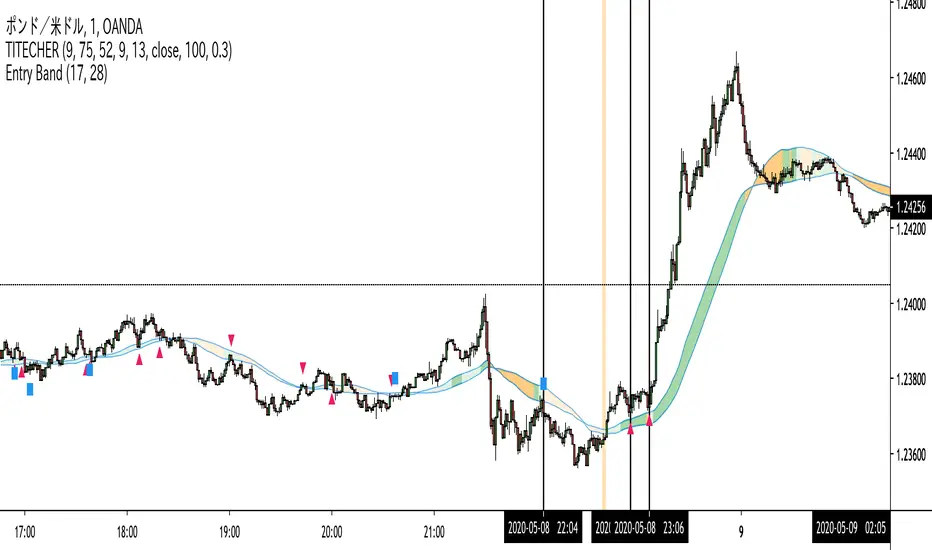
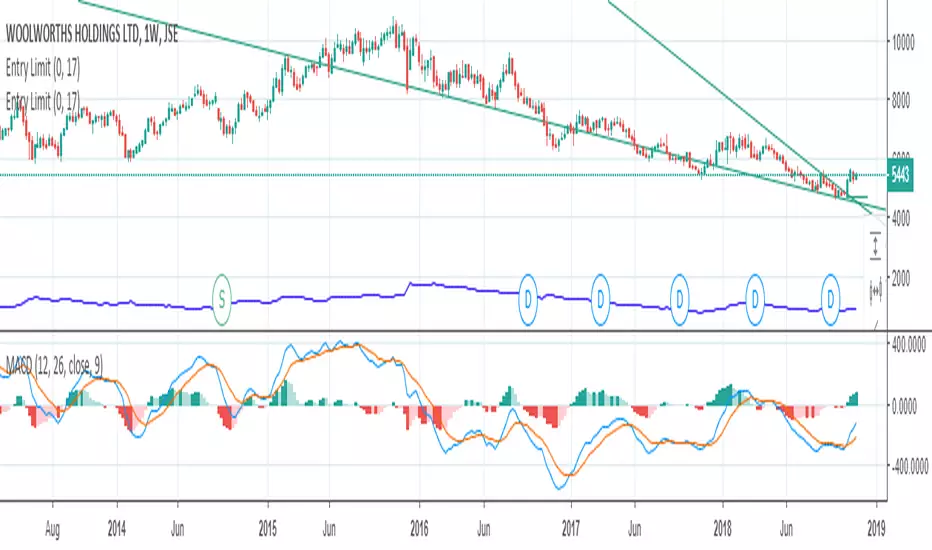
Entry Band(trial)This indicator is trial version. You can use for a month for free.
The indicator includes moving average and exponential moving average .
you can set the parameters you want.
you can see the trend.
green : up trend
orange : down trend
if you want to use this indicator, Please join the URL:

Entry BandThe indicator includes moving average and exponential moving average.
you can set the parameters you want.
you can see the trend.
green : up trend
orange : down trend
if you want to use this indicator, Please join the URL:
Entry FactorFind the most relevant price direction changes with ease, with this geometry-based indicator.
Stop wasting your time with moves that don't offer a satisfactory range for good profits.

Entry Bars -This algorithm takes in consideration Media averages, Volatility Movements and other Mathematical Properties.
-After adding this signal on TradingView, you will get notified every of potential long and short points triggered by the indicator.
-This signal alerts you anytime bars form a bullish or bearish pattern and price start to move in the suggested direction.
-It works in any time frame or market like Forex, Crypto, Commodities even Stocks.
-Recommended for bots or manual trading.
Do you need an Script or an expert adviser for Forex, contact our coding service
Get this indicator today! contact us

RocketScalperEntry follows the first normal candle after the highlights - use in conjunction with basic patterns, SFPs, and the until1mil indicators (SSO/MACD/MI/BZ)


[MV] %B with SMA + Volume Based Colored Bars
Entry Signal when %B Crosses with SMA and this is more meaningful if it supports colored bars.
Black Bar when prices go down and volume is bigger than 150% of its average, that indicates us price action is supported by a strong bearish volume
Blue Bar when prices go up and volume bigger than 150% of its average, that indicates us price action is supported by a strong bullish volume
VBC author @KIVANCfr3762

FX Sniper: T3-CCI Strategy - With 100 IndicatorsEntry signal when moving above -100, sell signal when going below 100


Amazing Crossover SystemEntry Rules
BUY when the 5 EMA crosses above the 10 EMA from underneath and the RSI crosses above the 50.0 mark from the bottom.
SELL when the 5 EMA crosses below the 10 EMA from the top and the RSI crosses below the 50.0 mark from the top.
Make sure that the RSI did cross 50.0 from the top or bottom and not just ranging tightly around the level.
How to setup Alert:
1) Add the Amazing Crossover System to your chart via Indicators
2) Find your currency pair
3) Set the timeframe on the chart to 1 hour
4) Press 'Alt + A' (create alert shortcut)
5) Set the following criteria for the alert:
Condition = 'Amazing Crossover System', Plot, ' BUY Signal'
The rest of the alert can be customized to your preferences
5) Repeat steps 1 - 4, but set the Condition = 'Amazing Crossover System', Plot, ' SELL Signal'

Abyss Protocol OneAbyss Protocol One — Momentum Exhaustion Trading System
Overview
Abyss Protocol One is a momentum exhaustion indicator designed to identify high-probability reversal points by detecting when price momentum has reached extreme levels. It combines Chande Momentum Oscillator (CMO) threshold signals with dynamic volatility-adjusted bands and multiple protective filters to generate buy and sell signals.
Core Concept
The indicator operates on the principle that extreme momentum readings (CMO reaching ±80) often precede mean reversion. Rather than chasing trends, Abyss Protocol waits for momentum exhaustion before signaling entries and exits.
Key Components
1. Dynamic Bands (Money Line ± ATR)
Center line uses linear regression (Money Line) for smooth trend representation
Bands expand and contract based on Bollinger Band Width Percentile (BBWP)
Low volatility (BBWP < 30): Tighter bands using lower multiplier
High volatility (BBWP > 70): Wider bands using higher multiplier
Bands visually adapt to current market conditions
2. CMO Exhaustion Signals
BUY Signal: CMO drops below -80 (oversold/momentum exhaustion to downside)
SELL Signal: CMO rises above +80 (overbought/momentum exhaustion to upside)
Thresholds are configurable for different assets and timeframes
3. ADX Filter
Signals only fire when ADX exceeds minimum threshold (default: 22)
Ensures there's enough directional movement to trade
Prevents signals during choppy, directionless markets
4. Band Contraction Filter
Calculates band width percentile rank over configurable lookback
When bands are contracted (below 18th percentile), ALL signals are blocked
Prevents trading during low-volatility squeeze periods where breakout direction is uncertain
5. Consecutive Buy Limit
Maximum of 3 consecutive buys allowed before a sell is required
Prevents overexposure during extended downtrends
Counter resets when a sell signal fires
6. Underwater Protection
Tracks rolling average of recent entry prices (last 10 entries within 7 days)
Blocks sell signals if current price is below average entry price
Prevents locking in losses during drawdowns
7. Signal Cooldown
Minimum 5-bar cooldown between signals
Prevents rapid-fire signals during volatile swings
8. Extreme Move Detection
Detects when price penetrates beyond bands by more than 0.6 × ATR
Extreme signals can bypass normal cooldown period
Fire intra-bar for faster response to capitulation/blow-off moves
Still respects max consecutive buys and underwater protection
Visual Features
Trend State Detection
The indicator classifies market conditions into six states based on EMA stack, price position, and directional indicators:
STRONG UP: Full bullish alignment (EMA stack + price above trend + bullish DI + ADX > threshold)
UP: Moderate bullish conditions
NEUTRAL: No clear directional bias
DOWN: Moderate bearish conditions
STRONG DOWN: Full bearish alignment
CONTRACTED: Bands squeezed, volatility low
ADX Trend Bar
Colored dots at chart bottom provide instant trend state visibility:
Lime = Strong Uptrend
Blue = Uptrend
Orange = Neutral
Red = Downtrend
Maroon = Strong Downtrend
White = Contracted
Volume Spike Highlighting
Purple background highlights candles where volume exceeds 2x the 20-bar average, helping identify institutional activity or significant market events.
Signal Labels
Buy labels show consecutive buy count (e.g., "BUY 2/3"), price, and CMO value
Sell labels show consecutive sell count, price, and CMO value
Extreme signals display in distinct colors (cyan for buys, fuchsia for sells)
Signal candles turn bright blue for easy identification
Info Panel
Real-time dashboard displaying:
Current trend state
CMO value with threshold status
CMO thresholds (buy/sell levels)
ADX with directional indicator (▲/▼) and signal eligibility
BBWP percentage
Buy/Sell counters
Average entry price (with underwater shield indicator 🛡 when protected)
Price position relative to Money Line
Band width percentile rank
Extreme move status
Signals status (OPEN/BLOCKED)
Recommended Use
Timeframe: 5-15 minute charts (parameters tuned for this range)
Best suited for: Assets with regular oscillations between overbought/oversold extremes
Trading style: Mean reversion, momentum exhaustion, scaled entries
Parameters Summary
Money Line Length: 12 — Smoothing for center line
ATR Length: 10 — Volatility measurement
Band Multiplier (Low/High Vol): 1.5 / 2.5 — Dynamic band width
CMO Length: 9 — Momentum calculation period
CMO Buy/Sell Threshold: -80 / +80 — Signal trigger levels
ADX Min for Signals: 22 — Minimum trend strength
Signal Cooldown: 5 bars — Minimum bars between signals
Max Consecutive Buys: 3 — Position scaling limit
Band Contraction Threshold: 18th %ile — Low volatility filter
Band Contraction Lookback: 188 bars — Percentile calculation period
Extreme Penetration: 0.6 × ATR — Threshold for extreme signals

TP Sniper Pro**TP Sniper Pro - Dynamic Take Profit Level Indicator**
Instantly visualize your take profit targets on any chart with clean, adjustable horizontal lines.
**Features:**
• Switch between Futures (250/500/1000), Forex (25/50/100), and Commodities (25/50/100) TP levels
• Toggle between Long and Short positions
• Set custom entry price or use current price automatically
• Clean horizontal lines that don't clutter your chart
• Adjustable line length (5-100 bars)
• Clear labels showing each TP level
• Works on any timeframe and any pair
**Perfect for:**
Traders who want quick visual reference for their take profit levels without manually drawing lines on every trade.
