"fib"に関するスクリプトを検索


Fib Convection Zone88Labeled Auto Fibonacci Retracament Levels. The color of fibo levels is green when the trend is upward and the color of fibo levels is red when the trend is downward. Also, you can see the highest and lowest values related with your period.
Added the Convection Zone 886 the banks sweet spot.
Source @borserman
Mod @LaMonicaRobinson
Fib Cross Moving AveragesThe white line is the main 200-candle MA. The fibonacci ratio MAs are relative to that 200-day MA. Some lines change color based on the trend shown by this indicator.
So 61.8% for example, the orange/red line golden ratio MA is a 124 candle MA (~68% of 200). There is also a weighted 124 candle MA that works along-side the 100 candle MA.

FIB Extensions and RetracmentsA second version of an already published indicator by me.
This Indicator will help you find price levels for the short term instead of long term.
The indicator analyzes short term closing prices( Two days data) . It calculates extensions and retracement.
If you are a Forex trader, add zero to the variable in the input section.
The indicator does not specify tops or bottoms.
When you apply it to your chart, uncheck all the boxes(levels and mids) and keep the plots. this will make it zoomed in without compressing the whole chart.
If you are interested, please send me private message.

FIB Extensions and RetracmentsThis Indicator will help you find price levels.
The indicator analyzes yearly closing prices . It calculates extensions and retracement.
If you are a Forex trader, add zero to the variable in the input section.
The indicator does not specify tops or bottoms.
When you apply it to your chart, uncheck all the boxes(levels and mids) and keep the plots. this will make it zoomed in without compressing the whole chart.
If you are interested, please send me private message.

Fibs, Pivots & SupportA 3-in-1 indicator for displaying Fibonacci retracement and pivot levels over custom periods along with areas of previous major support. Each of the three tools can be toggled on/off.
Used properly, these should give you a better idea of where to place orders and take profit.
Alerts are built in but had to remain somewhat generic due to data point limitations. There are alerts for crossing and crossing up/down over each category of line.

Perfect Fibonacci CastFib Sequence = 34,55,89,144,233,377,610...
144/610 =0.236
144/377 =0.382
144/233 =0.618
144/89 =1.618
144/55 =2.618
144/34 =4.236
144 is a factor of 1440
24hr*60 min = 1440 min
1440/144 = 10hr
144*5 =720 min = 12hr etc.etc.
144 is magical, you may change the input value to higher sequence or higher TF if you are looking for long cast. For trading concept DM


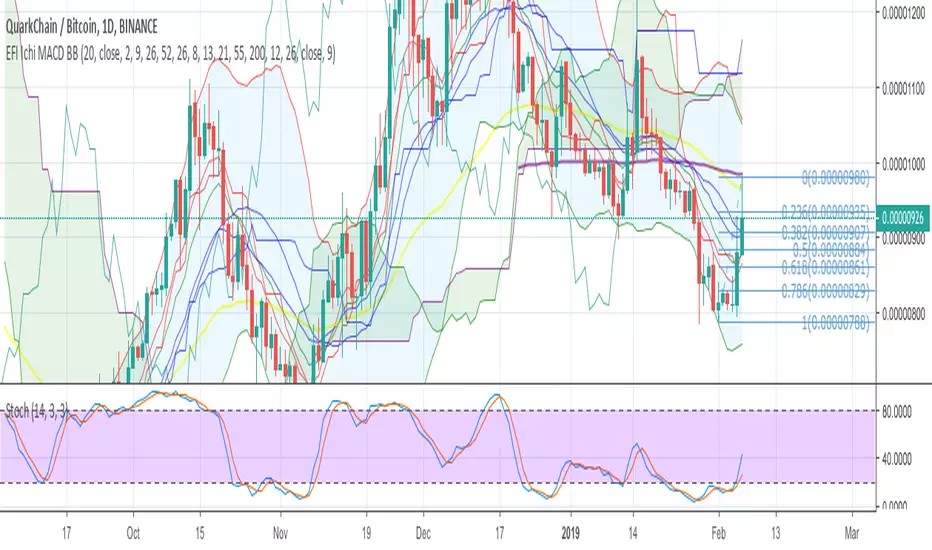
Fib EMA Ichi MACD BollingerAll in one necessary indicators for those, who limited to three of them.
Fibonacci EMA + EMA 200 (all can be modified for your custom periods)
MACD Graph overlay
Ichimoku cloud
Bollinger Bands
All is open, made from different basic indicators and tested to show correct data.
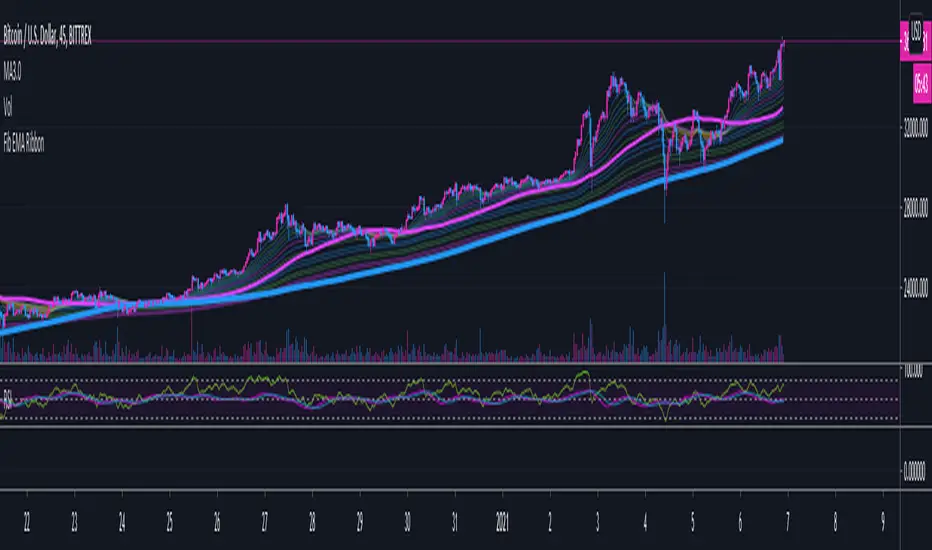
Fib EMA RibbonPretty weird and experimental fibonacci ribbon overlay, for visual use and fun only at the moment. Will update the script if i think of any other ways to use it, ideas welcome.
Meant for use with Heikin Ashi candles.
Biffy
Fib's GhostThis indicator uses Fibonacci Support/Resistance Channels, weighted with Market Volatility(ATR) to determine Trend Momentum and Strength. It has two components: the Histograms and the strength line:
- The histogram gives information about the momentum behind moves and current trend. If Histogram is positive the market is currently in an UpTrend, the height of the Histograms indicates the amount of
buying/selling pressure of the market, in a strong uptrend the histograms grow with each new candle, and never fall under 0. If the histograms cross 0 a trend reversal is signaled.
- The strength line gives information about the Strength of the current Trend, After the color switch the line should move towards the 0-line, the closest point to the 0 line signals a local Top/Bottom.
- The strength line should be used to find hidden-divergences between price and Strength, the Further away the line is from the center the higher the chances of a reversal, but no trend change is signaled until
histograms cross.
The indicator code can be granted for free upon request

Fib Moving AverageThis is a Moving Average cluster in one overlay indicator. You can choose to use SMA or EMA or Mixed Moving Average. The mixed mode is only taking affect if you select 'Use EMA', which uses SMA when length of MA is above 100.

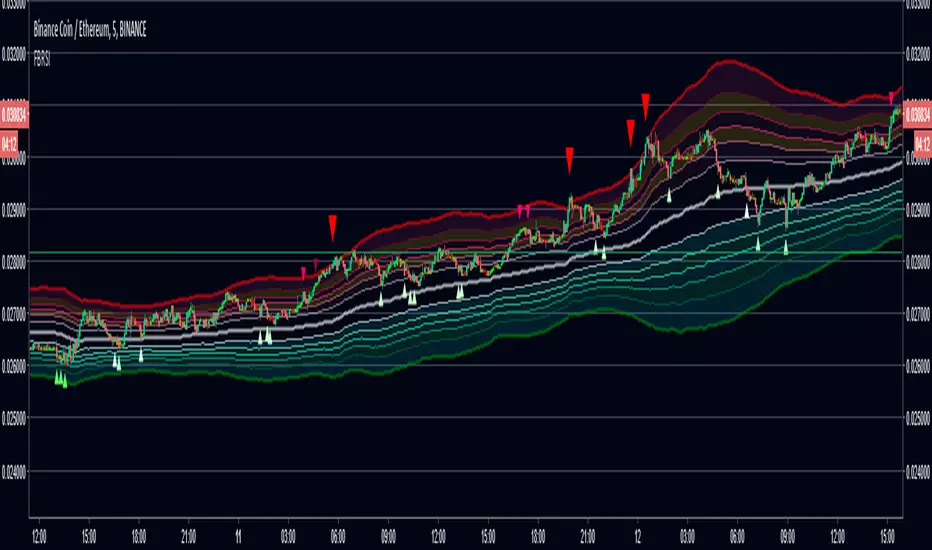
FIB Band Signals with RSI FilterOriginal Author: Rashad
Added by Rashad 6-26-16
These Bollinger bands feature Fibonacci retracements to very clearly show areas of support and resistance . The basis is calculate off of the Volume Weighted Moving Average . The Bands are 3 standard deviations away from the mean. 99.73% of observations should be in this range.
Updated by Dysrupt 7-12-18
-Buy signals added on lower bands, mean and upper 3 bands
-Sell signals added to upper 3 bands
-RSI filter applied to signals
-Alerts not yet added
-Long Biased
NOTE: This is NOT a set and forget signal indicator. It is extremely versatile for all environments by adjusting the RSI filter and checking the band signals needed for the current trend and trading style.
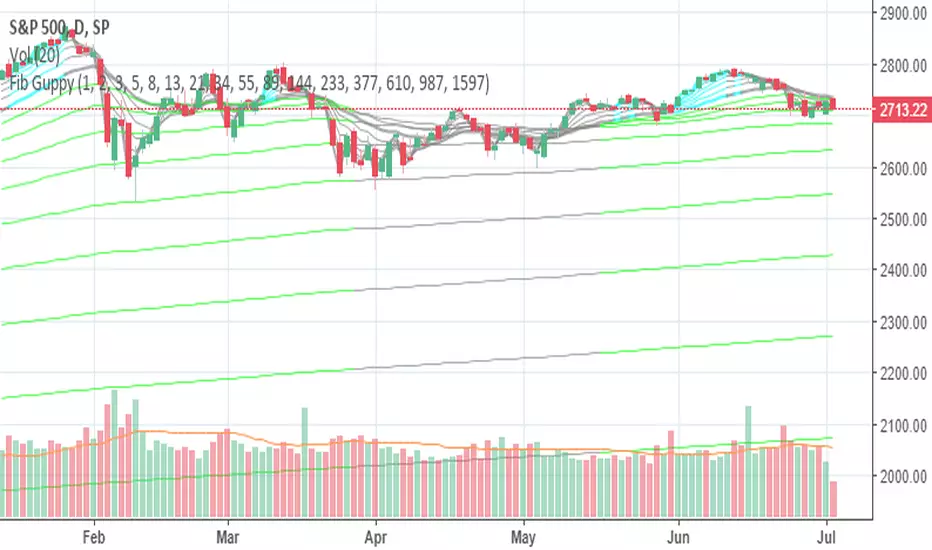
Fib Guppy for volatility predictionsThis is a guppy made from FIbbonacci numbers (from 1 to 1597).
Here is how to trade with this guppy.
when 6-8 lines tighten together, it means there will be high volatility coming very soon. Trade according to where the next candle opens (for scalping etc). For example: if the 8 lines of guppy tighten and candle closes above guppy with momentum and trend in the same direction(up), then there could be expected a big move in that direction. Vice versa if a candle closes below the tightened guppy with momentum and trend at the same direction, then the volatility will push price lower exponentially.
Easy. peace of cake. go make yourself a millionaire.

FibMA by WSM.TFib MA, allows you to identify major and minor trend analysis. Position of FibMA allow one to see those position in past and act accordingly in present..
It can be useful with combining bands.. Will be publishing them soon.

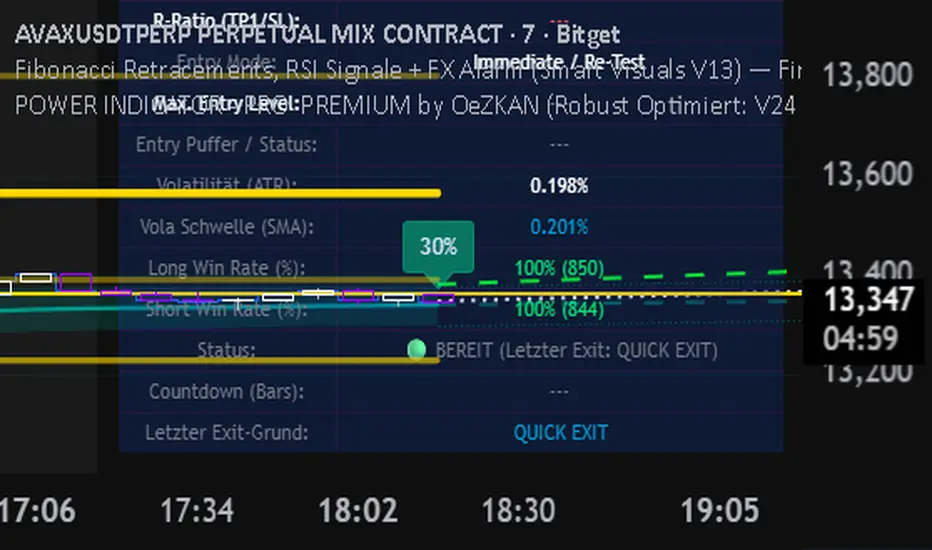
Indicator for the best FINDING GOLDEN ZONES by OeZKAN 🌟 FIBONACCI FX ALARM PRO (V13): Precision Pullback & Reversal SystemThe FIBONACCI FX ALARM PRO (V13) is a sophisticated, single-overlay indicator designed for the tactical trader who masters high-probability pullback and reversal entries. By fusing key Multi-Timeframe (MTF) structural analysis with validated Fibonacci levels and momentum confirmation, this system provides crystal-clear Entry, Take Profit (TP), and Stop Loss (SL) targets.This is your ultimate tool for trading Mean Reversion and Retracement strategies, providing the exact levels needed for disciplined execution.
🔥 Key System Features & Core Logic1.
⚙️ Multi-Timeframe Structural MappingThe system maps the dominant structural context from a higher timeframe onto your current chart, ensuring your trades align with the institutional flow:Dynamic Supply & Demand Zones: Automatic calculation and visualization of the highest high (Supply) and lowest low (Demand) over the last 100 bars on a user-defined MTF (e.g., 60m, 240m). These zones act as highly reliable reversal and breakout levels.Structural Breakouts: Clear alerts and labels notify you the moment the price decisively breaches the main Supply or Demand boundaries, signaling potential trend continuation.2.
🎯 Fibonacci Precision (The Golden Trade Zone)At the core of the strategy is the intelligent use of Fibonacci Retracements, automatically anchored to the MTF High/Low:The Golden Ratio (61.8%): This is the Primary Entry Trigger. The system is optimized to generate a Buy or Sell signal when the price crosses the $61.8\%$ level, confirming a deep, high-value retracement.TP1 / TP2 Targets: Built-in profit targets are automatically set at the $50.0\%$ (TP1 Long) and $38.2\%$ (TP2 Long) levels for Long trades, and the $70.5\%$ (TP1 Short) and $78.6\%$ (TP2 Short) levels for Short trades, ensuring disciplined profit-taking.SL Placement: The initial Stop Loss is strategically placed at the deep $78.6\%$ (Long) or $38.2\%$ (Short) level, providing wide protection against volatility before the target is hit.3.
🚦 RSI Momentum ConfirmationMomentum is crucial for timing successful reversals. The indicator integrates the Relative Strength Index (RSI) for powerful confirmation:Oversold/Overbought Signals: Clear labels (OVERBOUGHT (SELL) / OVERSOLD (BUY)) are generated directly on the price chart when the RSI crosses the critical $70$ and $30$ levels, respectively.Dual Visibility: You get both a visual arrow/text on the main chart (governed by the show_rsi_indicator toggle) and independent alarms to confirm the momentum shift coinciding with a structural level.
🔔 FX ALARM System: Never Miss an OpportunityThe robust alert system ensures you are instantly notified of high-probability events, even when away from your screen:GOLDEN ENTRY ALARM: Triggers when price crosses the crucial $61.8\%$ Golden Ratio, signaling a potential trade setup.STRUCTURAL BREAKOUT ALARMS: Instant notification when Supply (Highest High) or Demand (Lowest Low) zones are breached.TP HIT ALARMS: Alerts for Long TP1 (50.0%) and Short TP1 (70.5%) hits, vital for managing partial exits and moving your stop loss to breakeven.
🔑 How to Use This Indicator for Disciplined TradingSet Your Context: Select a higher Timeframe for Zones & Fib (e.g., "D" or "240") than your execution timeframe (e.g., 5m or 15m).Wait for the Setup: Wait for the price to retrace and approach the $61.8\%$ Golden Ratio.Confirm & Execute: Confirm the setup with a concurrent RSI Oversold/Overbought signal. If the price crosses $61.8\%$, the system instantly plots the E (Entry), TP1/TP2, and SL levels for a disciplined trade.Elevate your strategy with the FIBONACCI FX ALARM PRO (V13). Precision, structure, and momentum—all in one powerful tool.
👉 Add it to your favorites now and start executing high-confidence trades!
Dix$ons Tackle BoxDixsons Tackle Box — Multi-Tool Trend & Levels Suite (MA/EMA + VWAP + BB + Adaptive Trend Channels + Auto Fibs)
---
**Dixsons Tackle Box** is an all-in-one overlay for traders who want a clean chart with *stacked edge* instead of stacked indicators.
It combines:
* A **5-slot MA/EMA pack** with live slope % labels and MTF smoothing
* A **full VWAP engine** with event-based anchors, trend angle coloring, and VWAP bands
* **Bollinger Bands** with volatility-aware coloring and optional gradient background
* A **Short-Term & Long-Term Adaptive Trend Channel (ATC)** with automatic period detection, log-regression channels, and performance tables
* A **Dixson Auto Fibonacci suite**: ATR-based “rail” Fibs + Lookback Fibs off HH/LL, both driving a shared, fully customizable Fib bank
Everything is controlled logically by feature groups under the **“Tackle Box”** section, so you can quickly turn modules on/off and tune the tool to your style (scalp, intraday, swing, or position).
> **Important:** This is an analysis/visualization tool only. Nothing here is financial advice or an automatic trading system. Always test and manage risk yourself.
---
## 1. MA/EMA Pack — 5 Smart Averages with Slope %
**Group:** `Tackle Box` + per-slot groups `MA/EMA 1` … `MA/EMA 5`
**Main toggle:** `Enable MA's`
**Per-slot master row:** `_maRow1` … `_maRow5`
### What it does
This module gives you **five independent MA/EMA slots**, each with:
* Its own **type** (MA or EMA)
* **Length**, **color**, **line width**, and **plot style** (`Solid`, `Step`, or `Circles`)
* **Timeframe per slot** (MTF)
* Rich **label controls** (slope %, length/type text, timeframe text, etc.)
* **Label size** per slot (`tiny → huge`)
On top of that, each average has a **live slope % readout**, normalized by instrument tick size, so you can compare trend steepness across assets.
### Key features
* **Master slot row (1–5):**
In the `Tackle Box` group you have `_maRow1`–`_maRow5` toggles. These gate each slot globally, so you can quickly show/hide specific MAs without digging into each slot.
* **MTF Smoothed Mode:**
* `MTF Smoothed Mode` (on by default) makes higher-timeframe MAs **update only when the HTF bar closes (and on the last bar)**.
* That reduces the stair-stepping noise you often get when pulling HTF data onto an LTF chart, while still giving you accurate levels and a smooth, tradeable line.
* **Per-slot label text controls:**
Each MA group has toggles to control exactly what the label shows:
* `Show Label` – show/hide label entirely
* `Slope` – append slope % to the label
* `Len+Type` – show e.g. `50EMA` or `200MA`
* `TF` – show HTF name if the slot is on an MTF
* `'slope' text` – optionally include the word `slope` in the label
* **Slope % (angle) logic:**
Slope for each MA uses a normalized **“angle %” in **, based on the 1-bar change vs `syminfo.mintick`.
* Big positive values = strong uptrend
* Big negative values = strong downtrend
* Near zero = flat/neutral
This makes it easy to build rules like:
* “Only trade long if the **50EMA slope** is above +20% and price is above VWAP”
* “Take profit if slope on my faster MA collapses back toward 0.”
### Typical use
* Slot 1–2: **fast intraday EMAs** (e.g., 9 / 20 EMA)
* Slot 3–4: **structural EMAs/MAs** (e.g., 50 / 200)
* Slot 5: a **dedicated MTF trend filter** (e.g., 5-minute or 1-hour EMA on a 1-minute chart)
---
## 2. VWAP Engine + Bands — Anchor-Aware, Angle-Aware VWAP
**Group:** `Enable VWAP` + `------ VWAP Settings ------`, `Bands Settings`, `Color Settings`
### Core VWAP
* **Anchors:**
`Anchor Period` lets you choose where each VWAP reset starts:
* `Session` (day session VWAP, perfect for intraday)
* `Week`, `Month`, `Quarter`, `Year`, `Decade`, `Century`
* Corporate events: `Earnings`, `Dividends`, `Splits`
This lets you build VWAP logic around:
* **Intraday mean reversion** (Session VWAP + bands)
* **Swing anchor VWAPs** (Weekly/Monthly)
* **Event-based anchors** (earnings/dividend/split reaction)
* **Hide on DWM:**
`Hide VWAP on 1D or Above` lets you keep intraday VWAP from cluttering higher-TF charts.
* **Angle/Trend Detection:**
The VWAP engine computes a **regression slope** over each anchor segment and converts it to an **angle %**:
* `Angle Lookback (bars)` controls how many bars are used
* `Angle Trend Threshold (%)` sets the threshold where a slope is considered “trending”
With `Color VWAP by Trend` enabled:
* Uptrend > threshold → VWAP turns **trend up color** (e.g., lime)
* Downtrend < −threshold → VWAP turns **trend down color** (e.g., red)
* Inside threshold → VWAP uses a neutral color
You can also set separate **line widths** for neutral vs trend state and transparency to give a “Hull-style” visual feel.
* **VWAP Labels:**
You get a single, de-duplicated VWAP label on the last bar with:
* Optional **name** (`VWAP`)
* Optional **price** (`$xxx.xx`)
* Optional **angle %** and optional `"slope"` word
* Global **label size** for VWAP + bands
### VWAP Bands
* **Calc modes:**
`Bands Calculation Mode`:
* `Standard Deviation` – classic VWAP ± n * σ
* `Percentage` – bands as a fixed % of VWAP
* **Bands 1-3:**
Each band has:
* Visibility toggle, independent multiplier (`×`)
* Separate **upper/lower colors** per band
* Optional **fill** between upper/lower for each band
* Label toggles:
* `Show All Labels`
* `Show Band #X Label`
* `Band Labels: Show Names` (VWAP+1, VWAP-1, etc.)
* `Band Labels: Show Prices`
This lets you configure anything from a minimalist “just VWAP + 1 band” view to a full 3-band ladder.
### VWAP Highlight Fill
* **Premium/discount shading**:
Optional fill that shades:
* Region **above VWAP** when price is above (e.g., greenish)
* Region **below VWAP** when price is below (e.g., reddish)
This makes it extremely easy to see when price is trading at **premium vs discount** relative to the current anchor VWAP.
### Typical use
* Intraday scalpers: Session VWAP + 1–2 bands + highlight fill
* Swing traders: Weekly/Monthly VWAP + only the main line and label
* Event traders: Earnings-anchored VWAP, tracking post-earnings drift
---
## 3. Bollinger Bands — Volatility-Aware BB with Gradient Fill
**Group:** `Enable Bollinger Bands` + `------ Bollinger Band settings ------`
### What it adds
A clean Bollinger Band overlay designed to play nicely with the VWAP/MA stack:
* `Bollinger Bands Length` (default 20)
* `Bollinger Bands Multiplier` (default 2.0)
* `BB Basis Color` & **line width**
* Upper/lower bands colored based on **width change**:
* Expanding volatility → `BB Expanding Color`
* Contracting volatility → `BB Contracting Color`
You can also toggle:
* `Show Center Line MA Label` – prints something like `20ma` on the last bar.
* `Enable Gradient Background Fill` – draws a gradient between price and the bands:
* `Gradient Fill Up Color` for below-price fill
* `Gradient Fill Down Color` for above-price fill
### Why it’s unique here
Instead of just static bands, this implementation **flags volatility regimes** (expansion vs contraction) via color and optional gradient. That pairs nicely with ATR Fibs and VWAP:
* Use **BB contraction (squeeze)** + flat VWAP angle to anticipate breakouts.
* Use BB + VWAP bands to filter which “touches” are genuinely overextended.
---
## 4. Dixson Adaptive Trend Channel (ATC) — Short-Term & Long-Term Log Channels
**Master toggle:** `Enable Adaptive Trend Channel`
**Groups:** `------ Dixson ATC Settings ------`, `Short-Term Channel Settings`, `Long-Term Channel Settings`, `Short-Term Midline Settings`, `Long-Term Midline Settings`, `Channel Trend Background Fill Settings`, `Short-Term Table Settings`, `Long-Term Table Settings`
### Under the hood
ATC is a **log-scale regression channel engine** that automatically:
1. Scans a set of candidate periods.
* **Short-term:** 20 → 200 bars
* **Long-term:** 300 → 1200 bars
2. For each period, it computes:
* Log-price regression slope & intercept
* Standard deviation of residuals
* A Pearson-style R value (trend “strength”)
3. Picks the period with the **highest correlation (|R|)** and uses that as the **detected trend length**.
This yields a **data-driven channel** that adapts to whatever trend the market is actually respecting.
> For long-term stats, annualized return only makes sense on **daily/weekly** charts. On intraday charts, treat the “Annual Return” purely as informational.
### Short-Term Channel
Controls in `Short-Term Channel Settings` + `Short-Term Midline Settings`:
* `Show Short-Term Channel` – on/off
* `Deviation Multiplier (Short-Term)` – how wide the channel is (in standard deviations)
* **Upper/Lower colors**, line width, style (Solid/Dotted/Dashed), transparency
* `Line Extension Style` – Extend Right / Extend Both / Extend None / Extend Left
Optional **Short-Term Midline**:
* Toggle + color, style, width, transparency
* Tracks the regression line itself (center of the channel)
Background fill:
* `Enable ST Background Fill` with separate **ST Uptrend** / **ST Downtrend** colors
* Trend direction is inferred from regression slope sign
### Long-Term Channel
Mirrors the ST controls with its own group:
* `Show Long-Term Channel`
* `Deviation Multiplier (Long-Term)`
* Upper/Lower channel colors, thickness, style, transparency
* `Line Extension Style`
* Optional Long-Term midline + colors/styles
* Optional **background fill** with separate colors for up vs down
You can run **both channels at once**, giving a panel of:
* **Macro trend structure** (Long-Term ATC)
* **Current swing trend** (Short-Term ATC)
* MAs, VWAP, and Auto Fibs on top for entries/exits
### Trend Info Tables
Each channel has its own table options:
* `Show Detected Period` (bars used)
* `Show Trend Strength` – either:
* Descriptive text: “Extremely Weak” → “Ultra Strong”, or
* Raw Pearson R value if `Show Pearson R` is enabled
* `Show Annualized Return` (when timeframe is daily/weekly)
* Table position (`Top Left`, `Bottom Right`, etc.)
* Text size (`Small`, `Normal`, `Large`)
These tables quantify:
* Over what lookback the trend is being measured
* How “clean” that trend is
* What the approximate annualized performance of that trend has been
---
## 5. Dixson Auto Fibonacci Suite — ATR Fibs + Lookback Fibs + Shared Fib Bank
**Master toggle:** `Enable Auto Fibonacci`
**Groups:** `Dixson Auto Fibonacci`, `ATR Auto Fib`, `Previous ATR Fib`, `Lookback Auto Fib`, `Lookback Anchor Overrides`, `Fibonacci Levels`
You get **two separate engines** (ATR-based and Lookback-based) that both draw from the **same customizable Fib bank**, with optional log scaling.
---
### 5.1 Global Auto Fib Settings
* `Logarithmic Scale`
* When ON, Fib levels are interpolated in log-space (better for assets that move in percentages).
* When OFF, interpolation is linear in price.
This applies to **both** the ATR and Lookback engines.
---
### 5.2 ATR Auto Fib (Rail-Based, Supertrend-Driven)
**Groups:** `ATR Auto Fib`, `Previous ATR Fib`
The ATR engine builds **“rails”** that hug price without letting candles touch them, then projects Fib levels between these anchors.
#### How it works
1. Uses built-in `ta.supertrend` with:
* `ATR Period`
* `ATR Multiplier`
2. Builds dynamic **upper and lower rails** around price:
* Uses ATR to define a **proximity gap** (`Proximity (×ATR)`) so rails stay **just outside the wicks** (no-touch behavior).
* Smooths raw highs/lows slightly (RMA) to avoid spiky rails.
* Ensures the upper rail is always ≥ high+gap and lower rail ≤ low−gap.
3. The **direction** (uptrend/downtrend) is inferred from the Supertrend direction:
* On trend flips, the script:
* Captures the prior rail pair as a **“previous segment”**
* Starts a new rail segment in the new direction
4. From these rails, the script draws **directional Fib “ladders”**:
* For the **current ATR Fib**:
* The Fib is drawn from one anchor to the other depending on the trend sign.
* Rays are projected `Ray Length` bars to the right of `Current Offset`.
* For the **previous ATR Fib**:
* The last completed segment’s start/end rails are used as anchors
* Rays are projected using `Prev Fib Offset` and `Prev Fib Length`
#### Current ATR Fib controls
* `Enable ATR Fib` – toggles current ATR Fib bank
* `ATR Period`, `ATR Multiplier` – control the “engine” behind the rails and ST logic
* `Current Offset`, `Ray Length` – where and how far rays are drawn
* `Show Level Text`, `Show Price`, `Display % not ratio` – label style
* `Label Size (Current ATR Fib)` – for all current ATR Fib labels
Visual extras:
* `Plot Hi/Low Anchor Lines` – shows upper/lower rails
* `Plot ATR Trailing Stop` – shows clamped Supertrend as a continuous line
#### Previous ATR Fib controls
* `Enable Prev ATR Fib` – toggles previous segment ladders
* Independent `Prev Fib Offset`, `Prev Fib Length`
* Separate label controls:
* `Show Level Text (Prev)`
* `Show Price (Prev)`
* `Display % not ratio (Prev)`
* `Label Size (Previous ATR Fib)`
Use the **current ATR Fib** as your active trading “ladder” and the **previous ATR Fib** to track recently broken structure and potential retest zones.
---
### 5.3 Lookback Auto Fib — HH/LL-Driven Fib Bank, MTF + Manual Overrides
**Group:** `Lookback Auto Fib` + `Lookback Anchor Overrides`
This engine draws Fibs between **highest high** and **lowest low** within a given lookback window on a chosen timeframe.
#### How it works
1. Select higher timeframe:
* `Lookback Timeframe` (empty = chart timeframe)
2. Choose your range:
* `Lookback Bars` – number of bars on the selected TF to scan for extremes
3. Optionally allow look-ahead:
* `Look-ahead Bars (repainting)`
* `0` = no look-ahead (no forward info, no repainting)
* `>0` = uses `barmerge.lookahead_on` for forward-looking extremes (can repaint)
4. For that range, the script finds:
* Highest high + its bar offset
* Lowest low + its bar offset
5. Trend direction is determined by **which extreme is more recent**:
* Recent high → **down** direction (high → low)
* Recent low → **up** direction (low → high)
6. Manual direction overrides:
* `Force Uptrend` / `Force Downtrend` – override the auto decision
7. Manual anchor overrides:
* `Manual Anchor High (LB)`
* `Manual Anchor Low (LB)`
If both are set, those become the anchors and direction is deduced from which is higher.
8. The engine then draws a **directional Fib ladder**:
* Anchors between high/low based on direction
* Rays extend `Lookback Fib Length` bars from `Lookback Fib Offset`
#### Label controls
* `Show Level Text`, `Show Price`, `Display % not ratio`
* `Label Size (Lookback Fib)`
* Labels are prefixed with `LB` to distinguish them from ATR Fibs.
This engine is ideal for:
* **Swing structure mapping:** Drawing Fibs across the last major swing on the HTF.
* **Confluence:** Aligning Lookback Fibs with ATR Fibs, ATC channel boundaries, and VWAP bands.
---
### 5.4 Shared Fibonacci Levels — Fully Custom Fib Bank for Both Engines
**Group:** `Fibonacci Levels`
The ATR and Lookback engines **both** use the same Fib bank:
* **Ratios provided by default:**
* 0.000
* 0.146
* 0.236
* 0.382
* 0.500
* 0.618
* 0.650
* 0.707
* 0.786
* 0.886
* 1.000
* 1.130
* 1.272
* 1.618
* 2.000
Each ratio has its own:
* `Enable Level X.XXX`
* `Level X.XXX` (the actual ratio – fully editable)
* `Thickness X.XXX` (line width)
* `Style X.XXX` (Solid / Dashed / Dotted)
* `Color X.XXX` (line + label color)
Adjusting a level here **instantly updates both** ATR and Lookback ladders. This makes it very easy to:
* Run “standard” Fib sets for classic retracements
* Or define your **own Fib presets** (e.g., 0.25 / 0.5 / 0.75, or custom extension clusters)
---
## How to Use & Suggested Workflows
**Scalpers / 0DTE / Intraday:**
* Enable:
* MA/EMA pack (fast EMAs + one MTF slot)
* VWAP (Session anchor) + 1–2 VWAP bands + highlight fill
* ATR Auto Fib (current + previous)
* Optionally hide:
* Lookback Fibs
* Long-Term ATC (unless you want HTF bias on your intraday chart)
Use slope labels, VWAP angle %, and ATR Fib ladders to structure trades around pullbacks, mean reversion, and breakouts.
**Swing / Position traders:**
* Turn on:
* Long-Term ATC (with table)
* Short-Term ATC for swing structure
* Lookback Auto Fib on a higher timeframe (e.g., D on 4H chart)
* Keep VWAP anchored to Week or Month, and MA slots for key reference MAs.
Use ATC channels for **trend structure**, Lookback Fibs for **swing levels**, and long VWAPs for **value zones**.
---
## Final Notes & Disclaimer
* Works on **all symbols** and **all timeframes**, but some stats (like “Annualized Return”) are only meaningful on **daily/weekly** data.
* Some options (like Look-ahead mode for Lookback Fibs) can **repaint** on purpose. These are clearly labeled — use them only if you understand and want forward-looking behavior.
* This script does **not** place trades. It is a visual / analytical tool only.
* Nothing in this indicator or description is financial advice. Always do your own research, forward-test, and manage risk appropriately.
If you have **invite-only access** to **Dixsons Tackle Box**, you’re getting the full Dixson overlay stack in one place — designed to be the central “hub” for your chart, not just another line on it.

XAUMO MegaBar VSA by Mohamed Mahmoud XAUMO MegaBar VSA — Smart Money Breakout & Reversal Engine for XAUUSD
(Educational Use Only)
1) WHAT THIS INDICATOR DOES
XAUMO MegaBar VSA is an institutional-style smart money engine for XAUUSD designed to show you what professional money is doing, not just where price is moving.
It combines:
- MegaBar detection on 1H and 15m
- VSA (Volume Spread Analysis) events
- VPOC / WVPOC and volume clusters
- Liquidity sweeps, CHoCH, order blocks, FVGs
- Full Fibonacci leg mapping (retracements + extensions)
- Pre-built execution ladders (Entry, SL, TP1–TP4, Reverse Fib trades)
All in one dashboard with:
- Color-coded candles
- Clean, ATR-offset labels
- Optional tables and debug panels
So traders can quickly decide:
“Is this move driven by smart money, or is it just noise?”
2) CORE MODULES & FEATURES
A) SESSION + ACCUMULATION / DISTRIBUTION CONTEXT
- Session filter: London, New York, Overlap, or custom.
- Accumulation / distribution zones shaded on chart with adjustable colors/opacity.
- Quick legend so you always know if the market is in “smart money accumulation” or “distribution”.
HOW TRADERS USE IT:
Focus only on your trading session and instantly see if volume is building (accumulation), unloading (distribution), or flat. This helps you avoid trading in dead liquidity.
--------------------------------------------------
B) MEGABAR ENGINE + FIB MAP
- Automatically detects “MegaBars” (institutional candles) on 15m and 1H.
- Uses body size, range, and volume to pick only meaningful bars.
- Builds a full Fibonacci map from each active MegaBar:
• Retracements: 0, 13, 23.6, 38.2, 50, 61.8, 78.6, 86.2, 100, and -33.
• Extensions: 125% up to 600%+ (configurable ladder).
- Per-level style controls:
• Color, width, line style (solid/dotted/dashed).
• Optional price labels with ATR-based offsets.
- Main Fib legend that explains shallow / normal / deep reload zones.
HOW TRADERS USE IT:
You stop guessing where to buy or sell. You trade around the institutional leg:
- Buy dips into defined reload zones after bullish MegaBars.
- Sell rallies into extension zones after bearish MegaBars.
- Use clean, pre-mapped structure for both scalps and swings.
--------------------------------------------------
C) VSA ENGINE + CANDLE LABELING
- Detects a full set of VSA events such as:
• No Demand / No Supply
• Stopping Volume
• Absorption
• Springs / Upthrusts
• Buying Climax / Selling Climax
• Bullish / Bearish EVR
• Tests and confirmed VSA signals at S/R
- Enhances with:
• Body vs total range analysis
• Wick dominance for exhaustion vs aggression
• Momentum and volume confirmation filters
HOW TRADERS USE IT:
Each label becomes a “comment” from smart money on the chart:
- “No Demand” near resistance + weak RVOL = skip long entries.
- “Stopping Volume” + spring at Fib reload zone + VPOC cluster = potential high-quality long.
- Combine VSA with the MegaBar Fib map and volume profile for structured decisions.
--------------------------------------------------
D) SUPERSONIC BREAKOUT ENGINE
- Calculates a breakout strength score using:
• RVOL and volume expansion
• Spread expansion vs recent bars
• Body quality (body vs range)
• Bar progress (how much of the candle’s time has elapsed)
- Differentiates:
• Potential vs confirmed breakouts
• Strong, volume-backed moves vs weak spikes
- Optional debug label explaining:
• Momentum score
• Volume ratio and RVOL
• Spread behaviour
• Body quality
• Bar elapsed %
HOW TRADERS USE IT:
You avoid chasing every big candle.
You only act when:
- Breakout strength is high,
- Volume confirms the move,
- Structure (Fib / VPOC / CHoCH) is aligned.
--------------------------------------------------
E) VPOC / WVPOC CLUSTERS & DYNAMIC ZONES
- Tracks real-time VPOC and WVPOC.
- Identifies VPOC/WVPOC clusters as powerful S/R zones.
- Confirms bullish or bearish breaks when price clears these levels with volume.
- Provides dynamic SL and TP logic:
• SL near/behind VPOC with ATR buffer.
• TP ladders aligned with volume structure.
HOW TRADERS USE IT:
You anchor your risk to where the most volume traded, not random price points:
- Use VPOC as a rational stop placement.
- Treat VPOC/WVPOC clusters as “coiled springs” – zones where large moves often start.
--------------------------------------------------
F) SMART MONEY ENTRY ENGINE (1H + 15M MEGABARS)
- Uses MTF `request.security` logic to bring 1H MegaBars into lower timeframes.
- Identifies:
• 1H + 15m confluence entries (A-grade setups).
• Single-TF entries (B-grade setups).
- Pre-calculates for each scenario:
• Entry level (Fib-based within the MegaBar range).
• Stop loss (beyond range or leg-based).
• TP1–TP4 along Fib extensions / structure.
- Labels show:
• “Entry = …”
• “SL = …”
• “TP1 = … / TP2 = … / TP3 = … / TP4 = …”
with adjustable font size and ATR-based offsets.
- Optional “show only latest” mode to keep your chart clean.
- Alert-ready so you can receive notifications when conditions are met.
HOW TRADERS USE IT:
You get a fully defined execution ladder:
- The engine tells you where a logical entry is,
- Where a logical SL should be,
- And how to scale out with multiple targets.
You can use:
- Confluence setups for main trades,
- Single-TF setups for more frequent but lower conviction trades.
--------------------------------------------------
G) REVERSE FIB TRADING MODULE
- Triggers after extended moves when key TPs are hit.
- Looks for:
• Rejection candles at or beyond major extensions.
• Exhaustion + VSA confirmation.
- Builds a reverse (counter-trend) Fib plan:
• Counter-trend entry from extension extremes.
• TP ladder based on 0.618, 0.786, 1.236, 1.382, 1.5, 1.618, 2.0, etc.
• SL and TSL based on ATR and Fib distance.
- ATR timeframe adapts to chart timeframe.
HOW TRADERS USE IT:
You can fade overextended moves once structure and P/A agree:
- Trend traders can use it to tighten or exit.
- Counter-trend traders can structure “fade” setups with defined risk.
--------------------------------------------------
H) LIQUIDITY SWEEPS, CHoCH, ORDER BLOCKS, FVGs
- Detects sweeps above highs and below lows (liquidity grabs).
- Marks CHoCH (Change of Character) when structure flips with volume.
- Basic smart money order block detection (bullish / bearish).
- FVGs (Fair Value Gaps) shaded on chart, removed when filled.
HOW TRADERS USE IT:
Combine sweeps + CHoCH + MegaBar + VSA + VPOC:
- Join clean, volume-backed continuations.
- Fade obvious stop hunts when they reject into strong zones.
--------------------------------------------------
I) VSA + BREAKOUT DASHBOARD TABLE (OPTIONAL)
- Compact table with:
• VSA context
• Breakout score
• RVOL / volume status
• Spread and candle quality
• ATR regime
• Close position within the bar
• VPOC and elapsed bar percentage
HOW TRADERS USE IT:
Before pressing the button, glance at the table:
- Is volatility supportive?
- Is volume confirming?
- Is this a clean breakout or a tired move?
This pushes you toward rule-based execution and away from impulse.
--------------------------------------------------
3) TYPICAL TRADING WORKFLOW WITH XAUMO MEGABAR VSA
A) Pick timeframe and session
- Use 15m or 1H on XAUUSD.
- Align the indicator’s session inputs with your actual trading hours.
B) Read context first
- Check accumulation / distribution zones.
- Look at VSA events and the breakout engine.
- Note where VPOC / WVPOC are relative to price.
C) Find the active MegaBar and its Fib structure
- Identify the most recent bull/bear MegaBar.
- See if price is:
• Pulling back into reload zones,
• Breaking out of them,
• Or extending into high-risk zones.
D) Wait for smart money confirmation
- Look for:
• Confluence setups (1H + 15m MegaBars),
• Strong breakout score,
• Valid VSA signals,
• Helpful structure: CHoCH, FVG, sweeps.
E) Execute using the printed ladders
- Use the on-chart Entry / SL / TP labels as your execution framework.
- Adjust lot size and risk % according to your own plan.
F) Manage and exit
- Use ATR / VPOC logic to trail or lock profits.
- Rotate to reverse Fib setups if extensions look exhausted.
4) WHO THIS INDICATOR IS FOR
- Gold traders (XAUUSD CFD or spot) on 15m and 1H.
- Traders who prefer institutional structure (volume, VPOC, SMC, Fib) over simple indicators.
- Traders who want pre-structured entries, SL, and TP ladders without losing flexibility.
- Advanced students of VSA and smart money concepts who want everything in one tool.
5) FULL EDUCATIONAL DISCLAIMER (READ CAREFULLY)
- This indicator and all descriptions are for EDUCATIONAL PURPOSES ONLY.
- NOTHING in this script, its labels, tables, alerts, outputs, or documentation is:
• Investment advice
• Trading advice
• A recommendation to buy or sell any asset
• A signal service or portfolio management tool
- Markets are risky. Trading leveraged instruments such as CFDs, futures, or margin products involves a HIGH RISK of loss, including the possible loss of ALL invested capital.
- Past performance, backtests, or hypothetical examples DO NOT guarantee future results.
- Any probabilities, scores, or “quality levels” shown by the indicator are purely algorithmic and DO NOT represent guarantees or promises of profit.
- You are solely responsible for:
• Your position sizing
• Your leverage
• Your entries, exits, and risk management
• Compliance with local regulations and tax rules
- Before trading live with real money, you should:
• Thoroughly backtest and forward-test the indicator.
• Use a demo account to understand how signals behave in real time.
• Consult a licensed financial professional if you need personalised investment or trading advice.
- By using this indicator:
• You accept that the author and any associated entities or brands (including XAUMO, XAUMO indicators, and any promotional text) bear NO LIABILITY for any financial losses, missed gains, or decisions you make based on this tool.
• You agree that you are acting entirely at your own risk and that all outputs are informational and educational, not prescriptive trading instructions.
In short:
Use XAUMO MegaBar VSA as a powerful educational and analytical companion,
NOT as a substitute for your own independent judgment, testing, and risk control.
=====================================================
XAUMO MegaBar VSA — محرّك البريك آوت و الريفرسال بتاع السمارت ماني للدهب
( استخدام تعليمي بس)
1) المؤشّر ده بيعمل إيه؟
XAUMO MegaBar VSA معمول مخصوص للـ XAUUSD عشان يورّيك "الفلوس الكبيرة" بتتحرك إزاي،
مش بس السِعر رايح فين.
بيجمع في حتّة واحدة:
- رصد MegaBar على الساعة والربع ساعة
- VSA (Volume Spread Analysis) – سلوك الفوليوم جوّه الشمعة
- VPOC / WVPOC و تجمّعات الفوليوم المهمّة
- سويپس لليكويديتي + CHoCH + Order Blocks + FVGs
- خريطة فيبوناتشي كاملة (Retrace + Extensions)
- سلالم تنفيذ جاهزة (Entry, SL, TP1–TP4 + صفقات Reverse Fib)
وكل ده:
- بألوان واضحة على الشموع
- لِيبلات متظبّطة بـ ATR Offset
- Tables و Panels اختيارية
عشان المتداول يسأل نفسه:
"الحركة دي بتاعة سمارت ماني؟ ولا مجرد دوشة ملوش لازمة؟"
2) أهم الموديولات اللي جوّه المؤشّر
A) الكونتكست بتاع السيشن + تجميع/توزيع
- فلتر جلسات: لندن – نيو يورك – overlap – أو وقت تحطّه انت.
- مناطق Accumulation / Distribution متظلّلة بألوان أنت بتختارها.
- لچند بسيط يوضّح لك السوق دلوقتي: تجميع؟ توزيع؟ ولا نايم.
المتداول يستخدمه إزاي؟
تركّز بس في الجلسة اللي انت شغّال فيها، وتشوف فورًا:
فيه بناء مراكز؟ فيه تصريف؟ ولا مفيش فوليوم أصلاً؟
ده يقلّل دخولك في أوقات السوق فيها “ميت”.
--------------------------------------------
B) محرّك الـ MegaBar + خريطة الفيبوناتشي
- المؤشّر يلقط لوحده الـ MegaBars (شموع مؤسّسات) على 15m و 1h.
- بيعتمد على: حجم الجسم، مدى الشمعة، الفوليوم.
- يرسم خريطة فيبوناتشي كاملة من الرجل الأساسية:
• Retrace: 0, 13, 23.6, 38.2, 50, 61.8, 78.6, 86.2, 100, -33
• Extensions: من 125% لحد 600%+ (سلم قابل للتعديل)
- لكل مستوى:
• لون / سماكة / ستايل (سوليد – دوتيد – داشد)
• ليبل سِعر مع Offset بـ ATR
- لچند يشرح لك Reload Zones: ضحلة / عادية / عميقة.
المتداول يستخدمه إزاي؟
بدل ما “تخمّن” فين تشتري وتبيع:
- تشتري الدِپ جوّه مناطق Reload بعد MegaBar صاعد.
- تبيع الريبوند جوّه Extensions بعد MegaBar هابط.
- عندك هيكل واضح للسوينج والسكالب من غير فوضى.
--------------------------------------------
C) VSA + لِيبلات على الشموع
- يكتشف أحداث VSA زي:
• No Demand / No Supply
• Stopping Volume
• Absorption
• Spring / Upthrust
• Buying / Selling Climax
• EVR (شموع مجنونة فوليومًا)
• Tests و Confirmed Signals عند الدعوم/المقاومات
- مع تحسينات:
• تحليل Body vs Range
• مين اللي غالب؟ جسم الشمعة ولا الذيول؟
• فلتر Momentum + Volume
المتداول يستخدمه إزاي؟
كل ليبل على الشمعة = كومنت من السمارت ماني:
- No Demand عند مقاومة + RVOL ضعيف → بلاش تشتري.
- Stopping Volume + Spring جوّه Reload Zone + VPOC → فرصة قوية للشراء.
- توصل بين VSA + Fib + VPOC فتفهم “مين بيكسب المعركة”.
--------------------------------------------
D) محرّك البريك آوت Supersonic
- بيحسب Score للقوة بتاعة البريك آوت من:
• RVOL + Volume Expansion
• توسّع السبريد مقارنة بالشموع السابقة
• جودة جسم الشمعة (جسم ولا ذيل)
• نسبة الوقت اللي عدّى من الشمعة الحالية
- يفرّق بين:
• بريك آوت محتمل vs مؤكد
• حركة قوية مدعومة بفوليوم vs “شمعة شو”
- يقدر يطلع ليبل Debug يشرح:
• Momentum Score
• Volume Ratio / RVOL
• Spread Behaviour
• Body Quality
• % الوقت اللي فات من عمر الشمعة
المتداول يستخدمه إزاي؟
ماتجريش ورا كل شمعة كبيرة:
- استنَى لما يكون الـ Score عالي،
- والفوليوم مصدّق الحركة،
- والهيكل (Fib / VPOC / CHoCH) موافق.
ساعتها بس البريك آوت يستاهل المخاطرة.
--------------------------------------------
E) VPOC / WVPOC + مناطق الفوليوم
- يرقب VPOC و WVPOC في الوقت الحقيقي.
- يحدّد Clusters مهمة تتحوّل لـ Support / Resistance محترم.
- يراقب كسر المناطق دي بفوليوم واضح (بداية موجة جديدة).
- SL و TP ديناميك:
• SL حوالين VPOC مع Buffer من ATR.
• TP متوزع على مستويات فيبوناتشي و زونات فوليوم.
المتداول يستخدمه إزاي؟
بتربط مخاطرتك بأين اشتغل الفوليوم التقيل:
- VPOC = منطق منطقي للستوب.
- Clusters = زون ضغط ينفع يبدأ منها ترند قوي.
--------------------------------------------
F) محرّك الدخول بتاع السمارت ماني (1h + 15m MegaBars)
- يجيب MegaBars بتاعة الساعة جوّه فريمات أقل بالـ `request.security`.
- يميّز:
• Confluence بين MegaBar الساعة + MegaBar الربع ساعة (صفقة A-Grade).
• MegaBar على فريم واحد بس (B-Grade).
- يجهّز تلقائيًا:
• Entry
• SL
• TP1–TP4 على Extensions و مستويات هيكلية.
- اللّيبلات تكتب:
• Entry = …
• SL = …
• TP1 = … / TP2 = … / TP3 = … / TP4 = …
مع تحكّم في حجم الخط و ATR Offset.
- فيه اختيار “أظهر آخر سيناريو بس” عشان الشارت يفضل نضيف.
- جاهز للـ Alerts لما الشروط تكمّل.
المتداول يستخدمه إزاي؟
يبقى عندك Execution Ladder كامل:
- فين تدخل،
- فين تحط الستوب،
- إزاي تقسم الخروج على أكتر من هدف.
--------------------------------------------
G) موديل الـ Reverse Fib (صفقات عكس الاتجاه)
- بيشتغل بعد ما السعر يبالغ في الحركة و يوصل Extensions معيّنة.
- يدور على:
• شموع رفض عند/بعد Extensions.
• Exhaustion + إشارة VSA.
- يرسم خطة عكسية:
• Entry عكسي من Extension Extreme.
• TP سلم مبني على 0.618, 0.786, 1.236, 1.382, 1.5, 1.618, 2.0, … إلخ
• SL و TSL مبنيين على ATR و مسافة الفيبوناتشي.
المتداول يستخدمه إزاي؟
لو انت ترند تريدر:
- تستخدمه عشان تقفل/تخفف عند تمدّد مبالغ فيه.
لو انت Counter-Trend:
- يديك سيناريو “فِيد” منطقي بمخاطرة محسوبة.
--------------------------------------------
H) سويپس لليكويديتي + CHoCH + Order Blocks + FVGs
- يوسم مناطق ضرب الستوبات فوق الهاي وتحت اللو (Liquidity Grabs).
- يحدد CHoCH لما الاتجاه يغيّر شخصيته مع فوليوم.
- يرصد Order Blocks أساسية (Bullish / Bearish).
- يظلّل الـ FVGs و يشيلها لما تتعبّى.
المتداول يستخدمه إزاي؟
تجمع بين:
MegaBar + VSA + Fib + VPOC + Liquidity:
- يا إمّا تلحق موجة نظيفة،
- يا إمّا تفِيد Stop Hunt غبي اتكشف على الشارت.
--------------------------------------------
I) داشبورد VSA + Breakout (Table اختياري)
- Table صغيرة فيها:
• حالة VSA
• قوة البريك آوت
• RVOL / Volume
• Spread & Candle Quality
• حالة ATR
• مكان الإغلاق جوّه الشمعة
• وضع VPOC
• نسبة الوقت اللي عدّى من الشمعة
المتداول يستخدمه إزاي؟
قبل ما تدوس Buy / Sell:
- تبص على التابل ثانيتين:
الدنيا شغّالة ولا لأ؟
فيه فوليوم؟ فيه ترند؟ ولا حركة ميتة؟
ده يقلل قرارات “من غير plan”.
3) سيناريو شغل متداول على XAUMO MegaBar VSA
1) اختار الفريم + الجلسة
- 15m أو 1h على XAUUSD.
- ظبّط سيشن لندن/نيويورك زي وقت شغلك الحقيقي.
2) اقرأ الكونتكست
- السوق بيبنِي مراكز؟ بيصفّي؟ ولا نايم؟
- إيه إشارات الـ VSA و Score البريك آوت؟
- فين VPOC / WVPOC من السعر؟
3) دور على MegaBar النشط و خريطة الفيبوناتشي بتاعته
- السعر:
• بيرجّع جوّه Reload Zone؟
• بيكسر البرنچ؟
• ولا داخل على Overextension؟
4) استنَى تأكيد السمارت ماني
- Confluence بين MegaBar الساعة والربع ساعة.
- Breakout Score محترم.
- VSA منطقي (No Demand, Stopping Volume, Spring, …).
- Structure: CHoCH / FVG / Liquidity Sweep في اتجاه الصفقة.
5) نفّذ باستخدام السلم المطبوع على الشارت
- استخدم Entry / SL / TP1–TP4 كـ هيكل أساسي.
- عدّل اللوت / الريسك حسب خطتك انت.
6) الإدارة والخروج
- استعمل ATR + VPOC في Trailing/Lock.
- لما Extensions تبان مبالغ فيها → ركّز على Reverse Fib.
4) المؤشّر ده مناسب لمين؟
- اللي بيتاجر دهب XAUUSD (CFD أو Spot) على 15m و 1h.
- اللي بيحب شغل مؤسّسات: Volume, VPOC, SMC, Fib مش مؤشرات بسيطة.
- اللي عايز Execution Plan جاهز (Entry/SL/TP) بس لسه عنده حريّة تعديل.
- اللي عايز يتعلّم VSA و Smart Money Concepts بشكل تطبيقي على شارت واحد.
5) إخلاء مسؤولية كامل (مهم تقراه)
- المؤشّر ده وكل الكلام اللي حواليه للتعليم بس.
- مش:
• نصيحة استثمارية،
• ولا توصية شراء/بيع،
• ولا خدمة إدارة محافظ،
• ولا سيجنال سيرڤس.
- التداول في الأسواق (خصوصًا المشتقات، الـ CFD، الفيوتشر) فيه مخاطرة عالية جدًا،
وممكن تخسر جزء كبير أو كل رأس مالك.
- أي أداء سابق، باك تست، أو مثال افتراضي → مش ضمان لنتيجة مستقبلية.
- أي نسبة احتمالات، Scores، أو “Quality” بيطلعها المؤشّر:
• دي حسابات كود، مش ضمان ربح،
• مش وعد ولا تعهّد بأي نتيجة.
- انت المسؤول 100% عن:
• حجم العقود اللي بتدخلها،
• الرافعة اللي بتستخدمها،
• أماكن الدخول والخروج،
• وإدارة المخاطرة بتاعتك،
• والتزامك بالقوانين والضرائب في بلدك.
- قبل ما تستخدم المؤشّر على حساب حقيقي:
• جرّب كويس على باك تست و فورورد تست،
• اشتغل فترة على Demo،
• لو محتاج نصيحة مالية شخصية → ارجع لمستشار مالي مرخَّص.
باختصار:
XAUMO MegaBar VSA ده أداة تعليمية وتحليلية قوية تساعدك تفهم حركة الذهب،
مش زرار “اطبع فلوس”.
انت صاحب القرار، وانت صاحب المسؤولية، وانت اللي بتتحمّل أي ربح أو خسارة.

Livermore's Pyramiding Trading - 3Commas [SwissAlgo]
📊 J. LIVERMORE'S PYRAMIDING TRADING - 3Commas Integrated
A Trading Approach Inspired by Jesse Livermore's Position Building Principles
━━━━━━━━━━━━━━━━━━━━━━━━━━━━━━━━━━━━━━━━━━━
DISCLAIMER
This indicator is an educational tool based on historical trading principles. Past performance is not indicative of future results. Trading involves substantial risk of loss. Only trade with capital you can afford to lose. You are responsible for all trading decisions.
━━━━━━━━━━━━━━━━━━━━━━━━━━━━━━━━━━━━━━━━━━━
📚 WHO WAS JESSE LIVERMORE?
Jesse Livermore (1877-1940) was one of the greatest traders in history.
His core insight: "Most traders do everything backward."
♦ "They deploy all capital at once" → Livermore entered with a small fraction of his capital (he started with a 'test position' to validate his trade idea and waited for market confirmation to deploy more, building positions in steps = "pyramiding")
♦ "They average down" (DCA) → Livermore added to trades showing good results only, and never to losing trades, as the trend kept aligning with his trade idea
♦ "They use arbitrary % stops" → Livermore exited when structure appeared broken (he trailed his stop loss to try to protect unrealized profit - if any)
♦ "They take profits too early or set arbitrary TP%" → Livermore let trades showing positive results run until proven wrong (trial take profit)
💬 "I always made money when I was sure I was right before I began. What beat me was not having enough brains to stick to my own game."
— Jesse Livermore
This indicator tries to translate his principles into a SYSTEMATIC FRAMEWORK :
BO = Base Order (first order, base of the pyramid)
PO = Pyramid Orders (additional layers of capital deployed as long as the 'tape' does not invalidate the trade idea)
♦ Test First (BO - 20%) - Small entry to test your idea. If wrong, lose small. If right, can consider pyramiding into strength.
♦ Build Position Size (PO1-3 - 80%) - Add only as trend unfolds favorably (the indicator uses specific Fibonacci levels to track milestones - 0.618, 1.0, 1.272 - and looks for strong confluence among price, volume, trend, momentum, break of resistance/support levels to suggest and trigger actions: entries, exit)
♦ Attempt to Protect Capital - Dynamic stops: the indicator trails the stop loss, to try to protect potential gains from previous steps (if any)
♦ Discipline - Trades fire only when ALL conditions align
━━━━━━━━━━━━━━━━━━━━━━━━━━━━━━━━━━━━━━━━━━━
🎯 INDICATOR FEATURES
You map 3 points on the chart → The indicator generates a systematic trading plan structure based on your wave analysis.
✓ Auto-detects trade direction: Uptrend wave (A➚B➘C) = Long signals | Downtrend wave (A➘B➚C) = Short signals
✓ Entry/exit prices: BO, PO1, PO2, PO3, and dynamic EXIT (trailing stop)
✓ Real-time condition monitoring: Live ✓/✗ checks for each order (price closes + volume + trend + pivot breaks + candle quality + sequence)
✓ Visual trade execution: Green labels mark entries (BO/PO1/PO2/PO3), red labels mark EXIT
✓ Optional 3Commas automation: JSON webhooks for hands-free execution via Signal Bots
⏰ Recommended Timeframes: 1H, 4H, Daily
(Lower timeframes like 15m/5m produce excessive noise and false signals)
💬 "Watch the market leaders, the stocks that have led the charge. That is where the action is and where the money is made."
— Jesse Livermore
━━━━━━━━━━━━━━━━━━━━━━━━━━━━━━━━━━━━━━━━━━━
⚙️ SETUP IN 3 STEPS
🟡 STEP 1: Map Your Wave (Points A → B → C)
Identify a completed wave pattern:
For LONGS:
♦ Point A = Swing low (wave start)
♦ Point B = Swing high (impulse end)
♦ Point C = Pullback low (retrace end - where next wave may begin)
For SHORTS:
♦ Point A = Swing high (wave start)
♦ Point B = Swing low (impulse end)
♦ Point C = Pullback high (retrace end - where next wave may begin)
How to set points:
Settings → Enter dates manually OR drag the vertical lines directly on the chart (easier - just click and drag the pre-mapped A/B/C lines)
Requirements (auto-validated by code):
✓ All dates must be in the past (Point C = completed retrace, not forming)
✓ Clear impulse A→B (minimum 5% move)
✓ Clear retrace B→C (minimum 3% pullback)
───────────────────────────────────────────
🟡 STEP 2: Set Budget & Allocation
Settings → "TRADE PARAMETERS"
♦ Total Budget: $10,000 (example - capital for THIS trade only, not your entire account)
♦ Allocation (must total 100%):
BO = 20% ($2,000) - test position
PO1 = 25% ($2,500) @ Fib 0.618
PO2 = 30% ($3,000) @ Fib 1.0
PO3 = 25% ($2,500) @ Fib 1.272
💬 "It was never my thinking that made big money for me. It was always my sitting. Men who can both be right and sit tight are uncommon."
— Jesse Livermore
───────────────────────────────────────────
🟡 STEP 3: Monitor Your Trade Plan Table
The table (top-right corner) has 4 sections that guide your execution:
BUDGET DEPLOYMENT
♦ Trigger prices for each order (BO auto-calculated at 0.5 Fib between B-C)
♦ Dollar amount per entry
♦ Fibonacci level assigned to each PO
ENTRY/EXIT CONDITIONS
Each column (BO, PO1, PO2, PO3) shows live status (✓ or ✗) for:
♦ Price: 2 consecutive closes (BO) | 3 consecutive closes (POs)
♦ Volume: OBV directional alignment OR volume spike above average
♦ Trend: Normal or Strong Bull/Bear (no entries in Uncertain trend)
♦ Pivot: Nearest resistance (longs) or support (shorts) broken
♦ Clean Candle: Momentum without reversal wicks <30% (POs only)
♦ Sequence: Prior order must have fired first (POs only - no skipping levels)
TRIGGERED?
Shows execution status for each order (✓ = fired, ✗ = waiting)
If using 3Commas: ✓ confirms JSON alert was sent to your bot for real execution
VALIDATIONS
✓ Green = All checks passed, setup is valid
⚠️ Yellow = Warning (e.g., budget doesn't equal 100%, deep retrace)
✗ Red = Error (e.g., dates in wrong order, invalid wave structure)
⚠️ Wait for ALL ✓✓✓✓✓ (or ✓✓✓✓✓✓) to align in a column before that order fires at bar close
💬 "The game of speculation is the most uniformly fascinating game in the world. But it is not a game for the stupid, the mentally lazy, the person of inferior emotional balance, or the get-rich-quick adventurer."
— Jesse Livermore
━━━━━━━━━━━━━━━━━━━━━━━━━━━━━━━━━━━━━━━━━━━
📊 CHART VISUALS - READING THE INDICATOR
Fibonacci Extension Lines
After mapping A-B-C, horizontal lines extend to the right:
♦ Solid green/red lines = Active PO entry levels (0.618, 1.0, 1.272)
♦ Dotted gray lines = Reference Fib levels used for exit tracking (2.0, 2.618, 3.0, etc.)
♦ Labels on right = Show level and price: "Fib 0.618 / $67,324 "
Entry/Exit Price Lines
♦ Thick green line (longs) / red line (shorts) = BO entry price with direction label
♦ Dashed red line = Current EXIT price (your trailing stop loss - appears after BO fires and moves as price extends)
Trade Execution Labels
Visual confirmation when orders fire on the chart:
♦ Green labels (below/above candles) = BO, PO1, PO2, PO3 entries executed
♦ Red label = EXIT triggered (position closed)
Trend Strength Indicator (EMA Line)
The thick colored line shows real-time trend status:
♦ Bright lime = Strong bullish trend
♦ Light green = Normal bullish trend
♦ Bright red = Strong bearish trend
♦ Light red = Normal bearish trend
♦ Gray = Uncertain/weak trend (no entries fire in this state)
Entries require at least Normal trend strength aligned with your trade direction.
💬 "I never argue with the tape. Getting sore at the market doesn't get you anywhere."
— Jesse Livermore
━━━━━━━━━━━━━━━━━━━━━━━━━━━━━━━━━━━━━━━━━━━
🔧 ENTRY LOGIC - TECHNICAL DETAILS
💬 "The big money was never made in the buying or the selling. The big money was made in the waiting."
— Jesse Livermore
───────────────────────────────────────────
🟢 BASE ORDER (BO) - TEST POSITION
BO Price Calculation
Auto-calculated at the 0.5 Fibonacci retracement between Point B and Point C
Formula: (Price B + Price C) / 2
Why this level?
♦ Midpoint between impulse end (B) and retrace end (C)
♦ Breakout above/below suggests retrace may be complete
♦ Designed to help position BO below all Fib extensions (to control sequence issues)
───────────────────────────────────────────
BO Entry Conditions - ALL 5 Must Align:
1️⃣ PRICE: 2 Consecutive Closes Beyond BO
♦ Longs: close > BO AND close > BO
♦ Shorts: close < BO AND close < BO
♦ Why: Designed to confirm breakout commitment and filter fakeouts
2️⃣ TREND: Normal OR Strong Trend Aligned
♦ Detection: 18-period EMA + ADX/DMI + higher timeframe slope
♦ States: Strong Bull/Bear (ADX>30), Normal Bull/Bear (price vs EMA), Uncertain
♦ Confirmation: Requires 3 consecutive bars in the same state (to reduce flip-flop)
♦ BO accepts: Normal OR Strong (you're testing early, basic alignment sufficient)
3️⃣ PIVOT: Nearest Resistance/Support Broken
♦ Storage: 60 most recent pivot highs/lows (dynamic lookback per timeframe)
♦ Longs: Nearest pivot HIGH above BO → must break with 2 closes
♦ Shorts: Nearest pivot LOW below BO → must break with 2 closes
♦ Price Discovery: If no pivot exists beyond BO = auto-pass
♦ Why: Aims to confirm momentum has overcome previous rejection zones
4️⃣ VOLUME: OBV Aligned OR Spike
♦ Directional OBV: OBV > 20-EMA (longs) OR OBV < 20-EMA (shorts)
♦ OR Volume Spike: Current volume > 20-period SMA
♦ Why: Checks for institutional participation signals
5️⃣ VALIDATIONS: Setup Valid (✅)
♦ Dates valid (A < B < C, all in past)
♦ Wave structure valid (min 5% impulse, min 3% retrace)
♦ Budget allocation = 100%
♦ Prices detected at all points
⚠️ BO fires once per bar close. Flag set permanently until trade resets.
───────────────────────────────────────────
🔺 PYRAMID ORDERS (PO1-3) - PYRAMIDING INTO STRENGTH
💬 "Never buy a stock because it has had a big decline from its previous high. The big money was never made in the stock market by buying on declines."
— Jesse Livermore
PO Price Calculation
Fixed Fibonacci extensions from Point C:
Formula: Price C ± (Impulse Range × Fib Level)
Where: Impulse Range = |Price B - Price A|
Default Levels:
♦ PO1 @ Fib 0.618 (Golden Ratio)
♦ PO2 @ Fib 1.000 (Full impulse repeat)
♦ PO3 @ Fib 1.272 (Fibonacci sequence extension)
───────────────────────────────────────────
PO Entry Conditions - ALL 6 Must Align (STRICTER):
1️⃣ PRICE: 3 Consecutive Closes Beyond PO
♦ Longs: close > PO AND close > PO AND close > PO
♦ Shorts: close < PO AND close < PO AND close < PO
♦ Why: Higher conviction needed when adding capital (3 vs 2 closes for BO)
2️⃣ TREND: Same as BO
Normal OR Strong trend must remain aligned with trade direction
3️⃣ PIVOT: Per-Level Pivot Break
♦ Each PO checks its OWN nearest pivot (not shared with BO)
♦ Same 2-close break requirement
♦ PO3 Exception: Price discovery allowed (no pivot required if already profitable)
4️⃣ VOLUME: Same as BO
Sustained confirmation required (not weakening)
5️⃣ CLEAN CANDLE: <30% Reversal Wick (NEW)
♦ Filter: Uses ATR(14) - candles < ATR auto-pass (consolidation noise)
♦ Longs: Upper wick < 30% of candle range (no rejection at top)
♦ Shorts: Lower wick < 30% of candle range (no rejection at bottom)
♦ Why: Don't pyramid into weakness/rejection - only add on clean momentum
♦ Not checked for BO: Test position tolerates some wick risk
6️⃣ SEQUENCE: Prior Order Fired
♦ PO1 requires: BO fired
♦ PO2 requires: PO1 fired
♦ PO3 requires: PO2 fired
♦ Why: No skipping levels - disciplined building only
───────────────────────────────────────────
⚙️ KEY DIFFERENCE:
BO (20% capital) = Lighter requirements, testing your idea early
POs (80% capital) = Stricter requirements, adding only to confirmed winners
♦ BO: 2 closes | POs: 3 closes
♦ BO: No candle check | POs: Clean candle required
♦ BO: Independent | POs: Sequential (must follow order)
♦ BO: No price discovery | PO3: Allows price discovery when profitable
💬 "Profits always take care of themselves, but losses never do. The speculator has to ensure himself against considerable losses by taking the first small loss."
— Jesse Livermore
━━━━━━━━━━━━━━━━━━━━━━━━━━━━━━━━━━━━━━━━━━━
🚪 EXIT LOGIC - TECHNICAL DETAILS
🔴 EXIT PHILOSOPHY
The indicator uses TWO INDEPENDENT EXIT TRIGGERS (whichever fires first):
1) Structural Breakdown
Price breaks through the EXIT level with confirmation
2) Trend Reversal
Trend flips against your position AND price breaks EXIT level
Why two methods?
♦ Structure = price-based protection (hard stop)
♦ Trend = momentum-based exit (early warning when market character changes)
♦ Combined: Exit either when proven wrong (structure) or when conditions no longer favor your direction (trend)
───────────────────────────────────────────
🔴 EXIT PRICE CALCULATION
The EXIT price (your stop loss) adjusts dynamically based on position size:
BEFORE PO3 Fires (Fixed Stops):
♦ BO only = Stop at Point C (small position, tight stop near entry)
♦ PO1 fired = Stop at Fib 0.5 (moved to breakeven zone)
♦ PO2 fired = Stop at Fib 0.786 (protecting partial profits)
AFTER PO3 Fires (Trailing Stops):
♦ Tracking: Monitors the highest Fib reached (longs) or the lowest Fib reached (shorts)
♦ Placement: EXIT moves 1-2 Fib levels below the highest (longs) or above the lowest (shorts)
♦ Example: Price reaches Fib 2.618 → EXIT trails up to Fib 2.0
♦ Purpose: Designed to protect accumulated profits while allowing room for normal pullbacks
💬 "It never was my thinking that made the big money for me. It was always my sitting. Men who can both be right and sit tight are uncommon."
— Jesse Livermore
───────────────────────────────────────────
🔴 EXIT CONDITIONS
Exit Speed (Based on Risk Exposure):
♦ Full position (PO3 fired) = 1 close required (fast exit - more capital at risk)
♦ Partial position (BO/PO1/PO2 only) = 2 closes required (confirmation - less urgency)
METHOD 1: Structural Breakdown
Price violates the EXIT level with clean momentum:
For Longs:
♦ Price closes BELOW EXIT level (1 or 2 closes depending on position size)
♦ Clean candle required (lower wick < 50% of range - no false breakdown)
For Shorts:
♦ Price closes ABOVE EXIT level (1 or 2 closes depending on position size)
♦ Clean candle required (upper wick < 50% of range - no false breakout)
Why clean candle check?
Designed to reduce exits on wicks/fakeouts. If there's a large reversal wick (>50%), it suggests buyers/sellers are defending the level - not a true breakdown.
METHOD 2: Trend Reversal
Market character shifts against your position:
For Longs:
♦ Trend shifts from Bull → Normal Bear OR Strong Bear
♦ AND price breaks below EXIT level (same close requirements)
For Shorts:
♦ Trend shifts from Bear → Normal Bull OR Strong Bull
♦ AND price breaks above EXIT level (same close requirements)
Why this matters?
♦ Proactive exit before structural stop is hit
♦ If the trend that confirmed your entries reverses, the setup is invalidated
♦ Livermore principle: Exit when market proves you wrong, don't wait for max pain
───────────────────────────────────────────
⚠️ EXIT BEHAVIOR
♦ Fires once per bar close (same as entries)
♦ Resets all tracking after exit (ready for fresh trade setup)
♦ Clears flags: boSignalFired, po1/po2/po3SignalFired, highestFib/lowestFib tracking
♦ If using 3Commas: Sends exit_long or exit_short JSON (market order closes 100% position)
💬 "I never argue with the tape. Getting sore at the market doesn't get you anywhere."
— Jesse Livermore
━━━━━━━━━━━━━━━━━━━━━━━━━━━━━━━━━━━━━━━━━━━
🤖 3COMMAS AUTOMATION (OPTIONAL)
💬 "There is the plain fool, who does the wrong thing at all times everywhere, but there is also the Wall Street fool, who thinks he must trade all the time."
— Jesse Livermore
Automation designed to help remove emotion and support disciplined execution.
───────────────────────────────────────────
⚡ QUICK SETUP IN 5 STEPS
STEP 1: Create Your Signal Bots
You need 2 SEPARATE BOTS (one for Longs, one for Shorts):
Go to 3Commas → Bots → Create Bot → Select "Signal Bot"
Basic Settings:
♦ Bot Name: "Livermore Long - " (example: "Livermore Long - BTCUSDT")
♦ Exchange: Your connected exchange
♦ Trading Pair: Must match TradingView chart exactly
♦ Strategy: Custom Signal
♦ Direction: LONG (for first bot) or SHORT (for second bot)
♦ Max Active Deals: 1
⚠️ CRITICAL SETTINGS:
Entry Orders:
♦ Toggle ON: "Entry Orders"
♦ Volume per Order: "Send in webhook, quote"
♦ Why: This lets the indicator control exact $ amounts per order (BO=$2K, PO1=$2.5K, etc.)
♦ If you skip this: Orders will use wrong sizes and break your allocation plan
Exit Orders:
♦ Toggle ON: "Exit Orders"
♦ Volume per Order: "100 Position %"
♦ Why: Closes your entire position when EXIT signal fires
♦ Toggle OFF: "Take Profit" (managed by indicator)
♦ Toggle OFF: "Stop Loss" (managed by indicator)
Click "Start Bot" for both Long and Short bots.
───────────────────────────────────────────
STEP 2: Get Your Bot Credentials
For EACH BOT (Long and Short):
♦ Open the bot → Click "Orders" tab
♦ Scroll down to "Webhook Messages" section
♦ Copy these 3 values:
bot_uuid (long string like: a362cbcf-7e68-4379-a83d-ae6e47dba656)
secret (very long token starting with: eyJhbGciOiJ...)
webhook URL (refer to 3commas to get exact webhook - signal bots)
Note: The secret is usually the same for both bots, but the bot_uuid is different.
───────────────────────────────────────────
STEP 3: Enter Credentials in Indicator
Back in TradingView:
♦ Open indicator Settings
♦ Find section: "1️⃣ INTEGRATE 3COMMAS"
♦ Paste:
Long = Your Long bot UUID
Short = Your Short bot UUID
Secret = Your secret token (same for both)
♦ Click "OK"
The indicator now has everything needed to build JSON payloads.
───────────────────────────────────────────
STEP 4: Create TradingView Alert
This alert bridges TradingView → 3Commas. ONE ALERT HANDLES ALL SIGNALS (BO, PO1, PO2, PO3, EXIT).
How to create:
♦ Right-click chart → "Add Alert" (or click clock icon)
♦ Condition: Select this indicator from dropdown
♦ Trigger: "Any alert() function call"
♦ Alert Name: "Livermore Pyramiding - "
♦ Message: Leave default (indicator sends its own JSON)
♦ Webhook URL: Paste your 3Commas webhook URL from Step 2
♦ ⚠️ Alert Frequency: "Once Per Bar Close" (CRITICAL - controls duplicate orders)
♦ Expiration: Open-ended (or set specific date)
♦ Click "Create"
───────────────────────────────────────────
STEP 5: Test Before Going Live
🧪 NEVER TEST WITH REAL CAPITAL FIRST. Use one of these methods:
Test 1: Check Bot Status
♦ 3Commas → Bots → Both bots show "Active" (green)
♦ Click into each bot → Orders tab → Should say "Waiting for signal"
Test 2: Verify Alert Active
♦ TradingView → Alerts panel (bell icon)
♦ Your alert should show "Active" status
Test 3: Paper Trade / Tiny Position
♦ Use 3Commas paper mode if available, OR
♦ Set Total Budget to $10-50 for first real test
♦ Map a wave that's about to trigger
♦ Watch if orders actually appear on 3Commas
Test 4: Check JSON Format
♦ When alert fires → TradingView Alerts → Click your alert
♦ Look at "History" or "Log"
♦ Verify JSON has: bot_uuid, secret, action, price, amount
───────────────────────────────────────────
🛠️ COMMON ISSUES & SOLUTIONS
✗ Problem: Orders not appearing on 3Commas
Possible causes:
♦ Wrong webhook URL → Must be exact 3Commas URL (check for typos)
♦ Bot paused → Check bot status must be "Active" (green)
♦ Wrong bot UUID → Verify you copied Long UUID for longs, Short UUID for shorts
♦ Secret mismatch → Double-check secret is correct
♦ Exchange API issues → Verify exchange connection in 3Commas settings
How to debug:
♦ 3Commas → Your Signal Bot → Orders tab
♦ Look for "Rejected Signals" section
♦ Should show error messages if webhook failed
───────────────────────────────────────────
✗ Problem: Orders executing at wrong prices
Possible causes:
♦ Limit order not filled → Price gapped through your level before order filled
♦ Slippage on exits → Exits use market orders (intentional - speed over exact price)
♦ Exchange minimums → Some exchanges have minimum order sizes
Solution:
♦ Entries use limit orders (wait for exact price - may not fill if price gaps)
♦ Exits use market orders (prioritize fast execution when structure breaks)
♦ This is INTENTIONAL DESIGN following Livermore's principle: exit when proven wrong
───────────────────────────────────────────
✗ Problem: PO orders firing out of sequence or skipping
Possible causes:
♦ Alert not set to "Once Per Bar Close" → Change alert frequency setting
♦ Multiple alerts running → Delete old/duplicate alerts for this indicator
♦ Conditions changed mid-bar → Indicator only fires at bar close (protective feature)
Solution:
♦ Keep only 1 active alert per indicator instance
♦ Always use "Once Per Bar Close" frequency
♦ Wait for full bar to close before signals can fire
───────────────────────────────────────────
✗ Problem: Bot not closing position on EXIT
Possible causes:
♦ Exit order setting wrong → Check bot settings
♦ Wrong JSON action → Should be "exit_long" or "exit_short"
♦ No position open → Can't close what doesn't exist
Solution:
♦ Verify: Bot Settings → Exit Orders → Volume per Order = "100 Position %"
♦ Check alert history for correct JSON payload
♦ If stuck: Manually close position in 3Commas, then fix settings
♦ Delete and recreate alert if JSON format is wrong
───────────────────────────────────────────
🔒 SECURITY BEST PRACTICES
♦ Never share bot UUID or Secret - Treat them like passwords
♦ Use restricted API keys - Limit to specific pairs, disable withdrawals
♦ Start small - Test with $10-50 first, scale up only after success
♦ Monitor first trades - Don't set-and-forget immediately
♦ Delete old alerts - If you change A/B/C points, delete old alert and create new one
───────────────────────────────────────────
📊 PREFER MANUAL TRADING?
Skip 3Commas entirely and use the indicator for planning only:
♦ Watch Trade Plan table for ✓✓✓✓✓ alignment
♦ Manually place limit orders at displayed prices
♦ Manually move stop loss as EXIT price updates
♦ Manually close when EXIT signal fires
Benefits: Full control, no API concerns, can override based on context
Drawbacks: Must watch chart constantly, emotions can interfere, may miss signals
───────────────────────────────────────────
✅ FINAL CHECKLIST BEFORE LIVE TRADING
✓ Both Signal Bots created (Long + Short)
✓ Entry Orders: Volume = "Send in webhook, quote"
✓ Exit Orders: Volume = "100 Position %"
✓ Take Profit and Stop Loss disabled in bots
✓ Bot UUIDs and Secret entered in indicator
✓ TradingView alert created with correct webhook
✓ Alert frequency = "Once Per Bar Close"
✓ Alert status shows "Active"
✓ Tested with small amounts successfully
✓ Trade Plan table shows ✅ (no validation errors)
✓ Understand your risk per trade
Once all checked: You're ready for automated pyramiding execution.
━━━━━━━━━━━━━━━━━━━━━━━━━━━━━━━━━━━━━━━━━━━
💡 KEY REMINDERS - BEFORE YOU TRADE
💬 "The speculator's chief enemies are always boring from within. It is inseparable from human nature to hope and to fear."
— Jesse Livermore
───────────────────────────────────────────
⚠️ COMMON MISTAKES (AVOID THESE)
Mapping Incomplete Waves
♦ Point C must be in the PAST (completed retrace, not currently forming)
♦ Don't map a wave that's still developing - wait for confirmation
♦ Minimum requirements: 5% impulse (A→B), 3% retrace (B→C)
Ignoring Validation Warnings
♦ Never create alerts when status shows ✗ (red) or ⚠️ (yellow)
♦ Fix all errors first: dates in order, budget = 100%, valid wave structure
♦ Common issues: dates in future, Point C above B (longs) or below B (shorts)
Premature Manual Entries
♦ Don't enter just because price touched the level
♦ Wait for ALL ✓✓✓✓✓ (or ✓✓✓✓✓✓) to align in Trade Plan table
♦ Patience pays - partial confluence = partial edge = higher risk of losing trades
Wrong Timeframe Selection
♦ Avoid: 15m, 5m, 1m (too much noise, false signals)
♦ Use: 1H, 4H, Daily (cleaner structure, better confluence)
♦ Lower timeframes require faster decisions and produce more whipsaws
Over-Risking Capital
♦ Trade budget ≠ Account size
♦ Never risk capital you can't afford to lose
♦ One bad trade should NOT destroy your account
───────────────────────────────────────────
✅ LIVERMORE PRINCIPLES IN ACTION
Confirmation > Prediction
♦ Don't predict where price will go
♦ Wait for price to INDICATE direction via pivots + volume + trend
♦ Test first (BO 20%), build only when confirmed (POs 80%)
💬 "A man must believe in himself and his judgment if he expects to make a living at this game."
Pyramid on Strength, Never Weakness
♦ Add only when: 3 closes + clean candles + volume + pivot breaks
♦ Never average down (DCA into losers)
♦ If BO wrong, take small loss fast - don't hope and add more
💬 "Never buy a stock because it has had a big decline from its previous high."
Respect Market Structure
♦ Pivots = where smart money previously acted (support/resistance)
♦ Breaking them = momentum overcoming barriers
♦ Entering before pivot break = entering into known rejection zones
Trend is Your Friend
♦ Never pyramid against the trend
♦ If trend shifts to Uncertain or reverses → no new entries
♦ Exit when trend proves you wrong (don't fight it)
💬 "I never argue with the tape. Getting sore at the market doesn't get you anywhere."
Discipline > Emotion
♦ Can't "almost" have all conditions met
♦ Either 100% aligned (all ✓) or you wait
♦ No exceptions, no "this time is different"
♦ Automation designed to help remove emotion - consider using 3Commas
💬 "It never was my thinking that made the big money for me. It always was my sitting."
───────────────────────────────────────────
🎯 FINAL THOUGHT
This indicator is a SYSTEMATIC FRAMEWORK, not a magic solution. It translates Livermore's century-old principles into actionable rules:
♦ Test small, build big
♦ Add to winners, cut losers fast
♦ Let structure guide exits
♦ Stay disciplined when emotions scream
The market will test your patience, discipline, and conviction. The indicator aims to reduce guesswork - but YOU still need to:
♦ Find valid wave structures
♦ Choose appropriate market conditions
♦ Size positions properly
♦ Accept losses as part of the game
💬 "The game of speculation is the most uniformly fascinating game in the world. But it is not a game for the stupid, the mentally lazy, the person of inferior emotional balance, or the get-rich-quick adventurer."
— Jesse Livermore

TradeChartist Range Bands ™TradeChartist Range Bands is an exceptionally well designed Entry/Exit indicator that plots fluid Range Bands and dynamic Support/Resistance levels on chart, along with trade entries by using both trend following and mean reversion principles.
===================================================================================================================
How does ™TradeChartist Range Bands work?
The Indicator plots Range Bands with Upper, Lower and Mean, calculated using trading models that use both Trend Following and Mean Reversion principles . It is the Range Bands that decide the trade Entries as the breakouts above upper band generates long entries and the breakouts below the lower band generates the short entries.
The Range Bands Type (Automatic, Aggressive or Normal) can be chosen from the settings. Default is Automatic and it uses Aggressive for non 24 hr markets and Normal for 24 hr markets like Cryptocurrencies.
The width of the Range Bands can be changed using the Range Multiplier from the settings. Default is 1.618 , minimum value is 0.618 and maximum value is 2.0.
The frequency of the Trade Signals depends on both Range Bands type and Range Multiplier. So it is worth spending some time to test the indicator based on these 2 factors on the asset traded, to maximise the profit potential by optimising the type and multiplier value.
In addition to the Range Bands, the indicator also plots Dynamic Support and Resistance bands that are more sensitive to price action and helps the user determine growing support/resistance which is indicated by coloured dots. These dots normally appear when the Support or Resistance stays at the same level for a few bars.
The expansion and contraction of the Support and Resistance bands also help in visualising the price volatility, and an extremely narrow squeeze of these levels within the Range Bands normally signals a lucrative market move. This is usually followed by a breakout from the bands and will be signalled by the Trade Entry plots (BUY and SELL).
The Dynamic Support and Resistance levels can be enabled or disabled from the settings. The fill between these dynamic levels helps the user to visualise the Bull and Bear strength/power. This fill can also be disabled from the settings if not required.
The indicator has a nice Fibonacci levels generator companion that helps spot near support and resistance levels using Fibonacci Retracement tool.
There are 3 types of Fib plots that can be chosen from the settings - Auto-Fibs, Fibs based on Lookback, Fibs based on Price Input .
The Auto-Fibs feature is used as default and it automatically plots fib retracement based on nearby significant high/low (highest from previous up and down trends). This is normally based on nearby trade entries too. Occasionally, during choppy markets/sideways movement, the range of these levels can be quite small and if close price exceeds the 4.618 fib level, one of the other Fib plot options can be used. Alternatively, Plot fibs from current high/low can also be used.
Fibs based on lookback can be used by choosing the number of candles or days lookback to help the indicator automatically find the high and low of the period to generate fib levels. Similarly, Fibs based on price input requires, user to manually enter the high and low price points for the indicator to generate fib levels based on user input.
The indicator has two colour schemes for the Dynamic Support/Resistance fill and bar colours. The coloured bars and the fill will help visualise the price trend. This can be changed or disabled from the settings.
The Fib levels can be disabled by unchecking lines and labels from the styles tab of indicator settings.
Long and Short entry Alerts can be created by using Once Per Bar Close .
The indicator does not repaint. Alerts may display potential repaint warning, but this is because the code uses bar index for fib labels. For confidence in the indicator, it can be tested using bar replay to make sure the real-time and bar replay trade entries and plots stay on the same bar/timestamp.
The different elements of the indicator are shown below in the chart.
===================================================================================================================
™TradeChartist Range Bands can also be connected to ™TradeChartist Plug and Trade to generate Targets, Stop Loss Plot etc. and other alerts can also be created. Use Range Bands Trend Identifier to connect as an Oscillatory Signal to Plug and Trade. Example chart shown below.
===================================================================================================================
Example charts:
1. ADA-USDT 4hr chart using Aggressive type and 1.618 Range Multiplier
2. ADA-USDT 4hr chart using Normal type and 1.618 Range Multiplier
3. XAU-USD 15m chart using Normal type and 1.618 Range Multiplier - Fibs based on 3 days lookback
4. DJI 4hr chart using Normal type and 2.0 Range Multiplier
5. GBP-USD 15m chart using Normal type and 1.618 Range Multiplier
6. LINK-USDT 1hr chart using Normal type and 1.236 Range Multiplier
===================================================================================================================
Best Practice: Test with different settings first using Paper Trades before trading with real money
===================================================================================================================
This is not a free to use indicator. Get in touch with me (PM me directly if you would like trial access to test the indicator)
Premium Scripts - Trial access and Information
Trial access offered on all Premium scripts.
PM me directly to request trial access to the scripts or for more information.
===================================================================================================================
