[blackcat] L3 Ehlers Spectrogram IndicatorLevel: 3
Background
John F. Ehlers introuced Dominant Cycle and Spectrogram Indicator in Mar, 2008.
Function
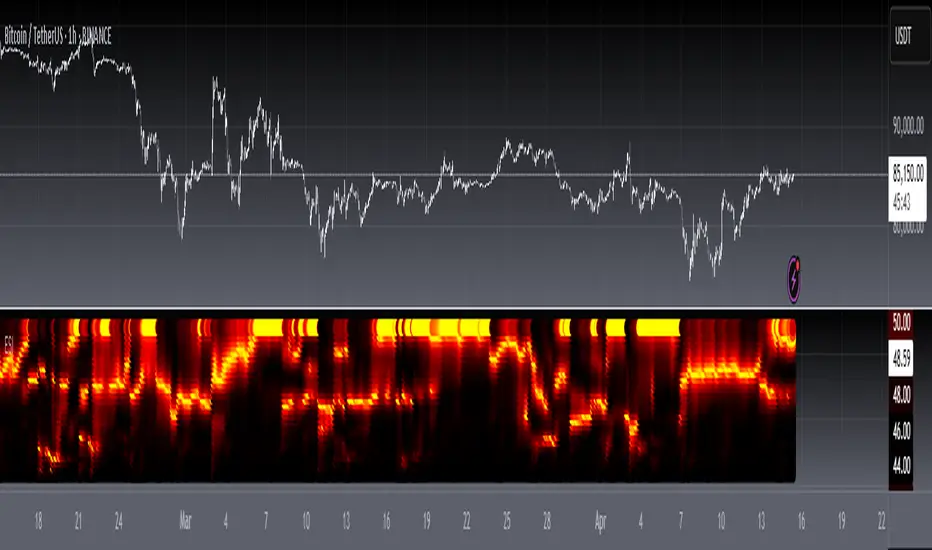
In "Measuring Cycle Periods" in Mar, 2008, John Ehlers presented a very interesting technique of measuring dominant market cycle periods by means of multiple bandpass filtering. By utilizing an approach similar to audio equalizers, the signal (here, the price series) is fed into a set of simple second-order infinite impulse response bandpass filters. Filters are tuned to 8,9,10,...,50 periods. The filter with the highest output represents the dominant cycle. This script implements a high-pass filter and a six-tap low-pass Fir filter on input, then 42 parallel Iir band-pass filters. Finally, it plots the Ehlers spectrogram as a heat map.
Ehlers Spectrogram indicates market power status:
With high market power, the spectrogram become fuzzy;
With low market power, the spectrogram become distinct.
It also discloses market dominant cycles and subcycles, which indicates the major rhythm. Regarding the rhythm of the market, Chinese and Western cultures have reached a consensus: Dr. Ehlers can find the main harmonic components of the market through DSP analysis via spectrum; Master Zen compares the market rhythm to Bach’s fugue from a philosophical perspective, where there is a rhythm of life.
Finally, please allow me to quote Master Zen’s statement on market rhythm:
"The market is cruel. For those who try to violate the market rhythm, the market is their death place; the market is beautiful, and the market is Bach’s fugue. There is a rhythm of life. Rhythm is always the rhythm of the market. A market participant without a sense of rhythm is always torturing. Put aside your greed and fear and listen to the rhythm of the market. In the weekend, let go of everything, but listen to the rhythm of nature, the rhythm of life, the rhythm of music, and then come back to listen to the rhythm of the market. Dancing with the market, your greed and fear are peeled off one by one, you will become very bright."
Key Signal
DomCyc--> Ehlers Dominant Cycle
Plot2~Plot60--> Ehlers Spectrum Heat Map
Pros and Cons
100% John F. Ehlers definition translation, even variable names are the same. This help readers who would like to use pine to read his book.
Remarks
The 73th script for Blackcat1402 John F. Ehlers Week publication.
Readme
In real life, I am a prolific inventor. I have successfully applied for more than 60 international and regional patents in the past 12 years. But in the past two years or so, I have tried to transfer my creativity to the development of trading strategies. Tradingview is the ideal platform for me. I am selecting and contributing some of the hundreds of scripts to publish in Tradingview community. Welcome everyone to interact with me to discuss these interesting pine scripts.
The scripts posted are categorized into 5 levels according to my efforts or manhours put into these works.
Level 1 : interesting script snippets or distinctive improvement from classic indicators or strategy. Level 1 scripts can usually appear in more complex indicators as a function module or element.
Level 2 : composite indicator/strategy. By selecting or combining several independent or dependent functions or sub indicators in proper way, the composite script exhibits a resonance phenomenon which can filter out noise or fake trading signal to enhance trading confidence level.
Level 3 : comprehensive indicator/strategy. They are simple trading systems based on my strategies. They are commonly containing several or all of entry signal, close signal, stop loss, take profit, re-entry, risk management, and position sizing techniques. Even some interesting fundamental and mass psychological aspects are incorporated.
Level 4 : script snippets or functions that do not disclose source code. Interesting element that can reveal market laws and work as raw material for indicators and strategies. If you find Level 1~2 scripts are helpful, Level 4 is a private version that took me far more efforts to develop.
Level 5 : indicator/strategy that do not disclose source code. private version of Level 3 script with my accumulated script processing skills or a large number of custom functions. I had a private function library built in past two years. Level 5 scripts use many of them to achieve private trading strategy.
"harmonic"に関するスクリプトを検索
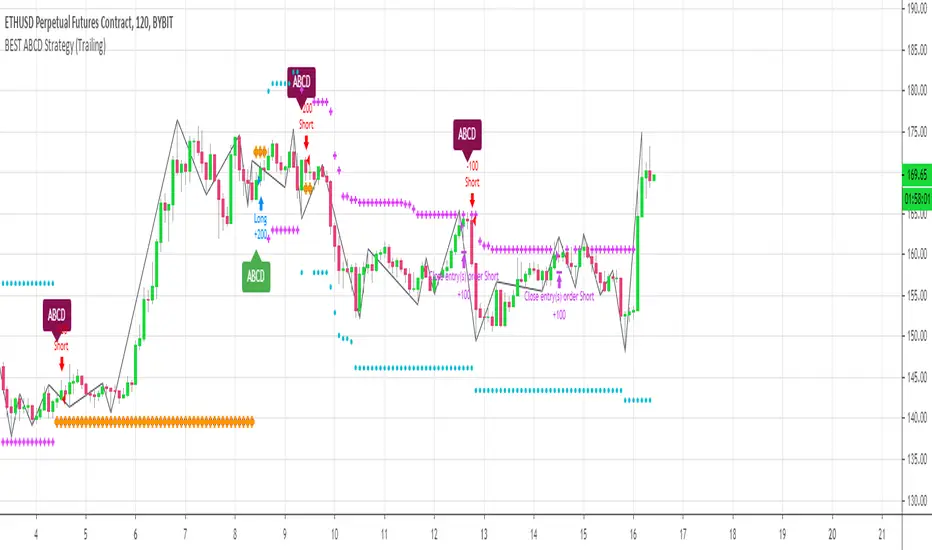
[Daveatt] BEST ABCD Pattern Strategy (Trailing SL + TP)Hello traders
This is the strategy version of my ABCD pattern. I added the Trailing Stop and Trailing Profit upon a follower request
I - Concept
I present to you, ladies and gentlemen, the first screener for harmonic patterns .
Starting with an ACBD pattern screener this time!!
I used the calculations from Ricardo Santo's script
In short, he's using fractals (regular or Bill Williams ) for the pattern calculations. A masterpiece !!!
II - Definitions
The ABCD pattern ( AB=CD ) is one of the classic chart patterns which is repeated over and over again.
The ABCD pattern shows perfect harmony between price and time.
The Williams Fractal is an indicator, developed by Bill Williams , that aims to detect reversal points (highs and lows) and marks them with arrows.
Up fractals and down fractals have specific shapes. The Williams Fractal indicator helps users determine in which direction price will develop
💎Strategy filters💎
I included some cool backtest filters:
- Trailing stop with trigger concept coming from this Trailing Stop Strategy
- Trailing profit with trigger coming from this Trailing Profit Strategy
Last words
It works for all asset classes (Forex, crypto, indices, etc...) and does not repaint
All the BEST
Dave
BEST ABCD Pattern StrategyHello traders
This is the strategy version of this script
I - Concept
I present to you, ladies and gentlemen, the first screener for harmonic patterns.
Starting with an ACBD pattern screener this time!!
I used the calculations from Ricardo Santo's script
In short, he's using fractals (regular or Bill Williams ) for the pattern calculations. A masterpiece !!!
II - Definitions
The ABCD pattern ( AB=CD ) is one of the classic chart patterns which is repeated over and over again.
The ABCD pattern shows perfect harmony between price and time.
The Williams Fractal is an indicator, developed by Bill Williams, that aims to detect reversal points (highs and lows) and marks them with arrows.
Up fractals and down fractals have specific shapes. The Williams Fractal indicator helps users determine in which direction price will develop
💎Strategy filters💎
I included some cool backtest filters:
- flexible take profit in USD value (plotted in blue)
- flexible stop loss in USD value (plotted in red)
The take profit and stop loss should work with Forex/FX pairs as well
All the BEST
Dave

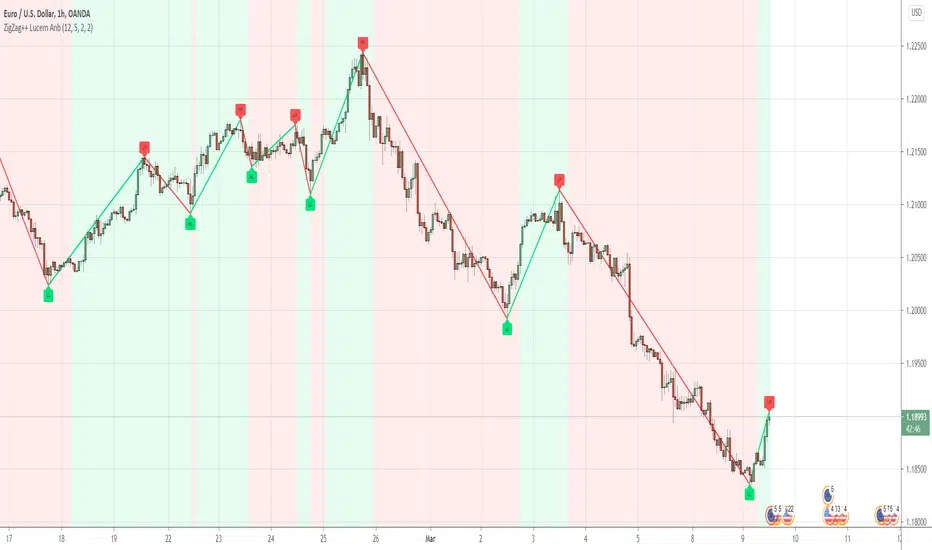
ZigZag++Hey Awesome Traders
I noticed people were so happy with my ZigZag lucemanb script and so I made one that is more user-friendly and customizable
Please note the original one is dedicated to developers, The code is very minimal for fast understanding when anyone wants to use it in their development
In this script, I have included several features like multi-timeframe and alerts. Do take a look and enjoy
If you are using the indicator, please comment down the link to your script
If you would love to support my work through donations, Am so happy to receive them
ADDITIONAL FEATURES
Do u have an idea or a feature that you want to be added,
You can ping me or ask about it here, I can always update
Check out some of the best works i have done with this script
1. Angle trading
2. Harmonic Patterns
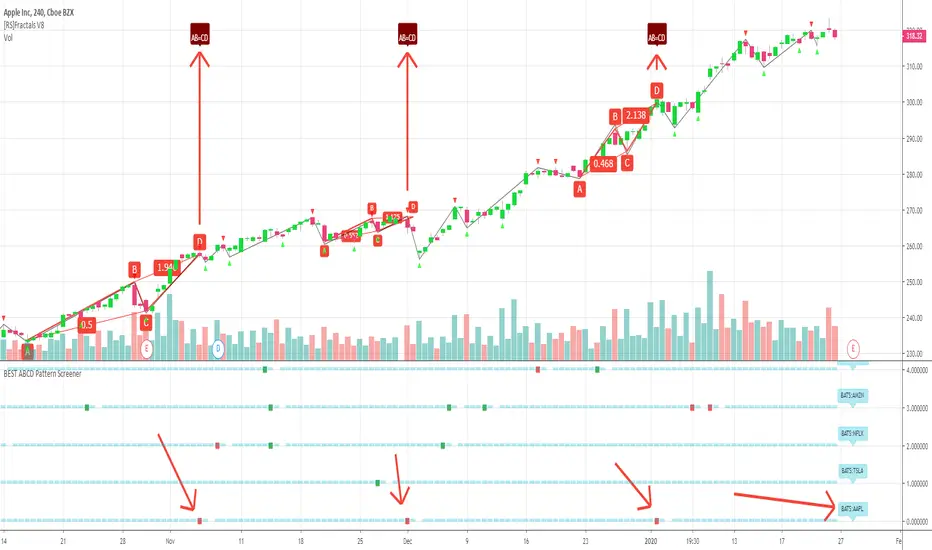
BEST ABCD Pattern ScreenerHello ladies and gentlemen traders
Continuing deeper and stronger with the screeners' educational series one more time.
This one is heavy crazy mega cool (pardon my french).
I - Concept
I present to you, ladies and gentlemen, the first screener for harmonic patterns.
Starting with an ACBD pattern screener this time!!
I used the calculations from Ricardo Santo's script
In short, he's using fractals (regular or Bill Williams ) for the pattern calculations. A masterpiece !!!
The screener will show in 1 consolidated chart the ABCD patterns for 5 selected assets. Could be stocks, forex, crypto, whatever you feel like making money with
II - Definitions
The ABCD pattern ( AB=CD ) is one of the classic chart patterns which is repeated over and over again.
The ABCD pattern shows perfect harmony between price and time.
More info here
The Williams Fractal is an indicator, developed by Bill Williams, that aims to detect reversal points (highs and lows) and marks them with arrows.
Up fractals and down fractals have specific shapes. The Williams Fractal indicator helps users determine in which direction price will develop
Source: www.tradingview.com
III - How did I set the screener
The visual signals are as follow:
- square: whenever there is an ABCD pattern detected
Then the colors are:
- green when a bullish pattern is detected
- red when a bearish pattern is detected
🔸 The script screenshot shows two red squares matching two ABCD bearish pattern from the above panel. As the chart is showing APPL, I highlighted where the screener mentioned the fruit stock ( APPLE, pun, bad joke, Dave out...)
🔸 I tried to make it as clear as I could with red arrows
Once again, we pushed together the limits of pine script beyond of what we thought was possible, beyond the realm of this world, reaching finally the dreamt pine script heaven (am I going too far? feel free to tell me)
Best regards,
Dave

Multistep AutocorrelationAutocorrelation, also known as serial correlation, is the correlation of a signal with a delayed copy of itself as a function of delay. Informally, it is the similarity between observations as a function of the time lag between them. The analysis of autocorrelation is a mathematical tool for finding repeating patterns, such as the presence of a periodic signal obscured by noise, or identifying the missing fundamental frequency in a signal implied by its harmonic frequencies. It is often used in signal processing for analyzing functions or series of values, such as time domain signals.
This multistep autocorrelation function calculates the correlation of roc (rate of change) between an asset at t and t-1 as well as the correlation of the same asset at t and t-4. The output is an average of the two.
If both outputs show a positive correlation, the color will be green.
If only one shows a positive correlation, the color will be yellow.
If neither show a positive correlation, the color will be red.
This indicator can be useful as a filter for strategy entry logic (only enter on strong correlation and the strategy entry condition), or as standalone confirmation of strength in a specific direction. It can also be used to filter chop.
Another potential usecase would be as a variable in regression applications.
Enjoy!

MS MONEY CCI SQUEEZEAbout
I have used this indicator to find many lucrative opportunities. This indicator takes the moving average of CCI in custom, volatility-specific conditions. CCI measures "overbought" in the red-shaded region and "Oversold" in the green-shaded region. The shaded regions do not constitute a buy/sell signal alone, the MS CCI Squeeze is best used when market conditions agree and is best used when the user has fundamental reasoning for "reversal-like" situations to align. The MS CCI Squeeze will soon have a synergistic partner called "MS RSI Squeeze" indicator that will look similar to help better measure volatility and strength trend.
About the Commodity Channel Index (CCI)
The commodity channel index (CCI) is an oscillator originally introduced by Donald Lambert in 1980. Since its introduction, the indicator has grown in popularity and is now a very common tool for traders in identifying cyclical trends not only in commodities, but also equities (stocks) and currency trading.
How to set an Alert
If the user wants to set an alert , click on one of the support/ resistance lines (black-dashed) near the zero mark. Clicking on the horizontal line above or below the zero line will populate a yellow arrow which will allow you to set alerts when wanted.
Please Read For Better Efficiency
When using this indicator, keep an eye out for harmonic patterns, both bullish and bearish head and shoulders patterns for "HIDDEN" breakout opportunities.
Please like, follow and share and I will continue building better indicators.


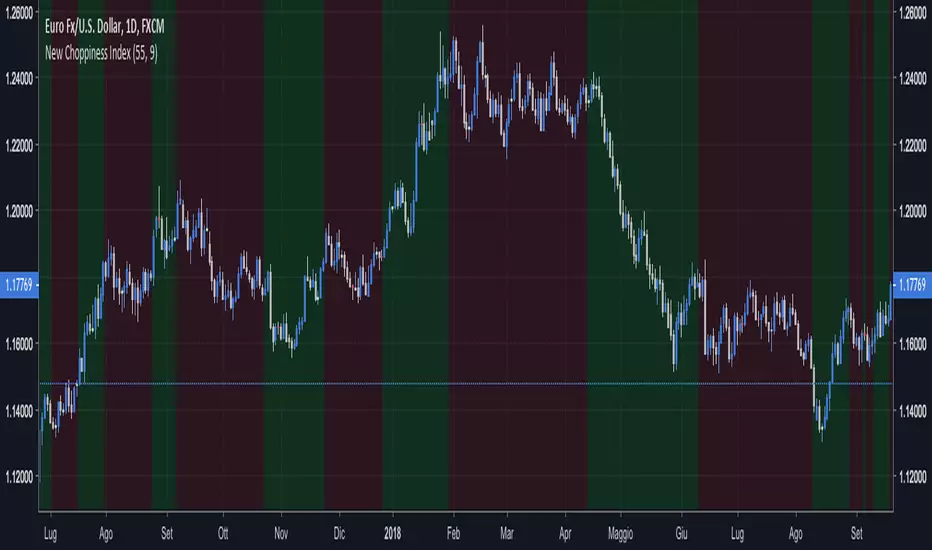
New Choppiness IndexThis script tries to identify trending regions and ranging choppy regions.
Green areas are trends; Red areas are consolidation areas.
If you are a trend follower trader you should focus on green areas;
If you are a harmonic pattern trader you should focus on red areas.
I did not play with the parameters extensively, but as a rule of thumb higher parameters
helps on long term trades.
This tool seems to work better for major currencies pairs, presumably due to the
high exchanged volumes that reduces weird fluctuations.
Good set of parameters are:
(55, 9) the default ones, doing impressively well in EURUSD Daily;
(8, 5) doing well in GBPCHF Daily, short trades to be set at lower timeframes.
Happy trading,
vitelot/yanez/Vts
January 2019
Hitting the like button is a free sign of gratitude.
Expansion Bar IndicatorThis indicator shows bars with large bodies (large expansion bars) as a red bar.
They are important in the cd leg of a harmonic pattern, because they signal that extra confirmation is needed and that a failure of the PRZ is more likely.
The definition of this large expansion bar is a bar that has a body that is at least twice as big as the ATR with period 55.
This rule and indicator were originally created by Alexander Nikitin for MT4.

GC Magic Overlay V2This script is based on Guppy method (www.guppytraders.com
) , it was introduced to me by fellow trader @nmike. I am using this script in conjunction to Clones ,Harmonic and other tools.
Script Function:
a. Script plots the fast and slow Exponential moving averages as ribbons.
EMA's used
EMA (close): 25,30,35,40,45,50,55 (Green)
EMA (close): 89,99,109,119,129,139,149 (Red)
b. It draws the Circle dots in Pink for Sell and Black for Buy.
Script Parameters:
a. EMA : 2 emas for cross
b. Signal Exponential moving average
c. which time frame to Plot the above Signal Exponential
d. Show Guppy Slow - Red - Toggle to show red emas on chart
e. Show Guppy Fast - Green- Toggle to show green emas on chart
How to Trade:
a. Wait for the Pink/Black Dot to appear on Chart
b. Do not take trade immediately after the dot appears. Wait for the price to retrace back and touch the ema ribbons.This will keep you away from fake breakouts.
c. Rentries : in examples below
Examples:


Photon Price Action Scanner [JOAT]Photon Price Action Scanner - Multi-Pattern Recognition with Adaptive Filtering
Introduction and Purpose
Photon Price Action Scanner is an open-source overlay indicator that automates the detection of 15+ candlestick patterns while filtering them through multiple confirmation layers. The core problem this indicator solves is pattern noise: raw candlestick pattern detection produces too many signals, most of which fail because they lack context. This indicator addresses that by combining pattern recognition with trend alignment, volume-weighted strength scoring, velocity confirmation, and an adaptive neural bias filter.
The combination of these components is not arbitrary. Each filter addresses a specific weakness in standalone pattern detection:
Trend alignment ensures patterns appear in favorable market structure
Volume-weighted strength filters out weak patterns with low conviction
Velocity confirmation identifies momentum behind the pattern
Neural bias filter adapts to recent price behavior to avoid counter-trend signals
What Makes This Indicator Original
While candlestick pattern scanners exist, this indicator's originality comes from:
1. Multi-Layer Filtering System - Patterns must pass through trend, strength, velocity, and neural bias filters before generating signals. This dramatically reduces false positives compared to simple pattern detection.
2. Adaptive Neural Bias Filter - A custom momentum-adjusted EMA that learns from recent price action using a configurable learning rate. This is not a standard moving average but an adaptive filter that accelerates during trends and smooths during consolidation.
3. Pattern Strength Scoring - Each pattern receives a strength score based on volume ratio and body size, allowing traders to focus on high-conviction setups rather than every pattern occurrence.
4. Smart Cooldown System - Prevents signal overlap by enforcing minimum bar spacing between pattern labels, keeping charts clean even when "Show All Patterns" is enabled.
How the Components Work Together
Step 1: Pattern Detection
The indicator scans for 15 candlestick patterns using precise mathematical definitions:
// Example: Bullish Engulfing requires the current bullish candle to completely
// engulf the previous bearish candle with a larger body
isBullishEngulfing() =>
bool pattern = close < open and close > open and
open <= close and close >= open and
close - open > open - close
pattern
// Example: Three White Soldiers requires three consecutive bullish candles
// with each opening within the previous body and closing higher
isThreeWhiteSoldiers() =>
bool pattern = close > open and close > open and close > open and
close < close and close < close and
open > open and open < close and
open > open and open < close
pattern
Step 2: Strength Calculation
Each detected pattern receives a strength score combining volume and body size:
float volRatio = avgVolume > 0 ? volume / avgVolume : 1.0
float bodySize = math.abs(close - open) / close
float baseStrength = (volRatio + bodySize * 100) / 2
This ensures patterns with above-average volume and large bodies score higher than weak patterns on low volume.
Step 3: Trend Alignment
Patterns are checked against the trend direction using an EMA:
float trendEMA = ta.ema(close, i_trendPeriod)
int trendDir = close > trendEMA ? 1 : close < trendEMA ? -1 : 0
Bullish patterns in uptrends and bearish patterns in downtrends receive priority.
Step 4: Neural Bias Filter
The adaptive filter uses a momentum-adjusted EMA that responds to price changes:
neuralEMA(series float src, simple int period, simple float lr) =>
var float neuralValue = na
var float momentum = 0.0
if na(neuralValue)
neuralValue := src
float error = src - neuralValue
float adjustment = error * lr
momentum := momentum * 0.9 + adjustment * 0.1
neuralValue := neuralValue + adjustment + momentum
neuralValue
The learning rate (lr) controls how quickly the filter adapts. Higher values make it more responsive; lower values make it smoother.
Step 5: Velocity Confirmation
Price velocity (rate of change) must exceed the average velocity for strong signals:
float velocity = ta.roc(close, i_trendPeriod)
float avgVelocity = ta.sma(velocity, i_trendPeriod)
bool velocityBull = velocity > avgVelocity * 1.5
Step 6: Signal Classification
Signals are classified based on how many filters they pass:
Strong Pattern : Pattern + strength threshold + trend alignment + neural bias + velocity
Ultra Pattern : Strong pattern + gap in same direction + velocity confirmation
Watch Pattern : Pattern detected but not all filters passed
Detected Patterns
Classic Reversal Patterns:
Bullish/Bearish Engulfing - Complete body engulfment with larger body
Hammer - Long lower wick (2x body), small upper wick, bullish context
Shooting Star - Long upper wick (2x body), small lower wick, bearish context
Morning Star - Three-bar bullish reversal with small middle body
Evening Star - Three-bar bearish reversal with small middle body
Piercing Line - Bullish candle closing above midpoint of previous bearish candle
Dark Cloud Cover - Bearish candle closing below midpoint of previous bullish candle
Bullish/Bearish Harami - Small body contained within previous larger body
Doji - Body less than 10% of total range (indecision)
Advanced Patterns (Optional):
Three White Soldiers - Three consecutive bullish candles with rising closes
Three Black Crows - Three consecutive bearish candles with falling closes
Tweezer Top - Equal highs with reversal candle structure
Tweezer Bottom - Equal lows with reversal candle structure
Island Reversal - Gap isolation creating reversal structure
Dashboard Information
The dashboard displays real-time analysis:
Pattern - Current detected pattern name or "SCANNING..."
Bull/Bear Strength - Volume-weighted strength scores
Trend - UPTREND, DOWNTREND, or SIDEWAYS based on EMA
RSI - 14-period RSI for momentum context
Momentum - 10-period momentum reading
Volatility - ATR as percentage of price
Neural Bias - BULLISH, BEARISH, or NEUTRAL from adaptive filter
Action - ULTRA BUY/SELL, BUY/SELL, WATCH BUY/SELL, or WAIT
Visual Elements
Pattern Labels - Abbreviated codes (BE=Engulfing, H=Hammer, MS=Morning Star, etc.)
Neural Bias Line - Adaptive trend line showing filter direction
Gap Boxes - Cyan boxes highlighting price gaps
Action Zones - Dashed boxes around strong pattern areas
Velocity Markers - Small circles when velocity confirms direction
Ultra Signals - Large labels for highest conviction setups
How to Use This Indicator
For Reversal Trading:
1. Wait for a pattern to appear at a key support/resistance level
2. Check that the Action shows "BUY" or "SELL" (not just "WATCH")
3. Confirm the Neural Bias aligns with your trade direction
4. Use the strength score to gauge conviction (higher is better)
For Trend Continuation:
1. Identify the trend using the Trend row in the dashboard
2. Look for patterns that align with the trend (bullish patterns in uptrends)
3. Ultra signals indicate the strongest continuation setups
For Filtering Noise:
1. Keep "Show All Patterns" disabled to see only filtered signals
2. Increase "Pattern Strength Filter" to see fewer, higher-quality patterns
3. Enable "Velocity Confirmation" to require momentum behind patterns
Input Parameters
Scan Sensitivity (1.0) - Overall detection sensitivity multiplier
Pattern Strength Filter (3) - Minimum strength score for strong signals
Trend Period (20) - EMA period for trend determination
Show All Patterns (false) - Display all patterns regardless of filters
Advanced Patterns (true) - Enable soldiers/crows/tweezer detection
Gap Analysis (true) - Enable gap detection and boxes
Velocity Confirmation (true) - Require velocity for strong signals
Neural Bias Filter (true) - Enable adaptive trend filter
Neural Period (50) - Lookback for neural bias calculation
Neural Learning Rate (0.12) - Adaptation speed (0.01-0.5)
Timeframe Recommendations
1H-4H: Best balance of signal frequency and reliability
Daily: Fewer but more significant patterns
15m-30m: More signals, requires tighter filtering (increase strength threshold)
Limitations
Pattern detection is mechanical and does not consider fundamental context
Neural bias filter may lag during rapid trend reversals
Gap detection requires clean price data without after-hours gaps
Strength scoring favors high-volume patterns, which may miss valid low-volume setups
- Made with passion by officialjackofalltrades

Cosmic Volume Analyzer [JOAT]
Cosmic Volume Analyzer - Astrophysics Edition
Overview
Cosmic Volume Analyzer is an open-source oscillator indicator that applies astrophysics-inspired concepts to volume analysis. It classifies volume into buy/sell categories, calculates volume flow, detects accumulation/distribution phases, identifies climax volume events, and uses gravitational and stellar mass analogies to visualize volume dynamics.
What This Indicator Does
The indicator calculates and displays:
Volume Classification - Categorizes each bar as CLIMAX_BUY, CLIMAX_SELL, HIGH_BUY, HIGH_SELL, NORMAL_BUY, or NORMAL_SELL
Volume Flow - Percentage showing buy vs sell pressure over a lookback period
Buy/Sell Volume - Separated volume based on candle direction
Accumulation/Distribution - Phase detection using Money Flow Multiplier
Volume Oscillator - Fast vs slow volume EMA comparison
Gravitational Pull - Volume-weighted price attraction metric
Stellar Mass Index - Volume ratio combined with price momentum
Black Hole Detection - Identifies extremely low volume periods (liquidity voids)
Supernova Events - Detects extreme volume with extreme price movement
Orbital Cycles - Sine-wave based cyclical visualization
How It Works
Volume classification uses volume ratio and candle direction:
classifyVolume(series float vol, series float close, series float open) =>
float avgVol = ta.sma(vol, 20)
float volRatio = avgVol > 0 ? vol / avgVol : 1.0
if volRatio > 1.5
if close > open
classification := "CLIMAX_BUY"
else
classification := "CLIMAX_SELL"
else if volRatio > 1.2
// HIGH_BUY or HIGH_SELL
else
// NORMAL_BUY or NORMAL_SELL
Volume flow separates buy and sell volume over a period:
calculateVolumeFlow(series float vol, series float close, simple int period) =>
float currentBuyVol = close > open ? vol : 0.0
float currentSellVol = close < open ? vol : 0.0
// Accumulate in buffers
float flow = (buyVolume - sellVolume) / totalVol * 100
Accumulation/Distribution uses the Money Flow Multiplier:
float mfm = ((close - low) - (high - close)) / (high - low)
float mfv = mfm * vol
float adLine = ta.cum(mfv)
if adLine > adEMA and ta.rising(adLine, 3)
phase := "ACCUMULATION"
else if adLine < adEMA and ta.falling(adLine, 3)
phase := "DISTRIBUTION"
Gravitational pull uses volume-weighted price distance:
gravitationalPull(series float vol, series float price, simple int period) =>
float massCenter = ta.vwma(price, period)
float distance = math.abs(price - massCenter)
float mass = vol / ta.sma(vol, period)
float gravity = distance > 0 ? mass / (distance * distance) : 0.0
Signal Generation
Signals are generated based on volume conditions:
Buy Climax: Volume exceeds 2 standard deviations above average on bullish candle
Sell Climax: Volume exceeds 2 standard deviations above average on bearish candle
Strong Buy Flow: Volume flow exceeds positive threshold (default 45%)
Strong Sell Flow: Volume flow exceeds negative threshold (default -45%)
Supernova: Volume 3x average AND price change 3x average
Black Hole: Volume 2 standard deviations below average
Dashboard Panel (Top-Right)
Volume Class - Current volume classification
Volume Flow - Buy/sell flow percentage
Buy Volume - Accumulated buy volume
Sell Volume - Accumulated sell volume
A/D Phase - ACCUMULATION/DISTRIBUTION/NEUTRAL
Volume Strength - Normalized volume strength
Gravity Pull - Current gravitational metric
Stellar Mass - Current stellar mass index
Cosmic Field - Combined cosmic field strength
Black Hole - Detection status and void strength
Signal - Current actionable status
Visual Elements
Volume Ratio Columns - Colored bars showing normalized volume
Volume Flow Line - Main oscillator showing flow direction
Flow EMA - Smoothed flow for trend reference
Volume Oscillator - Area plot showing fast/slow comparison
Gravity Field - Area plot showing gravitational pull
Orbital Cycle - Circle plots showing cyclical pattern
Stellar Mass Line - Line showing mass index
Climax Markers - Fire emoji for buy climax, snowflake for sell climax
Supernova Markers - Diamond shapes for extreme events
Black Hole Markers - X-cross for liquidity voids
A/D Phase Background - Subtle background color based on phase
Input Parameters
Volume Period (default: 20) - Period for volume calculations
Distribution Levels (default: 5) - Granularity of distribution analysis
Flow Threshold (default: 1.5) - Multiplier for flow significance
Accumulation Period (default: 14) - Period for A/D calculation
Gravitational Analysis (default: true) - Enable gravity metrics
Black Hole Detection (default: true) - Enable void detection
Stellar Mass Calculation (default: true) - Enable mass index
Orbital Cycles (default: true) - Enable cyclical visualization
Supernova Detection (default: true) - Enable extreme event detection
Suggested Use Cases
Identify accumulation phases for potential long entries
Watch for distribution phases as potential exit signals
Use climax volume as potential exhaustion indicators
Monitor volume flow for directional bias
Avoid trading during black hole (low liquidity) periods
Watch for supernova events as potential trend acceleration
Timeframe Recommendations
Best on 15m to Daily charts. Volume analysis requires sufficient trading activity for meaningful readings.
Limitations
Volume data quality varies by exchange and instrument
Buy/sell separation is based on candle direction, not actual order flow
Astrophysics concepts are analogies, not literal physics
A/D phase detection may lag during rapid transitions
Open-Source and Disclaimer
This script is published as open-source under the Mozilla Public License 2.0 for educational purposes. It does not constitute financial advice. Past performance does not guarantee future results. Always use proper risk management.
- Made with passion by officialjackofalltrades

Auto Price-to-Bar ScaleIt adjusts the chart’s scaling according to Mitotic scaling rules, as defined in the book Geometrical Analysis by Anand Kene (available on Amazon). This method of scaling allows the application of various angles and Gann boxes, resulting in more precise target levels.

Pivot Edge ProOverview
Smart Pivot Analytics is a highly accurate technical analysis tool designed to identify and validate significant price levels. Unlike standard pivot indicators that only mark recent highs, this tool backtests each identified pivot against thousands of historical candlesticks to calculate its real-world “success rate.”
Key Features
Historical Backtesting: The indicator scans up to 4,900 historical columns to find every instance where price interacted with a specific pivot level.
Strength Score (%): Each level is assigned a percentage score based on its reversal rate. It calculates how many times the price has successfully reached and rejected the level, providing a statistical “hit rate.”
Dynamic Hit Counter: Displays the exact number of times a level has been tested (hit), helping traders distinguish between new levels and established “old” levels.
Smart Filtering: To keep the chart clean, the indicator automatically filters out weak levels and prevents “clutter” by merging levels that are too close together.
Infinite Left Projection: Lines extend left to infinity, allowing traders to see the historical significance of a level across the entire price history at a glance.
How to Trade with It
Red Levels (High Power > 75%): These are “Top Reaction Zones”. Expect a strong price rejection or significant breakout when these levels are tested.
Orange Levels (Medium Power): Suitable for profit targets or as secondary confirmation for entering a trade.
Encounter: Use these levels in conjunction with your existing strategy. When a high power pivot aligns with your entry signal, the probability of a successful trade increases significantly.
Technical Parameters
Lookback Period: Defines how far back in history the script calculates power.
Touch Radius: The "sensitivity" of the level (how close the price has to get to be considered a "hit").
Minimum Strength: A filter to show only the most reliable levels.

Volume-Weighted Fibonacci PivotThis indicator automatically plots dynamic Fibonacci retracement and extension levels based on a volume-weighted pivot point within a user-defined lookback period or date range. It intelligently calculates a central "pivot" price biased toward high-volume bars, then draws symmetric levels both upward (extensions) and downward (retracements) for balanced confluence analysis.
How It Works (Technical Methodology)
Lookback Period Determination
Multiple filter modes control the data range used for calculations:
"Last X Bars": Fixed number of recent bars (default 400, max 4999).
"Manual Date": User-specified start date.
"Interactive (Chart)": Confirmed start date via input.
"None": Full available history (falls back to max bars).
Optionally, when using "Last X Bars", calculations can pull data from a higher/lower user-selected timeframe via request.security() for multi-timeframe alignment.
A dotted vertical line marks the start point in date-based modes.
Range and Pivot Calculation
Within the selected period:
Highest high and lowest low define the full price range.
Average volume is computed across the period.
Volume-Weighted Pivot: Average close price only from bars where volume > average volume (fallback to simple midpoint if no high-volume bars).
This creates a "smart" central pivot that leans toward areas of greater participation, often aligning with institutional activity.
Fibonacci Level Generation
User-configurable ratios (default: 0.236, 0.382, 0.5, 0.618, 0.786, 1.0, 1.272, 1.414, 1.618).
Levels are calculated symmetrically around the volume-weighted pivot:
Upward: Pivot + (Range × Ratio × Correction Factor) – teal/cyan shades.
Downward: Pivot - (Range × Ratio × Correction Factor) – red shades.
Correction Factor (default 0.5): Scales level spacing for tighter/wider grids without altering ratios.
Only the user-defined number of active lines (default 9) are drawn.
Visual Construction
Central Pivot Line: Thick yellow horizontal line with label showing exact price.
Up/Down Levels: Dashed lines extended into the future, labeled with ratio direction ("Up" or "Dn").
All objects redraw only on the last bar for performance, clearing previous drawings.
Multi-Timeframe Option
When enabled with "Last X Bars":
Pulls high/low/volume data from specified timeframe.
Aligns the pivot and levels to higher-timeframe structure while displaying on current chart – ideal for intraday traders seeking HTF confluence.
How to Use
This tool provides clean, volume-aware Fibonacci grids for identifying potential support/resistance, reversal zones, and targets.
Volume-Weighted Pivot: Often acts as a strong mean reversion level or fair value area.
Upward Levels (Teal): Potential resistance/extensions in bullish moves; watch for reactions on retests.
Downward Levels (Red): Potential support/retracements in bearish moves.
Confluence: High probability when price reacts at levels aligning with other tools (order blocks, pivots, volume profile).
Correction Factor: Lower values (<0.5) for tighter grids in ranging markets; higher (>0.5) for trending markets.
Multi-Timeframe Mode: Use on lower charts (e.g., 15m) with HTF input (e.g., 4H or Daily) to project major structure levels.
Common Setups:
Pullbacks to 0.618–0.786 zones for continuation entries.
Breaks beyond 1.0–1.618 for extension targets.
Reactions near pivot line for mean reversion trades.
Adjust ratios and active line count to match your preferred Fibonacci style (classic retracement vs. extensions).
Disclaimer
This indicator is a technical analysis tool and should be used in conjunction with other forms of analysis. Past performance does not guarantee future results. Always use proper risk management.


Mean-Reversion with CooldownThis strategy requires no indicators or fundamental analysis. It is designed for longer-term positions and works especially well on unleveraged instruments with strong long-term upward trends, such as precious metals. Feel free to experiment with different timeframes — I’ve found that 1-hour charts work particularly well for cryptocurrencies.
The idea is to filter out ongoing bear phases as effectively as possible and capitalize on long-term bull runs.
The script implements an idea that came to me in a state of complete sleep deprivation: open a random long position with a fixed take-profit (TP) and a tight stop-loss (SL).
If the TP is hit — great, we simply try again.
If the SL is triggered — too bad, we pause for a while and then try again.
## Cooldown (Waiting) Mechanism
The waiting mechanism is simple: the more consecutive SL hits we get, the longer we wait before opening the next trade. The waiting time is measured in closed candles, and thus depends on the timeframe you are using.
## Two cooldown calculation modes are currently supported:
### 1. FIBONACCI
The cooldown follows the Fibonacci sequence, based on the number of consecutive losses:
1st loss → wait 1 bar
2nd loss → wait 1 bar
3rd loss → wait 2 or 3 bars (depending on definition)
4th loss → wait 3 or 5 bars
etc.
### 2. POWER OF TWO
The cooldown increases exponentially:
1st loss → wait 2 bars
2nd loss → wait 4 bars
3rd loss → wait 8 bars
4th loss → wait 16 bars
and so on, using the formula 2ⁿ.
## Configurable Parameters
### Cooldown Pause Calculation
The settings allow you to define the SL and TP as percentages of the position value.
The "Cooldown Pause Calculation" option determines how the next cooldown duration is computed after a losing trade.
The system keeps track of how many consecutive losses have occurred since the last profitable trade. That counter is then used to compute how many bars we must wait before opening the next position.
### Maximum Cooldown
The "Max Cooldown Candles" setting defines the maximum number of bars we are allowed to wait before placing a new trade. This prevents the strategy from “locking itself out” for too long and mitigates the fear of missing out (FOMO).
Once the cooldown duration reaches this maximum, the system essentially wraps around and starts the progression again. In the script, this is handled using a simple modulo operation based on the chosen maximum.

Smart Money Concepts [XoRonX]# Smart Money Concepts (SMC) - Advanced Trading Indicator
## 📊 Deskripsi
**Smart Money Concepts ** adalah indicator trading komprehensif yang menggabungkan konsep Smart Money Trading dengan berbagai alat teknikal analisis modern. Indicator ini dirancang untuk membantu trader mengidentifikasi pergerakan institusional (smart money), struktur pasar, zona supply/demand, dan berbagai sinyal trading penting.
Indicator ini mengintegrasikan multiple timeframe analysis, order blocks detection, fair value gaps, fibonacci retracement, volume profile, RSI multi-timeframe, dan moving averages dalam satu platform yang powerful dan mudah digunakan.
---
## 🎯 Fitur Utama
### 1. **Smart Money Structure**
- **Internal Structure** - Struktur pasar jangka pendek untuk entry presisi
- **Swing Structure** - Struktur pasar jangka panjang untuk trend analysis
- **BOS (Break of Structure)** - Konfirmasi kelanjutan trend
- **CHoCH (Change of Character)** - Deteksi potensi reversal
### 2. **Order Blocks**
- **Internal Order Blocks** - Zona demand/supply jangka pendek
- **Swing Order Blocks** - Zona demand/supply jangka panjang
- Filter otomatis berdasarkan volatilitas (ATR/Range)
- Mitigation tracking (High/Low atau Close)
- Customizable display (jumlah order blocks yang ditampilkan)
### 3. **Equal Highs & Equal Lows (EQH/EQL)**
- Deteksi otomatis equal highs/lows
- Indikasi liquidity zones
- Threshold adjustment untuk sensitivitas
- Visual lines dan labels
### 4. **Fair Value Gaps (FVG)**
- Multi-timeframe FVG detection
- Auto threshold filtering
- Bullish & Bearish FVG boxes
- Extension control
- Color customization
### 5. **Premium & Discount Zones**
- Premium Zone (75-100% dari range)
- Equilibrium Zone (47.5-52.5% dari range)
- Discount Zone (0-25% dari range)
- Auto-update berdasarkan swing high/low
### 6. **Fibonacci Retracement**
- **Equilibrium to Discount** - Fib dari EQ ke discount zone
- **Equilibrium to Premium** - Fib dari EQ ke premium zone
- **Discount to Premium** - Fib full range
- Reverse option
- Show/hide lines
- Custom colors
### 7. **Volume Profile (VRVP)**
- Visible Range Volume Profile
- Point of Control (POC)
- Value Area (70% volume)
- Auto-adjust rows
- Placement options (Left/Right)
- Width customization
### 8. **RSI Multi-Timeframe**
- Monitor 3 timeframes sekaligus
- Overbought/Oversold signals
- Visual table display
- Color-coded signals (Red OB, Green OS)
- Customizable position & size
### 9. **Moving Averages**
- 3 Moving Average lines
- Pilihan tipe: EMA, SMA, WMA
- Automatic/Manual period mode
- Individual color & width settings
- Cross alerts (MA vs MA, Price vs MA)
### 10. **Multi-Timeframe Levels**
- Support up to 5 different timeframes
- Previous high/low levels
- Custom line styles
- Color customization
### 11. **Candle Color**
- Color candles berdasarkan trend
- Bullish = Green, Bearish = Red
- Optional toggle
---
## 🛠️ Cara Penggunaan
### **A. Setup Awal**
1. **Tambahkan Indicator ke Chart**
- Buka TradingView
- Klik "Indicators" → "My Scripts" atau paste code
- Pilih "Smart Money Concepts "
2. **Pilih Mode Display**
- **Historical**: Tampilkan semua struktur (untuk backtesting)
- **Present**: Hanya tampilkan struktur terbaru (clean chart)
3. **Pilih Style**
- **Colored**: Warna berbeda untuk bullish/bearish
- **Monochrome**: Tema warna abu-abu
---
### **B. Penggunaan Fitur**
#### **1. Smart Money Structure**
**Internal Structure (Real-time):**
- ✅ Aktifkan "Show Internal Structure"
- Pilih tampilan: All, BOS only, atau CHoCH only
- Gunakan untuk entry timing presisi
- Filter confluence untuk mengurangi noise
**Swing Structure:**
- ✅ Aktifkan "Show Swing Structure"
- Pilih tampilan struktur bullish/bearish
- Adjust "Swings Length" (default: 50)
- Gunakan untuk konfirmasi trend utama
**Tips:**
- BOS = Konfirmasi trend continuation
- CHoCH = Warning untuk possible reversal
- Tunggu price retest ke order block setelah BOS
---
#### **2. Order Blocks**
**Setup:**
- ✅ Aktifkan Internal/Swing Order Blocks
- Set jumlah blocks yang ditampil (1-20)
- Pilih filter: ATR atau Cumulative Mean Range
- Pilih mitigation: Close atau High/Low
**Cara Trading:**
1. Tunggu BOS/CHoCH terbentuk
2. Identifikasi order block terdekat
3. Wait for price pullback ke order block
4. Entry saat price respek order block (rejection)
5. Stop loss di bawah/atas order block
6. Target: swing high/low berikutnya
**Color Code:**
- 🔵 Light Blue = Internal Bullish OB
- 🔴 Light Red = Internal Bearish OB
- 🔵 Dark Blue = Swing Bullish OB
- 🔴 Dark Red = Swing Bearish OB
---
#### **3. Equal Highs/Lows (EQH/EQL)**
**Setup:**
- ✅ Aktifkan "Equal High/Low"
- Set "Bars Confirmation" (default: 3)
- Adjust threshold (0-0.5, default: 0.1)
**Interpretasi:**
- EQH = Liquidity di atas, kemungkinan sweep lalu dump
- EQL = Liquidity di bawah, kemungkinan sweep lalu pump
- Biasanya smart money akan grab liquidity sebelum move besar
**Trading Strategy:**
- Wait for EQH/EQL formation
- Anticipate liquidity grab
- Entry setelah sweep dengan konfirmasi (order block, FVG, CHoCH)
---
#### **4. Fair Value Gaps (FVG)**
**Setup:**
- ✅ Aktifkan "Fair Value Gaps"
- Pilih timeframe (default: chart timeframe)
- Enable/disable auto threshold
- Set extension bars
**Cara Trading:**
1. Bullish FVG = Support zone untuk buy
2. Bearish FVG = Resistance zone untuk sell
3. Price tends to fill FVG (retest)
4. Entry saat price kembali ke FVG
5. Partial fill = valid, full fill = invalidated
**Tips:**
- FVG + Order Block = High probability setup
- Multi-timeframe FVG lebih kuat
- Unfilled FVG = strong momentum
---
#### **5. Premium & Discount Zones**
**Setup:**
- ✅ Aktifkan "Premium/Discount Zones"
- Zones akan auto-update berdasarkan swing high/low
**Interpretasi:**
- 🟢 **Discount Zone** = Area BUY (price murah)
- ⚪ **Equilibrium** = Neutral (50%)
- 🔴 **Premium Zone** = Area SELL (price mahal)
**Trading Strategy:**
- BUY dari discount zone
- SELL dari premium zone
- Avoid trading di equilibrium
- Combine dengan structure confirmation
---
#### **6. Fibonacci Retracement**
**Setup:**
- Pilih Fib yang ingin ditampilkan:
- Equilibrium to Discount
- Equilibrium to Premium
- Discount to Premium
- Toggle show lines
- Enable reverse jika perlu
- Custom colors
**Key Levels:**
- 0.236 = Shallow retracement
- 0.382 = Common retracement
- 0.5 = 50% golden level
- 0.618 = Golden ratio (penting!)
- 0.786 = Deep retracement
**Cara Pakai:**
- 0.618-0.786 = Ideal entry zone dalam trend
- Combine dengan order blocks
- Wait for confirmation candle
---
#### **7. Volume Profile (VRVP)**
**Setup:**
- ✅ Aktifkan "Show Volume Profile"
- Set jumlah rows (10-100)
- Adjust width (5-50%)
- Pilih placement (Left/Right)
- Enable POC dan Value Area
**Interpretasi:**
- **POC (Point of Control)** = Harga dengan volume tertinggi = magnet
- **Value Area** = 70% volume = fair price range
- **Low Volume Nodes** = Weak support/resistance
- **High Volume Nodes** = Strong support/resistance
**Trading:**
- POC acts as support/resistance
- Price tends to return to POC
- Breakout dari Value Area = momentum
---
#### **8. RSI Multi-Timeframe**
**Setup:**
- ✅ Aktifkan "Show RSI Table"
- Set 3 timeframes (default: chart, 5m, 15m)
- Set RSI period (default: 14)
- Set Overbought level (default: 70)
- Set Oversold level (default: 30)
- Pilih posisi & ukuran table
**Interpretasi:**
- 🟢 **OS (Oversold)** = RSI ≤ 30 = Kondisi jenuh jual
- 🔴 **OB (Overbought)** = RSI ≥ 70 = Kondisi jenuh beli
- **-** = Neutral zone
**Trading Strategy:**
1. Multi-timeframe alignment = strong signal
2. OS + Bullish structure = BUY signal
3. OB + Bearish structure = SELL signal
4. Divergence RSI vs Price = reversal warning
**Contoh:**
- TF1: OS, TF2: OS, TF3: OS + Price di discount zone = STRONG BUY
---
#### **9. Moving Averages**
**Setup:**
- Pilih MA Type: EMA, SMA, atau WMA (berlaku untuk ketiga MA)
- Pilih Period Mode: Automatic atau Manual
- Set period untuk MA 1, 2, 3 (default: 20, 50, 100)
- Custom color & width per MA
- ✅ Enable Cross Alerts
**Interpretasi:**
- **Golden Cross** = MA fast cross above MA slow = Bullish
- **Death Cross** = MA fast cross below MA slow = Bearish
- Price above all MAs = Strong uptrend
- Price below all MAs = Strong downtrend
**Trading Strategy:**
1. MA1 (20) = Short-term trend
2. MA2 (50) = Medium-term trend
3. MA3 (100) = Long-term trend
**Entry Signals:**
- Price bounce dari MA dalam trend = continuation
- MA cross dengan konfirmasi structure = entry
- Multiple MA confluence = strong support/resistance
**Alerts Available:**
- MA1 cross MA2/MA3
- MA2 cross MA3
- Price cross any MA
---
#### **10. Multi-Timeframe Levels**
**Setup:**
- Enable HTF Level 1-5
- Set timeframes (contoh: 5m, 1H, 4H, D, W)
- Pilih line style (solid/dashed/dotted)
- Custom colors
**Cara Pakai:**
- Previous high/low dari HTF = strong S/R
- Breakout HTF level = significant move
- Multiple HTF levels confluence = major zone
---
### **C. Trading Setup Combination**
#### **Setup 1: High Probability Buy (Bullish)**
1. ✅ Swing structure: Bullish BOS
2. ✅ Price di Discount Zone
3. ✅ Pullback ke Bullish Order Block
4. ✅ Bullish FVG di bawah
5. ✅ RSI Multi-TF: Oversold
6. ✅ Price bounce dari MA
7. ✅ POC/Value Area support
8. ✅ Fibonacci 0.618-0.786 retracement
**Entry:** Saat price reject dari order block dengan confirmation candle
**Stop Loss:** Below order block
**Target:** Swing high atau premium zone
---
#### **Setup 2: High Probability Sell (Bearish)**
1. ✅ Swing structure: Bearish BOS
2. ✅ Price di Premium Zone
3. ✅ Pullback ke Bearish Order Block
4. ✅ Bearish FVG di atas
5. ✅ RSI Multi-TF: Overbought
6. ✅ Price reject dari MA
7. ✅ POC/Value Area resistance
8. ✅ Fibonacci 0.618-0.786 retracement
**Entry:** Saat price reject dari order block dengan confirmation candle
**Stop Loss:** Above order block
**Target:** Swing low atau discount zone
---
#### **Setup 3: Liquidity Grab (EQH/EQL)**
1. ✅ Identifikasi EQH atau EQL
2. ✅ Wait for liquidity sweep
3. ✅ Konfirmasi dengan CHoCH
4. ✅ Order block terbentuk setelah sweep
5. ✅ Entry saat retest order block
---
### **D. Tips & Best Practices**
**Risk Management:**
- Selalu gunakan stop loss
- Risk 1-2% per trade
- Risk:Reward minimum 1:2
- Jangan over-leverage
**Confluence adalah Kunci:**
- Minimal 3-4 konfirmasi sebelum entry
- Lebih banyak konfirmasi = higher probability
- Quality over quantity
**Timeframe Analysis:**
- HTF (Higher Timeframe) = Trend direction
- LTF (Lower Timeframe) = Entry timing
- Align dengan HTF trend
**Backtesting:**
- Gunakan mode "Historical"
- Test strategy di berbagai market condition
- Record dan analyze hasil
**Market Condition:**
- Trending market = Follow BOS, use order blocks
- Ranging market = Use premium/discount zones, EQH/EQL
- High volatility = Wider stops, wait for clear structure
**Avoid:**
- Trading di equilibrium zone
- Entry tanpa konfirmasi
- Fighting the trend
- Overleveraging
- Emotional trading
---
## 📈 Recommended Settings
### **For Scalping (1m - 5m):**
- Internal Structure: ON
- Swing Structure: OFF
- Order Blocks: Internal only
- RSI Timeframes: 1m, 5m, 15m
- MA Periods: 9, 21, 50
### **For Day Trading (15m - 1H):**
- Internal Structure: ON
- Swing Structure: ON
- Order Blocks: Both
- RSI Timeframes: 15m, 1H, 4H
- MA Periods: 20, 50, 100
### **For Swing Trading (4H - D):**
- Internal Structure: OFF
- Swing Structure: ON
- Order Blocks: Swing only
- RSI Timeframes: 4H, D, W
- MA Periods: 20, 50, 200
---
## ⚠️ Disclaimer
Indicator ini adalah alat bantu analisis teknikal. Tidak ada indicator yang 100% akurat. Selalu:
- Lakukan analisa fundamental
- Gunakan proper risk management
- Praktik di demo account terlebih dahulu
- Trading memiliki resiko, trade at your own risk
---
## 📝 Version Info
**Version:** 5.0
**Platform:** TradingView Pine Script v5
**Author:** XoRonX
**Max Labels:** 500
**Max Lines:** 500
**Max Boxes:** 500
---
## 🔄 Updates & Support
Untuk update, bug reports, atau pertanyaan:
- Check documentation regularly
- Test new features in replay mode
- Backup your settings before updates
---
## 🎓 Learning Resources
**Recommended Study:**
1. Smart Money Concepts (SMC) basics
2. Order blocks theory
3. Liquidity concepts
4. ICT (Inner Circle Trader) concepts
5. Volume profile analysis
6. Multi-timeframe analysis
**Practice:**
- Start with higher timeframes
- Master one concept at a time
- Keep a trading journal
- Review your trades weekly
---
**Happy Trading! 🚀📊**
_Remember: The best indicator is your own analysis and discipline._
