Victoria Overlay - HTF 200 + VWAP + ATR Stop + MA TrioConsolidated road to minions
Buy Setup:
EMA1 crosses above SMA3.
RSI confirms above 50.
Volume increasing (confirming momentum).
Candle closes above SMA1 base.
Sell Setup:
EMA1 crosses below SMA3.
RSI drops below 50 or exits overbought.
Volume confirms (declining or reversing).
Candle closes below SMA1 base.
Tips:
Think of EMA1 as the scalper’s trigger.
SMA3 is your momentum check.
SMA1 (base) = short-term bias.
Avoid entries during low-volume chop.
Use for day trades or tight scalps; exits happen fast.
Overlay (Smoothed Heikin Ashi + Swing + VWAP + ATR Stop + 200-SMA)
Purpose: Multi-layer trend confirmation + clean structure.
Type: Swing alignment tool.
🟩 BUY / CALL Conditions
Green “Buy (Gated)” arrow appears.
Price is above VWAP, above 200-SMA, and above ATR stop.
ATR stop (green line) sits under price → support confirmed.
Heikin-Ashi candles are green/lime.
Bias label says “Above VWAP | Above 200 | Swing Up”.
🟥 SELL / PUT Conditions
Red “Sell (Gated)” arrow appears.
Price is below VWAP, below 200-SMA, and below ATR stop.
ATR stop (red line) sits above price → resistance confirmed.
Heikin-Ashi candles are red.
Bias label says “Below VWAP | Below 200 | Swing Down”.
Exit / Risk Control:
Close position when price crosses ATR stop.
If Heikin candles flip color, momentum is reversing.
Best Use Cases:
For next-day or multi-hour swing entries.
Use ATR Stop for dynamic stop loss.
Stay out when the bias label is mixed (e.g. “Above VWAP | Below 200 | Swing Down”).
Pro Tip:
On big news days, let VWAP reset post-open before acting on arrows — filters fake signals.
RSI Panel Pro (v6)
Purpose: Strength + exhaustion confirmation.
Type: Momentum filter.
Key Levels:
Overbought: 80+ → take profits soon.
Oversold: 20– → watch for bounce setups.
Bull regime: RSI above 60 = momentum strong.
Bear regime: RSI below 40 = weakness.
Buy / Entry Signals:
RSI crosses up from below 40 or 20.
RSI line is above RSI-EMA (gray line).
Higher timeframe RSI (if used) is also rising.
Trim / Exit:
RSI drops under 60 after being strong.
RSI crosses below its EMA.
Sell / Put Setup:
RSI fails at 60 or drops below 40.
RSI crosses under EMA after a bounce.
Tips:
Pair RSI panel with Victoria Overlay — only take gated buys when RSI confirms.
RSI < 40 but above 20 = “loading zone” for reversals.
RSI > 70 = overextended → wait for confirmation before entering.
Combined Execution Rules
Goal What to Watch Action
Entry (CALL) EMA1 > SMA3, Buy (Gated) arrow, RSI rising > 50 Buy call / open long
Entry (PUT) EMA1 < SMA3, Sell (Gated) arrow, RSI < 50 Buy put / open short
Exit Early Price crosses ATR stop or RSI flips under EMA Exit trade / protect gains
Trend Filter VWAP + 200-SMA alignment Only trade in that direction
Avoid Trades Conflicting bias label or low volume Stay flat
Pro Tips
VWAP → Intraday mean: above = bullish control, below = bearish control.
ATR Stop → Dynamic trailing stop: never widen it manually.
Smoothed Heikin-Ashi → filters noise: trend stays until color flips twice.
RSI Panel → confirms whether to hold through pullbacks.
If RSI and Overlay disagree — wait, not trade.
"key levels"に関するスクリプトを検索

BMSB Watchlist Alert - Daily w/ 1% Proximity# Bull Market Support Band - Daily Updates with Proximity Alerts
## Overview
This indicator tracks the Bull Market Support Band (20-week SMA and 21-week EMA) with daily resolution updates and proximity warnings. The weekly moving averages update every day on your chart, giving you more frequent signals than traditional weekly-only scripts.
## What It Does
The script monitors price action relative to the BMSB and generates alerts for:
- Price crossing above or below either the 20W SMA or 21W EMA
- Price coming within 1% of either moving average (early warning system)
This proximity feature is useful for catching potential support/resistance tests before they actually happen, giving you advance notice to prepare for entries or exits.
## Key Features
- Weekly MAs that update daily for more responsive monitoring
- Configurable proximity threshold (default 1%, adjustable from 0.1% to 5%)
- Visual proximity zones shown as dotted lines around each MA
- Color-coded background highlighting (green when above both MAs, red when below both, orange when in proximity zone)
- On-chart labels for crosses and proximity warnings
- Status table showing current position relative to the band
## Setup for Watchlist Alerts
1. Add the indicator to any chart
2. Create alerts using these conditions:
- "BMSB Cross Alert" - fires on actual crosses
- "BMSB Proximity Alert" - fires when entering the 1% zone
3. Set interval to 1 day (recommended) or 4 hour for more frequent checks
4. Use "Once Per Bar Close" for the trigger option
5. Apply the same alert to your entire watchlist
## Settings
You can toggle on/off:
- Cross above alerts
- Cross below alerts
- Proximity alerts
- Proximity percentage adjustment
- Visual elements (labels, MA lines, proximity zones)
## Notes
The BMSB is commonly used in crypto markets to identify bull market pullback support levels. This implementation adds the proximity warning system to help you anticipate potential tests of these key levels rather than waiting for confirmed crosses.
Works on any timeframe but designed for daily monitoring of weekly moving averages.

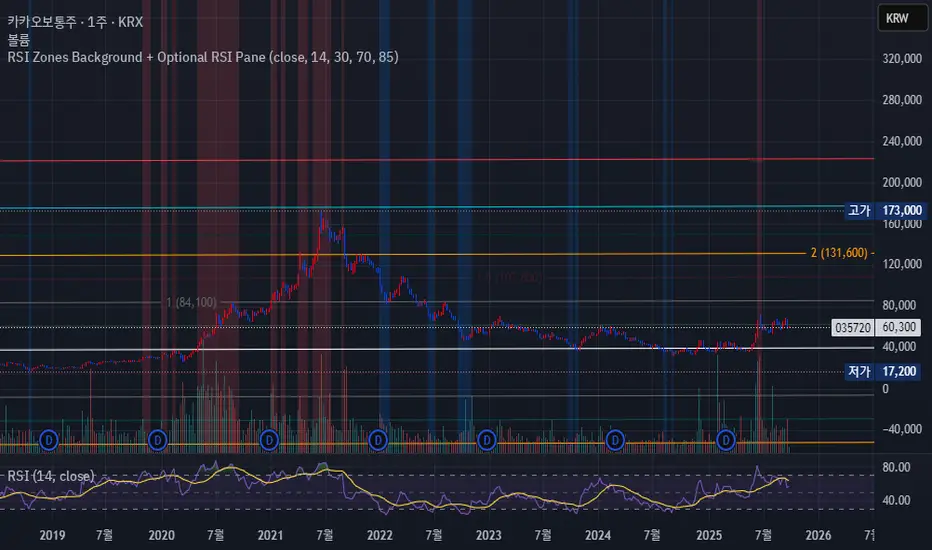
RSI Zones Background + Optional RSI PaneOverview
This Pine Script indicator does two things at once:
Colors the background of the main price chart whenever the RSI value is below a lower threshold (default 30) or above an upper threshold (default 70). This highlights oversold and overbought zones directly on the price chart itself.
Optionally displays a separate RSI panel with the RSI line and shaded region between the two threshold levels for reference.
The indicator is fully customizable through the settings panel—color choices, transparency, and whether to show the separate RSI pane can all be adjusted.
Key Parts of the Code
1. Inputs
src: The source price series for RSI calculation.
len: RSI lookback length (default 14).
lowerThr and upperThr: The lower and upper thresholds (defaults: 30 and 70).
lowColor and highColor: Colors for the background when RSI is below or above the thresholds.
bgTrans: Transparency level for the background shading.
showRSI: Boolean to toggle the optional RSI pane on or off.
2. RSI Calculation
rsi = ta.rsi(src, len)
This computes the RSI from the chosen price source.
3. Background Coloring on the Price Chart
bgCol = rsi <= lowerThr ? color.new(lowColor,bgTrans) :
rsi >= upperThr ? color.new(highColor,bgTrans) :
na
bgcolor(bgCol)
If RSI ≤ lower threshold: background turns lowColor (oversold zone).
If RSI ≥ upper threshold: background turns highColor (overbought zone).
Otherwise, no background color.
4. Optional RSI Pane
plot(showRSI ? rsi : na, display=display.pane)
Plots the RSI line in a separate pane when showRSI is true; otherwise hides it.
5. Horizontal Lines for Thresholds
hLower = hline(lowerThr, ...)
hUpper = hline(upperThr, ...)
Two horizontal lines at the lower and upper thresholds.
Because hline() can’t be wrapped inside if blocks, the script always creates them but makes them transparent (using na color) when the pane is hidden.
6. Filling Between Threshold Lines
fill(hLower, hUpper, color=showRSI ? color.new(color.gray,95) : na)
When the RSI pane is visible, the area between the two threshold lines is shaded in gray to create a “mid-zone” effect. This fill also switches off (becomes na) if the pane is hidden.
7. Alerts
The script also includes two alert conditions:
When RSI crosses below the lower threshold.
When RSI crosses above the upper threshold.
How It Works in Practice
On the price chart, you’ll see the background turn blue (or your chosen color) when RSI is ≤30, and red when RSI is ≥70.
If you enable “Show RSI” in the settings, a separate RSI pane will appear below the price chart, plotting the RSI line with two threshold lines and a shaded region in between.
You can fully adjust transparency and colors to suit your chart style.
Benefits
Quickly visualize overbought and oversold conditions without opening a separate RSI window.
Optional RSI pane provides context when needed.
Customizable colors and transparency make it easy to integrate with any chart theme.
Alerts give you automatic notifications when RSI crosses key levels.
------------------------------------------------------------------------------------------------------------------
개요
이 지표는 두 가지 기능을 동시에 수행합니다.
가격 차트 뒤 배경에 색상 표시
RSI 값이 설정한 하단 임계값(기본 30) 이하이거나 상단 임계값(기본 70) 이상일 때, 가격 차트 뒤쪽에 과매도·과매수 구간을 색으로 표시해줍니다.
선택적으로 RSI 보조창 표시
옵션을 켜면 별도의 RSI 패널이 나타나서 RSI 라인과 두 임계값(30, 70)을 연결한 구간을 음영 처리하여 보여줍니다.
설정 창에서 색상·투명도·보조창 표시 여부를 전부 조정할 수 있습니다.
코드 핵심 설명
1. 입력값
src: RSI 계산에 사용할 가격 소스(기본 종가).
len: RSI 기간(기본 14).
lowerThr / upperThr: RSI 하단·상단 임계값(기본 30, 70).
lowColor / highColor: RSI가 각각 하단 이하·상단 이상일 때 배경 색상.
bgTrans: 배경 투명도(0=불투명, 100=투명).
showRSI: RSI 보조창을 켜고 끌 수 있는 스위치.
2. RSI 계산
rsi = ta.rsi(src, len)
지정한 가격 소스를 기반으로 RSI를 계산합니다.
3. 가격 차트 배경 색칠
bgCol = rsi <= lowerThr ? color.new(lowColor,bgTrans) :
rsi >= upperThr ? color.new(highColor,bgTrans) :
na
bgcolor(bgCol)
RSI ≤ 하단 임계값 → lowColor(과매도 색)
RSI ≥ 상단 임계값 → highColor(과매수 색)
나머지 구간은 색상 없음.
4. 선택적 RSI 보조창
plot(showRSI ? rsi : na, display=display.pane)
showRSI가 켜져 있으면 RSI 라인을 보조창에 표시하고, 꺼져 있으면 숨깁니다.
5. 임계값 가로선
hLower = hline(lowerThr, ...)
hUpper = hline(upperThr, ...)
하단·상단 임계값을 가로선으로 표시합니다.
hline은 if 블록 안에서 쓸 수 없기 때문에 항상 그려지지만, 보조창이 꺼지면 색을 na로 처리해 안 보이게 합니다.
6. 임계값 사이 영역 음영 처리
fill(hLower, hUpper, color=showRSI ? color.new(color.gray,95) : na)
보조창이 켜져 있을 때만 두 가로선 사이를 회색으로 채워 “중립 구간”을 강조합니다.
7. 알림 조건
RSI가 하단 임계값을 아래로 돌파할 때 알림.
RSI가 상단 임계값을 위로 돌파할 때 알림.
실제 작동 모습
가격 차트 뒤쪽에 RSI ≤30이면 파란색, RSI ≥70이면 빨간색 배경이 나타납니다(색상은 설정에서 변경 가능).
RSI 보조창을 켜면, RSI 라인과 임계값 가로선, 그리고 그 사이 음영 영역이 함께 나타납니다.
투명도를 높이거나 낮추어 강조 정도를 조절할 수 있습니다.
장점
별도의 RSI창을 열지 않고도 가격 차트 배경만으로 과매수·과매도 상태를 직관적으로 확인 가능.
필요하면 보조창으로 RSI를 직접 확인하면서 임계값 가이드와 음영 영역을 함께 볼 수 있음.
색상·투명도를 자유롭게 조절할 수 있어 차트 스타일에 맞게 커스터마이징 가능.
RSI가 임계값을 돌파할 때 자동 알림을 받을 수 있음.
$ - HTF Sweeps & PO3HTF Sweeps & PO3 Indicator
The HTF Sweeps & PO3 indicator is a powerful tool designed for traders to visualise higher timeframe (HTF) candles, identify liquidity sweeps, and track key price levels on a lower timeframe (LTF) chart. Built for TradingView using Pine Script v6, it overlays HTF candle data and highlights significant price movements, such as sweeps of previous highs or lows, to help traders identify potential liquidity sweep and reversal points. The indicator is highly customisable, offering a range of visual and alert options to suit various trading strategies.
Features
Higher Timeframe (HTF) Candle Visualisation:
- Displays up to three user-defined HTF candles (e.g., 15m, 1H, 4H) overlaid on the LTF chart.
- Customisable candle appearance with adjustable size (Tiny to Huge), offset, spacing, and colours for bullish/bearish candles and wicks.
- Option to show timeframe labels above or below HTF candles with configurable size and position.
Liquidity Sweep Detection:
- Identifies bullish and bearish sweeps when price moves beyond the high or low of a previous HTF candle and meets specific conditions.
- Displays sweeps on both LTF and HTF with customisable line styles (Solid, Dashed, Dotted), widths, and colours.
- Option to show only the most recent sweep per candle to reduce chart clutter.
Invalidated Sweep Tracking:
- Detects and visualises invalidated sweeps (when price moves past a sweep level in the opposite direction).
- Configurable display for invalidated sweeps on LTF and HTF with distinct line styles and colours.
Previous High/Low Lines:
- Plots horizontal lines at the high and low of the previous HTF candle, extending on both LTF and HTF.
- Customisable line style, width, and color for easy identification of key levels.
- Real-Time Sweep Detection:
-Optional real-time sweep visualisation for active candles, enabling traders to monitor developing price action.
Alert System:
- Triggers alerts for sweep formation (when a new sweep is detected).
- Triggers alerts for sweep invalidation (when a sweep is no longer valid).
- Alerts include details such as timeframe, ticker, and price level for precise notifications.
Performance Optimisation:
- Efficiently manages resources with configurable limits for lines, labels, boxes, and bars (up to 500 each).
- Cleans up outdated visual elements to maintain chart clarity.
Flexible Configuration:
- Supports multiple timeframes for HTF candles with user-defined settings for visibility and number of candles displayed (1–60).
- Toggle visibility for HTF candles, sweeps, invalidated sweeps, and high/low lines independently for LTF and HTF.
This indicator is ideal for traders focusing on liquidity hunting, order block analysis, or price action strategies, providing clear visual cues and alerts to enhance decision-making.

NDOG & NWOG - Liquidity + Sunday Box rroielDescription:
This script combines NDOG & NWOG liquidity levels with a Sunday Box framework to provide traders with structured levels for weekly bias, liquidity mapping, and potential entry/exit zones.
Features:
• Automatic plotting of NDOG & NWOG liquidity zones.
• Sunday Box (weekly open range) drawn to define structure and bias.
• Highlights liquidity sweeps and retests for trade confirmation.
• Configurable settings for box time, liquidity range, and display options.
• Built to support ROI/EL strategies by aligning liquidity with weekly key levels.
Use Case:
Helps traders identify where price is likely to react by combining liquidity-based zones with the Sunday box framework. Designed for clarity, confluence, and efficiency in execution.

FlowStateTrader FlowState Trader - Advanced Time-Filtered Strategy
## Overview
FlowState Trader is a sophisticated algorithmic trading strategy that combines precision entry signals with intelligent time-based filtering and adaptive risk management. Built for traders seeking to achieve their optimal performance state, FlowState identifies high-probability trading opportunities within user-defined time windows while employing dynamic trailing stops and partial position management.
## Core Strategy Philosophy
FlowState Trader operates on the principle that peak trading performance occurs when three elements align: **Focus** (precise entry signals), **Flow** (optimal time windows), and **State** (intelligent position management). This strategy excels at finding reversal opportunities at key support and resistance levels while filtering out suboptimal trading periods to keep traders in their optimal flow state.
## Key Features
### 🎯 Focus Entry System
**Support/Resistance Zone Trading**:
- Dynamic identification of key price levels using configurable lookback periods
- Entry signals triggered when price interacts with these critical zones
- Volume confirmation ensures genuine breakout/reversal momentum
- Trend filter alignment prevents counter-trend disasters
**Entry Conditions**:
- **Long Signals**: Price closes above support buffer, touches support level, with above-average volume
- **Short Signals**: Price closes below resistance buffer, touches resistance level, with above-average volume
- Optional trend filter using EMA or SMA for directional bias confirmation
### ⏰ FlowState Time Filtering System
**Comprehensive Time Controls**:
- **12-Hour Format Trading Windows**: User-friendly AM/PM time selection
- **Multi-Timezone Support**: UTC, EST, PST, CST with automatic conversion
- **Day-of-Week Filtering**: Trade only weekdays, weekends, or both
- **Lunch Hour Avoidance**: Automatically skips low-volume lunch periods (12-1 PM)
- **Visual Time Indicators**: Background coloring shows active/inactive trading periods
**Smart Time Features**:
- Handles overnight trading sessions seamlessly
- Prevents trades during historically poor performance periods
- Customizable trading hours for different market sessions
- Real-time trading window status in dashboard
### 🛡️ Adaptive Risk Management
**Multi-Level Take Profit System**:
- **TP1**: First profit target with optional partial position closure
- **TP2**: Final profit target for remaining position
- **Flexible Scaling**: Choose number of contracts to close at each level
**Dynamic Trailing Stop Technology**:
- **Three Operating Modes**:
- **Conservative**: Earlier activation, tighter trailing (protect profits)
- **Balanced**: Optimal risk/reward balance (recommended)
- **Aggressive**: Later activation, wider trailing (let winners run)
- **ATR-Based Calculations**: Adapts to current market volatility
- **Automatic Activation**: Engages when position reaches profitability threshold
### 📊 Intelligent Position Sizing
**Contract-Based Management**:
- Configurable entry quantity (1-1000 contracts)
- Partial close quantities for profit-taking
- Clear position tracking and P&L monitoring
- Real-time position status updates
### 🎨 Professional Visualization
**Enhanced Chart Elements**:
- **Entry Zone Highlighting**: Clear visual identification of trading opportunities
- **Dynamic Risk/Reward Lines**: Real-time TP and SL levels with price labels
- **Trailing Stop Visualization**: Live tracking of adaptive stop levels
- **Support/Resistance Lines**: Key level identification
- **Time Window Background**: Visual confirmation of active trading periods
**Dual Dashboard System**:
- **Strategy Dashboard**: Real-time position info, settings status, and current levels
- **Performance Scorecard**: Live P&L tracking, win rates, and trade statistics
- **Customizable Sizing**: Small, Medium, or Large display options
### ⚙️ Comprehensive Customization
**Core Strategy Settings**:
- **Lookback Period**: Support/resistance calculation period (5-100 bars)
- **ATR Configuration**: Period and multipliers for stops/targets
- **Reward-to-Risk Ratios**: Customizable profit target calculations
- **Trend Filter Options**: EMA/SMA selection with adjustable periods
**Time Filter Controls**:
- **Trading Hours**: Start/end times in 12-hour format
- **Timezone Selection**: Four major timezone options
- **Day Restrictions**: Weekend-only, weekday-only, or unrestricted
- **Session Management**: Lunch hour avoidance and custom periods
**Risk Management Options**:
- **Trailing Stop Modes**: Conservative/Balanced/Aggressive presets
- **Partial Close Settings**: Enable/disable with custom quantities
- **Alert System**: Comprehensive notifications for all trade events
### 📈 Performance Tracking
**Real-Time Metrics**:
- Net profit/loss calculation
- Win rate percentage
- Profit factor analysis
- Maximum drawdown tracking
- Total trade count and breakdown
- Current position P&L
**Trade Analytics**:
- Winner/loser ratio tracking
- Real-time performance scorecard
- Strategy effectiveness monitoring
- Risk-adjusted return metrics
### 🔔 Alert System
**Comprehensive Notifications**:
- Entry signal alerts with price and quantity
- Take profit level hits (TP1 and TP2)
- Stop loss activations
- Trailing stop engagements
- Position closure notifications
## Strategy Logic Deep Dive
### Entry Signal Generation
The strategy identifies high-probability reversal points by combining multiple confirmation factors:
1. **Price Action**: Looks for price interaction with key support/resistance levels
2. **Volume Confirmation**: Ensures sufficient market interest and liquidity
3. **Trend Alignment**: Optional filter prevents counter-trend positions
4. **Time Validation**: Only trades during user-defined optimal periods
5. **Zone Analysis**: Entry occurs within calculated buffer zones around key levels
### Risk Management Philosophy
FlowState Trader employs a three-tier risk management approach:
1. **Initial Protection**: ATR-based stop losses set at strategy entry
2. **Profit Preservation**: Trailing stops activate once position becomes profitable
3. **Scaled Exit**: Partial profit-taking allows for both security and potential
### Time-Based Edge
The time filtering system recognizes that not all trading hours are equal:
- Avoids low-volume, high-spread periods
- Focuses on optimal liquidity windows
- Prevents trading during news events (lunch hours)
- Allows customization for different market sessions
## Best Practices and Optimization
### Recommended Settings
**For Scalping (1-5 minute charts)**:
- Lookback Period: 10-20
- ATR Period: 14
- Trailing Stop: Conservative mode
- Time Filter: Major session hours only
**For Day Trading (15-60 minute charts)**:
- Lookback Period: 20-30
- ATR Period: 14-21
- Trailing Stop: Balanced mode
- Time Filter: Extended trading hours
**For Swing Trading (4H+ charts)**:
- Lookback Period: 30-50
- ATR Period: 21+
- Trailing Stop: Aggressive mode
- Time Filter: Disabled or very broad
### Market Compatibility
- **Forex**: Excellent for major pairs during active sessions
- **Stocks**: Ideal for liquid stocks during market hours
- **Futures**: Perfect for index and commodity futures
- **Crypto**: Effective on major cryptocurrencies (24/7 capability)
### Risk Considerations
- **Market Conditions**: Performance varies with volatility regimes
- **Timeframe Selection**: Lower timeframes require tighter risk management
- **Position Sizing**: Never risk more than 1-2% of account per trade
- **Backtesting**: Always test on historical data before live implementation
## Educational Value
FlowState serves as an excellent learning tool for:
- Understanding support/resistance trading
- Learning proper time-based filtering
- Mastering trailing stop techniques
- Developing systematic trading approaches
- Risk management best practices
## Disclaimer
This strategy is for educational and informational purposes only. Past performance does not guarantee future results. Trading involves substantial risk of loss and is not suitable for all investors. Users should thoroughly backtest the strategy and understand all risks before live trading. Always use proper position sizing and never risk more than you can afford to lose.
---
*FlowState Trader represents the evolution of systematic trading - combining classical technical analysis with modern risk management and intelligent time filtering to help traders achieve their optimal performance state through systematic, disciplined execution.*

VSA-Stopping VolumeVSA Stopping Volume Indicator
Stopping Volume occurs when candles show decreasing body sizes (narrow spreads) while volume steadily increases.
Example chart:
As you see:
3 consecutive candles in same direction (all green OR all red)
Body sizes (spreads) decreasing progressively: Candle 1 > Candle 2 > Candle 3
Volume increasing progressively: Volume 1 < Volume 2 < Volume 3
This pattern indicates price absorption - increased buying/selling pressure but declining price movement, often signaling exhaustion and potential reversal.
Indicator Features
This indicator detects Stopping Volume candlestick clusters with two signal types:
🔹 BUY/SELL Signals: Generated when pattern occurs at support/resistance zones
🔹 Directional Alerts (▲-green, ▼-red): Generated when pattern occurs outside key levels
Trading Guidelines:
⚠️ Auto-drawn S/R zones are reference only - manual level plotting recommended for accuracy
📊 Best for scalping: M5, M10, M15 timeframes
🛡️ Stop Loss: Place beyond the S/R zone you're trading
🎯 Take Profit: Based on your risk management
Key Concept: Volume expansion + price contraction = potential reversal, especially at SnR levels.
Perfect for scalpers looking to catch reversals at critical zones!

ORB - Opening Range Breakout + AlertsThe only ORB indicator you'll ever need.
- Flexible Range: Tailor the opening range (e.g., 5m, 15m, 30m) to your trading style.
- Key Levels: Auto-plots striking pink/purple support/resistance lines post-range for clear trade setups.
- Breakout Alerts: Reliable LONG/SHORT signals on 5m chart for confirmed breakouts; enable/disable as needed.
- Personalized Design: Customize line color and thickness for optimal visibility.
A friendly reminder that no tool or indicator guarantees success. Integrate this into a robust trading plan.

muraThis indicator is based on moving averages over a certain period using Fibonacci numbers. Pivot points are provided for active trading, which help to trade from the levels.
The indicator takes into account the trend direction, identifies key levels and possible targets.
You can also easily set up notifications for trend changes and receive them in the tradingview app or as an audio signal on your computer. This will help you not to miss anything in the market.
The moving averages with a uniquely recognized trend. 6 moving averages create 3 important trends. The first trend is local from your time frame, the second is global from your time frame and the third trend is predicated for tracking the global trend on an older time frame.
I have identified ways to trade my indicator:
- On a 4-hour time frame you can open trades in one direction with a change in the global trend. That is, if the red trend changes to green, it is time to open longs and vice versa.
- The global trend works best when paired with the local trend. That is, if the global trend is green, we wait until the local trend becomes green and then open longs, as well as in the opposite direction.
- Opening positions when the local trend changes towards the global trend also works well on a 12 hour time frame.
This indicator can be used on any timeframes from 1 minute to 1 year. You can also select levels for trading:
- intraday
- intra-week
- within a month
Note:
- Before you start trading, I strongly recommend you to do your own analysis on your own time frame or pairs
- Recommended for use with additional technical analysis tools

NasyI## NasyI - Multi-Timeframe Technical Analysis Toolkit
### English Description
**NasyI** is a comprehensive technical analysis indicator designed to provide traders with a complete view of market dynamics across multiple timeframes. This indicator combines the power of Exponential Moving Averages (EMAs), Simple Moving Averages (MAs), Volume Weighted Average Price (VWAP), and key support/resistance levels to help traders identify trend direction, potential reversal points, and optimal entry/exit opportunities.
#### Key Features
1. **Multi-Timeframe Analysis System**
- 2-minute EMAs (13, 48) for ultra-short-term trend identification
- 5-minute EMAs (9, 13, 21, 48, 200) for short-term trend confirmation
- Daily EMAs (5, 13, 21, 48, 100, 200) and MAs (20, 50, 100, 200) for longer-term perspective
- Color-coded bands between key EMAs to visually identify trend strength and direction
2. **Advanced VWAP Integration**
- Daily VWAP for intraday support/resistance
- Weekly VWAP for medium-term price reference
- Monthly VWAP for long-term institutional price levels
- All VWAPs properly reset at their respective time period boundaries
3. **Critical Price Level Identification**
- Previous day high/low lines for identifying key breakout and breakdown levels
- Pre-market high/low tracking to identify potential intraday support/resistance zones
- All levels displayed with distinct line styles for easy identification
4. **Dynamic Trend Analysis**
- Color-coded bands between EMAs display trend strength and direction:
- Green bands indicate uptrend conditions (9 EMA > 21 EMA > 48 EMA)
- Red bands indicate downtrend conditions (9 EMA < 21 EMA < 48 EMA)
- Yellow bands indicate neutral/confused market conditions
- Visual representation makes trend changes immediately apparent
5. **Comprehensive Customization Options**
- Fully customizable colors for all indicators and bands
- Adjustable transparency settings for visual clarity
- Optional price labels with customizable placement and appearance
- Ability to show/hide specific components based on trading preferences
#### Trading Applications
This indicator is particularly valuable for:
1. **Day Trading & Scalping**: The 2-minute and 5-minute EMAs with color bands provide clear short-term trend direction and potential reversal signals.
2. **Swing Trading**: Daily EMAs and MAs offer perspective on the larger trend, helping to align short-term trades with the broader market direction.
3. **Gap Trading**: Previous day and pre-market levels help identify potential gap fill scenarios and breakout/breakdown opportunities.
4. **VWAP Trading Strategies**: Multiple timeframe VWAPs allow for identifying institutional participation levels and potential reversal zones.
5. **EMA Cross Systems**: The various EMAs can be used to identify golden crosses and death crosses across multiple timeframes.
#### How the Components Work Together
The power of NasyI comes from the integration of these different technical elements:
1. The short-timeframe EMAs (2m, 5m) provide immediate trend information, while the daily EMAs/MAs provide context about the larger market structure.
2. The color bands between EMAs offer instant visual confirmation of trend alignment or divergence across timeframes.
3. Previous day and pre-market levels add horizontal support/resistance zones to complement the dynamic moving averages.
4. Multiple timeframe VWAPs provide additional confirmation of institutional activity levels and potential reversal points.
By combining these elements, traders can develop a comprehensive market view that integrates price action, trend direction, and key support/resistance levels all in one indicator.
#### Usage Instructions
1. Apply the NasyI indicator to your chart (works best on intraday timeframes from 1-minute to 30-minute).
2. Observe the relationship between price and the various EMAs:
- Price above the 2m/5m EMAs with green bands indicates bullish short-term conditions
- Price below the 2m/5m EMAs with red bands indicates bearish short-term conditions
3. Use the daily EMAs/MAs and VWAPs as targets for potential price movements and reversal zones.
4. Previous day and pre-market high/low lines provide key levels to watch for breakouts or breakdowns.
5. Customize the appearance according to your preferences using the extensive settings options.
This indicator represents a unique approach to technical analysis by combining multiple timeframe perspectives into a single, visually intuitive display that helps traders make more informed decisions based on a comprehensive view of market conditions.
### 中文描述
**NasyI** 是一个全面的技术分析指标,旨在为交易者提供跨多个时间周期的完整市场动态视图。该指标结合了指数移动平均线(EMA)、简单移动平均线(MA)、成交量加权平均价格(VWAP)和关键支撑/阻力水平的力量,帮助交易者识别趋势方向、潜在反转点和最佳进出场机会。
#### 主要特点
1. **多时间周期分析系统**
- 2分钟EMAs(13,48)用于超短期趋势识别
- 5分钟EMAs(9,13,21,48,200)用于短期趋势确认
- 日线EMAs(5,13,21,48,100,200)和MAs(20,50,100,200)用于更长期的视角
- 关键EMAs之间的彩色带状区域直观显示趋势强度和方向
2. **高级VWAP整合**
- 日内VWAP作为日内支撑/阻力
- 周内VWAP作为中期价格参考
- 月内VWAP作为长期机构价格水平
- 所有VWAP在各自的时间周期边界正确重置
3. **关键价格水平识别**
- 前一交易日高点/低点线用于识别关键突破和跌破水平
- 盘前高点/低点跟踪用于识别潜在的日内支撑/阻力区域
- 所有水平以不同的线条样式显示,便于识别
4. **动态趋势分析**
- EMAs之间的彩色带状区域显示趋势强度和方向:
- 绿色带状区域表示上升趋势(9 EMA > 21 EMA > 48 EMA)
- 红色带状区域表示下降趋势(9 EMA < 21 EMA < 48 EMA)
- 黄色带状区域表示中性/混乱市场条件
- 视觉表示使趋势变化立即显现
5. **全面的自定义选项**
- 所有指标和带状区域的颜色完全可定制
- 可调节的透明度设置,提高视觉清晰度
- 可选的价格标签,带有可定制的位置和外观
- 能够根据交易偏好显示/隐藏特定组件
#### 交易应用
此指标对以下方面特别有价值:
1. **日内交易和短线交易**:2分钟和5分钟EMAs与色带提供清晰的短期趋势方向和潜在反转信号。
2. **摇摆交易**:日线EMAs和MAs提供对更大趋势的视角,帮助将短期交易与更广泛的市场方向对齐。
3. **缺口交易**:前一日和盘前水平帮助识别潜在的缺口填充情况和突破/跌破机会。
4. **VWAP交易策略**:多时间周期VWAP允许识别机构参与水平和潜在反转区域。
5. **EMA交叉系统**:各种EMAs可用于识别跨多个时间周期的黄金交叉和死亡交叉。
#### 组件如何协同工作
NasyI的强大之处在于这些不同技术元素的集成:
1. 短时间周期EMAs(2m,5m)提供即时趋势信息,而日线EMAs/MAs提供关于更大市场结构的背景。
2. EMAs之间的色带提供趋势对齐或跨时间周期分歧的即时视觉确认。
3. 前一日和盘前水平添加水平支撑/阻力区域,补充动态移动平均线。
4. 多时间周期VWAP提供机构活动水平和潜在反转点的额外确认。
通过结合这些元素,交易者可以发展出全面的市场视图,整合价格行动、趋势方向和关键支撑/阻力水平于一个指标中。
#### 使用说明
1. 将NasyI指标应用到您的图表上(最适合1分钟至30分钟的日内时间周期)。
2. 观察价格与各种EMAs之间的关系:
- 价格位于2m/5m EMAs之上,带有绿色带状区域,表示看涨的短期条件
- 价格位于2m/5m EMAs之下,带有红色带状区域,表示看跌的短期条件
3. 使用日线EMAs/MAs和VWAPs作为潜在价格移动和反转区域的目标。
4. 前一日和盘前高点/低点线提供需要关注的突破或跌破的关键水平。
5. 使用广泛的设置选项根据您的偏好自定义外观。
这个指标代表了一种独特的技术分析方法,将多个时间周期的视角结合到一个单一的、视觉直观的显示中,帮助交易者基于对市场条件的全面视图做出更明智的决策。

EMA with Bar Count
---
### **Key Features and Functionalities**
#### 1. **Multi-Timeframe Exponential Moving Averages (EMA)**
- The script calculates and plots EMAs for various timeframes (e.g., 1 minute, 5 minutes, 60 minutes, daily, and custom intervals).
- Users can customize the length and resolution of each EMA using inputs.
- Different colors are assigned to each EMA for easy identification on the chart.
#### 2. **Background Coloring**
- Optional background coloring (`bgcolor`) indicates whether the current price is above or below the 1-hour 20 EMA.
- Green indicates the price is above, and red indicates the price is below the EMA.
#### 3. **Bar Count Labeling**
- The script tracks bar counts and displays labels at specific intervals (e.g., every 3 bars).
- Label size and text color can be customized through user inputs.
#### 4. **Inside and Outside Bar Detection**
- Detects and highlights "Inside Bars" and "Outside Bars" on the chart.
- **Inside Bar**: The current bar's high and low are within the previous bar's range.
- **Outside Bar**: The current bar's range exceeds the previous bar's range.
- These patterns are marked with shapes for visual identification.
#### 5. **Bullish/Bearish Candle Streaks**
- Identifies and marks streaks of three consecutive bullish or bearish candles.
- **Bullish Streaks**: Marked with green shapes above the bar.
- **Bearish Streaks**: Marked with red shapes above the bar.
#### 6. **Time-Based Marking**
- The script includes an option to highlight specific time intervals (e.g., 7:30 AM) with a colored vertical line or background shading.
- Configurable time inputs allow flexibility.
#### 7. **Micro Gap Detection**
- Highlights gaps between the opening price of the current bar and the closing price of the previous bar.
- Blue shapes indicate bullish gaps.
- Purple shapes indicate bearish gaps.
#### 8. **TR (Trading Range) Detection**
- Identifies bars with significant overlap based on a user-defined threshold.
- Displays "TR" labels when overlap conditions are met.
#### 9. **Bar Coloring**
- Optionally colors bars based on specific conditions:
- Green: Bullish breakout (high and low higher than the previous bar, closing above the midpoint).
- Red: Bearish breakout (high and low lower than the previous bar, closing below the midpoint).
#### 10. **50% Midpoint Line**
- Displays a horizontal line at the 50% midpoint of the bar's range, customizable for the current or last bar only.
#### 11. **Pattern Detection**
- Recognizes specific candlestick patterns (e.g., IOI, OII, IOO).
- Provides alerts for detected patterns or predefined thresholds.
#### 12. **Alerts**
- Configurable alerts for:
- Specific patterns (e.g., IOI, OII, IOO).
- Bar range exceeding a user-defined threshold.
- Bullish or bearish streaks.
#### 13. **Gap Detector**
- Identifies gaps between bars and marks them with shaded boxes.
- Bullish gaps are shaded green, while bearish gaps are shaded red.
#### 14. **Advanced Customization**
- Extensive user inputs allow traders to tailor the indicator to their trading style.
- Includes support for various levels of detail (e.g., debug mode, label visibility, etc.).
#### 15. **ZigZag and Wedge Patterns**
- Optional zigzag lines to connect swing highs and lows.
- Detects wedge patterns using customizable settings for pivot points and angle differences.
---
### **Use Case Scenarios**
1. **Trend Identification**: Use multi-timeframe EMAs to confirm overall market direction.
2. **Range Trading**: Trade within ranges using detected inside and outside bars as key levels.
3. **Breakout Trading**: Use patterns like IOI and OII to anticipate breakouts.
4. **Scalping**: Exploit bullish and bearish streaks or micro gaps for quick trades.
5. **Pattern-Based Alerts**: Set up alerts for specific market conditions or candlestick patterns.
### **Why This Indicator Is Useful**
- Combines multiple trading tools into a single, customizable script.
- Saves time by automating complex calculations and pattern detections.
- Improves decision-making with clear visual cues and configurable alerts.
Let me know if you'd like any additional explanations or adjustments!

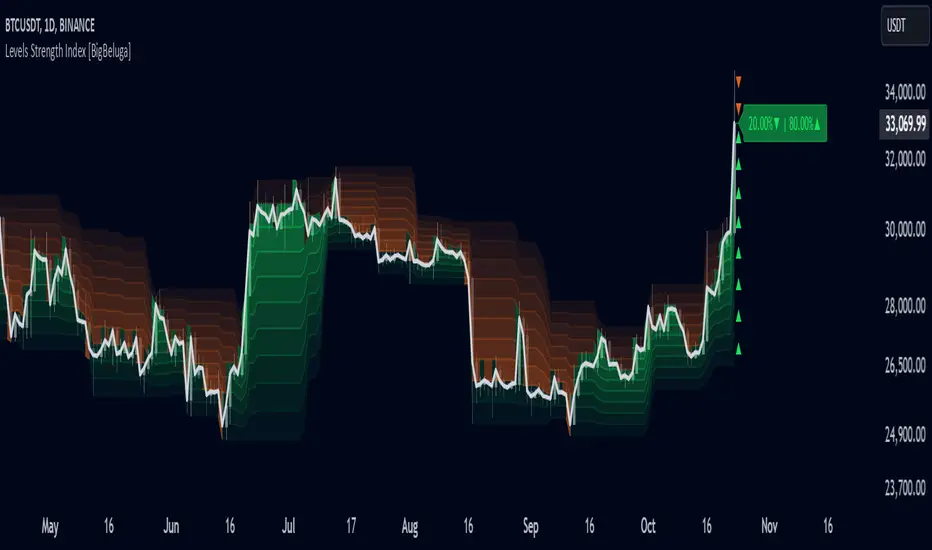
Levels Strength Index [BigBeluga]Levels Strength Index provides a unique perspective on market strength by comparing price positions relative to predefined levels, delivering a dynamic probability-based outlook for potential up and down moves.
🔵 Idea:
The Levels Strength Index analyzes the price position against a series of calculated levels, assigning probabilities for upward and downward movements. These probabilities are displayed in percentage form, providing actionable insights into market momentum and strength. The color-coded display visually reinforces whether the price is predominantly above or below key levels, simplifying trend analysis.
🔵 Key Features:
Dynamic Probability Calculation: The indicator compares the current price position relative to 10 predefined levels, assigning an "Up" and "Down" percentage. For example, if the price is above 8 levels, it will display 80% upward and 20% downward probabilities.
Color-Coded Trend Visualization: When the price is above the majority of levels, the display turns green, signaling strength. Conversely, when below, it shifts to orange, reflecting bearish momentum.
Clear Up/Down Probability Labels: Probabilities are displayed with directional arrows next to the price, instantly showing the likelihood of upward or downward moves.
Probability-Based Price Line: The price line is color-coded based on the probability percentages, allowing a quick glance at the prevailing trend and market strength. This can be toggled in the settings.
Customizable Transparency: Adjust the transparency of the levels to seamlessly integrate the indicator with your preferred chart setup.
Fully Configurable: Control key parameters such as the length of levels and price color mode (trend, neutral, or none) through intuitive settings.
🔵 When to Use:
The Levels Strength Index is ideal for traders looking to:
Identify strong upward or downward market momentum using quantified probabilities.
Visualize price strength relative to key levels with intuitive color coding.
Supplement existing level-based strategies by combining probabilities and market positioning.
Gain instant clarity on potential market moves with percentage-based insights.
Whether you're trading trends or ranges, this tool enhances decision-making by combining level-based analysis with a dynamic probability system, offering a clear, actionable perspective on market behavior.
Key Zone LocatorThe "Key Locator" indicator identifies important price levels on a chart by analyzing historical data. It does this by:
Counting Touches: It calculates how many times the price touches each level within a specified period. This helps identify levels that the market frequently interacts with, which can indicate significant support or resistance.
Measuring Volume: It also sums up the trading volume at each level during the same period. High volume at a particular level can suggest strong interest or activity, making that level more significant.s based on historical market activity.
By combining these two metrics—touches and volume—the indicator highlights the most important price level on the chart, helping traders make informed decisions based on where the market has shown significant activity in the past.
Level Calculation:
The indicator first identifies the highest and lowest prices over a specified period, which is determined by the length parameter. It then divides this price range into 200 equal segments, creating potential key levels across the chart. Each segment represents a level where the price might show significant activity.
Metric Calculation:
For each of these levels, the indicator calculates two key metrics. First, it counts how many times the price touches or crosses each level during the specified period. Second, it sums up the trading volume associated with these touches at each level. This dual analysis helps in identifying levels that are not only frequently interacted with but also have substantial trading activity.
Normalization:
To facilitate comparison between different levels, the indicator normalizes both the touch count and the volume for each level to a scale from 0 to 10. This involves dividing each metric by its maximum observed value in the period and scaling it accordingly, ensuring that both metrics are on a comparable scale.
Scoring and Balancing:
Each level is assigned a score based on a weighted average of its normalized touch and volume scores. The weight_balance parameter allows users to adjust the emphasis between touches and volume. A higher weight on touches will prioritize levels frequently interacted with, while more emphasis on volume will highlight levels with significant trading activity.
Identify Key Level:
Finally, the indicator identifies the level with the highest combined score as the most significant. This key level is plotted on the chart in red, providing traders with a visual indication of potential areas of support or resistance based on historical data.
This comprehensive approach allows traders to pinpoint where crucial market activity has occurred, aiding them in making strategic decisions based on historical price behavior and trading volumes.
Please note that while the "Key Locator" indicator provides valuable insights based on historical data, it does not guarantee future performance or outcomes. Trading involves risks, and it's important to use this tool in conjunction with other analysis methods and risk management strategies. Always consider your financial situation and consult with a financial advisor if necessary before making trading decisions.

Advanced Volume-Driven Breakout SignalsThe "Advanced Volume-Driven Breakout Signals" indicator is a cutting-edge tool designed to help traders identify high-potential trading opportunities through sophisticated volume analysis techniques. This indicator integrates volume flow analysis, moving averages, and Relative Volume (RVOL) to provide a comprehensive view of market conditions, going beyond traditional Volume Spread Analysis (VSA) methods.
Key Features:
Volume Flow Analysis: Distinguishes bullish and bearish volume flows with distinct colors, making it easier to visualize market sentiment and potential breakout points.
Volume Flow Moving Averages: Calculates moving averages for volume using various methods (SMA, EMA, WMA, HMA, VWMA), accommodating different trading strategies. This includes settings for adjusting the type of moving average and its period, as well as thresholds for high, medium, and low volume levels.
Volume Spikes Detection: Identifies significant volume spikes based on user-defined multipliers and moving averages, highlighting unusual trading activity.
Volume MA Cloud Settings: Computes general moving averages of volume to track trends and detect deviations. This feature includes options to select different moving average types and adjust thresholds for detecting high volume activity.
Relative Volume (RVOL): Measures current volume relative to historical averages, triggering signals when RVOL exceeds predefined thresholds, indicating notable changes in trading activity.
Entry Conditions: Provides clear long and short entry signals based on combined volume flow conditions and RVOL, offering actionable trading opportunities.
Volume Visualization:
— Bullish Volume Flow: Light and dark green bars indicate bullish volume flow.
— Bearish Volume Flow: Light and dark red bars denote bearish volume flow.
— High Volume Bars: Highlighted in yellow, and extreme volume bars in orange for additional context. These bars are plotted for visual aid and do not directly influence trade signals, focusing instead on the quality and strength of the volume flow.
Alerts: Allows users to create alert notifications for long and short entry signals when the criteria are met, enabling traders to respond promptly to trading opportunities.
Usage:
Overlay: Apply the indicator directly to your price chart to visualise real-time signals and volume conditions.
Customisable: Adjust settings for moving averages, RVOL, and other parameters to match your trading strategy and preferences.
Comparison to VSA Scripts: The "Advanced Volume-Driven Breakout Signals" indicator extends beyond traditional VSA scripts by incorporating a wider range of analytical features. While VSA primarily focuses on volume spread patterns and price action, this indicator offers enhanced functionality with advanced RVOL metrics, customizable moving averages, and detailed volume spike detection, making it a more versatile tool for identifying breakout opportunities and managing trades. It is particularly effective when used alongside key levels and order blocks.
Acknowledgements: Special thanks to @oh92 and @goofoffgoose for their invaluable scripts, which served as inspiration in the development of this advanced trading indicator.
Notes: The script is continually evolving, with ongoing refinements aimed at enhancing accuracy and performance.

Previous and Premarket High/Low IndicatorDescription:
The "Previous and Premarket High/Low" indicator is designed to help traders identify key levels during the premarket, postmarket, and regular trading sessions. It highlights the highest and lowest prices during the premarket session and the previous trading day, providing critical levels for intraday trading strategies.
Features:
Customizable Display Settings: Users can adjust the colors, line styles, and line widths for the premarket and previous day high/low levels.
Session Labels: Clear labels indicating premarket and postmarket sessions for easy identification.
Alerts: Set alerts for significant price movements, such as new highs or lows during premarket and previous trading sessions.

EMA MTF PlusI like trading the 1 minute and 3 minutes time-frames. I'm what is commonly called a "scalper". Long term investments yes, I have some, but for trading, I don't have neither the time,
nor the patience to wait hours or days for my trade to be complete.
This doesn't mean I discount the higher time-frames, no, I actually rely heavily on them. I found that EMAs do a decent job as support/resistance, sometimes to a tick level of precision. And this is important for a 1 minute trader.
As such, I made this script that tracks the higher time-frames EMAs and displays the last value as a line.
I do not need the whole EMA, I'm not interested in crossovers or crossunders, these are anyway late signals for me.
What's with the triangles? These are local tops/bottoms , candles that have a have decent size of the wick. These tops and bottoms are by no means "final", they are merely a rejection at certain levels of price. Due to markets complexities (and human erratic behaviors hehe) these levels could be breached at the very next candle. For a more "final" version (nothing is really final but..) I added Schaff Trend Cycle as filter, so a triangle will pop only when a trend is mature enough ( STC with a value near 0 or near 100).
Colored bars. When the body of the candle is big, it shows strength. Strong bars tend to have follow through, especially when breaking key levels. The script looks at the body of the candle and compares it with ATR (Average True Range), if it's at least 0.8 of ATR it changes the bar color to yellow (bull candles) or fuchsia(bear candles).
Range identifier. This code is copied from Lazy Bear (if there are any issues please let me know), it's very useful in conjunction with colored bars.
I look for breakout candles that go outside of the range as a signal for a trade.
There are many ways in which this script can be useful, like trading mean reversions or momentum trades (breakouts) or simply trend following trades.
I hope you guys find it useful, you can play with default values and change them as you like, these are what I found to be working best for me and my trading universe (mostly crypto).
Special thanks for the original work of:
LazyBear
everget
Jim8080

Chart Wolf WLR Toolkit (VWAP + PDH/PDL + Kill Zone)Overview
This indicator is a single, unified trading framework that combines context → levels → confirmation → execution into one workflow. It is not a “mashup” of unrelated indicators — each component feeds the next step of the decision process so you can make the same type of decision every day with less chart clutter.
What makes it original
Most indicators independently display signals (trend, sessions, levels, etc.). This script is original in that it links components into a structured sequence:
Context (where and when): identifies market session/time context and key reference zones.
Key Levels (what matters): plots specific levels that price reacts to (e.g., previous day levels, value area levels, VWAP / anchors, etc.).
Confirmation (why now): requires price behavior to confirm acceptance/rejection around those levels instead of firing signals randomly.
Execution (how to trade it): provides clear entry/exit visualization and risk reference points once confirmation conditions are met.
How it works (conceptual logic)
The script follows a simple cause-and-effect model:
Reference levels define “decision areas” (places where liquidity and reactions commonly happen).
Price interacting with a decision area triggers state tracking (e.g., approaching level → testing level → rejection/acceptance).
A signal only appears when a complete sequence occurs (example: sweep/test → rejection/acceptance confirmation → continuation cue).
Optional filters (session, volatility, trend bias, etc.) reduce low-quality signals by requiring trades to occur in the intended conditions.
How to use it (step-by-step)
Choose your market & timeframe
Recommended: use a higher timeframe for context, lower timeframe for entries.
Example workflow: 15m for context + 5m/1m for execution.
Mark the decision areas
Use the plotted levels as “zones of interest.”
Your job is to wait for price to interact with these zones.
Wait for confirmation
Only take signals that occur at or near decision areas.
If price is chopping in the middle (between key levels), avoid trading.
Execute with defined risk
Stops should be placed beyond the rejection/sweep point or beyond the decision zone (depending on your strategy).
Targets can be the next major level plotted by the script.
Settings (what to adjust)
Session filter: turn on if you only trade specific hours (e.g., NY open).
Level visibility: hide levels you don’t use to reduce clutter.
Signal strictness: increase strictness to reduce frequency and improve quality; decrease for more signals.
Alerts: enable alerts for confirmed signals only (recommended).
Best practices
This tool performs best when you treat signals as confirmation, not “auto-trades.”
Always prioritize trades that occur at major levels during high-liquidity hours.
Backtest your market/timeframe combo before using it live.
Notes / limitations
Like all indicators, it does not predict the future; it organizes decision-making around recurring market behaviors.
Signals can appear during news volatility; consider disabling trading during major scheduled events.

Alpha Options System# Apex Options Sniper - Advanced Multi-Signal Day Trading System
## 🎯 Overview
**Apex Options Sniper** is a professional-grade, multi-signal trading indicator specifically engineered for high-probability day trading of weekly options. This comprehensive system combines 10+ technical indicators into a sophisticated scoring algorithm that identifies optimal entry points with institutional-level precision.
Perfect for traders of SPY, QQQ, and high-volume stocks, this indicator eliminates guesswork by providing clear BUY CALLS and BUY PUTS signals based on multiple technical confluences.
---
## 🚀 Key Features
### **Multi-Signal Confluence Engine**
- **10+ Technical Indicators** working in harmony
- **Weighted Scoring System** (0-30+ points) for signal strength
- **Real-time Signal Classification**: Strong vs Moderate signals
- **False Signal Reduction** through multi-confirmation requirements
### **Advanced Momentum Analysis**
- ✅ RSI with Divergence Detection (bullish & bearish)
- ✅ Stochastic Oscillator (oversold/overbought + crossovers)
- ✅ MACD with crossover and momentum confirmation
- ✅ Automatic divergence spotting for reversal trades
### **Sophisticated Trend Detection**
- ✅ Triple EMA System (9/21/50) with alignment scoring
- ✅ SuperTrend Indicator with trend flip alerts
- ✅ VWAP for institutional price levels
- ✅ Multi-timeframe trend confirmation
### **Professional Volume Analysis**
- ✅ Volume Spike Detection (vs 20-period average)
- ✅ OBV (On-Balance Volume) with divergence detection
- ✅ Order Flow Analysis (buy vs sell pressure)
- ✅ Relative volume ratio display
### **Advanced Pattern Recognition**
- ✅ Bollinger Band Squeeze detection (volatility expansion)
- ✅ BB breakout signals (major move initiation)
- ✅ Automatic Support & Resistance levels (pivot-based)
- ✅ Price reaction scoring at key levels
### **Built-in Risk Management**
- ✅ ATR-based Stop Loss calculations
- ✅ Customizable Risk:Reward ratios
- ✅ Position sizing recommendations
- ✅ Real-time profit target calculations
### **Comprehensive Visual Dashboard**
- ✅ Live scoring breakdown for all indicators
- ✅ Individual signal strength display
- ✅ Bull vs Bear score comparison
- ✅ Color-coded signal status
- ✅ Risk management metrics
---
## 📊 How It Works
### **Scoring System**
The indicator assigns points based on technical conditions:
| **Category** | **Max Points** | **Conditions** |
|-------------|---------------|----------------|
| Momentum (RSI/Stoch) | 8 | Oversold/overbought + divergences |
| MACD | 4 | Crossovers + momentum direction |
| Trend (EMAs) | 6 | EMA alignment + SuperTrend |
| Volume | 4 | Spikes + OBV divergences |
| Order Flow | 2 | Buy/sell pressure imbalance |
| Bollinger Bands | 2 | Squeeze + breakouts |
| Support/Resistance | 2 | Price at key levels |
| VWAP | 1 | Above/below institutional level |
### **Signal Thresholds**
- **🚀 STRONG CALLS**: Bull score ≥6, Net score ≥4
- **📈 CALLS**: Bull score ≥4, Net score ≥2
- **🔥 STRONG PUTS**: Bear score ≥6, Net score ≤-4
- **📉 PUTS**: Bear score ≥4, Net score ≤-2
### **Multi-Timeframe Filter**
Optional higher timeframe confirmation reduces false signals by ensuring the broader trend supports your trade direction.
---
## 🎮 How to Use
### **Installation**
1. Open TradingView Pine Editor
2. Paste the complete indicator code
3. Click "Add to Chart"
4. Customize settings to your preference
### **Recommended Settings**
**For SPY/QQQ Day Trading:**
- Timeframe: 1-minute or 5-minute
- Strong Signal Threshold: 6
- Moderate Signal Threshold: 4
- Multi-timeframe Confluence: ON
**For Individual Stocks:**
- Timeframe: 5-minute or 15-minute
- Increase SuperTrend multiplier to 3.5-4.0
- Enable all advanced features
**For Scalping:**
- Timeframe: 1-minute
- Use STRONG signals only (6+)
- Tight stop loss (1.0-1.5 ATR multiplier)
### **Best Trading Times**
- **9:30-11:00 AM EST** - Highest volume, strongest signals
- **2:00-4:00 PM EST** - Afternoon momentum plays
- Avoid 11:30 AM-1:30 PM EST (lunch chop)
---
## 📈 Signal Interpretation
### **What You'll See on Chart:**
**Visual Signals:**
- 🟢 **Green Triangle (CALLS)**: Bullish entry point
- 🟢 **Large Green Triangle (STRONG CALLS)**: High-confidence bullish entry
- 🔴 **Red Triangle (PUTS)**: Bearish entry point
- 🔴 **Large Red Triangle (STRONG PUTS)**: High-confidence bearish entry
- 💎 **Small Diamonds**: RSI/OBV divergences (reversal warning)
**Dashboard Information:**
- Individual indicator values and signals
- Real-time score breakdown
- Bull/Bear score totals
- ATR stop loss levels
### **Entry Rules:**
✅ **High Probability Trades (Take These):**
- Strong signal (6+ score)
- 3+ indicators confirming
- Volume spike present
- SuperTrend aligned
- Higher timeframe confirms
⚠️ **Moderate Trades (Smaller Position):**
- Moderate signal (4-5 score)
- 2+ indicators confirming
- Normal volume
- Mixed trend signals
❌ **Avoid These:**
- Conflicting signals (Bull score ≈ Bear score)
- Low volume
- During major news events
- Bollinger squeeze without breakout direction
---
## 🛡️ Risk Management Guide
### **Position Sizing:**
- **Strong Signals (6+)**: 3-5% of portfolio
- **Moderate Signals (4-5)**: 2-3% of portfolio
- **Low Conviction**: 1-2% or skip
### **Stop Loss Strategy:**
- Use ATR-based stops (displayed in dashboard)
- Default: 1.5x ATR from entry
- Weekly options: 30-50% premium loss maximum
- Never hold through stop loss hoping for recovery
### **Profit Targets:**
- **Quick Scalps**: 25-50% gain (15-30 min)
- **Day Trades**: 50-100% gain (same day exit)
- **Swing**: 100-200% gain (1-2 days max for weeklies)
- **Take partial profits** at first target, let rest run
### **Time Decay Management (Weekly Options):**
- Monday-Wednesday: Hold overnight acceptable on strong signals
- Thursday: Close by EOD unless very strong conviction
- Friday: Avoid holding overnight, theta decay accelerates
---
## 🔔 Alert Configuration
### **Recommended Alerts:**
**Essential Alerts:**
1. 🚀 Strong Buy Calls
2. 🔥 Strong Buy Puts
**Advanced Alerts:**
3. 💎 RSI Bullish Divergence
4. ⚠️ RSI Bearish Divergence
5. 🔶 Bollinger Band Squeeze
6. ✅ SuperTrend Bull Flip
7. ❌ SuperTrend Bear Flip
**Alert Setup:**
- Set frequency: "Once Per Bar Close"
- Enable for all devices
- Use webhook for automation (optional)
---
## 💡 Pro Trading Tips
### **Maximize Win Rate:**
1. **Wait for confluence** - Best trades have 3+ indicators aligned
2. **Respect the dashboard** - Check WHY it's signaling (which indicators)
3. **Volume is king** - Signals with volume spikes are significantly more reliable
4. **Use BB Squeeze** - When squeeze + signal = explosive directional move
5. **SuperTrend flips** - Major trend change confirmations, very powerful
6. **Watch for divergences** - Diamond markers = hidden reversal opportunities
### **Common Mistakes to Avoid:**
❌ Trading every signal (be selective)
❌ Ignoring volume (volume confirms everything)
❌ Fighting the higher timeframe trend
❌ Oversizing positions on moderate signals
❌ Holding weekly options too long (theta decay)
❌ Trading during lunch hour (11:30-1:30 EST)
### **Advanced Techniques:**
- **Divergence + Support/Resistance** = Highest probability reversals
- **BB Squeeze + EMA alignment** = Explosive trend continuations
- **SuperTrend flip + Volume spike** = Major trend change entries
- **Multiple timeframe analysis** - Check 5m signal on 1m chart for precision entries
---
## 📊 Indicator Components Explained
### **RSI (Relative Strength Index)**
- Measures momentum and overbought/oversold conditions
- Divergences signal potential reversals before they happen
- Score: 2-3 points for extremes and divergences
### **Stochastic Oscillator**
- Confirms momentum extremes
- Crossovers provide entry timing
- Score: 1-2 points
### **MACD (Moving Average Convergence Divergence)**
- Trend following momentum indicator
- Crossovers signal momentum shifts
- Score: 1-3 points based on signal strength
### **EMA System (9/21/50)**
- Dynamic support and resistance
- Alignment shows trend strength
- Price position relative to EMAs scores 1-2 points
### **SuperTrend**
- Volatility-based trend indicator
- Reduces whipsaws in choppy conditions
- Trend flips are major signals (2 points)
### **Bollinger Bands**
- Volatility measurement
- Squeeze = calm before the storm
- Breakouts = directional move initiation (2 points)
### **Volume Analysis**
- Confirms price movement legitimacy
- Spikes validate signals (2 points)
- OBV divergences predict reversals (2 points)
### **Order Flow**
- Buy vs sell pressure measurement
- Institutional footprint detection
- Score: 2 points for strong imbalances
---
## 🎓 Learning Path
### **Beginner (Week 1-2):**
- Use STRONG signals only
- Focus on high-volume stocks (SPY/QQQ)
- Trade only first hour of market
- Use paper trading first
### **Intermediate (Week 3-4):**
- Add moderate signals to your arsenal
- Learn to read the dashboard
- Understand why each signal triggers
- Start combining with support/resistance
### **Advanced (Month 2+):**
- Use divergence signals
- Trade BB squeeze breakouts
- Optimize settings for your style
- Develop your own confluence rules
---
## ⚙️ Customization Guide
### **Adjustable Parameters:**
**Momentum Settings:**
- RSI Length (default: 14)
- RSI Oversold/Overbought levels (30/70)
- Stochastic Length (14)
**Trend Settings:**
- EMA periods (9/21/50)
- SuperTrend ATR Length (10)
- SuperTrend Multiplier (3.0)
**Volume Settings:**
- Volume MA Length (20)
- Volume Spike Threshold (1.5x)
**Advanced Settings:**
- Bollinger Band Length (20)
- BB Standard Deviation (2.0)
- Pivot Lookback (10)
**Signal Thresholds:**
- Strong Signal Score (default: 6)
- Moderate Signal Score (default: 4)
**Risk Management:**
- ATR Length (14)
- Stop Loss Multiplier (1.5)
- Risk:Reward Ratio (2.0)
---
## 📈 Performance Optimization
### **For Volatile Markets (VIX > 25):**
- Increase SuperTrend multiplier to 4.0
- Raise signal thresholds (+1 point)
- Tighten stop losses (1.0-1.2 ATR)
### **For Ranging Markets:**
- Focus on RSI extremes and divergences
- Use BB squeeze signals
- Ignore moderate signals
- Wait for support/resistance confirmation
### **For Trending Markets:**
- Follow SuperTrend direction religiously
- Use EMA alignment signals
- Allow wider stops (2.0 ATR)
- Take partial profits, let winners run
---
## 🔍 Troubleshooting
**Too Many Signals:**
- Increase signal thresholds to 7/5
- Enable multi-timeframe filter
- Trade only STRONG signals
**Missing Signals:**
- Decrease thresholds to 5/3
- Disable multi-timeframe filter
- Check that all features are enabled
**Whipsaw in Choppy Markets:**
- Increase SuperTrend multiplier
- Require volume spike confirmation
- Avoid trading 11:30 AM-1:30 PM EST
---
## 🏆 Best Practices
✅ **Always check:**
1. Dashboard shows why signal triggered
2. Volume confirms the move
3. Not during news events
4. Adequate time until expiration
✅ **Risk Management:**
1. Never risk more than 2% per trade
2. Use stops religiously
3. Take profits at targets
4. Don't revenge trade
✅ **Journal Your Trades:**
1. Entry price and signal strength
2. Which indicators triggered
3. Exit price and profit/loss
4. What worked and what didn't
---
## 📞 Support & Updates
This indicator is designed to evolve with market conditions. Recommended to:
- Review settings monthly
- Backtest on your favorite instruments
- Adjust thresholds based on your risk tolerance
- Keep a trading journal to track performance
---
## ⚠️ Disclaimer
This indicator is a tool for technical analysis and should not be used as the sole basis for trading decisions. Options trading involves substantial risk and is not suitable for all investors. Past performance does not guarantee future results. Always:
- Do your own research and due diligence
- Never invest more than you can afford to lose
- Consider consulting with a financial advisor
- Practice with paper trading before using real money
- Understand options Greeks (Delta, Theta, Gamma, Vega)
- Be aware of earnings dates and major news events
**No indicator is 100% accurate. Use proper risk management and trade responsibly.**
---
## 📊 Version History
**v1.0 - Initial Release**
- Multi-signal confluence system
- 10+ technical indicators
- Advanced dashboard
- ATR-based risk management
- Comprehensive alert system
---
## 🎯 Final Thoughts
**Apex Options Sniper** transforms complex technical analysis into clear, actionable signals. By combining multiple proven indicators with sophisticated scoring logic, it helps traders identify high-probability setups while managing risk effectively.
**Success Keys:**
- Quality over quantity (be selective)
- Risk management is everything
- Volume confirms the signal
- Confluence increases probability
- Discipline beats emotion
**Trade smart. Trade with confidence. Trade with Apex Options Sniper.**
---
*For questions, suggestions, or to share your success stories, please comment below or send a message.*
**Happy Trading! 🚀📈**

Quantrader📊 Overview
This custom indicator combines intraday session analysis with multi-timeframe trend confirmation to identify high-probability trading opportunities. It features:
Custom intraday session tracking (GMT+7 timezone)
Multi-level moving average confluence (SMA 20, 100, 200)
Bollinger Bands mean reversion signals
Key intraday reference levels
⚙️ Core Components
1. Custom Intraday Session Tracking
Session Start: 7:00 AM GMT+7 (Vietnamese market open)
Calculates per session:
Intraday High/Low (resets at 7:00 AM daily)
Intraday Midline = (Session High + Session Low) / 2
Pre-Day Center = Previous day's midline (carried forward)
Open Day = First 15-minute candle's open price
2. Trend Analysis Framework
SMA 20 (Short-term momentum)
SMA 100 (Medium-term trend)
SMA 200 (Long-term trend direction)
Bollinger Bands (20-period, 2 standard deviations)
3. Signal Detection Logic
Bullish Mean Reversion Setup:
javascript
Condition 1: Green candle closes ABOVE Upper Bollinger Band
Condition 2: Following candle is ALSO green
→ Triggers: Green highlight + Triangle below bar
Bearish Mean Reversion Setup:
javascript
Condition 1: Red candle closes BELOW Lower Bollinger Band
Condition 2: Following candle is ALSO red
→ Triggers: Red highlight + Triangle above bar
🎯 Visual Elements
Element Color Description
Intraday Midline Blue Real-time session midpoint
Pre-Day Center Yellow Yesterday's midline (reference)
Open Day Purple (dashed) Day's opening price
SMA 20 Red Short-term trend
SMA 100 Green Medium-term trend
SMA 200 Orange Long-term trend
Bollinger Bands Red/Green/Blue Volatility boundaries
Bull Signal Green triangle ↓ Oversold bounce potential
Bear Signal Red triangle ↑ Overbought rejection potential
📈 Trading Applications
1. Trend Confirmation
Bullish Alignment: Price > All SMAs + Above Intraday Midline
Bearish Alignment: Price < All SMAs + Below Intraday Midline
2. Mean Reversion Opportunities
Overbought Scenario: Consecutive green candles above Upper BB → Potential reversal
Oversold Scenario: Consecutive red candles below Lower BB → Potential bounce
3. Intraday Level Trading
Intraday Midline: Dynamic support/resistance
Pre-Day Center: Psychological reference level
Open Day: Key opening price level
⚡ Key Features
Automatic Session Reset: Daily at 7:00 AM GMT+7
Multi-Timeframe Confluence: Combines intraday, daily, and trend analysis
Clean Visual Design: Non-cluttered, focused on key levels
Real-Time Calculation: All levels update with each new candle
🛠️ Recommended Settings
Timeframe: 15-minute to 1-hour charts
Markets: Forex, Indices, Commodities
Best Pairs: EURUSD, XAUUSD, VN30, USDJPY
Trading Style: Swing trading, Day trading
📖 Usage Tips
Trend Trading: Enter in direction of SMA alignment (20 > 100 > 200 for bullish)
Mean Reversion: Use BB signals at key intraday levels (Midline, Pre-Day Center)
Confirmation: Wait for candle close above/below key levels
Risk Management: Place stops beyond opposite intraday extreme
🎨 Customization Options
Users can modify:
Session start time (line 6)
Bollinger Band parameters (length, multiplier)
SMA periods
Color schemes

One for AllOne for All (OFA) - Complete ICT Analysis Suite
Version 3.3.0 by theCodeman
📊 Overview
One for All (OFA) is a comprehensive TradingView indicator designed for traders who follow Inner Circle Trader (ICT) concepts. This all-in-one tool combines essential ICT analysis features—sessions, kill zones, previous period levels, and higher timeframe candles with Fair Value Gaps (FVGs) and Volume Imbalances (VIs)—into a single, highly customizable indicator. Whether you're a beginner learning ICT concepts or an experienced trader refining your edge, OFA provides the visual structure needed for precise market analysis and execution.
✨ Key Features
- 🏷️ Customizable Watermark**: Display your trading identity with customizable titles, subtitles, symbol info, and full style control
- 🌍 Trading Sessions**: Visualize Asian, London, and New York sessions with high/low lines, range boxes, and open/close markers
- 🎯 Kill Zones**: Highlight 5 critical ICT kill zones with precise timing and visual boxes
- 📈 Previous Period H/L**: Track Daily, Weekly, and Monthly highs/lows with customizable styles and lookback periods
- 🕐 Higher Timeframe Candles**: Display up to 5 HTF timeframes with OHLC trace lines, timers, and interval labels
- 🔍 FVG & VI Detection**: Automatically detect and visualize Fair Value Gaps and Volume Imbalances on HTF candles
- ⚙️ Universal Timezone Support**: Works globally with GMT-12 to GMT+14 timezone selection
- 🎨 Full Customization**: Control colors, styles, visibility, and layout for every feature
🚀 How to Use
Watermark Setup
The watermark overlay helps you identify your charts and maintain focus on your trading principles:
1. Enable/disable watermark via "Show Watermark" toggle
2. Customize the title (default: "Name") to display your trading name or account identifier
3. Set up to 3 subtitles (default: "Patience", "Confidence", "Execution") as trading reminders
4. Choose position (9 locations available), size, color, and transparency
5. Toggle symbol and timeframe display as needed
Use Case: Display your trading principles or account name for multi-monitor setups or content creation.
Trading Sessions Analysis
Sessions define market character and liquidity availability:
1. Enable "Show All Sessions" to visualize all three sessions
2. Adjust timezone to match your local market (default: UTC-5 for EST)
3. Customize session times if needed (defaults cover standard hours)
4. Enable session range boxes to see consolidation zones
5. Use session high/low lines to identify key levels for the current session
6. Enable open/close markers to track session transitions
Use Case: Identify which session you're trading in, track session highs/lows for liquidity, and anticipate session transition volatility.
Kill Zones Trading
Kill zones are ICT's high-probability trading windows:
1. Enable individual kill zones or use "Show All Kill Zones"
2. **Asian Kill Zone** (2000-0000 GMT): Early positioning and smart money accumulation
3. **London Kill Zone** (0300-0500 GMT): European market opening volatility
4. **NY AM Kill Zone** (0930-1100 EST): Post-NYSE open expansion
5. **NY Lunch Kill Zone** (1200-1300 EST): Midday consolidation or manipulation
6. **NY PM Kill Zone** (1330-1600 EST): Afternoon positioning and closes
7. Customize colors and times to match your trading style
8. Set max days display to control historical visibility (default: 30 days)
Use Case: Focus entries during high-probability windows. Watch for liquidity sweeps at kill zone openings and institutional positioning.
Previous Period High/Low Levels
Previous period levels act as magnetic price targets and support/resistance:
1. Enable Daily (PDH/PDL), Weekly (PWH/PWL), or Monthly (PMH/PML) levels individually
2. Set lookback period (how many previous periods to display)
3. Choose line style: Solid (current emphasis), Dashed (standard), or Dotted (subtle)
4. Customize colors per timeframe for visual hierarchy
5. Adjust line width (1-5) for visibility preference
6. Enable gradient effect to fade older periods
7. Position labels left or right based on chart layout
8. Customize label text for your preferred notation
Use Case: Identify key levels where price is likely to react. Daily levels work on intraday timeframes, Weekly on daily charts, Monthly for swing trading.
Higher Timeframe (HTF) Candles
HTF candles reveal the larger market context while trading lower timeframes:
1. Enable up to 5 HTF slots simultaneously (default: 5m, 15m, 1H, 4H, Daily)
2. Choose display mode: "Below Chart" (stacked rows) or "Right Side" (compact column)
3. Customize timeframe, colors (bull/bear), and titles for each slot
4. **OHLC Trace Lines**: Visual lines connecting HTF candle levels to chart bars
5. **HTF Timer**: Countdown showing time remaining until HTF candle close
6. **Interval Labels**: Display day of week (Daily+) or time (intraday) on each candle
7. For Daily candles: Choose open time (Midnight, 8:30, 9:30) to match your market structure preference
Use Case: Trade lower timeframes while respecting higher timeframe structure. Watch for HTF candle closes to confirm directional bias.
FVG & VI Detection
Fair Value Gaps and Volume Imbalances highlight inefficiencies that price often revisits:
1. **Fair Value Gaps (FVGs)**: Detected when HTF candle wicks don't overlap between 3 consecutive candles
- Bullish FVG: Gap between candle 1 high and candle 3 low (green box by default)
- Bearish FVG: Gap between candle 1 low and candle 3 high (red box by default)
2. **Volume Imbalances (VIs)**: Similar detection but focuses on body gaps
- Bullish VI: Gap between candle 1 close and candle 3 open
- Bearish VI: Gap between candle 1 open and candle 3 close
3. Enable FVG/VI detection per HTF slot individually
4. Customize colors and transparency for each imbalance type
5. Boxes appear on chart at formation and remain visible as retracement targets
**Use Case**: Identify high-probability retracement zones. Price often returns to fill FVGs and VIs before continuing the trend. Use as entry zones or profit targets.
🎨 Customization
OFA is built for flexibility. Every feature includes extensive customization options:
Visual Customization
- **Colors**: Independent color control for every element (sessions, kill zones, lines, labels, FVGs, VIs)
- **Transparency**: Adjust box and label transparency (0-100%) for clean charts
- **Line Styles**: Choose Solid, Dashed, or Dotted for previous period lines
- **Sizes**: Control text size, line width, and box borders
- **Positions**: Place watermark in 9 positions, labels left/right
Layout Control
- **HTF Display Mode**: "Below Chart" for detailed analysis, "Right Side" for space efficiency
- **Drawing Limits**: Set max days for sessions/kill zones to manage chart clutter
- **Lookback Periods**: Control how many previous periods to display (1-10)
- **Gradient Effects**: Enable fading for older previous period lines
Timing Adjustments
- **Timezone**: Universal GMT offset selector (-12 to +14) for global markets
- **Session Times**: Customize each session's start/end times
- **Kill Zone Times**: Adjust kill zone windows to match your market's characteristics
- **Daily Open**: Choose Midnight, 8:30, or 9:30 for Daily HTF candle open time
💡 Best Practices
1. Start Simple: Enable one feature at a time to learn how each element affects your analysis
2. Match Your Timeframe: Use Daily levels on intraday charts, Weekly on daily charts, HTF candles one or two levels above your trading timeframe
3. Kill Zone Focus: Concentrate your trading activity during kill zones for higher probability setups
4. HTF Confirmation: Wait for HTF candle closes before committing to directional bias
5. FVG/VI Entries: Look for price to return to unfilled FVGs/VIs for entry opportunities with favorable risk/reward
6. Customize Colors: Use a consistent color scheme that matches your chart theme and reduces visual fatigue
7. Reduce Clutter: Disable features you're not actively using in your current trading plan
8. Session Context: Understand which session controls the market—trade with session direction or anticipate reversals at session transitions
⚙️ Settings Guide
OFA organizes settings into logical groups for easy navigation:
- **═══ WATERMARK ═══**: Title, subtitles, position, style, symbol/timeframe display
- **═══ SESSIONS ═══**: Enable/disable sessions, times, colors, high/low lines, boxes, markers
- **═══ KILL ZONES ═══**: Individual kill zone toggles, times, colors, max days display
- **═══ PREVIOUS H/L - DAILY ═══**: Daily high/low lines, style, color, lookback, labels
- **═══ PREVIOUS H/L - WEEKLY ═══**: Weekly high/low lines, style, color, lookback, labels
- **═══ PREVIOUS H/L - MONTHLY ═══**: Monthly high/low lines, style, color, lookback, labels
- **═══ HTF CANDLES ═══**: Global display mode, layout settings
- **═══ HTF SLOT 1-5 ═══**: Individual HTF configuration (timeframe, colors, title, FVG/VI detection, trace lines, timer, interval labels)
Each setting includes tooltips explaining its function. Hover over any input for detailed guidance.
📝 Final Notes
One for All (OFA) represents a complete ICT analysis toolkit in a single indicator. By combining watermark customization, session visualization, kill zone highlighting, previous period levels, and higher timeframe candles with FVG/VI detection, OFA eliminates the need for multiple indicators cluttering your chart.
**Version**: 3.3.0
**Author**: theCodeman
**Pine Script**: v6
**License**: Mozilla Public License 2.0
Start with default settings to learn the indicator's structure, then customize extensively to match your personal trading style. Remember: tools provide information, but your edge comes from disciplined execution of a proven strategy.
Happy Trading! 📈

Pivot Reversal Signals - Multi ConfirmationPivot Reversal Signals - Multi-Confirmation System
Overview
A comprehensive reversal detection indicator designed for daytraders that combines six independent technical signals to identify high-probability pivot points. The indicator uses a scoring system to classify signal strength as Weak, Medium, or Strong based on the number of confirmations present.
How It Works
The indicator monitors six key reversal signals simultaneously:
1. RSI Divergence - Detects when price makes new highs/lows but RSI shows weakening momentum
2. MACD Divergence - Identifies divergence between price action and MACD histogram
3. Key Level Touch - Confirms price is at significant support/resistance (previous day high/low, premarket high/low, VWAP, 50 SMA)
4. Reversal Candlestick Patterns - Recognizes bullish/bearish engulfing, hammers, and shooting stars
5. Moving Average Confluence - Validates bounces/rejections at stacked moving averages (9/20/50)
6. Volume Spike - Confirms increased participation (default: 1.5x average volume)
Signal Strength Classification
• Weak (3/6 confirmations) - Small circles for situational awareness only
• Medium (4/6 confirmations) - Regular triangles, viable entry signals
• Strong (5-6/6 confirmations) - Large triangles with background highlight, highest probability setups
Visual Features
• Entry Signals: Green triangles (up) for long entries, red triangles (down) for short entries
• Exit Warnings: Orange X markers when opposing signals appear
• Signal Labels: Show confirmation score (e.g., "5/6") and strength level
• Key Levels Displayed:
o Previous Day High/Low - Solid green/red lines (uses actual daily data)
o Premarket High/Low - Blue/orange circles (4:00 AM - 9:30 AM EST)
o VWAP - Purple line
o Moving Averages - 9 EMA (blue), 20 EMA (orange), 50 SMA (red)
• Background Tinting: Subtle color on strongest reversal zones
Key Level Detection
The indicator uses request.security() to accurately fetch previous day's high/low from daily timeframe data, ensuring precise level placement. Premarket high/low levels are dynamically tracked during premarket sessions (4:00 AM - 9:30 AM EST) and plotted throughout the trading day, providing critical support/resistance zones that often influence price action during regular hours.
Customizable Parameters
• Signal strength thresholds (adjust required confirmations)
• RSI settings (length, overbought/oversold levels)
• MACD parameters (fast/slow/signal lengths)
• Moving average periods
• Volume spike multiplier
• Toggle individual display elements (levels, MAs, labels)
Best Practices
• Use on 5-minute charts for entries, confirm on 15-minute for direction
• Focus on Medium and Strong signals; Weak signals provide context only
• Strong signals (5-6 confirmations) have the highest win rate
• Pay special attention to reversals at premarket high/low - these levels frequently hold
• Previous day high/low often acts as major support/resistance
• Always use proper risk management and stop losses
• Works best in moderately trending markets
Alert Capabilities
Set custom alerts for:
• Strong long/short signals
• All entry signals (medium + strong)
• Exit warnings for open positions
Ideal For
• Daytraders and scalpers (especially SPY, QQQ, and liquid equities)
• Swing traders seeking precise entries
• Traders who prefer confirmation-based systems
• Anyone looking to reduce false signals with multi-factor validation
• Traders who utilize premarket levels in their strategy
Technical Notes
• Uses Pine Script v6
• Premarket hours: 4:00 AM - 9:30 AM EST
• Previous day levels pulled from daily timeframe for accuracy
• Maximum 500 labels to maintain chart performance
• All key levels update dynamically in real-time
________________________________________
Note: This indicator provides signal analysis only and should be used as part of a complete trading strategy. Past performance does not guarantee future results. Always practice proper risk management.

Structure Pilot - Z&Z [Wang Indicators]Structure Pilot Zone & Zil is a complete suite of structure driven features that's build around pattern that can be visible around any timeframe.
Built in collaboration with Dave Teaches,
All these tools were shaped and combined together as the only toolkit Structure & DTFX traders want to have !
▫️ Structures & Zones ▫️
Zones are drawn when a break of structure (new high or low being created) or a market reversal happens.
It will highlight the last valid down move before a new high for bullish zones and the last valid up move before a new low for bearish zones.
These zones are used to analyze the market trend and to make entries into the market trend once the price retraces into these zones.
For example, with the latest bullish zones drawn in green for LTF zones and in blue for HTF zones, when the price retraces into this zone, there is a strong probability that the price will turn around to provide a buying opportunity all the way to the top of the zone or even higher.
These buying opportunities generally occur at specific retracement levels in the 30%, 50% and 70% zones, automatically represented by broken lines in the zones when they are created.
Example with bullish zones :
The aim with these zones is to find places on the chart where it's best to buy or sell, in order to take the biggest possible move while minimizing your risk.
Indeed, if the price is rising and a bullish zone has been created, I don't want to buy on the highs, preferring to wait for a retracement in my bullish zone to buy lower and reduce my risk, as the invalidation of the current trend will be found below the last protected low under the bullish zone drawn in blue for the HTF and in green for the LTF. Conversely, if the price is falling and a bearish zone has been created, I don't want to sell at the bottom. I'd rather wait for a retracement in the bearish zone to sell higher and reduce my risk, as the invalidation of the current trend will this time be above the last protected high above the bearish zone drawn in orange for the HTF and red for the LTF.
Example with bearish zones :
When it comes to market structure, it's good to know that zones recur within the same trend at a frequency of between 3 and 6 before there's a trend reversal.
So, after a certain number of successive zones, you can expect a reversal or the last protected high or low to be breached. The indicator automatically counts the number of successive zones, so you can keep track of the market and avoid surprises.
The zones are generated through the structure length. It can be increased to display larger (and more important) zones.
As we recommend keeping the default value (20) for new traders, experienced traders will find some success with other settings depending on their strategies.
Structure Pilot also provides auto HTF Zones, which is particularly useful to have a macro vision of the market.
Settings:
Swing types: Bullish only, Bearish only, both, or none
Structure length
Swing count: useful when it comes to tracking Trend strenght in any given time frame
Show Zones: Display boxes with 30%, 50%, and 70% fibs
Show HTF Zones: Display HTF zones with the same retracement configuration as the regular zones
Show 30%, 50% and 70%: Enable/disable these options to show or hide the corresponding fibs.
Box visibility, Line width & Line style: Style configuration for the zone
All settings can be activated or deactivated in the indicator parameters to suit individual needs and preferences.
30% Level : This is often considered a shallow retracement. If prices pull back to this level after an uptrend and flip in a lower timeframe, traders might view it as a strong sign of continued bullish momentum. Conversely, after a downtrend, this level could act as a temporary resistance where sellers might re-enter after a flip in a lower timeframe.
50% Level : This level is seen as a balance point or midpoint in the price move. A retracement to 50% can indicate a strong trend change or continuation.
70% Level : A retracement this deep can signal that the market might be losing steam or that the previous trend could be weakening. If the price bounces off this level, it might suggest that the trend is still in control but needed a more significant correction before moving further in its original direction.
We as structure traders prefer to take entry out of The 50% or when price retrace past it
there will be something at the level i'm looking for price to reverse from either some specific candles or imbalances.
Advanced traders might combine these levels with other tools or chart patterns that we bundle in this indicator.
▫️ ZIL ▫️
The ZIL Indicator is designed to automate the process of identifying key structural levels in the market and applying Fibonacci retracements when a significant price break occurs.
The indicator detects when a market structure (high or low) is broken and a candle closes below the previous low or above the previous high, indicating a potential trend shift or continuation.
• Tracks the break of structural lows or highs and waits for a confirmation candle that closes above or bellow the candle that set the new low.
Automated Fibonacci Retracement:
• Once the structure break is confirmed, the indicator automatically plots a Fibonacci retracement between:
• The high of the last bullish move (before the new low is set) or the low of the last bearish move (before the new high is set)
• The newly formed low after the structure break or the newly formed high after the structure break
Fibonacci levels plotted with colors :
• -0.27 : Dark red - Stop loss
• 0 : white - The new high/low - Potential entry
• 0.3, Orange 0.5, Light green 0.7: Green : Levels - Partial and take profit zones
• 1.15 pale blue - for your runner
We may long the retracement when the price is comming from a bearish zone using the ZIL to manage
Example :
Multi-Timeframe Support:
• Using the option "HTF ZIL" will display ZIL on higher timeframe (corresponding to the HTF Zones) on your charts to help traders find structural breaks and Fibonacci setups in both short-term and long-term markets.
HTF ZIL is really usefull to manage trades if the regular ZIL target get ran through
Wang use case :
HTF zill level are used when the small zill get ran through
▫️ Opening Range Tracker ▫️
The Opening Range Tracker is designed to help traders identify and track the opening range of a specified time period, specifically starting with the 144-minute candle between 8:24 AM and 10:48 AM. (default value) The indicator highlights this range and automatically plots key levels (30%, 50%, 70%) to provide potential strong reaction areas for trading. The time period for the opening range is fully customizable, allowing users to adjust it according to their strategy.
Opening range should be seen and used as a classic zone. If we trade above or below it price tend to come back into it and bounce of of the One or multiple level...
classic 30/50/70.
• Customizable Opening Range: Adapt the indicator to any market or session by changing the opening range time window.
• Precise Levels for Trading: The 30%, 50%, and 70% levels provide key zones where price may react, helping traders define entries, exits, or stop loss placements.
• Visual Clarity: The range box and levels make it easy to see the important price areas during the opening range and the rest of the trading session. If we range a lot in the opening range, we may range for the rest of the day. We should keep that in mind to avoid taking wrong decisions.
its basically a large zone that's we have seen often time price rejects from the level in it
Daily Reset: Each trading day resets the opening range, giving traders fresh data and new opportunities to capitalize on market movements.
Structure Pilot is built for beginner and experienced. It provides the tools to the traders that want to learn, understand, and trade efficiently within the principles of structure trading.
▫️ Alerts▫️
Alerts can be configured to these events :
New Swing / HTF Swing
Trend Change
Zil attached to a zone/HTF zone
Price cross 30/50/70 zones levels
Trend change and align the HTF/LTF trend
On cross partial (50%) and take profit (70%) ZIL and HTF ZIL
On cross Zil can now be configured for Bull or Bear zone
On HTF ZIL when 30% is crossed

TraderDemircan Auto Fibonacci RetracementDescription:
What This Indicator Does:This indicator automatically identifies significant swing high and swing low points within a customizable lookback period and draws comprehensive Fibonacci retracement and extension levels between them. Unlike the manual Fibonacci tool that requires you to constantly redraw levels as price action evolves, this automated version continuously updates the Fibonacci grid based on the most recent major swing points, ensuring you always have current and relevant support/resistance zones displayed on your chart.Key Features:
Automatic Swing Detection: Continuously scans the specified lookback period to find the most significant high and low points, eliminating manual drawing errors
Comprehensive Level Coverage: Plots 16 Fibonacci levels including 7 retracement levels (0.0 to 1.0) and 9 extension levels (1.115 to 3.618)
Top-Down Methodology: Draws from swing high to swing low (right-to-left), following the traditional Fibonacci retracement convention where 100% is at the top
Dual Labeling System: Shows both exact price values and Fibonacci percentages for easy reference
Complete Customization: Individual toggle controls and color selection for each of the 16 levels
Flexible Display Options: Adjust line thickness (1-5), style (solid/dashed/dotted), and extension direction (left/right/both)
Visual Swing Markers: Red diamond at the swing high (starting point) and green diamond at the swing low (ending point)
Optional Trend Line: Connects the two swing points to visualize the overall price movement direction
How It Works:The indicator employs a sophisticated swing point detection algorithm that operates in two stages:Stage 1 - Find the Swing Low (Support Base):
Scans the entire lookback period to identify the lowest low, which becomes the anchor point (0.0 level in traditional retracement terms, though displayed at the bottom of the grid).Stage 2 - Find the Swing High (Resistance Peak):
After identifying the swing low, searches for the highest high that occurred after that low point, establishing the swing range. This creates a valid price movement range for Fibonacci analysis.Fibonacci Calculation Method:
The indicator uses the top-down approach where:
1.0 Level = Swing High (100% retracement, the top)
0.0 Level = Swing Low (0% retracement, the bottom)
Retracement Levels (0.236 to 0.786) = Potential support zones during pullbacks from the high
Extension Levels (1.115 to 3.618) = Potential target zones below the swing low
Formula: Price = SwingHigh - (SwingHigh - SwingLow) × FibonacciLevelThis ensures that 0.0 is at the bottom and extensions (>1.0) plot below the swing low, following standard Fibonacci retracement convention.Fibonacci Levels Explained:Retracement Levels (0.0 - 1.0):
0.0 (Gray): Swing low - the base support level
0.236 (Red): Shallow retracement, first minor support
0.382 (Orange): Moderate retracement, commonly watched support
0.5 (Purple): Psychological midpoint, significant support/resistance
0.618 (Blue - Golden Ratio): The most important retracement level, high-probability reversal zone
0.786 (Cyan): Deep retracement, last defense before full reversal
1.0 (Gray): Swing high - the initial resistance level
Extension Levels (1.115 - 3.618):
1.115 (Green): First extension, minimal downside target
1.272 (Light Green): Minor extension, common profit target
1.414 (Yellow-Green): Square root of 2, mathematical significance
1.618 (Gold - Golden Extension): Primary downside target, most watched extension level
2.0 (Orange-Red): 200% extension, psychological round number
2.382 (Pink): Secondary extension target
2.618 (Purple): Deep extension, major target zone
3.272 (Deep Purple): Extreme extension level
3.618 (Blue): Maximum extension, rare but powerful target
How to Use:For Retracement Trading (Buying Pullbacks in Uptrends):
Wait for price to make a significant move up from swing low to swing high
When price starts pulling back, watch for reactions at key Fibonacci levels
Most common entry zones: 0.382, 0.5, and especially 0.618 (golden ratio)
Enter long positions when price shows reversal signals (candlestick patterns, volume increase) at these levels
Place stop loss below the next Fibonacci level
Target: Return to swing high or higher extension levels
For Extension Trading (Profit Targets):
After price breaks below the swing low (0.0 level), use extensions as profit targets
First target: 1.272 (conservative)
Primary target: 1.618 (golden extension - most commonly reached)
Extended target: 2.618 (for strong trends)
Extreme target: 3.618 (only in powerful trending moves)
For Counter-Trend Trading (Fading Extremes):
When price reaches deep retracements (0.786 or below), look for exhaustion signals
Watch for divergences between price and momentum indicators at these levels
Enter reversal trades with tight stops below the swing low
Target: 0.5 or 0.382 levels on the bounce
For Trend Continuation:
In strong uptrends, shallow retracements (0.236 to 0.382) often hold
Use these as low-risk entry points to join the existing trend
Failure to hold 0.5 suggests weakening momentum
Breaking below 0.618 often indicates trend reversal, not just retracement
Multi-Timeframe Strategy:
Use daily timeframe Fibonacci for major support/resistance zones
Use 4H or 1H Fibonacci for precise entry timing within those zones
Confluence between multiple timeframe Fibonacci levels creates high-probability zones
Example: Daily 0.618 level aligning with 4H 0.5 level = strong support
Settings Guide:Lookback Period (10-500):
Short (20-50): Captures recent swings, more frequent updates, suited for day trading
Medium (50-150): Balanced approach, good for swing trading (default: 100)
Long (150-500): Identifies major market structure, suited for position trading
Higher values = more stable levels but slower to adapt to new trends
Pivot Sensitivity (1-20):
Controls how many candles are required to confirm a swing point
Low (1-5): More sensitive, identifies minor swings (default: 5)
High (10-20): Less sensitive, only major swings qualify
Use higher sensitivity on lower timeframes to filter noise
Individual Level Toggles:
Enable only the levels you actively trade to reduce chart clutter
Common minimalist setup: Show only 0.382, 0.5, 0.618, 1.0, 1.618, 2.618
Comprehensive setup: Enable all levels for maximum information
Visual Customization:
Line Thickness: Thicker lines (3-5) for presentation, thinner (1-2) for trading
Line Style: Solid for primary levels (0.5, 0.618, 1.618), dashed/dotted for secondary
Price Labels: Essential for knowing exact entry/exit prices
Percent Labels: Helpful for quickly identifying which Fibonacci level you're looking at
Extension Direction: Extend right for forward-looking analysis, left for historical context
What Makes This Original:While Fibonacci indicators are common on TradingView, this script's originality comes from:
Intelligent Two-Stage Detection: Unlike simple high/low finders, this uses a sequential approach (find low first, then find the high that occurred after it), ensuring logical price flow representation
Comprehensive Level Set: Includes 16 levels spanning from retracement to extreme extensions, more than most Fibonacci tools
Top-Down Methodology: Properly implements the traditional Fibonacci retracement convention (high to low) rather than the reverse
Automatic Range Validation: Only draws Fibonacci when both swing points are valid and in the correct temporal order
Dual Extension Options: Separate controls for extending lines left (historical context) and right (forward projection)
Smart Label Positioning: Places percentage labels on the left and price labels on the right for clarity
Visual Swing Confirmation: Diamond markers at swing points help users understand why levels are positioned where they are
Important Considerations:
Historical Nature: Fibonacci retracements are based on past price swings; they don't predict future moves, only suggest potential support/resistance
Self-Fulfilling Prophecy: Fibonacci levels work partly because many traders watch them, creating actual support/resistance at those levels
Not All Levels Hold: In strong trends, price may slice through multiple Fibonacci levels without pausing
Context Matters: Fibonacci works best when aligned with other support/resistance (previous highs/lows, moving averages, trendlines)
Volume Confirmation: The most reliable Fibonacci reversals occur with volume spikes at key levels
Dynamic Updates: The levels will redraw as new swing highs/lows form, so don't rely solely on static screenshots
Best Practices:
Don't Trade Blindly: Fibonacci levels are zones, not exact prices. Look for confirmation (candlestick patterns, indicators, volume)
Combine with Price Action: Watch for pin bars, engulfing candles, or doji at key Fibonacci levels
Use Stop Losses: Place stops beyond the next Fibonacci level to give trades room but limit risk
Scale In/Out: Consider entering partial positions at 0.5 and adding more at 0.618 rather than all-in at one level
Check Multiple Timeframes: Daily Fibonacci + 4H Fibonacci convergence = high-probability zone
Respect the 0.618: This golden ratio level is historically the most reliable for reversals
Extensions Need Strong Trends: Don't expect extensions to be hit unless there's clear momentum beyond the swing low
Optimal Timeframes:
Scalping (1-5 minutes): Lookback 20-30, watch 0.382, 0.5, 0.618 only
Day Trading (15m-1H): Lookback 50-100, all retracement levels important
Swing Trading (4H-Daily): Lookback 100-200, focus on 0.5, 0.618, 0.786, and extensions
Position Trading (Daily-Weekly): Lookback 200-500, all levels relevant for long-term planning
Common Fibonacci Trading Mistakes to Avoid:
Wrong Swing Selection: Choosing insignificant swings produces meaningless levels
Premature Entry: Entering as soon as price touches a Fibonacci level without confirmation
Ignoring Trend: Fighting the main trend by buying deep retracements in downtrends
Over-Reliance: Using Fibonacci in isolation without confirming with other technical factors
Static Analysis: Not updating your Fibonacci as market structure evolves
Arbitrary Lookback: Using the same lookback period for all assets and timeframes
Integration with Other Tools:Fibonacci + Moving Averages:
When 0.618 level aligns with 50 or 200 EMA, confluence creates stronger support
Price bouncing from both Fibonacci and MA simultaneously = high-probability trade
Fibonacci + RSI/Stochastic:
Oversold indicators at 0.618 or deeper retracements = strong buy signal
Overbought indicators at swing high (1.0) = potential reversal warning
Fibonacci + Volume Profile:
High-volume nodes aligning with Fibonacci levels create robust support/resistance
Low-volume areas near Fibonacci levels may see rapid price movement through them
Fibonacci + Trendlines:
Fibonacci retracement level + ascending trendline = double support
Breaking both simultaneously confirms trend change
Technical Notes:
Uses ta.lowest() and ta.highest() for efficient swing detection across the lookback period
Implements dynamic line and label arrays for clean redraws without memory leaks
All calculations update in real-time as new bars form
Extension options allow customization without modifying core code
Format.mintick ensures price labels match the symbol's minimum price increment
Tooltip on swing markers shows exact price values for precision
