ICT Quant-Core: Liquidity Intelligence [Dual-Engine]🔥 THE ULTIMATE LIQUIDITY FILTERING ENGINE
Most SMC traders lose money because they "catch falling knives" on every local wick. This algorithm solves this problem by using DUAL-CORE logic and a signal quality scoring system.
This is no ordinary pivot indicator.
⚙️ HOW DOES IT WORK? (DUAL-CORE LOGIC)
The algorithm analyzes the market on two levels simultaneously:
1️⃣ MACRO CORE (Lookback 50 - "WHALE 🐋")
Tracks key levels from recent weeks/months.
This is where institutions build their positions.
Signals from this core have the highest priority (Score 10/10).
2️⃣ LOCAL CORE (Lookback 20 - "ROACH 🐟")
Tracks internal market structure and noise.
Signals are filtered by the Main Trend. If the trend is down, Local Longs are marked as "TRAP."
🧠 SMART FILTERS (QUANT LAYERS)
Instead of entering on every line touch, the script requires confirmation:
✅ RECLAIM LOGIC: Price must close back above/below the liquidity level (Swing Failure Pattern).
✅ RVOL FILTER: Requires relative volume > 1.2x the average (institutional track).
✅ SCORING SYSTEM (0-10): Each signal receives a score.
- 10/10: Macro Grab in line with the trend + high volume.
- 3/10: Local Grab against the trend (risky).
📊 ANALYTICAL DASHBOARD
In the lower right corner, you'll find the "Command Center":
- Trend Status (Distribution/Accumulation)
- Whale's Last Move (Price and Direction)
- Current Tactics (e.g., "Ignore Longs, Search for Shorts")
- Filter Status (RSI, Volume, Reclaim)
🚀 HOW TO USE IT?
1. Set the H4 timeframe.
2. Wait for a signal with a rating > 7/10.
3. Ignore "Fish/Local" signals (small icons) if they contradict the Dashboard color.
4. Entry occurs only after the candle closes (Reclaim).
"key levels"に関するスクリプトを検索

RS Rating Multi-TimeframeRS Rating Multi-Timeframe (IBD-Style Relative Strength)
Short Description:
IBD-style Relative Strength Rating (1-99) comparing any stock's performance vs the S&P 500 across multiple timeframes.
Full Description:
Overview
This indicator calculates an IBD-style Relative Strength (RS) Rating that measures a stock's price performance relative to the S&P 500 over the past 12 months. The rating scale ranges from 1 (weakest) to 99 (strongest), telling you how a stock ranks against all other stocks in terms of relative performance.
How It Works
The RS Rating uses a weighted formula based on quarterly performance:
Last 63 days (1 quarter): 40% weight
Last 126 days (2 quarters): 20% weight
Last 189 days (3 quarters): 20% weight
Last 252 days (4 quarters): 20% weight
This weighting emphasizes recent performance while still accounting for longer-term strength.
Rating Interpretation
90-99 (Elite): Top 10% of all stocks - exceptional relative strength
80-89 (Excellent): Top 20% - strong leadership candidates
50-79 (Average): Middle of the pack
30-49 (Below Average): Underperforming the market
1-29 (Weak): Bottom 30% - avoid or consider shorting
Features
Multi-Timeframe: Works on any timeframe from 1-hour to weekly (always uses daily data for calculation)
Moving Average: Optional EMA or SMA of the RS Rating to smooth signals
Visual Zones: Color-coded zones for quick identification of strength/weakness
Signal Markers: Triangles appear when RS crosses key levels (80 and 30)
Info Table: Displays current RS Rating, change, MA value, and raw score
Alerts: Built-in alerts for key crossover events
Settings
Show Moving Average: Toggle MA line on/off
MA Length: Period for the moving average (default: 10)
MA Type: Choose between EMA or SMA
Benchmark Index: Change the comparison index (default: SP:SPX)
Show Rating Table: Toggle the info table on/off
How To Use
Buy candidates: Look for stocks with RS Rating above 80, ideally rising
Avoid: Stocks with RS Rating below 30 or falling rapidly
Confirmation: Use RS above its moving average as additional confirmation
Divergence: Watch for RS making new highs before price (bullish) or new lows before price (bearish)
Credits
RS Rating calculation methodology inspired by Investor's Business Daily (IBD) and adapted from Fred6724's RS Rating script. Percentile calibration based on analysis of ~6,600 US stocks.
Tags: relative strength, RS rating, IBD, momentum, CAN SLIM, benchmark, SPX, market leaders, stock ranking
Category: Relative Strength

Cumulative Volume Delta - LineA simple tweak to the CVD indicator from TradingView for better readability.
Use it to spot absorption and exhaustion at key levels.
For example,
Price is making higher highs while CVD is making lower highs - possible exhaustion of buyers
Price is making lower highs while CVD is making higher highs - possible absorption of buyers
Price is making lower lows while CVD is making higher lows - possible exhaustion of sellers
Price is making higher lows while CVD is making lower lows - possible absorption of sellers

deKoder | HTF3 - Multi-Timeframe Candle DisplaydeKoder | HTF3 - Multi-Timeframe Candle Display
Overview
HTF3 is a powerful multi-timeframe analysis tool that displays higher timeframe candles directly on your current lower timeframe chart. When trading lower timeframes it is sometimes easy to lose sight of the higher timeframe context. HTF3 enables better trading decisions by keeping your analysis aligned with the dominant trend.
Key Features
• Multi-Timeframe Support : Display daily, weekly, or any custom higher timeframe candles
• Visual Candle Representation : Clear OHLC candles with customizable colors
• Range Display : Show previous candle ranges with dotted center lines
• Trading Signals : Automatic breakout and rejection signals with arrow markers
• Flexible Positioning : Adjustable horizontal offset for optimal placement
• Real-time Updates : Current higher timeframe candle builds in real-time
Use Cases
• Swing Traders : Maintain daily/weekly context on intraday charts
• Position Traders : Align entries with higher timeframe structure
• Breakout Traders : Identify key levels from previous candle ranges
• Market Analysis : Quickly assess multi-timeframe alignment
Configuration
• Timeframe : Select higher timeframe to display (default: D)
• X-Offset : Adjust horizontal positioning (-4 to 50)
• Show Candles : Toggle candle display
• Show Range : Toggle previous candle high/low ranges
• Signals : Display breakout/rejection signals
• Customize bull/bear colors and text appearance
How to Use
1. Select your desired higher timeframe in the settings
2. Adjust offset for optimal positioning
3. Use the range lines to identify potential liquidity zones
4. Watch for signal arrows indicating breakouts/rejections
5. Combine with your existing strategy for confirmation
Pro Tips
• Use daily candles on 1H/4H charts for swing trading context
• The signals are not intended as standalone buy/sell triggers. They should only be used as confluence for your main trade idea

Vector CPR Bands## Overview
The Vector CPR Bands indicator enhances the classic Central Pivot Range (CPR) by incorporating "vector" detection—identifying periods with above-average or climactic volume. It projects CPR ranges from these high-volume periods forward as visual bands, which act as persistent support/resistance zones until invalidated by price action. Ideal for spotting key levels in trending or ranging markets, especially on higher timeframes like weekly or monthly.
## Key Features
- **CPR Calculation**: Plots previous, developing (non-repainting), and repainting CPR with mid-pivot, TC (top central), and BC (bottom central) lines, plus fills.
- **Vector Detection**: Scans for high-volume bars in the anchor timeframe (default weekly). Flags "above-average" (≥1.5x avg) or "large" (≥2x avg or max climax).
- **Band Projection**: Creates bands from vector-qualified CPR periods. Extends them rightward until touched/revisited (configurable: invalidate on wick/close, delete or freeze/gray out).
- **Customization**:
- Timeframe: Set CPR anchor (e.g., 'W' for weekly, 'M' for monthly).
- Display: Toggle CPR types, pivot guides.
- Volume Thresholds: Adjust lookback and ratios.
- De-clutter: Limit max bands, pin to period start, always extend.
- **Alerts & Signals**: Built-in alerts for developing pivot crossing previous pivot (bullish/bearish).
## How to Use
1. Add to chart and set anchor timeframe (e.g., 'M' for monthly vCPR on BTC, as shown in example charts).
2. Watch bands as S/R: Virgin (untested) bands often provide strong bounces; mitigated ones fade.
3. Combine with volume/price action: Bullish bands suggest upside bias, especially if price holds above.
4. Example: On BTC weekly, vector bands from high-volume weeks highlight multi-month zones—breaks signal shifts.

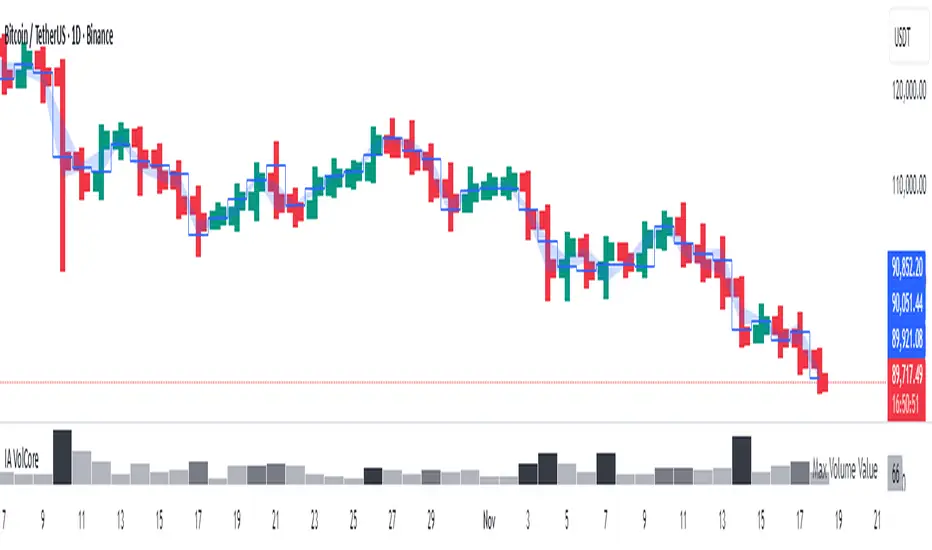
Candle Volume CoreIA VolCore — Candle Volume Core
Indicator Overview
IA VolCore is an intra‑candle volume analysis tool that shows where the core traded volume is concentrated inside each candle.
It visualizes how buyers and sellers interacted within the bar and highlights key levels and zones where the highest activity takes place.
How Calculations Work
The indicator uses the lowest available timeframe data to calculate volume distribution inside each candle.
If you have a Premium or higher subscription, VolCore uses second‑based data for the most accurate results. Older candles (where second‑data is no longer available due to platform limits) are calculated using minute data. The indicator can therefore be used on any timeframe from 1 minute and higher.
If you do not have Premium, the indicator uses minute‑based data only, so it is recommended to use it from the daily timeframe and above.
Example of Calculation
If the chart timeframe is 1 hour and the lowest available timeframe is 1‑second data, the indicator loads 3600 1‑second candles. Each 1‑second candle has a known volume, which is evenly distributed across its own price range.
The 1‑hour candle is then divided into a number of price ranges based on the Candle Volume Resolution parameter. The volumes of all 3600 1-second candles are then aggregated into the corresponding price ranges of the hourly candle.
The final result is a detailed intra‑candle volume map for the entire hour — calculated using the most precise data available.
Custom Timeframe Parameter
If Use Custom Timeframe is enabled and a timeframe is selected, all calculations will be performed strictly using this specified timeframe.
For example: if the chart is on 1D, the user has 1‑second data available, but Custom TF is set to 1 minute, then the volume distribution inside each daily candle will be calculated using 1‑minute candles.
Key Features
Candle Volume Resolution — defines how many price ranges each candle is divided into (3–50,000). All calculations in the indicator are based on this resolution.
Max Volume Level — displays the price level inside the candle where the maximum volume occurred.
% of Volume (1, 2, 3) — defines percentages of the candle's total volume (e.g., 33%, 66%, 50%). For each percentage, VolCore finds the minimum price range containing that share of volume. You can view the corresponding volume values for these shares in histogram form via the Show: Vol % 1–3 parameters. The actual intra-candle zones are displayed using the Show area option.
Volume % for Density — sets the volume percentage used to calculate Vol Density, which reflects how concentrated the volume is inside the selected price range.
Display Parameters (Show)
Show: Vol % 1–3 — shows histograms of volume share zones based on the selected "% of Volume" parameters (with color logic applied).
Show: Max Volume Value — displays the maximum internal volume value for each candle as a histogram (with color logic applied).
Show: Volume — displays the candle's total volume (with color logic applied).
Show: Vol Density — shows the density of volume distribution inside the candle for the selected volume percentage (with color logic applied).
Example Use Cases (not a complete list)
IA VolCore shows where liquidity forms inside each candle, how volume is distributed, and how concentrated trading activity is.
Detecting False Breakouts
If a breakout candle shows increased volume, and after the breakout the core volume forms beyond the level, but the price moves back — VolCore provides a strong signal of a false breakout.
Examples:
Identifying Support & Resistance Zones
If Max Volume Level repeatedly forms in the same internal range over multiple candles, this indicates a hidden support or resistance level.
Example:
Who This Indicator Is For
For traders using volume‑based and contextual market analysis, and for IA (Initiative Analysis) ecosystem users who want a deeper understanding of intra‑candle structure.
Histogram Color Logic
IA VolCore uses three color shades to highlight volume behavior relative to previous candles:
light shade — normal volume, no significant change,
medium shade — volume exceeds both previous candles,
dark shade — volume exceeds the sum of the previous two candles.
This helps quickly spot growing activity and potential shifts in market pressure.
Style Settings
Line styles, histogram styles, and colors can be customized in the indicator’s Style tab.
Combined JADEVO-ATR VIX AdaptiveCombined JADEVO-ATR VIX Adaptive is a next-generation volatility-aware trading engine that merges the precision of the JADEVO framework with the adaptive power of ATR and VIX-based volatility modeling. Built for scalpers, intraday traders, and advanced algorithmic systems, this tool dynamically adjusts its sensitivity, key levels, and trade signals based on real-time market expansion and contraction.
By combining ATR-driven structure mapping, VIX-influenced volatility filters, and the JADEVO decision core, this indicator identifies high-probability zones, adaptive entry signals, and intelligent profit-taking levels—while filtering out low-quality chop that destroys most scalping systems.

MA SMART Angle
### 📊 WHAT IS MA SMART ANGLE?
**MA SMART Angle** is an advanced momentum and trend detection indicator that analyzes the angles (slopes) of multiple moving averages to generate clear, non-repainting BUY and SELL signals.
**Original Concept Credit:** This indicator builds upon the "MA Angles" concept originally created by **JD** (also known as Duyck). The core angle calculation methodology and Jurik Moving Average (JMA) implementation by **Everget** are preserved from the original open-source work. The angle calculation formula was contributed by **KyJ**. This enhanced version is published with respect to the open-source nature of the original indicator.
Original indicator reference: "ma angles - JD" by Duyck
---
## 🎯 ORIGINALITY & VALUE PROPOSITION
### **What Makes This Different from the Original:**
While the original "MA Angles" by **JD** provided excellent angle visualization, it lacked actionable entry signals. **MA SMART Angle** addresses this by adding:
**1. Clear Entry/Exit Signals**
- Explicit BUY/SELL arrows based on angle crossovers, momentum confirmation, and MA alignment
- No guessing when to enter trades - the indicator tells you exactly when conditions align
**2. Non-Repainting Logic**
- All signals use confirmed historical data (shifted by 2 bars minimum)
- Critical for backtesting reliability and live trading confidence
- Original indicator could repaint signals on current bar
**3. Dual Signal System**
- **Simple Mode:** More frequent signals based on angle crossovers + momentum (for active traders)
- **Strict Mode:** Requires full multi-MA alignment + momentum confirmation (for conservative traders)
- Adaptable to different trading styles and risk tolerances
**4. Smart Signal Filtering**
- **Anti-spam cooldown:** Prevents duplicate signals within configurable bar count
- **No-trade zone detection:** Filters out low-conviction sideways markets automatically
- **Multi-timeframe MA alignment:** Ensures all moving averages agree on direction before signaling
**5. Enhanced Visualization**
- Large, clear BUY/SELL arrows with descriptive labels
- Color-coded backgrounds for market states (trending vs. ranging)
- Momentum histogram showing acceleration/deceleration in real-time
- Live status table displaying trend strength, angle value, momentum, and MA alignment
**6. Professional Alert System**
- Four distinct alert conditions: BUY Signal, SELL Signal, Strong BUY, Strong SELL
- Enables automated trade notifications and strategy integration
**7. Modified MA Periods**
- Original used EMA(27), EMA(83), EMA(278)
- Enhanced version uses faster EMA(3), EMA(8), EMA(13) for more responsive signals
- Better suited for modern volatile markets and shorter timeframes
---
## 📐 HOW IT WORKS - TECHNICAL EXPLANATION
### **Core Methodology:**
The indicator calculates angles (slopes) for five key moving averages:
- **JMA (Jurik Moving Average)** - Smooth, lag-reduced trend line (original implementation by **Everget**)
- **JMA Fast** - Responsive momentum indicator with higher power parameter
- **MA27 (EMA 3)** - Primary fast-moving average for signal generation
- **MA83 (EMA 8)** - Medium-term trend confirmation
- **MA278 (EMA 13)** - Slower trend filter
### **Angle Calculation Formula (by KyJ):**
```
angle = arctan((MA - MA ) / ATR(14)) × (180 / π)
```
**Why ATR normalization?**
- Makes angles comparable across different instruments (forex, stocks, crypto)
- Makes angles comparable across different timeframes
- Accounts for volatility - a 10-point move in different assets has different significance
**Angle Interpretation:**
- **> 15°** = Strong trend (momentum accelerating)
- **0° to 15°** = Weak trend (momentum present but moderate)
- **-2° to +2°** = No-trade zone (sideways/choppy market)
- **< -15°** = Strong downtrend
### **Signal Generation Logic:**
#### **BUY Signal Conditions:**
1. MA27 angle crosses above 0° (upward momentum initiates)
2. All three EMAs (3, 8, 13) pointing upward (trend alignment confirmed)
3. Momentum is positive for 2+ bars (acceleration, not deceleration)
4. Angle exceeds minimum threshold (not in no-trade zone)
5. Cooldown period passed (prevents signal spam)
#### **SELL Signal Conditions:**
1. MA27 angle crosses below 0° (downward momentum initiates)
2. All three EMAs pointing downward (downtrend alignment)
3. Momentum is negative for 2+ bars
4. Angle below negative threshold (not in no-trade zone)
5. Cooldown period passed
#### **Strong BUY+ / SELL+ Signals:**
Additional entry opportunities when JMA Fast crosses JMA Slow while maintaining strong directional angle - indicates momentum acceleration within established trend.
---
## 🔧 HOW TO USE
### **Recommended Settings by Trading Style:**
**Scalpers / Day Traders:**
- Signal Type: **Simple**
- Minimum Angle: **3-5°**
- Cooldown Bars: **3-5 bars**
- Timeframes: 1m, 5m, 15m
**Swing Traders:**
- Signal Type: **Strict**
- Minimum Angle: **7-10°**
- Cooldown Bars: **8-12 bars**
- Timeframes: 1H, 4H, Daily
**Position Traders:**
- Signal Type: **Strict**
- Minimum Angle: **10-15°**
- Cooldown Bars: **15-20 bars**
- Timeframes: Daily, Weekly
### **Parameter Descriptions:**
**1. Source** (default: OHLC4)
- Price data used for MA calculations
- OHLC4 provides smoothest angles
- Close is more responsive but noisier
**2. Threshold for No-Trade Zones** (default: 2°)
- Angles below this are considered sideways/ranging
- Increase for stricter filtering of choppy markets
- Decrease to allow signals in quieter trending periods
**3. Signal Type** (Simple vs. Strict)
- **Simple:** Angle crossover OR (trend + momentum)
- **Strict:** Angle crossover AND all MAs aligned AND momentum confirmed
- Start with Simple, switch to Strict if too many false signals
**4. Minimum Angle for Signal** (default: 5°)
- Only generate signals when angle exceeds this threshold
- Higher values = stronger trends required
- Lower values = more sensitive to momentum changes
**5. Cooldown Bars** (default: 5)
- Minimum bars between consecutive signals
- Prevents spam during volatile chop
- Scale with your timeframe (higher TF = more bars)
**6. Color Bars** (default: true)
- Colors chart bars based on signal state
- Green = bullish conditions, Red = bearish conditions
- Can disable if you prefer clean price bars
**7. Background Colors**
- **Yellow background** = No-trade zone (low angle, ranging market)
- **Green flash** = BUY signal generated
- **Red flash** = SELL signal generated
- All customizable or can be disabled
---
## 📊 INTERPRETING THE INDICATOR
### **Visual Elements:**
**Main Chart Window:**
- **Thick Lime/Fuchsia Line** = MA27 angle (primary signal line)
- **Medium Green/Red Line** = MA83 angle (trend confirmation)
- **Thin Green/Red Line** = MA278 angle (slow trend filter)
- **Aqua/Orange Line** = JMA Fast (momentum detector)
- **Green/Red Area** = JMA slope (overall trend context)
- **Blue/Purple Histogram** = Momentum (angle acceleration/deceleration)
**Signal Arrows:**
- **Large Green ▲ "BUY"** = Primary buy signal (all conditions met)
- **Small Green ▲ "BUY+"** = Strong momentum buy (JMA fast cross)
- **Large Red ▼ "SELL"** = Primary sell signal (all conditions met)
- **Small Red ▼ "SELL+"** = Strong momentum sell (JMA fast cross)
**Status Table (Top Right):**
- **Angle:** Current MA27 angle in degrees
- **Trend:** Classification (STRONG UP/DOWN, UP/DOWN, FLAT)
- **Momentum:** Acceleration state (ACCEL UP/DN, Up/Down)
- **MAs:** Alignment status (ALL UP/DOWN, Mixed)
- **Zone:** Trading zone status (ACTIVE vs. NO TRADE)
- **Last:** Bars since last signal
### **Trading Strategies:**
**Strategy 1: Pure Signal Following**
- Enter LONG on BUY signal
- Exit on SELL signal
- Use stop-loss at recent swing low/high
- Works best on trending instruments
**Strategy 2: Confirmation with Price Action**
- Wait for BUY signal + bullish candlestick pattern
- Wait for SELL signal + bearish candlestick pattern
- Increases win rate by filtering premature signals
- Recommended for beginners
**Strategy 3: Momentum Acceleration**
- Use BUY+/SELL+ signals for adding to positions
- Only take these in direction of primary signal
- Scalp quick moves during momentum spikes
- For experienced traders
**Strategy 4: Mean Reversion in No-Trade Zones**
- When status shows "NO TRADE", fade extremes
- Wait for angle to exit no-trade zone for reversal
- Contrarian approach for range-bound markets
- Requires tight stops
---
## ⚠️ LIMITATIONS & DISCLAIMERS
**What This Indicator DOES:**
✅ Measures momentum direction and strength via angle analysis
✅ Generates signals when multiple conditions align
✅ Filters out low-conviction sideways markets
✅ Provides visual clarity on trend state
**What This Indicator DOES NOT:**
❌ Predict future price movements with certainty
❌ Guarantee profitable trades (no indicator can)
❌ Work equally well on all instruments/timeframes
❌ Replace proper risk management and position sizing
**Known Limitations:**
- **Lagging Nature:** Like all moving averages, signals occur after momentum begins
- **Whipsaw Risk:** Can generate false signals in volatile, directionless markets
- **Optimization Required:** Parameters need adjustment for different assets
- **Not a Complete System:** Should be combined with risk management, position sizing, and other analysis
**Best Performance Conditions:**
- Strong trending markets (crypto bull runs, stock breakouts)
- Liquid instruments (major forex pairs, large-cap stocks)
- Appropriate timeframe selection (match to trading style)
- Used alongside support/resistance and volume analysis
---
## 🔔 ALERT SETUP
The indicator includes four alert conditions:
**1. BUY SIGNAL**
- Message: "MA SMART Angle: BUY SIGNAL! Angle crossed up with momentum"
- Use for: Primary long entries
**2. SELL SIGNAL**
- Message: "MA SMART Angle: SELL SIGNAL! Angle crossed down with momentum"
- Use for: Primary short entries or long exits
**3. Strong BUY**
- Message: "MA SMART Angle: Strong BUY momentum - JMA fast crossed up"
- Use for: Adding to longs or aggressive entries
**4. Strong SELL**
- Message: "MA SMART Angle: Strong SELL momentum - JMA fast crossed down"
- Use for: Adding to shorts or aggressive exits
**Setting Up Alerts:**
1. Right-click indicator → "Add Alert on MA SMART Angle"
2. Select desired condition from dropdown
3. Choose notification method (popup, email, webhook)
4. Set alert expiration (typically "Once Per Bar Close")
---
## 📚 EDUCATIONAL VALUE
This indicator serves as an excellent learning tool for understanding:
**1. Angle-Based Momentum Analysis**
- Traditional indicators show MA crossovers
- This shows the *rate of change* (velocity) of MAs
- Teaches traders to think in terms of momentum acceleration
**2. Multi-Timeframe Confirmation**
- Shows how fast, medium, and slow MAs interact
- Demonstrates importance of trend alignment
- Helps develop patience for high-probability setups
**3. Signal Quality vs. Quantity Tradeoff**
- Simple mode = more signals, more noise
- Strict mode = fewer signals, higher quality
- Teaches discretionary filtering skills
**4. Market State Recognition**
- Visual distinction between trending and ranging markets
- Helps traders avoid trading choppy conditions
- Develops "market context" awareness
---
## 🔄 DIFFERENCES FROM OTHER MA INDICATORS
**vs. Traditional MA Crossovers:**
- Measures momentum (angle) rather than just price crossing MA
- Provides earlier signals as angles change before price crosses
- Filters better for sideways markets using no-trade zones
**vs. MACD:**
- Uses multiple MAs instead of just two
- ATR normalization makes it universal across instruments
- Visual angle representation more intuitive than histogram
**vs. Supertrend:**
- Not based on ATR bands but on MA slope analysis
- Provides graduated strength indication (not just binary trend)
- Less prone to whipsaw in low volatility
**vs. Original "MA Angles" by JD:**
- Adds explicit entry/exit signals (original had none)
- Implements no-repaint logic for reliability
- Includes signal filtering and quality controls
- Provides dual signal systems (Simple/Strict)
- Enhanced visualization and status monitoring
- Uses faster MA periods (3/8/13 vs 27/83/278) for modern markets
---
## 📖 CODE STRUCTURE (for Pine Script learners)
This indicator demonstrates:
**Advanced Pine Script Techniques:**
- Custom function implementation (JMA, angle calculation)
- Var declarations for stateful tracking
- Table creation for HUD display
- Multi-condition signal logic
- Alert system integration
- Proper use of historical references for no-repaint
**Code Organization:**
- Modular function definitions (JMA, angle)
- Clear separation of concerns (inputs, calculations, plotting, alerts)
- Extensive commenting for maintainability
- Best practices for Pine Script v5
**Learning Resources:**
- Study the JMA function to understand adaptive smoothing
- Examine angle calculation for ATR normalization technique
- Review signal logic for multi-condition confirmation patterns
- Analyze anti-spam filtering for state management
The code is open-source - feel free to study, modify, and improve upon it!
---
## 🙏 CREDITS & ATTRIBUTION
**Original Concepts:**
- **"ma angles - JD" by JD (Duyck)** - Core angle calculation methodology and indicator concept
Original open-source indicator on TradingView Community Scripts
- **JMA (Jurik Moving Average) implementation by Everget** - Smooth, low-lag moving average function
Acknowledged in original JD indicator code
- **Angle Calculation formula by KyJ** - Mathematical formula for converting MA slope to degrees using ATR normalization
Acknowledged in original JD indicator code comments
**Enhancements in This Version:**
- Signal generation logic - Original implementation for this indicator
- No-repaint confirmation system - Original implementation
- Dual signal modes (Simple/Strict) - Original implementation
- Visual enhancements and status table - Original implementation
- Alert system and signal filtering - Original implementation
- Modified MA periods (3/8/13 instead of 27/83/278) - Optimization for modern markets
**Open Source Philosophy:**
This indicator follows the open-source spirit of TradingView and the Pine Script community. The original "ma angles - JD" by JD (Duyck) was published as open-source, enabling this enhanced version. Similarly, this code is published as open-source to allow further community improvements.
---
## ⚡ QUICK START GUIDE
**For New Users:**
1. Add indicator to chart
2. Start with default settings (Simple mode)
3. Wait for BUY signal (green arrow)
4. Observe how price behaves after signal
5. Check status table to understand market state
6. Adjust parameters based on your instrument/timeframe
**For Experienced Traders:**
1. Switch to Strict mode for higher quality signals
2. Increase cooldown bars to reduce frequency
3. Raise minimum angle threshold for stronger trends
4. Combine with your existing strategy for confirmation
5. Set up alerts for desired signal types
6. Backtest on your preferred instruments
---
## 🎓 RECOMMENDED COMBINATIONS
**Works Well With:**
- **Volume Analysis:** Confirm signals with volume spikes
- **Support/Resistance:** Take signals near key levels
- **RSI/Stochastic:** Avoid overbought/oversold extremes
- **ATR:** Size positions based on volatility
- **Price Action:** Wait for candlestick confirmation
**Complementary Indicators:**
- Order Flow / Footprint (for institutional confirmation)
- Volume Profile (for identifying value areas)
- VWAP (for intraday mean reversion reference)
- Fibonacci Retracements (for target setting)
---
## 📈 PERFORMANCE EXPECTATIONS
**Realistic Win Rates:**
- Simple Mode: 45-55% (higher frequency, moderate accuracy)
- Strict Mode: 55-65% (lower frequency, higher accuracy)
- Combined with price action: 60-70%
**Best Asset Classes:**
1. **Cryptocurrencies** (strong trends, clear signals)
2. **Forex Major Pairs** (smooth price action, good angles)
3. **Large-Cap Stocks** (trending behavior, liquid)
4. **Index Futures** (trending instruments)
**Challenging Conditions:**
- Low volatility consolidation periods
- News-driven erratic movements
- Thin/illiquid instruments
- Counter-trending markets
---
## 🛡️ RISK DISCLAIMER
**IMPORTANT LEGAL NOTICE:**
This indicator is for **educational and informational purposes only**. It is **NOT financial advice** and does not constitute a recommendation to buy or sell any financial instrument.
**Trading Risks:**
- Trading carries substantial risk of loss
- Past performance does not guarantee future results
- No indicator can predict market movements with certainty
- You can lose more than your initial investment (especially with leverage)
**User Responsibilities:**
- Conduct your own research and due diligence
- Understand the instruments you trade
- Never risk more than you can afford to lose
- Use proper position sizing and risk management
- Consider consulting a licensed financial advisor
**Indicator Limitations:**
- Signals are based on historical data only
- No guarantee of accuracy or profitability
- Parameters must be optimized for your specific use case
- Results vary significantly by market conditions
By using this indicator, you acknowledge and accept all trading risks. The author is not responsible for any financial losses incurred through use of this indicator.
---
## 📧 SUPPORT & FEEDBACK
**Found a bug?** Please report it in the comments with:
- Chart symbol and timeframe
- Parameter settings used
- Description of unexpected behavior
- Screenshot if possible
**Have suggestions?** Share your ideas for improvements!
**Enjoying the indicator?** Leave a like and follow for updates!

Rage of UltronRage of Ultron - Multi-Timeframe Smart Money Trading System
Advanced Confluence-Based Trading Indicator
Rage of Ultron is a comprehensive multi-timeframe trading system that combines Smart Money Concepts (SMC) with macro market context, RSI divergences, liquidity sweeps, and volume analysis to identify high-probability setups across all markets.
Key Features
Multi-Timeframe Alignment
* Weekly Bias - Directional trend context
* Daily Structure - Order Blocks and Fair Value Gaps
* 4H Confirmation - Entry timing and execution
* Real-time MTF alignment scoring (🟢 Bull Aligned / 🔴 Bear Aligned / 🟡 Mixed)
Smart Money Concepts
* Order Blocks (OB) - Institutional entry zones with visual clarity
* Fair Value Gaps (FVG) - Price imbalances and retracement magnets
* Change of Character (CHoCH) - Market structure breaks (▲▼)
* Liquidity Sweeps - Stop hunt detection before reversals (💧)
Technical Analysis
* RSI Divergences - Regular and hidden divergences with zones (◆)
* RSI Swing Failure Patterns - Grade-A reversal setups (★)
* Automatic Fibonacci - Dynamic retracements and extensions
* Volume Impulse Detection - Weighted confirmation signals
Macro Market Radar
* DXY - Dollar strength assessment
* BTC Dominance - Crypto market risk gauge
* USDT Dominance - Stablecoin flow analysis
* Combined risk environment scoring
Confluence Scoring System (0-7)
Quantified setup quality with three alert tiers:
* Tier 1 (Score 6-7): Full confluence + sweep + volume + MTF alignment
* Tier 2 (Score 5): High confluence + volume or sweep
* Tier 3 (Score 4): Standard confluence setups
"Rage" Volume State
* 🟢 RAGE PULSE - Explosive volume spike (score 6+ trigger)
* ⚡ Active - Strong volume with good confluence
* 🟡 Stable - Moderate volume conditions
* 🔴 Dormant - Low volume, wait for confirmation
Visual Design
* Clean Zone Rendering - Persistent OB/FVG boxes with limited extension
* Signal Bar Highlighting - Colored fills and contrasting borders for instant recognition
* Dynamic Symbol Placement - ATR-based offset prevents overlap
* Comprehensive Panel - Real-time macro + trade metrics in one view
* Toggleable Legend - Learn signals, hide once familiar
How to Use
1. Set Your Timeframes - Default 1W/1D/4H works for swing trading
2. Monitor Macro Environment - Check risk-on/off context
3. Wait for Confluence ≥4 - Let multiple signals align
4. Enter on Tier 1/2 Alerts - Best probability setups
5. Use Fib Extensions for Targets - Systematic profit taking
Customizable Settings
* Multi-timeframe periods
* RSI length and divergence sensitivity
* Liquidity sweep parameters
* Fibonacci swing lookback
* Volume thresholds
* Shape offset multiplier
* Visual toggles (Fibs, extensions, legend)
Built-in Alert System
Three-tier alert structure lets you filter by setup quality. Set alerts for Tier 1 only for highest conviction trades, or include Tier 2 for more opportunities.
Best Practices
* Use on clean timeframes - 1H+ for less noise
* Combine with support/resistance - Zones near key levels = highest probability
* Respect the macro - Don't fight extreme risk-off environments
* Wait for the full stack - Best trades have 4+ aligned signals
* Practice on demo first - Learn signal behavior in your market
Works On
* Cryptocurrency (spot & futures)
* Forex pairs
* Stock indices
* Individual stocks
* Commodities
Note: This indicator identifies potential setups but does not guarantee profits. Always use proper risk management, position sizing, and stops. Past performance does not predict future results.
Created by cdotgnz | For educational purposes

Quantum Fluxtrend [CHE] Quantum Fluxtrend — A dynamic Supertrend variant with integrated breakout event tracking and VWAP-guided risk management for clearer trend decisions.
Summary
The Quantum Fluxtrend builds on traditional Supertrend logic by incorporating a midline derived from smoothed high and low values, creating adaptive bands that respond to market range expansion or contraction. This results in fewer erratic signals during volatile periods and smoother tracking in steady trends, while an overlaid event system highlights breakout confirmations, potential traps, or continuations with visual lines, labels, and percentage deltas from the close. Users benefit from real-time VWAP calculations anchored to events, providing dynamic stop-loss suggestions to help manage exits without manual adjustments. Overall, it layers signal robustness with actionable annotations, reducing noise in fast-moving charts.
Motivation: Why this design?
Standard Supertrend indicators often generate excessive flips in choppy conditions or lag behind in low-volatility drifts, leading to whipsaws that erode confidence in trend direction. This design addresses that by centering bands around a midline that reflects recent price spreads, ensuring adjustments are proportional to observed variability. The added event layer captures regime shifts explicitly, turning abstract crossovers into labeled milestones with trailing VWAP for context, which helps traders distinguish genuine momentum from fleeting noise without over-relying on raw price action.
What’s different vs. standard approaches?
- Baseline reference: Diverges from the classic Supertrend, which uses average true range for fixed offsets from a median price.
- Architecture differences:
- Bands form around a central line averaged from smoothed highs and lows, with offsets scaled by half the range between those smooths.
- Regime direction persists until a clear breach of the prior opposite band, preventing premature reversals.
- Event visualization draws persistent lines from flip points, updating labels based on price sustainment relative to the trigger level.
- VWAP resets at each event, accumulating volume-weighted prices forward for a trailing reference.
- Practical effect: Charts show fewer direction changes overall, with color-coded annotations that evolve from initial breakout to continuation or trap status, making it easier to spot sustained moves early. VWAP lines provide a volume-informed anchor that curves with price, offering visual cues for adverse drifts.
How it works (technical)
The process starts by smoothing high and low prices over a user-defined period to form upper and lower references. A midline sits midway between them, and half the spread acts as a base for band offsets, adjusted by a multiplier to widen or narrow sensitivity. On each bar, the close is checked against the previous bar's opposite band: crossing above expands the lower band downward in uptrends, or below contracts the upper band upward in downtrends, creating a ratcheting effect that locks in direction until breached.
Persistent state tracks the current regime, seeding initial bands from the smoothed values if no prior data exists. Flips trigger new horizontal lines at the breach level, styled by direction, alongside labels that monitor sustainment—price holding above for up-flips or below for down-flips keeps the regime, while reversal flags a trap.
Separately, at each flip, a dashed VWAP line initializes at the breach price and extends forward, accumulating the product of typical prices and volumes divided by total volume. This yields a curving reference that updates bar-by-bar. Warnings activate if price strays adversely from this VWAP, tinting the background for quick alerts.
No higher timeframe data is pulled, so all computations run on the chart's native resolution, avoiding lookahead biases unless repainting is enabled via input.
Parameter Guide
SMA Length — Controls smoothing of highs and lows for midline and range base; longer values dampen noise but increase lag. Default: 20. Trade-offs: Shortens responsiveness in trends (e.g., 10–14) but risks more flips; extend to 30+ for stability in ranging markets.
Multiplier — Scales band offsets from the half-range; higher amplifies to capture bigger swings. Default: 1.0. Trade-offs: Above 1.5 widens for volatile assets, reducing false signals; below 0.8 tightens for precision but may miss subtle shifts.
Show Bands — Toggles visibility of basic and adjusted band lines for reference. Default: false. Tip: Enable briefly to verify alignment with price action.
Show Background Color — Displays red tint on VWAP adverse crosses for visual warnings. Default: false. Trade-offs: Helps in live monitoring but can clutter clean charts.
Line Width — Sets thickness for event and VWAP lines. Default: 2. Tip: Thicker (3–5) for emphasis on key levels.
+Bars after next event — Extends old lines briefly before cleanup on new flips. Default: 20. Trade-offs: Longer preserves history (40+) at resource cost; shorter keeps charts tidy.
Allow Repainting — Permits live-bar updates for smoother real-time view. Default: false. Tip: Disable for backtest accuracy.
Extension 1 Settings (Show, Width, Size, Decimals, Colors, Alpha) — Manages dotted connector from event label to current close, showing percentage change. Defaults: Shown, width 2, normal size, 2 decimals, lime/red for gains/losses, gray line, 90% transparent background. Trade-offs: Fewer decimals for clean display; adjust alpha for readability.
Extension 2 Settings (Show, Method, Stop %, Ticks, Decimals, Size, Color, Inherit, Alpha) — Positions stop label at VWAP end, offset by percent or ticks. Defaults: Shown, percent method, 1.0%, 20 ticks, 4 decimals, normal size, white text, inherit tint, 0% alpha. Trade-offs: Percent for proportional risk; ticks for fixed distance in tick-based assets.
Alert Toggles — Enables notifications for breakouts, continuations, traps, or VWAP warnings. All default: true. Tip: Layer with chart alerts for multi-condition setups.
Reading & Interpretation
The main Supertrend line colors green for up-regimes (price above lower band) and red for down (below upper band), serving as a dynamic support/resistance trail. Flip shapes (up/down triangles) mark regime changes at band breaches.
Event lines extend horizontally from flips: green for bull, red for bear. Labels start blank and update to "Bull/Bear Cont." if price sustains the direction, or "Trap" if it reverses, with colors shifting lime/red/gray accordingly. A dotted vertical links the trailing label to the current close, mid-labeled with the percentage delta (positive green, negative red).
VWAP dashes yellow (bull) or orange (bear) from the event, curving to reflect volume-weighted average. At its end, a left-aligned label shows suggested stop price, annotated with offset details. Background red hints at weakening if price crosses VWAP opposite the regime.
Deltas near zero suggest consolidation; widening extremes signal momentum buildup or exhaustion.
Practical Workflows & Combinations
- Trend following: Enter long on green flip shapes confirmed by higher highs, using the event line as initial stop below. Trail stops to VWAP for bull runs, exiting on trap labels or red background warnings. Filter with volume spikes to avoid low-conviction breaks.
- Exits/Stops: Conservative: Set hard stops at suggested SL labels. Aggressive: Hold through minor traps if delta stays positive, but cut on regime flip. Pair with momentum oscillators for overbought pullbacks.
- Multi-asset/Multi-TF: Defaults suit forex/stocks on 15m–4H; for crypto, bump multiplier to 1.5 for volatility. Scale SMA length proportionally across timeframes (e.g., double for daily). Combine with structure tools like Fibonacci for confluence on event lines.
Behavior, Constraints & Performance
Live bars update lines and labels dynamically if repainting is allowed, but signals confirm on close for stability—flips only trigger post-bar. No higher timeframe calls, so no inherent lookahead, though volume weighting assumes continuous data.
Resources cap at 1000 bars back, 50 lines/labels max; events prune old ones on new flips to stay under budget, with brief extensions for visibility. Arrays or loops absent, keeping it lightweight.
Known limits include lag in extreme gaps (e.g., overnight opens) where bands may not adjust instantly, and VWAP sensitivity to sparse volume in illiquid sessions.
Sensible Defaults & Quick Tuning
Start with SMA 20, multiplier 1.0 for balanced response across majors. For choppy pairs: Lengthen SMA to 30, multiplier 0.8 to tighten bands and cut flips. For trending equities: Shorten to 14, multiplier 1.2 for quicker entries. If traps dominate, enable bands to inspect range compression; for sluggish signals, reduce extension bars to focus on recent events.
What this indicator is—and isn’t
This serves as a visualization and signal layer for trend regimes and breakouts, highlighting sustainment via annotations and risk cues through VWAP—ideal atop price action for confirmation. It is not a standalone system, predictive oracle, or risk calculator; always integrate with broader analysis, position sizing, and stops. Use responsibly as an educational tool.
Disclaimer
The content provided, including all code and materials, is strictly for educational and informational purposes only. It is not intended as, and should not be interpreted as, financial advice, a recommendation to buy or sell any financial instrument, or an offer of any financial product or service. All strategies, tools, and examples discussed are provided for illustrative purposes to demonstrate coding techniques and the functionality of Pine Script within a trading context.
Any results from strategies or tools provided are hypothetical, and past performance is not indicative of future results. Trading and investing involve high risk, including the potential loss of principal, and may not be suitable for all individuals. Before making any trading decisions, please consult with a qualified financial professional to understand the risks involved.
By using this script, you acknowledge and agree that any trading decisions are made solely at your discretion and risk.
Do not use this indicator on Heikin-Ashi, Renko, Kagi, Point-and-Figure, or Range charts, as these chart types can produce unrealistic results for signal markers and alerts.
Best regards and happy trading
Chervolino

QQQ overlay over NQ/NDXThis enhanced version of the QQQ overlay script builds on the original by © PtGambler, adding smoothing via stepped ratios updated on candle close to eliminate oscillation, optimizing performance by reusing lines/labels, restricting visibility to relevant symbols (NDX, NQ1!, NAS100USD), and improving visuals with rounded levels, adjustable level counts (default 5 total), extended lines, and label styles matching "Key Levels" indicator for better readability (gray text, transparent background). Removed unnecessary table and floating labels for a cleaner chart. Thanks to © PtGambler for the foundational work!

Relative Valuation OscillatorRelative Valuation Oscillator (RVO) Description
The Valuation_OTC.pine script is a Relative Valuation Oscillator for TradingView that compares the current asset against a reference asset (like Bitcoin, S&P 500, or Gold) to determine if it's relatively overvalued or undervalued.
Key Features:
1. Multiple Calculation Methods:
Simple Ratio - Compares price ratio deviation from average
Percentage Difference - Direct percentage comparison between assets
Ratio Z-Score - Statistical measure (standard deviations from mean)
Rate of Change Comparison - Compares momentum/performance
Normalized Ratio - 0-100 scale centered at zero
2. Customizable Settings:
Reference asset selection (default: BTC/USDT)
Adjustable lookback period (10-500 bars)
Optional smoothing with configurable period
Overbought/oversold level thresholds (default: ±1.5)
3. Trading Signals:
Overvalued - Oscillator above overbought level (red zone)
Undervalued - Oscillator below oversold level (green zone)
Neutral - Between thresholds
Crossover alerts for key levels
Divergence detection (bullish/bearish)
4. Visual Components:
Color-coded oscillator line (green when positive, red when negative)
Optional signal line for additional smoothing
Background shading for valuation zones
Information table showing current metrics and status
Shape markers for crossovers and divergences
5. Alert Conditions:
Overvalued/undervalued alerts
Zero-line crossovers
Divergence signals
This indicator is useful for pairs trading, relative strength analysis, and identifying when an asset is trading at extremes relative to a benchmark asset.

Stock Fundamental Overlay [DarwinDarma]Stock Fundamental Overlay
Stock Fundamental Overlay is a comprehensive valuation indicator that displays multiple fundamental analysis metrics directly on your price chart.
Key Features:
• Graham Number - Benjamin Graham's intrinsic value formula
• Book Value Per Share (BVPS) - Net asset value baseline
• DCF Valuation - Discounted Cash Flow analysis (non-financial stocks)
• DDM Valuation - Dividend Discount Model (dividend-paying stocks)
• Visual Value Zones - Color-coded undervalued/overvalued regions
• Real-time Fundamental Table - Live metrics and valuations
• Price vs Graham Comparison - Quick valuation assessment
• Built-in Alerts - Notification when price crosses key levels
Valuation Models:
• Graham Number: √(22.5 × EPS × BVPS)
• DCF: Customizable discount rate, growth rate, and forecast period
• DDM: Gordon Growth Model for dividend analysis
Visual Elements:
• Plot lines for BVPS, Graham Number, and DCF values
• Shaded value zone between BVPS and Graham Number
• Background coloring: Deep value (below BVPS), Undervalued (below Graham), Overvalued (>1.5x Graham)
• Dynamic table showing all metrics with theme-aware text colors
Special Handling:
• Financial sector detection - DCF disabled for banks/financials where FCF metrics are distorted
• Automatic light/dark theme adaptation
• TTM (Trailing Twelve Months) data for current metrics
How to Use - Value Investing Approach:
1. Identifying Undervalued Stocks:
• Look for price trading BELOW the Graham Number (green zone) - potential value opportunity
• Deep value: Price below BVPS indicates trading below net asset value
• Check "Price vs Graham" % in table - negative values suggest undervaluation
• Compare multiple models: When price is below Graham, DCF, and BVPS simultaneously, stronger buy signal
2. Margin of Safety:
• Benjamin Graham recommended buying at 2/3 of intrinsic value (33% margin of safety)
• Monitor the gap between current price and valuation lines
• Larger gaps = greater margin of safety = lower downside risk
• Use the shaded "Value Zone" as your target buying range
3. Setting Alerts:
• "Price Below Graham Number" - Notifies when stock enters value territory
• "Price Below Book Value" - Extreme value alert for deep value hunters
• "Price Below DCF Value" - Cash flow-based value signal
• Set alerts on watchlist stocks to catch value opportunities
4. Customizing for Your Strategy:
• Conservative investors: Use lower growth rates (3-4%) and higher discount rates (12-15%)
• Growth-value investors: Adjust growth rate (6-8%) for quality compounders
• Dividend investors: Focus on DDM value and Div/Share metrics
• Adjust forecast years based on business predictability (stable = 10 years, cyclical = 5 years)
5. Red Flags to Avoid:
• Negative EPS or FCF (red values in table) - proceed with caution
• Financial sector stocks - Use DDM and Graham, ignore DCF
• Price far above Graham (>1.5x) with red background = overvalued territory
• No fundamental data = "N/A" in table - stock may lack reporting or be too small
• Stock persistently below BVPS for extended periods - potential value trap or business in distress
• Price significantly above ALL models (BVPS, Graham, DCF) - sentiment-driven, lacks intrinsic value foundation (fragile)
⚠️ Important Value Investing Warnings:
• Value Trap Alert: A stock staying below BVPS for months/years may signal fundamental deterioration, asset impairments, or dying industry - not just "cheap." Investigate WHY it's cheap before buying
• Sentiment Bubble Risk: When price trades far above BVPS, Graham Number, AND DCF simultaneously, the stock has no intrinsic value basis. Examples: commodity stocks during boom cycles (gold miners in gold rallies), meme stocks, hype-driven sectors. These are highly fragile and vulnerable to mean reversion
• Cyclical Trap: Commodity/cyclical stocks can appear "cheap" at peak earnings (low P/E, high FCF) but are actually expensive. Normalize earnings across the cycle before valuing
• Quality Matters: Some excellent businesses (asset-light, high ROIC) naturally trade above book value. Don't avoid quality - adjust expectations for business model
6. Monitoring Positions:
• Watch for price approaching or exceeding Graham Number - consider taking profits
• Track EPS and FCF trends quarter-to-quarter in the table
• If fundamentals deteriorate (falling BVPS, negative FCF), reassess thesis
• Use background colors for quick visual check: green = hold/buy, red = overvalued
Perfect for:
Value investors seeking multi-model fundamental analysis, long-term investors comparing intrinsic value to market price, dividend investors evaluating yield stocks, and fundamental traders looking for entry/exit signals.
Note: Only works with stocks that have financial data available. Not applicable to crypto, forex, or futures. This indicator provides analysis tools; always conduct thorough research and due diligence before investing.

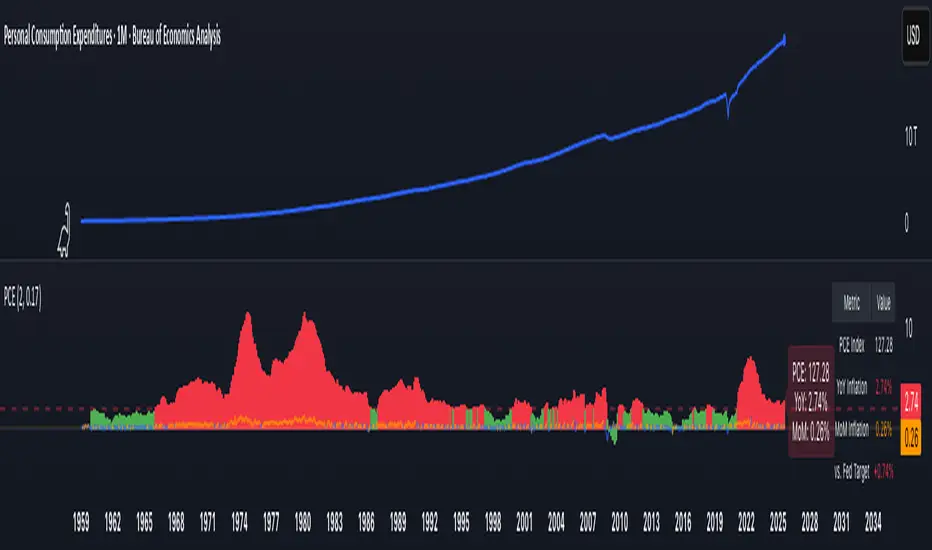
PCE Inflation Monitor (Change YoY & MoM)📊 PCE Inflation Monitor - The Fed's Most Important Metric
Personal Consumption Expenditures (PCE) is the Federal Reserve's preferred inflation measure and THE metric they target for their 2% inflation goal. If you want to predict Fed policy, you need to watch PCE.
🎯 KEY FEATURES:
- Dual Perspective Analysis:
- Year-over-Year (YoY): Histogram bars showing annual PCE inflation
- Month-over-Month (MoM): Line overlay showing monthly consumption price changes
- Visual Reference System:
- Dashed line at 2% (Fed's official PCE inflation target)
- Dotted line at 0.17% (equivalent monthly target)
- Color-coded bars: Red above Fed target, Green below target
- Real-Time Data Table:
- Current PCE Index value
- YoY inflation rate vs. Fed's 2% target
- MoM inflation rate with color coding
- Exact deviation from Fed target (critical for policy predictions)
- Automated Alerts:
- PCE crosses Fed's 2% target (major policy signal!)
- MoM crosses monthly target
- Stay informed of Fed-relevant inflation changes
📈 WHY PCE IS DIFFERENT (AND MORE IMPORTANT):
PCE vs. CPI differences:
- Flexible basket: PCE adjusts for substitution (beef → chicken if prices rise)
- Broader coverage: Includes healthcare paid by insurance/government
- Lower readings: Typically 0.2-0.4% below CPI
- Fed's choice: Explicitly stated as their target metric
Most importantly: When Powell speaks about "our 2% target," he means PCE, not CPI!
🔍 TRADING IMPLICATIONS:
PCE Above 2% (Red Zone):
→ Fed under pressure to maintain/raise rates
→ Hawkish policy stance likely
→ Negative for growth stocks, crypto
→ Positive for USD, bearish for gold
PCE Below 2% (Green Zone):
→ Fed has flexibility to cut rates
→ Dovish policy stance possible
→ Positive for risk assets, growth stocks
→ Negative for USD, bullish for commodities
PCE Approaching 2% from Above:
→ Fed "mission accomplished" narrative
→ Rate cut cycle becomes possible
→ Major bullish signal for equities/crypto
💡 ADVANCED STRATEGIES:
1. Fed Meeting Preparation: Check PCE before FOMC meetings for policy clues
2. Dot Plot Predictions: PCE trend determines Fed's rate forecast updates
3. Pivot Timing: When PCE MoM turns negative, Fed pivot becomes realistic
4. Press Conference Analysis: Compare Powell's comments to PCE deviation
🎯 KEY LEVELS TO WATCH:
- 2.0% YoY: Fed's official target - crossing this level is major news
- 2.5% YoY: "Uncomfortably high" - Fed forced to stay restrictive
- 3.0% YoY: "Crisis mode" - Fed turns very hawkish
- 1.5% YoY: "Below target" - Rate cuts become likely
🔄 COMBINE WITH:
- CPI: Public perception vs. Fed's metric (often diverge)
- Core PCE: Even more important (excludes food/energy volatility)
- Fed Funds Rate: Is Fed responding appropriately to PCE?
📊 DATA SOURCE:
Official PCE data from FRED (Federal Reserve Economic Data), updated monthly typically in the last week of each month (after CPI/PPI releases).
🎨 CUSTOMIZATION:
Fully customizable:
- Toggle YoY/MoM displays
- Adjust Fed target if needed
- Customize colors
- Show/hide absolute PCE values
Perfect for: Fed watchers, macro traders, policy analysts, and serious investors who want to predict monetary policy changes before they happen.
⚠️ CRITICAL INSIGHT: While media focuses on CPI, the Fed focuses on PCE. Trade what the Fed trades, not what the headlines say.
🎓 Pro Tip: Fed members often mention "Core PCE" (excluding food/energy). Consider adding that indicator alongside this one for complete Fed policy analysis.
ES cuhthis strategy uses laggard rsi to compute the best parameters to go long and tp at key levels. the overall trend strength within the rsi laggard indicator is what is used to automate the calculations within the script. enjoy and paramter optimize

Magic Volume - Projected [MW]Magic Volume – Projected
This lower-pane volume tool estimates the full-bar volume before the bar closes by measuring the current bar’s elapsed time and the rate of incoming volume. It then contrasts that “expected volume” against typical activity and recent momentum to spotlight potential burst conditions (breakout/acceleration), color-codes the live volume stream, and annotates when the projected surge is likely bullish or bearish based on bar structure and recent highs/lows.
Settings
Projected / Expected Volume
Moving Average: EMA length used for volume baseline comparisons. (Default: 14)
Minimum Volume: Hard floor the bar’s raw volume must exceed to qualify as notable. (Default: 10,000)
Consecutive Volume Above 14 EMA: Count required for “sustained” high-volume context. (Default: 3)
Stochastic Volume Burst
Stochastic Length: Window for the Stochastic calculation on volume. (Default: 8)
Smoothing: Smoothing applied to Stochastic volume and its signal. (Default: 3)
Stochastic Volume Breakout Threshold: Level above which Stochastic volume is considered a breakout. (Default: 20)
Volume Bar Increase Amount: Multiplier the current bar’s volume must exceed vs. prior bar to be considered a “burst.” (Default: 1.618)
Plotted Items
Expected Volume (columns): Magenta columns projecting the full-bar volume from intrabar rate. Turns lime when a high expected-volume condition aligns with bullish bar structure; turns red under analogous bearish conditions.
Actual Volume (columns): Live volume columns, color-coded by state:
• Blue = baseline;
• Orange = “burst” (volume rising fast above prior × factor and above baseline);
• Yellow = “burst at breakout” (burst + Stochastic volume breakout);
• Light Blue = Stochastic breakout only.
Volume EMA (line): Yellow EMA for baseline comparison (default 14).
Calculations
Compute elapsed time in the current bar (ms → seconds) and convert the current bar’s accumulated volume into a rate (volume per second).
Project full-bar Expected Volume = (volume so far / seconds elapsed) × bar-seconds.
Compute Volume EMA (default 14) for baseline; derive Stochastic(volume, length) and smoothed signal for momentum.
Define “Burst” conditions:
• Volume > prior volume × Volume Bar Increase Amount;
• Volume > Minimum Volume;
• Volume > Volume EMA;
• Stochastic(volume) rising and/or above threshold.
Classify “Burst at Breakout” when Burst aligns with Stochastic crossover above the Breakout Threshold.
Classify Bullish/Bearish Expected Volume: if Expected Volume is ≥ 1.618 × prior bar volume and prior volume > Volume EMA, then:
• Bullish if bar is green with a rising low;
• Bearish if bar is red with a falling high.
Color-map actual volume columns by state; overlay Expected Volume columns (magenta) and paint conditional overlays (lime/red) when directional context is detected.
How to Use
Spot the Surge Early
When Expected Volume spikes well above typical (and especially above ~1.618× the prior bar) before the bar closes, it often precedes a volatile move. Use this to prepare entries with tight, structure-based risk (e.g., just beyond the current bar’s wick) and asymmetric targets.
Confirm with Momentum
Yellow/orange volume columns indicate burst/breakout behavior in the live tape. When this aligns with a lime (bullish) or red (bearish) Expected Volume column, the probability of follow-through improves—particularly if aligned with prevailing trend or key levels.
Context Matters
Combine with your preferred S/R or structure tools (e.g., order blocks, channels, VWAP) to avoid chasing into obvious supply/demand. The projected surge can mark both continuations and sharp reversals depending on location and broader context.
Alerts
High Expected Volume – Bullish: When projected volume surges and the price action meets bullish conditions (green body with rising low).
High Expected Volume – Bearish: When projected volume surges and the price action meets bearish conditions (red body with falling high).
Other Usage Notes and Limitations
Projected volume depends on intrabar pace; abrupt pauses/flushes can change the projection quickly, especially on very small timeframes.
Minimum Volume and EMA baselines help filter thin markets; adjust upward on illiquid symbols to reduce noise.
A rising projection does not pick direction on its own—directional coloring (lime/red) requires price-action confirmation; otherwise treat magenta projections as “heads-up” only.
As with any single indicator, use within a broader plan (risk management, structure, confluence) to mitigate false positives and improve selectivity.
Inputs (Quick Reference)
Moving Average (int, default 14)
Stochastic Length (int, default 8)
Smoothing (int, default 3)
Stochastic Volume Breakout Threshold (int, default 20)
Volume Bar Increase Amount (float, default 1.618)
Minimum Volume (int, default 10,000)
Consecutive Volume Above 14 EMA (int, default 3)

Al Brooks II.IOI.OO# Al Brooks Consecutive Bar Patterns (II/OO/IOI)
## Overview
This indicator automatically identifies Al Brooks' key consecutive bar patterns that signal important market transitions. Enhanced with both **traditional (high/low)** and **body (open/close)** detection methods for more accurate signals.
## Pattern Definitions
### 📊 II Pattern - Double Inside Bars
- **Signal**: Two consecutive inside bars
- **Market Meaning**: Volatility contraction, breakout pending
- **Trading**: Wait for breakout, trade with momentum
### 📊 OO Pattern - Double Outside Bars
- **Signal**: Two consecutive outside bars
- **Market Meaning**: Volatility expansion, trend acceleration or reversal
- **Trading**: Watch for exhaustion at key levels
### 📊 IOI Pattern - Inside-Outside-Inside
- **Signal**: Inside bar → Outside bar → Inside bar sequence
- **Market Meaning**: Market indecision, complex consolidation
- **Trading**: Avoid early entries, wait for clear direction
## Features
✅ **Dual Detection System**
- Traditional: Uses high/low prices (catches wicks)
- Body: Uses open/close prices (focuses on real trading range)
- Combined: Triggers when either condition is met
✅ **Visual Markers**
- Clear labels above/below bars
- Color-coded backgrounds
- Detection source indicators (h=high/low, b=body, +=both)
✅ **Smart Alerts**
- Real-time pattern detection
- Separate alerts for body-only patterns
- Customizable notification settings
## Settings
**Display Options**
- Show/hide each pattern type
- Toggle detection methods
- Customize colors
**Detection Modes**
- High/Low Detection: Traditional wick-based
- Body Detection: Open/Close based
- Show Source: Display what triggered the pattern
## Trading Tips
1. **Best Timeframes**: 1H, 4H, Daily
2. **Combine with**: Volume, trend indicators, support/resistance
3. **Risk Management**:
- II: Tight stops inside pattern
- OO: Wider stops due to volatility
- IOI: Scale in positions
## Label Meanings
- `ii` / `OO` / `ioi` = Base pattern detected
- `+h` suffix = High/Low triggered
- `+b` suffix = Body triggered
- `++` suffix = Both conditions met (strongest signal)
## Author Notes
Based on Al Brooks' price action methodology from his Trading Price Action series. This enhanced version adds body detection to filter out wick-only patterns and reduce false signals.
---
*For educational purposes only. Trading involves risk.*
**Version 2.0** | **Pine Script v6** | **@JimmC98**
Multi-Timeframe Sweep IndicatorsLiquidity Sweeps: Identify when price sweeps stops above/below key levels
Breakout Confirmation: Confirm breakouts across multiple timeframes
Entry Timing: Use lower timeframe sweeps for precise entries
Risk Management: Higher timeframe sweeps may indicate stronger moves
The indicator works best when combined with other analysis techniques like support/resistance levels, volume analysis, and market structure.
Multi-TF 👀### Multi-Timeframe Analysis (MTF-Analysis)
**Overview**
The Multi-Timeframe Analysis indicator is a powerful visualization tool designed for traders who incorporate multi-timeframe (MTF) strategies into their decision-making process. It overlays compact, customizable candle representations from up to four higher timeframes directly on your chart, positioned to the right of the last bar for quick reference. This allows you to monitor price action, momentum via EMAs, and key levels like Fair Value Gaps (FVGs) across multiple resolutions without switching charts. Built with efficiency in mind, it supports automatic timeframe detection, real-time updates, and a clean, non-intrusive design that enhances your trading workflow.
Ideal for day traders, swing traders, and scalpers, this indicator helps identify alignments between timeframes, spot potential reversals or continuations, and validate entries/exits based on higher-timeframe context. It leverages Pine Script v6 for smooth performance, with optimizations to handle up to 5000 bars back and extensive drawing limits.
**Key Features**
- **Multi-Timeframe Candle Display**: Renders recent candles (configurable from 5 to 100 per timeframe) from selected higher timeframes (e.g., 5m, 15m, 1H, 4H) as compact bars with customizable width, spacing, and padding. Bullish and bearish candles are color-coded for instant recognition.
- **Automatic Timeframe Adaptation**: When enabled, the indicator intelligently selects complementary timeframes based on your chart's resolution (e.g., on a 1m chart, it might show 5m, 15m, and 1H). Manual overrides are available for full control.
- **EMA Overlays**: Plots EMA9, EMA21, and EMA50 on each MTF section using a user-defined source (e.g., OHLC/4, close). EMAs can be dashed for clarity and enabled/disabled per timeframe, helping to gauge momentum and trend strength.
- **Fair Value Gaps (FVGs)**: Detects bullish (+FVG) and bearish (-FVG) gaps with a configurable lookback length (5-50 bars). Gaps are visualized as dotted boxes extending from the candle, highlighting potential support/resistance zones or imbalances.
- **Time Labels and Debugging**: Displays timestamp labels under every fourth candle for chronological context. A debug mode expands spacing and adds detailed labels (e.g., OHLC, volume, EMA values) for testing and verification.
- **Customization Options**: Extensive inputs for colors (bodies, wicks, EMAs, FVGs), label sizes/styles, and layout ensure seamless integration with your chart theme. Supports futures symbols with a time offset adjustment.
- **Performance Optimizations**: Uses arrays for efficient data management, clears drawings on realtime updates or timeframe changes, and limits buffer sizes to prevent overload.
**How to Use**
1. Add the indicator to your chart via TradingView's "Indicators" menu.
2. Configure timeframes: Enable/disable up to four TFs and set the number of candles to display. Use "Auto Timeframe" for smart defaults.
3. Adjust EMAs: Select the source type and toggle per TF to focus on relevant momentum signals (e.g., EMA9 crossovers for short-term trades).
4. Enable FVGs: Activate per TF and tweak the length to suit your market (shorter for volatile assets, longer for trends).
5. Fine-tune appearance: Modify padding, candle width, and colors to avoid clutter. Use debug mode during setup.
6. Interpret: Align your chart's price action with MTF candles—look for confluence in trends, FVGs filling as support/resistance, or EMA alignments for high-probability setups.
**Input Settings**
- **General**: Hour offset for time adjustments (useful for futures).
- **Timeframes**: Enable TFs 1-4, select resolutions (e.g., "5m"), and set candle counts. Auto mode simplifies this.
- **FVG/iFVG**: Toggle per TF, customize colors and detection length.
- **EMA**: Enable per TF, choose source, colors, and dashed style.
- **Candle Appearance**: Bull/bear colors for bodies/wicks, width/spacing/padding, label size/color.
- **Debug**: Expands view for detailed inspection.
**Notes**
- This indicator is non-repainting and updates in realtime, but performance may vary on lower timeframes with many candles—reduce counts if needed.
- FVGs are calculated locally on recent bars for efficiency; historical gaps beyond the buffer aren't shown.
- Compatible with all symbols, but best on volatile markets like forex, crypto, or indices.
- Feedback welcome—updates may include more MA types or advanced FVG filters.
Enhance your edge with multi-timeframe insights—try MTF-Analysis today!

Futures Playbook: VWAP + OR + Cross-Asset TellsFutures Playbook: VWAP + OR + Cross-Asset Tells (with Trade Messages + Coach Panel)
This all-in-one futures trading toolkit combines Opening Range (OR) levels, VWAP, and cross-asset signals to help traders quickly read intraday structure, manage execution, and filter noise.
Core Features
• Opening Range (OR):
• Customizable OR window with High/Low and Midpoint.
• Automatic shading of the OR zone.
• VWAP & Bands:
• Built-in or session-anchored VWAP.
• Optional standard deviation bands for context.
• Cross-Asset Tells:
• Live reads on US 10Y yield, DXY, Crude, and Gold.
• Regime detection: rates risk, USD strength, energy softness, and real-rate easing.
• Confirmations:
• Volume vs. moving average filter.
• Cumulative delta with smoothing.
• ATR-based chop filter to avoid low-quality trends.
Trade Messages + Coach Panel
• Trade Messages (labels): Automatic on-chart prompts for OR completion, VWAP reclaim/loss, long/short setups, and EU close flows.
• Coach Panel (table): Real-time dashboard with regime context, directional bias, execution notes, risk reminders, and key levels (ORH, ORL, VWAP).
Alerts
• OR breakout (long/short with confirmations).
• VWAP reclaim or loss.
• 10Y yield crossing risk threshold.
Use Case
Designed for futures traders and scalpers who rely on VWAP + OR dynamics and need cross-asset confirmation before committing to trades. Great for structuring entries, managing risk, and filtering market noise throughout the session.

Simple Pivot Zones (Error-free) — v11. Core Idea
The indicator we built is a “pivot-based zone detector with breakout signals.”
It does three things:
1. Finds important swing highs and swing lows in price (pivots).
2. Creates support and resistance zones around those pivots using volatility (ATR).
3. Watches price action to see if those zones get broken, then gives signals.
________________________________________
2. What is a Pivot?
A pivot high happens when the price makes a local peak — a bar is higher than the bars around it.
A pivot low happens when the price makes a local dip — a bar is lower than the bars around it.
These are natural turning points in the market, showing where buyers or sellers had strong control temporarily. Traders often use them to draw support (pivot lows) and resistance (pivot highs).
________________________________________
3. Why Use ATR for Zones?
ATR (Average True Range) measures the average volatility of a market. Instead of drawing just a flat line at the pivot, we create a zone above and below it, sized according to ATR.
Example:
• If ATR is 20 points and zone size is 0.5, then the zone extends 10 points above and below the pivot level.
This turns thin “lines” into thicker areas of interest. Real markets don’t respect razor-thin levels, but zones are more realistic.
________________________________________
4. How Support & Resistance Zones Work
• Resistance zones are created at pivot highs. They mark where sellers were strong before.
• Support zones are created at pivot lows. They mark where buyers were strong before.
Over time, these zones extend forward until the price interacts with them.
________________________________________
5. Breakout Detection
The indicator checks whether the price closes beyond the last pivot high or low:
• If price closes above the last pivot high, it means buyers have broken resistance.
• If price closes below the last pivot low, it means sellers have broken support.
These moments are significant because they often trigger trend continuation.
________________________________________
6. Parameters It Uses
1. Pivot Length – how many bars to look back and forward to confirm a pivot. A higher length makes pivots less frequent but stronger.
2. ATR Length and Multiplier – defines the size of the zones (wider zones in more volatile markets).
3. Max Zones to Keep – avoids clutter by keeping only the most recent zones.
4. Colors & Styling – helps traders visually separate bullish and bearish zones.
________________________________________
7. How It Helps Traders
• Visual clarity: Instead of guessing support and resistance, the chart automatically highlights them.
• Dynamic adjustment: Zones adapt to volatility using ATR, making them useful in both calm and volatile markets.
• Breakout signals: Traders get notified when price actually breaks key levels, instead of reacting late.
• Cleaner charts: Instead of dozens of hand-drawn lines, the tool manages zones for you, deleting old ones.
________________________________________
8. The Logic in One Sentence
It finds important swing highs and lows, turns them into support/resistance zones scaled by volatility, and alerts you when the market breaks through them.
________________________________________
👉 In practice, this helps traders spot where the market is likely to bounce or break, and gives a framework to plan trades — for example, buying on bullish breakouts or selling on bearish breakouts.
________________________________________
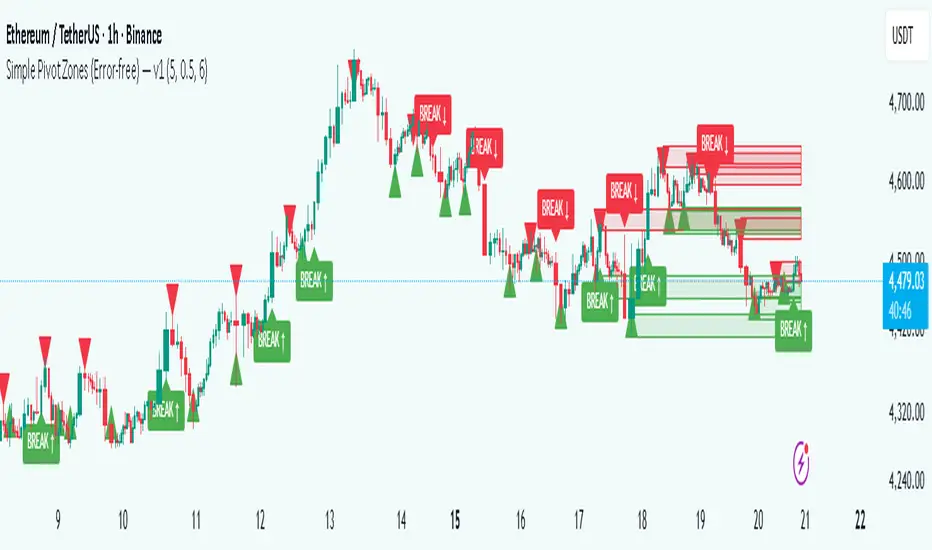
Analitica Trading — Previous Day SR (2 lines + labels) 2.0📊 Analitica Trading — Previous Day SR (Support & Resistance)
This indicator displays the previous day’s key levels on any timeframe:
Prev High → Green horizontal line with label.
Prev Low → Red horizontal line with label.
🔹 Stable across timeframes: The levels are calculated from the daily candles and remain fixed, no matter if you switch to 1D, 1H, or 5m.
🔹 Simple & clean: Exactly two lines only (no duplicates).
🔹 Price labels included: Each line has a clear tag showing the exact level.
🔹 Dynamic update: Lines refresh automatically at the start of each new daily session.
🔹 Alerts: Optional alerts trigger when the price breaks above the Prev High or below the Prev Low.
💡 Ideal for support/resistance trading, breakouts, and Smart Money Concepts (SMC) strategies.
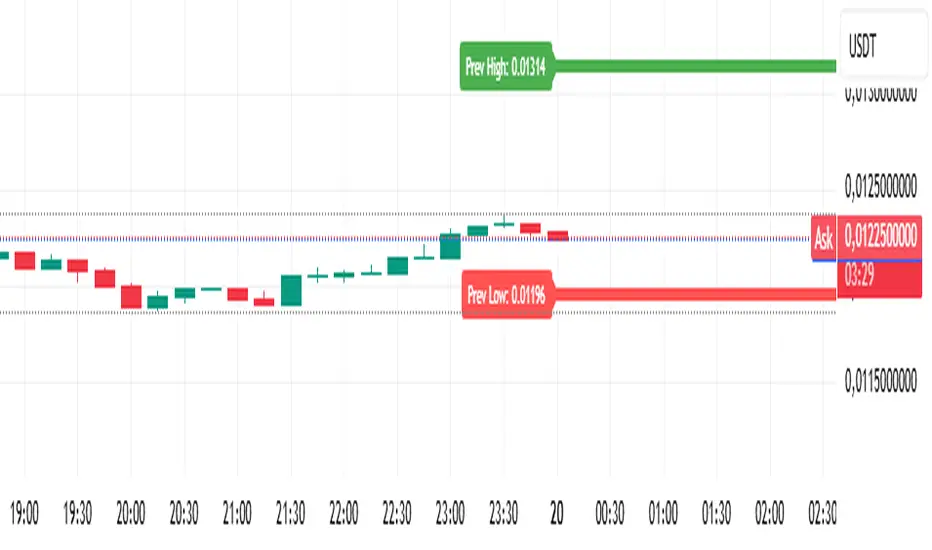
FU + SMI Validator (Proper FU, 30m)Overview
The FU + SMI Validator is a sophisticated technical analysis indicator designed to detect Proper FU (Fakeouts or Liquidity Sweeps) on the 30-minute timeframe. This tool aims to help traders identify high-probability reversal setups that occur when price briefly breaks key levels (sweeping liquidity), then reverses with momentum confirmation.
Fakeouts are common market events where price action “hunts stops” before reversing direction. Correctly identifying these events can offer excellent entry points with defined risk. This indicator combines price action logic with momentum and volatility filters to provide reliable signals.
Core Concepts
Proper FU (Fakeout) Detection
At its core, the script identifies proper fakeouts by checking if the current bar’s price:
For bullish fakeouts: dips below the previous bar’s low (sweeping stops) and then closes above the previous bar’s high
For bearish fakeouts: spikes above the previous bar’s high and then closes below the previous bar’s low
This ensures that the breakout is a true sweep rather than just a one-sided close.
Optionally, the script can require one additional confirmation bar after the FU, ensuring that the momentum is sustained and reducing false signals.
SMI-style Momentum Validation
To improve the quality of signals, the indicator uses a proxy for the Stochastic Momentum Index (SMI) by calculating the difference between current and past linear regression slopes of price. This momentum check helps ensure that fakeouts occur alongside actual directional strength.
Key points:
Momentum must be increasing in the direction of the FU signal.
Momentum filters can be enabled or disabled based on user preference.
Squeeze Condition to Avoid Low-Volatility Traps
The script includes a volatility filter based on a squeeze-like condition:
It compares Bollinger Bands (BB) and Keltner Channels (KC).
When BB bands contract inside KC bands, the market is in a squeeze state, signaling low volatility.
Fakeouts during squeeze conditions are often unreliable; the script can filter these out to reduce false alarms.
Killzone Session Timing Filter
Recognizing that liquidity and volatility vary by session, this tool supports optional filtering for:
London Killzone: 09:00 to 10:30 (UK time)
New York Killzone: 13:00 to 14:30 (UK time)
Signals only trigger during these high-activity windows if enabled, helping traders focus on periods with the best liquidity and market participation.
Note: For Killzone filtering to work accurately, your TradingView chart must be set to the UK timezone.
Features & Benefits
Robust FU detection ensures the breakout price action is meaningful, reducing noise.
Momentum filter via linear regression slope captures trend strength in a smooth, mathematically sound way.
Low-volatility squeeze avoidance helps reduce false signals in choppy or range-bound markets.
Killzone timing filter focuses your attention on the most liquid and active market hours.
Optional confirmation bar increases signal reliability.
Raw FU markers allow visualization of all detected fakeouts for pattern recognition and manual analysis.
Alerts built-in for both valid buy and sell FU setups, enabling real-time notification and quicker decision-making.
Customization Options
Killzone usage: Enable or disable the session timing filter.
Sessions: Configure London and New York killzone time ranges.
Momentum alignment: Enable or disable momentum filter based on SMI proxy.
Volatility filter: Avoid signals during squeeze or low-volatility conditions.
FU confirmation: Option to require one additional confirming candle after the initial FU.
Squeeze and momentum parameters: Adjust Bollinger Bands length and multiplier, Keltner Channel length and ATR multiplier.
Raw FU markers: Show or hide all detected fakeouts regardless of filters.
How to Use This Indicator
Apply to 30-minute charts for forex pairs, indices, cryptocurrencies, or other instruments.
Set your chart timezone to UK time if using Killzone filters.
Adjust input parameters based on your preferred sessions and risk tolerance.
Look for green “VALID BUY FU” labels below bars for bullish fakeout entries.
Look for red “VALID SELL FU” labels above bars for bearish fakeout entries.
Use the alert system to receive notifications on setups.
Combine with your existing analysis or risk management strategy for entries, stops, and profit targets.
Why Use FU + SMI Validator?
Fakeouts are some of the most lucrative but tricky setups for many traders. Without proper filters, they can lead to false entries and losses. This script integrates price action, momentum, volatility, and session timing into one package, providing a robust tool to spot high-quality fakeout opportunities and improve trading confidence.
Limitations
Requires chart to be set to UK timezone for session filters.
Designed specifically for 30-minute timeframe — performance on other timeframes may vary.
Momentum is a proxy, not a direct SMI calculation.
Like all indicators, best used in conjunction with sound risk management and other analysis tools.
Potential Enhancements
Conversion into a full strategy script for backtesting entries and exits.
Addition of other momentum indicators (RSI, MACD) or volume filters.
Customizable time zones or auto time zone detection.
Multi-timeframe analysis capabilities.
Visual dashboard for summary of signal stats.
