SCTI-D1SCTI-D1 Indicator Introduction / 指标简介
The SCTI-D1 (Smart Composite Trading Indicator - Daily) is a comprehensive, multi-feature trading tool designed for serious traders who demand depth, flexibility, and clarity in their market analysis. This indicator combines several powerful concepts into one seamless workflow, including:
Multiple EMA Systems with customizable lengths and visibility
PMA (Projected Moving Average) with fill options between lines
VWAP with configurable anchors and deviation bands
Divergence Detection for MACD and Histogram
Volume Profile with node detection (peaks, troughs, highs, lows)
Smart Money Concepts including order blocks, fair value gaps, equal highs/lows, and market structure shifts
Whether you trade stocks, forex, or cryptocurrencies, the SCTI-D1 helps you identify key levels, track institutional activity, and spot high-probability reversal signals—all in one clean, customizable interface.
SCTI-D1 指标简介
SCTI-D1(智能综合交易指标 - 日线版)是一款功能全面的交易工具,专为需要深度、灵活性和清晰市场分析的专业交易者设计。该指标将多种强大概念融合在一个流畅的工作流程中,包括:
多组EMA系统,可自定义长度和显示
PMA(投影移动平均线),支持均线间填充色
VWAP,可配置锚定周期和偏差带
背离检测,支持MACD和柱状图
成交量分布,支持节点检测(峰值、谷值、最高、最低)
聪明钱概念,包括订单块、公允价值缺口、等高/等低和市场结构转换
无论您交易股票、外汇还是加密货币,SCTI-D1 都能帮助您识别关键水平、跟踪机构资金动向并发现高概率反转信号——所有功能均集成在一个清晰可定制的界面中。
"key levels"に関するスクリプトを検索

CVD Absorption + Confirmation [Orderflow & Volume]This indicator detects bullish and bearish absorption setups by combining Cumulative Volume Delta (CVD) with price action, candlestick, and volume confirmations.
🔹 What is Absorption?
Absorption happens when aggressive buyers/sellers push CVD to new highs or lows, but price fails to follow through.
Bearish absorption: CVD makes a higher high, but price does not.
Bullish absorption: CVD makes a lower low, but price does not.
This often signals that limit orders are absorbing aggressive market orders, creating potential reversal points.
🔹 Confirmation Patterns
Absorption signals are only shown if they are validated by one of the following patterns:
Engulfing candle with low volume → reversal faces little resistance.
Engulfing candle with high volume → strong aggressive participation.
Pin bar with high volume → absorption visible in the wick.
CVD flattening / slope reversal → shift in aggressive order flow.
🔹 Signals
✅ Bullish absorption confirmed → Green label below the bar.
❌ Bearish absorption confirmed → Red label above the bar.
Each label represents a potential reversal setup after orderflow absorption is validated.
🔹 Alerts
Built-in alerts are included for both bullish and bearish confirmations, so you can track setups in real-time without watching the chart 24/7.
📌 How to Use:
Best applied at key levels (supply/demand, VWAP, OR, liquidity zones).
Look for confluence with your trading strategy before taking entries.
Works on all markets and timeframes where volume is reliable.

HTF POC with Zones & AlertsPlots a Point of Control (POC) per candle from a timeframe you choose (MTF). Because TradingView doesn’t expose true footprint data, the POC here is a proxy (choose: Body Mid, Range Mid, or Typical Price HLC3). The script draws the POC line and an optional POC zone (±% of that candle’s range), then alerts when price retests the zone (wick touches count).
Use it to:
Mark key levels inside candles that often act as magnets or reaction zones
Track retests of strong bars (imbalance) across higher timeframes
Add clean confluence with S/R, FVGs, or trend tools
Features: Selectable TF, zone width, extend lines/zones, historical caps, alerts, and info panel.
Note: This is an estimate of POC from OHLC, not real bid/ask volume. Use as context, not a standalone signal.

Volume Imbalance Analyzer - 70% & 80% Version1.01Here’s a clean “definition” you can drop into your docs. It explains **what** the indicator is, **what it helps with**, and **how** to use it—plain and practical.
# Definition
**Volume Imbalance Analyzer (70% & 80%)** flags bars where estimated buy vs. sell volume is heavily one-sided. It colors those bars, adds labels (B70/B80 or S70/S80), and can alert you in real time. The goal is to quickly spot spots of **aggressive participation** (buyers or sellers) that often act as magnets for a **retest** or as **exhaustion/continuation** areas.
# What it helps you do
* **Find high-energy bars** where one side dominates (potential turning or continuation points).
* **Plan retests:** Track when price comes back into the imbalance candle’s range (common entry/take-profit logic).
* **Filter trades:** Only act when the market shows unusual pressure (≥70% or ≥80%).
* **Add context to setups:** Combine with S/R, FVGs, or trend tools to time entries with less guesswork.
* **Alert-driven workflow:** Get notified the moment extreme pressure prints.
# How it helps (workflow)
1. **Scan for signals:**
* **B80/B70** = strong buying; **S80/S70** = strong selling.
* 80% is “extreme” and overrides 70%.
2. **Mark the zone:** The imbalance candle’s **high–low** defines a zone. Many traders wait for a **retest** into that range.
3. **Decide intent:**
* After **B80/B70**, look for pullbacks to buy (or fades if you see exhaustion).
* After **S80/S70**, look for rallies to sell (or fades if exhaustion).
4. **Confirm with context:** Check trend, key levels, liquidity, session timing, ATR/volatility.
5. **Manage risk:** Place stops beyond the zone; size trades so a failed retest doesn’t ruin the day.
# How it works (under the hood, briefly)
The script **estimates buy/sell volume** from each candle’s body, wicks, and total volume, then computes an **imbalance %**. If the % crosses **70%** or **80%** (scaled by a Sensitivity setting), it paints the bar, drops a label, and optionally fires an alert. It also stores the imbalance candle’s range so you can watch for a **retest**.
# Reading the signals (quick guide)
* **B80**: Extreme buyer pressure → watch for pullback buys or exhaustion shorts, depending on context.
* **B70**: Strong buyer pressure → mild continuation bias.
* **S80**: Extreme seller pressure → watch for rally sells or exhaustion longs.
* **S70**: Strong seller pressure → higher reversal probability noted in the table (informational).
# Configuration tips
* **Sensitivity**: Higher = more bars qualify (more signals).
* **Label distance**: Scales with ATR so labels don’t overlap candles.
* **Colors/opacity**: Separate for 70% vs 80% and buyer vs seller.
* **Alerts**: Enable to catch signals live without staring at the screen.
# Notes & limits
* Uses **estimation** (not true bid/ask) on most symbols; treat as a **context tool**, not a stand-alone system.
* The optional stats table’s “expected outcomes” are **informational**, not live probabilities.
* Works on any timeframe; results improve when combined with structure and risk controls.

Asian & London Session High/LowMarks out asian session high and low, aswell as london session high and low, this makes it easier for you to have crucial key levels on your chart at all times

Session Key Levels Lines (with Labels)This is an extension of the previous indicator, it just plots all the information you need automatically for you so you dont have to lift a finger. hope it helps :)

Momentum Reversal StrategyBEST USE IN 15MIN TIME FRAME EURUSD / XAUSUD
1. Strategy Overview
This strategy hunts short-term momentum reversals at key levels during high-liquidity sessions.
Timeframes: 5-minute for entries; 15-minute for trend context
Sessions: London for EUR/USD & GBP/USD; New York for XAU/USD
Pairs: EUR/USD, GBP/USD, XAU/USD
Indicators (3 max):
EMA(20) and EMA(50) (close)
MACD (12, 26, 9) histogram
Optional: RSI(14) (for divergence filter)
2. Entry Rules
Trend Filter (15 min):
Long only if EMA20 > EMA50; short only if EMA20 < EMA50.
Price-Action Zone (5 min):
Identify recent swing high/low within past 20 bars.
Draw horizontal support (for longs) or resistance (for shorts).
Indicator Alignment (5 min):
MACD histogram crossing from negative to positive for longs, positive to negative for shorts.
Candle close beyond EMA20 in direction of trade.
Candle Confirmation:
Bullish engulfing or hammer at support for longs; bearish engulfing or shooting star at resistance for shorts.
Entry Execution:
Place market order on candle close that meets all above.
3. Exit Rules
Stop-Loss (SL):
Long: 1.5× ATR(14) below entry candle low.
Short: 1.5× ATR(14) above entry candle high.
Take-Profit (TP):
Set at 2× SL distance (RR 1:2).
Trailing SL:
After price moves 1× SL in profit, trail SL to breakeven.
Partial Booking:
Close 50% at 1× SL (50% of TP), move SL to entry.
Close remaining at full TP.
4. Trade Management
False Signal Filter: Skip trades when RSI(14) > 70 for longs or < 30 for shorts (avoids overbought/oversold extremes).
One Trade at a Time: No multiple positions on same pair.
Session Cutoff: Close any open trade 15 minutes before session end.
5. Risk Parameters
Risk per Trade: 1% of account equity.
Reward Target: ≥2% (1:2 RR) per trade.
Win-Rate Expectancy: ≥75% based on indicator confluence and price-action confirmation.

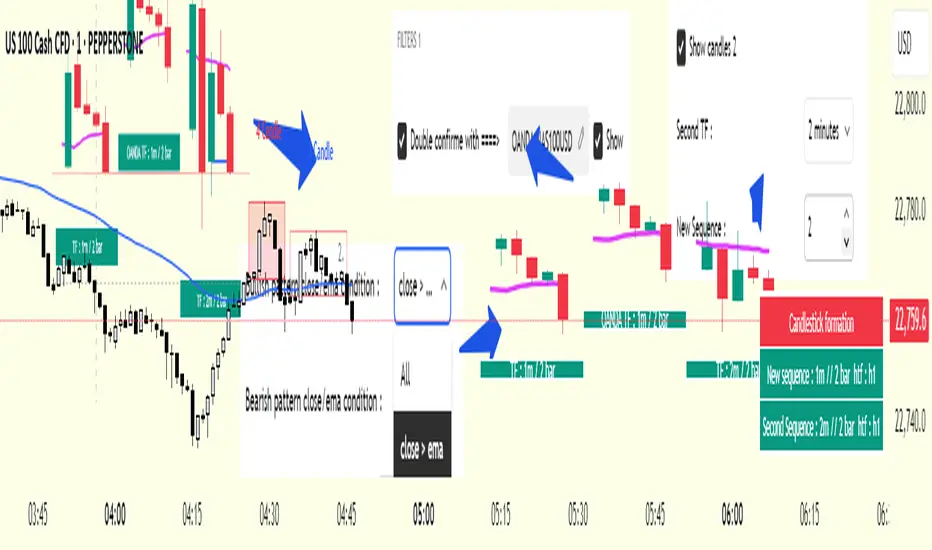
cd_secret_candlestick_patterns_CxHi traders,
With this indicator, we aim to uncover secret candlestick formations that even advanced traders may miss—especially those that can't be detected by classic pattern indicators, unless you're a true master of candlestick patterns or candle math.
________________________________________
General Idea:
We'll try to identify candlestick patterns by regrouping candles into custom-sized segments that you define.
You might ask: “Why do I need this? I can just look at different timeframes and spot the structure anyway.” But it’s not the same.
For example, if you're using a 1-minute chart and add a higher-timeframe candle overlay (like 5-minute), the candles you see start at fixed timestamps like 0, 5, 10, etc.
However, in this indicator, we redraw new candles by grouping them from the current candle backward in batches of five.
These candles won't match the standard view—only when aligned with exact time multiples (e.g., 0 and 5 minutes) will they look the same.
In classic charts:
• You see 5-minute candles that begin every 0 and 5 minutes.
In this tool:
• You see a continuously updating set of 5 merged 1-minute candles redrawn every minute.
What about the structures forming in between those fixed timeframes?
That’s exactly what we’ll be able to detect—while also making the lower timeframe chart more readable.
________________________________________
Candle Merging:
Let’s continue with an example.
Assume we choose to merge 5 candles. Then the new candle will be formed using:
open = open
close = close
high = math.max(high , high , high , high , high)
low = math.min(low , low , low , low , low)
This logic continues backward on the chart, creating merged candles in groups of 5.
Since the selected patterns are made up of 3, 4, or 5 candles, we redraw 5 such merged candles to analyze.
________________________________________
Which Patterns Are Included?
A total of 18 bullish and bearish patterns are included.
You’ll find both widely known formations and a few personal ones I use, marked as (MeReT).
You can find the pattern list and visual reference here:
________________________________________
Entry and Filtering Suggestions:
Let me say this clearly:
Entering a trade every time a pattern forms will not make you profitable in the long run.
You need a clear trade plan and should only act when you can answer questions like:
• Where did the pattern appear?
• When and under what conditions?
It’s more effective to trade in the direction of the trend and look for setups around support/resistance, supply/demand zones, key levels, or areas confirmed by other indicators.
Whether you enter immediately after the pattern or wait for a retest is a personal choice—but risk management is non-negotiable.
One of the optional filters I’ve included is a Higher Timeframe (HTF) condition, which is my personal preference:
When enabled, the highest or lowest price among the pattern candles must match the high or low of the current HTF candle.
You can see in the image below the decrease in the number of detected patterns on the 1-minute chart when using no filter (blue labels) compared to when the 1-hour timeframe filter is applied (red labels).
Additionally, I’ve added a “protected” condition for engulfing patterns to help filter out weak classic engulf patterns.
________________________________________
Settings:
From the menu, you can configure:
• Number of candles for regrouping
• Distance between the last candle and newly drawn candles
• Show/hide options
• HTF filter toggle and timeframe selection
• Color, label placement, and text customization
• Pattern list (select which to display or trigger alerts for)
My preferred setup:
While trading on the 1-minute chart, I typically set the higher timeframe to 15m or 1H, and switch the candle count between 2 and 3 depending on the situation.
⚠️ Important note:
The “Show” and “Alert” options are controlled by a single command.
Alerts are automatically created for any pattern you choose to display.
________________________________________
What’s Next?
In future updates, I plan to add:
• Pattern success rate statistics
• Multi-broker confirmation for pattern validation
Lastly, keep in mind:
The more candles a pattern is based on, the more reliable it may be.
I'd love to hear your feedback and suggestions.
Cheerful trading! 🕊️📈
Average RSI (Daily + Weekly)📈 Average RSI (Relative Strength Index) – Beginner’s Guide
What it is:
The Average RSI is a technical indicator that combines multiple RSI values—such as daily and weekly RSI—into a single, smoothed line. This helps traders get a clearer picture of a stock’s momentum over both short- and medium-term timeframes.
Why it matters:
The RSI tells you whether a stock is potentially overbought (priced too high and due for a pullback) or oversold (priced too low and due for a bounce). Traditional RSI uses a scale from 0 to 100, with key levels at 70 (overbought) and 30 (oversold).
By averaging RSI across different timeframes, you reduce noise and get a better signal for trends and reversals.
How traders use it:
✅ Buy zone: When the average RSI dips below 40, it could signal a good entry point.
⚠️ Neutral zone: Between 40 and 60 means the trend isn’t strong—wait for more confirmation.
🚫 Sell zone: Above 60–70 may indicate the asset is overbought or due for a pullback.
Helpful for:
Spotting better entry/exit points
Filtering out false signals
Staying in trend-following trades longer

Custom Session Tracker (KN)**Custom Session Tracker (KN)**
Visually highlight any intraday session’s high, low, and midpoint on your chart with full styling control.
**Description**
Custom Session Tracker (KN) lets you define any trading session (e.g. 09:30–16:00 NY time) and automatically draws:
* A translucent box spanning the session’s High and Low
* A horizontal line marking the session midpoint
All elements update in real time and persist after session close.
**Features**
* **Session Range Box**: Plots from session open through close
* **Mid-Price Line**: Marks the exact midpoint of High/Low
* **Timezone Input**: Aligns session to any GMT offset
* **Custom Colors**: Fill, border, and mid-line colors
* **Line & Border Styles**: Choose solid or dashed
**Inputs**
* **Timezone** – GMT offset for your market
* **Session** – Hours in `HHMM-HHMM` format
* **Fill Color** – Box interior transparency
* **Border Color** – Box outline
* **Box Border Style** – Solid or dashed
* **Midline Color** – Mid-price line color
* **Mid Price Line Style** – Solid or dashed
**How to Use**
1. Add the script to your chart.
2. Set your session hours and timezone.
3. Customize colors and styles.
4. Watch each session’s high, low, and midpoint appear automatically.
Perfect for session-overlap strategies, mean-reversion signals, or simply keeping key levels in view.

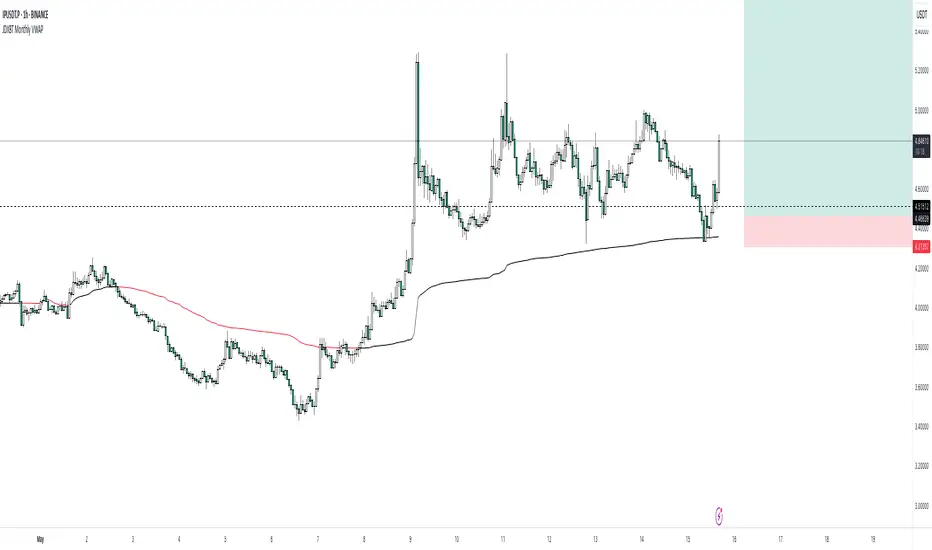
JDXBT Monthly VWAPIt calculates the average price for each month, weighted by trading volume, and automatically resets the calculation at the start of each new month. The VWAP line changes colour based on direction: black if rising, fuchsia if falling — helping traders quickly identify monthly price trends with volume context. It’s a useful tool for spotting key levels and momentum shifts on a monthly basis.
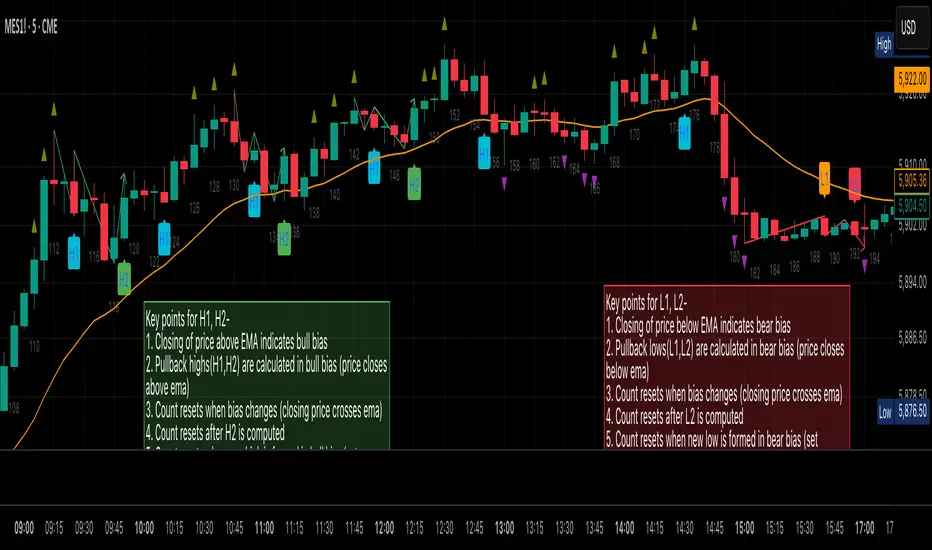
Al Brooks Second Entry**\ Al Brooks Second Entry Indicator\ **
This custom indicator helps identify second-entry setups based on Al Brooks' price action principles. The script marks key levels in trending markets, indicating potential long and short entries. It displays the first and second entry signals (H1, H2, L1, L2) as well as relevant pullback zones for added clarity.
\ Features:\
\
\ \ First Entry Signals\ : H1 (Long) and L1 (Short) are marked when a trend begins to form.
\ \ Second Entry Signals\ : H2 (Long) and L2 (Short) are plotted once the market pulls back and continues in the direction of the trend.
\ \ EMA Filter\ : An Exponential Moving Average (EMA) is included to filter trades in the direction of the trend (longs above EMA, shorts below EMA).
\ \ Pullback Zones\ : Highlighted areas to assist in identifying optimal zones for entry.
\ \ Adjustable Label Sizes\ : Customize the appearance of the entry labels (tiny or small).
\
\ Inputs:\
\
\ \ Show First/Second Entry\ : Control whether the first (H1, L1) and second (H2, L2) entry signals are displayed.
\ \ EMA Length\ : Set the length of the EMA to use for trend direction.
\ \ Label Size\ : Choose between tiny and small label sizes for clear chart visibility.
\ \ Pullback Zones\ : Toggle the highlighting of pullback zones.
\
\ How it Works:\
\
\ The indicator detects a trend direction using price action (new highs/lows, inside/outside bars).
\ Once a trend is identified, it waits for a pullback and marks the first and second entry points (H1, H2, L1, L2).
\ The indicator also plots the EMA to help confirm the overall market bias.
\ Pullback zones are drawn to help spot potential areas of support or resistance.
\
This script is ideal for traders looking to trade retracements in trending markets, providing clear entry signals and a visual representation of market structure.
Intraday Trading IndicatorIndicator Overview
Moving Averages: Uses a fast EMA (9-period) and a slow EMA (21-period) to determine the trend direction.
Market Profile Approximation: Utilizes VWAP (Volume Weighted Average Price) as a simplified proxy for value area, acting as a dynamic support/resistance level.
SMC: Incorporates the concept of trend confirmation and price interaction with key levels, focusing on pullbacks to the fast EMA within a trending market.
Signals: Generates buy and sell signals when price crosses the fast EMA, filtered by the trend (fast EMA vs. slow EMA) and VWAP position, aiming for high-probability setups.
This design ensures responsiveness on short timeframes while filtering out noise, aligning with the goal of accurate signals for intraday trading.

Bullish and Bearish Breakout Alert for Gold Futures PullbackBelow is a Pine Script (version 6) for TradingView that includes both bullish and bearish breakout conditions for my intraday trading strategy on micro gold futures (MGC). The strategy focuses on scalping two-legged pullbacks to the 20 EMA or key levels with breakout confirmation, tailored for the Apex Trader Funding $300K challenge. The script accounts for the Daily Sentiment Index (DSI) at 87 (overbought, favoring pullbacks). It generates alerts for placing stop-limit orders for 175 MGC contracts, ensuring compliance with Apex’s rules ($7,500 trailing threshold, $20,000 profit target, 4:59 PM ET close).
Script Requirements
Version: Pine Script v6 (latest for TradingView, April 2025).
Purpose:
Bullish: Alert when price breaks above a rejection candle’s high after a two-legged pullback to the 20 EMA in a bullish trend (price above 20 EMA, VWAP, higher highs/lows).
Bearish: Alert when price breaks below a rejection candle’s low after a two-legged pullback to the 20 EMA in a bearish trend (price below 20 EMA, VWAP, lower highs/lows).
Context: 5-minute MGC chart, U.S. session (8:30 AM–12:00 PM ET), avoiding overbought breakouts above $3,450 (DSI 87).
Output: Alerts for stop-limit orders (e.g., “Buy: Stop=$3,377, Limit=$3,377.10” or “Sell: Stop=$3,447, Limit=$3,446.90”), quantity 175 MGC.
Apex Compliance: 175-contract limit, stop-losses, one-directional news trading, close by 4:59 PM ET.
How to Use the Script in TradingView
1. Add Script:
Open TradingView (tradingview.com).
Go to “Pine Editor” (bottom panel).
Copy the script from the content.
Click “Add to Chart” to apply to your MGC 5-minute chart .
2. Configure Chart:
Symbol: MGC (Micro Gold Futures, CME, via Tradovate/Apex data feed).
Timeframe: 5-minute (entries), 15-minute (trend confirmation, manually check).
Indicators: Script plots 20 EMA and VWAP; add RSI (14) and volume manually if needed .
3. Set Alerts:
Click the “Alert” icon (bell).
Add two alerts:
Bullish Breakout: Condition = “Bullish Breakout Alert for Gold Futures Pullback,” trigger = “Once Per Bar Close.”
Bearish Breakout: Condition = “Bearish Breakout Alert for Gold Futures Pullback,” trigger = “Once Per Bar Close.”
Customize messages (default provided) and set notifications (e.g., TradingView app, SMS).
Example: Bullish alert at $3,377 prompts “Stop=$3,377, Limit=$3,377.10, Quantity=175 MGC” .
4. Execute Orders:
Bullish:
Alert triggers (e.g., stop $3,377, limit $3,377.10).
In TradingView’s “Order Panel,” select “Stop-Limit,” set:
Stop Price: $3,377.
Limit Price: $3,377.10.
Quantity: 175 MGC.
Direction: Buy.
Confirm via Tradovate.
Add bracket order (OCO):
Stop-loss: Sell 175 at $3,376.20 (8 ticks, $1,400 risk).
Take-profit: Sell 87 at $3,378 (1:1), 88 at $3,379 (2:1) .
Bearish:
Alert triggers (e.g., stop $3,447, limit $3,446.90).
Select “Stop-Limit,” set:
Stop Price: $3,447.
Limit Price: $3,446.90.
Quantity: 175 MGC.
Direction: Sell.
Confirm via Tradovate.
Add bracket order:
Stop-loss: Buy 175 at $3,447.80 (8 ticks, $1,400 risk).
Take-profit: Buy 87 at $3,446 (1:1), 88 at $3,445 (2:1) .
5. Monitor:
Green triangles (bullish) or red triangles (bearish) confirm signals.
Avoid bullish entries above $3,450 (DSI 87, overbought) or bearish entries below $3,296 (support) .
Close trades by 4:59 PM ET (set 4:50 PM alert) .

[blackcat] L3 Magic-9 Sequential SetupOVERVIEW
The L3 Magic-9 Sequential Setup indicator is designed to identify potential reversal points in the market using a sequential pattern analysis. This script plots specific labels on the chart based on predefined conditions, helping traders spot key levels where price reversals might occur 📉↗️.
FEATURES
Identifies consecutive occurrences of price movements above or below certain thresholds.
Plots labeled markers on the chart for easy visualization:
Red Labels: Indicate potential sell signals (e.g., '5', '6', '7', etc.).
Green Labels: Indicate potential buy signals (e.g., '5', '6', '7', etc.)
Uses custom functions to filter and count occurrences over specified lookback periods ⚙️.
Changes bar colors based on detected signals for enhanced visual cues 🎨.
Supports extensive customization through input parameters for fine-tuning the setup.
HOW TO USE
Add the indicator to your TradingView chart by selecting it from the indicators list.
Observe the plotted labels ('5', '6', '7', etc.) indicating potential reversal zones.
Pay attention to bar color changes that confirm the identified patterns.
Combine this indicator with other tools for confirmation before making trading decisions.
LIMITATIONS
The indicator relies heavily on sequential patterns, which may not capture all market nuances.
False signals can occur in ranging or sideways markets 🌪️.
Users should always confirm signals with other forms of analysis.
NOTES
Ensure that you have sufficient historical data available for accurate calculations.
Test the indicator thoroughly on demo accounts before applying it to live trading 🔍.
Customize input parameters as needed to fit your trading strategy.

Pump & Dump Detector (sensitive)📊 Pump & Dump Detector — Volatility & Volume-Based Impulse Scanner
Description:
This indicator is designed to detect early and confirmed signs of high-impact market movements, such as pumps (sharp price increases) and dumps (sharp price drops). It intelligently combines multiple market signals to provide timely alerts of potential momentum spikes.
🔧 Components & Logic:
1. Price Change (%):
Compares the current closing price to the previous one. This is used as the main trigger for confirmed pump or dump detection.
2. Volume Spike:
Detects abnormal activity by comparing the current volume to the moving average over a user-defined period. If the current volume exceeds the average by a specified multiplier (default: 1.8x), a spike is detected.
3. Volatility Spike (High - Low):
Measures bar expansion. A sudden increase in bar range often indicates breakout conditions or liquidation events.
4. NATR (Normalized ATR):
Normalized Average True Range is calculated as (ATR / Close) * 100, making volatility comparable across all timeframes and instruments.
5. Min Volume Filter:
Filters out signals from low-liquidity coins to reduce false alerts and market noise.
🧠 Why It’s Useful:
This is not a mashup of random indicators, but a thoughtfully engineered system where each filter strengthens the signal validity.
It allows you to spot explosive moves before they fully unfold, making it ideal for:
Intraday scalping
Altcoin watchlists
Flash crash detection
Early reversal or breakout trades
🖥 How to Use:
Add the indicator to any crypto chart.
Enable alerts for:
🚨 Early Pump
💥 Confirmed Pump
🔻 Early Dump
🔥 Confirmed Dump
React to confirmed signals using your preferred strategy — breakout, fade, or continuation.
Use in combination with key levels, orderbook data, or trend filters for best results.
📌 Example Use Case:
On a 5-minute chart of a low-cap altcoin, the indicator may issue an early signal when:
Price increases by more than 2.5%
Volume is 2x the average
Bar range is significantly larger than the recent average
NATR is above its smoothed average × 1.2
🛡 Originality & Purpose:
This script was not built to simply combine popular indicators, but to serve a very specific use-case — detecting early-stage pumps and dumps.
By blending classic tools (like volume, ATR) with contextual filters, it becomes a true pattern-based predictive signal, not a repackaged overlay.
💬 Have ideas or suggestions? Leave a comment below — I’m always open to collaboration!

ICT & RTM Price Action IndicatorICT & RTM Price Action Indicator
Unlock the power of precision trading with this cutting-edge indicator blending ICT (Inner Circle Trader) concepts and RTM (Reversal Trend Momentum) strategies. Designed for traders who demand clarity in chaotic markets, this tool pinpoints high-probability buy and sell signals with surgical accuracy.
What It Offers:
Smart Supply & Demand Zones: Instantly spot key levels where the market is likely to reverse or consolidate, derived from a 50-period high/low analysis.
Filtered Reversal Signals: Say goodbye to fakeouts! Signals are confirmed with volume spikes (1.5x average) and a follow-through candle, ensuring you trade only the strongest moves.
Trend-Aware Logic: Built on a customizable SMA (default 14), it aligns reversals with momentum for trades that stick.
One-Signal Discipline: No clutter—only the first valid signal appears until an opposing setup triggers, keeping your chart clean and your focus sharp.
Combined Power: A unique "TRADE" signal merges ICT zones with RTM reversals for setups with double the conviction.
Why You’ll Love It:
Whether you’re scalping intraday or hunting swing trades, this indicator adapts to your style. It’s not just another tool—it’s your edge in decoding price action like a pro. Test it, tweak it, and watch your trading transform.

zone trading stratThis only works for DOGEUSD , I made it for the 8cap chart so only use it for that.
If you want this for other symbols/charts you need to comment below or msg me.
# Price Zone Trading System: Technical Explanation
## Core Concept
The Price Zone Tracker is built on the concept that price tends to respect certain key levels or "zones" on the chart. These zones act as support and resistance areas where price may bounce or break through. The system combines zone analysis with multiple technical indicators to generate high-probability trading signals.
## Zone Analysis
The system tracks 9 predefined price zones. Each zone has both a high and low boundary, except for Zone 5 which is represented by a single line. When price enters a zone, the system monitors whether it stays within the zone, breaks above it (bullish), or breaks below it (bearish).
This zone behavior establishes the foundational bias of the system:
- When price closes above its previous zone: Zone State = Bullish
- When price closes below its previous zone: Zone State = Bearish
- When price remains within a zone: Zone State = Neutral
## Trend Analysis Components
The system performs multi-timeframe analysis using several technical components:
1. **Higher Timeframe Analysis** (±3 points in scoring)
- Uses 15-minute charts for sub-5-minute timeframes
- Uses 30-minute charts for 5-minute timeframes
- Uses 60-minute charts for timeframes above 5 minutes
- Evaluates candlestick patterns and EMA crossovers on the higher timeframe
2. **EMA Direction** (±1 point in scoring)
- Compares 12-period and 26-period EMAs
- Bullish when fast EMA > slow EMA
- Bearish when fast EMA < slow EMA
3. **MACD Analysis** (±1 point in scoring)
- Uses standard 12/26/9 MACD settings
- Bullish when MACD line crosses above signal line with positive histogram
- Bearish when MACD line crosses below signal line with negative histogram
4. **Price Action** (±2 points in scoring)
- Evaluates whether price is making higher highs/higher lows (uptrend)
- Or lower highs/lower lows (downtrend)
- Also considers ATR-based volatility and strength of movements
## Trend Score Calculation
All these components are weighted and combined into a trend score:
- Higher timeframe components have stronger weights (±2-3 points)
- Current timeframe components have moderate weights (±1 point)
- Price action components have varied weights (±0.5-2 points)
The final trend state is determined by thresholds:
- Score > +3: Trend Analysis State = Bullish
- Score < -3: Trend Analysis State = Bearish
- Score between -3 and +3: Trend Analysis State = Neutral
## Signal Generation Logic
The system combines the Zone State with the Trend Analysis State:
1. If Zone State and Trend Analysis State are both bullish:
- Combined State = Bullish
- Line Color = Green
2. If Zone State and Trend Analysis State are both bearish:
- Combined State = Bearish
- Line Color = Red
3. If Zone State and Trend Analysis State contradict each other:
- Combined State = Neutral
- Line Color = Black
This implements a safety mechanism requiring both zone analysis and technical indicators to agree before generating a directional signal.
## Trading Signals
Trading signals are generated based on changes in the Combined State:
- When Combined State changes from neutral/bearish to bullish:
- Trading Signal = LONG (green triangle appears on chart)
- When Combined State changes from neutral/bullish to bearish:
- Trading Signal = SHORT (red triangle appears on chart)
- When Combined State changes from bullish/bearish to neutral:
- Trading Signal = EXIT (yellow X appears on chart)
- When Combined State remains unchanged:
- Trading Signal = NONE (no new marker appears)
## Reversal Warning
The system also monitors for potential reversal conditions:
- When Combined State is bullish but both RSI and MFI are overbought (>70)
- When Combined State is bearish but both RSI and MFI are oversold (<30)
In these cases, a yellow diamond appears on the chart as a warning that a reversal might be imminent.
## Visual Elements
The indicator provides multiple visual elements:
1. Zone boundaries as translucent orange areas
2. A single colored line below price (green/red/black) showing the current signal
3. Trading signals as shapes on the chart
4. An information panel showing all relevant indicator values and signals
## Usage Limitations
The indicator is designed to work optimally on timeframes below 30 minutes. On higher timeframes, a warning appears and analysis is disabled.

TJR SEEK AND DESTROYTJR SEEK AND DESTROY – Intraday ICT Trading Tool
Built for day traders, TJR SEEK AND DESTROY combines Smart Money concepts like order blocks, fair value gaps, and liquidity sweeps with structure breaks and daily bias to pinpoint high-probability trades during US market hours (9:30–16:00). Ideal for scalping or intraday strategies on stocks, futures, or forex.
What Makes It Unique?
Unlike standalone ICT indicators, this script integrates:
Order Blocks with volume and range filters for precise support/resistance zones.
Fair Value Gaps (FVG) to spot pre-market price imbalances.
Break of Structure (BOS) and Liquidity Sweeps for trend and reversal signals.
A 1H MA-based Bias to align trades with the day’s direction.
BUY/SELL Labels triggered only when bias, BOS, and sweeps align, reducing noise.
How Does It Work?
Order Blocks: Marks zones with high volume (>1.5x 20-period SMA) and low range (<0.5x ATR20) as teal boxes—potential reversal points.
Fair Value Gap: Compares the prior day’s close to the current open (pre- or post-9:30), shown as a purple line and label (e.g., "FVG: 0.005").
Pivot Point: Calculates (prevHigh + prevLow + prevClose) / 3 from the prior day, plotted as an orange line for equilibrium.
Break of Structure: Detects crossovers of 5-bar highs/lows (gray lines), marked with red triangles.
Liquidity Sweeps: Tracks breaches of the prior day’s high/low (yellow lines), marked with yellow triangles.
Daily Bias: Uses 1H close vs. 20-period MA (blue line) for bullish (green background), bearish (red), or neutral (gray) context.
Signals: BUY (green label) when bias is bullish, price breaks up, and sweeps the prior high; SELL (red label) when bias is bearish, price breaks down, and sweeps the prior low.
How to Use It
Setup: Apply to 1M–15M charts for US session trading (9:30–16:00 EST).
Trading:
Wait for a BUY label after a yellow sweep triangle above the prior day’s high in a green (bullish) background.
Wait for a SELL label after a yellow sweep triangle below the prior day’s low in a red (bearish) background.
Use order blocks (teal boxes) as support/resistance for stop-loss or take-profit.
Markets: Best for SPY, ES futures, or forex pairs with US session volatility.
Underlying Concepts
Order Blocks: High-volume, low-range bars suggest institutional activity.
FVG: Gaps between close and open indicate imbalance to be filled.
BOS & Sweeps: Price breaking key levels signals momentum or stop-hunting.
Bias: 1H MA filters trades by broader trend.
Chart Setup
Displays order blocks (teal boxes), pivot (orange), open (purple), bias (colored background), BOS/sweeps (triangles), and signals (labels). Keep other indicators off for clarity.

Quarterly Theory ICT 02 [TradingFinder] True Open Session 90 Min🔵 Introduction
The Quarterly Theory ICT indicator is an advanced analytical system built on ICT (Inner Circle Trader) concepts and fractal time. It divides time into four quarters (Q1, Q2, Q3, Q4), and is designed based on the consistent repetition of these phases across all trading timeframes (annual, monthly, weekly, daily, and even shorter trading sessions).
Each cycle consists of four distinct phases: the first phase (Q1) is the Accumulation phase, characterized by price consolidation; the second phase (Q2), known as Manipulation or Judas Swing, is marked by initial false movements indicating a potential shift; the third phase (Q3) is Distribution, where price volatility peaks; and the fourth phase (Q4) is Continuation/Reversal, determining whether the previous trend continues or reverses.
🔵 How to Use
The central concept of this strategy is the "True Open," which refers to the actual starting point of each time cycle. The True Open is typically defined at the beginning of the second phase (Q2) of each cycle. Prices trading above or below the True Open serve as a benchmark for predicting the market's potential direction and guiding trading decisions.
The practical application of the Quarterly Theory strategy relies on accurately identifying True Open points across various timeframes.
True Open points are defined as follows :
Yearly Cycle :
Q1: January, February, March
Q2: April, May, June (True Open: April Monthly Open)
Q3: July, August, September
Q4: October, November, December
Monthly Cycle :
Q1: First Monday of the month
Q2: Second Monday of the month (True Open: Daily Candle Open price on the second Monday)
Q3: Third Monday of the month
Q4: Fourth Monday of the month
Weekly Cycle :
Q1: Monday
Q2: Tuesday (True Open: Daily Candle Open Price on Tuesday)
Q3: Wednesday
Q4: Thursday
Daily Cycle :
Q1: 18:00 - 00:00 (Asian session)
Q2: 00:00 - 06:00 (True Open: Start of London Session)
Q3: 06:00 - 12:00 (NY AM)
Q4: 12:00 - 18:00 (NY PM)
90 Min Asian Session :
Q1: 18:00 - 19:30
Q2: 19:30 - 21:00 (True Open at 19:30)
Q3: 21:00 - 22:30
Q4: 22:30 - 00:00
90 Min London Session :
Q1: 00:00 - 01:30
Q2: 01:30 - 03:00 (True Open at 01:30)
Q3: 03:00 - 04:30
Q4: 04:30 - 06:00
90 Min New York AM Session :
Q1: 06:00 - 07:30
Q2: 07:30 - 09:00 (True Open at 07:30)
Q3: 09:00 - 10:30
Q4: 10:30 - 12:00
90 Min New York PM Session :
Q1: 12:00 - 13:30
Q2: 13:30 - 15:00 (True Open at 13:30)
Q3: 15:00 - 16:30
Q4: 16:30 - 18:00
Micro Cycle (22.5-Minute Quarters) : Each 90-minute quarter is further divided into four 22.5-minute sub-segments (Micro Sessions).
True Opens in these sessions are defined as follows :
Asian Micro Session :
True Session Open : 19:30 - 19:52:30
London Micro Session :
T rue Session Open : 01:30 - 01:52:30
New York AM Micro Session :
True Session Open : 07:30 - 07:52:30
New York PM Micro Session :
True Session Open : 13:30 - 13:52:30
By accurately identifying these True Open points across various timeframes, traders can effectively forecast the market direction, analyze price movements in detail, and optimize their trading positions. Prices trading above or below these key levels serve as critical benchmarks for determining market direction and making informed trading decisions.
🔵 Setting
Show True Range : Enable or disable the display of the True Range on the chart, including the option to customize the color.
Extend True Range Line : Choose how to extend the True Range line on the chart, with the following options:
None: No line extension
Right: Extend the line to the right
Left: Extend the line to the left
Both: Extend the line in both directions (left and right)
Show Table : Determines whether the table—which summarizes the phases (Q1 to Q4)—is displayed.
Show More Info : Adds additional details to the table, such as the name of the phase (Accumulation, Manipulation, Distribution, or Continuation/Reversal) or further specifics about each cycle.
🔵 Conclusion
The Quarterly Theory ICT, by dividing time into four distinct quarters (Q1, Q2, Q3, and Q4) and emphasizing the concept of the True Open, provides a structured and repeatable framework for analyzing price action across multiple time frames.
The consistent repetition of phases—Accumulation, Manipulation (Judas Swing), Distribution, and Continuation/Reversal—allows traders to effectively identify recurring price patterns and critical market turning points. Utilizing the True Open as a benchmark, traders can more accurately determine potential directional bias, optimize trade entries and exits, and manage risk effectively.
By incorporating principles of ICT (Inner Circle Trader) and fractal time, this strategy enhances market forecasting accuracy across annual, monthly, weekly, daily, and shorter trading sessions. This systematic approach helps traders gain deeper insight into market structure and confidently execute informed trading decisions.

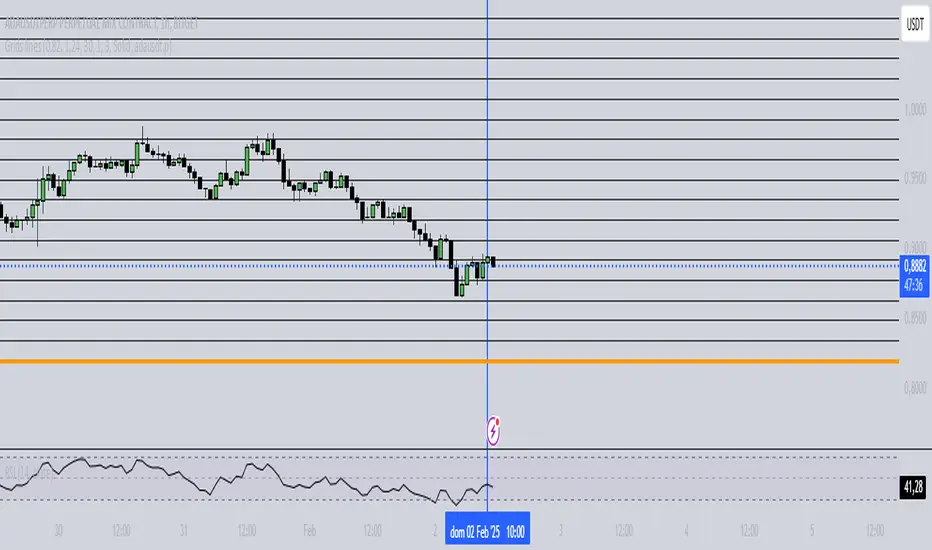
Grids lines"Líneas de Grid para Análisis Técnico"
Este indicador dibuja líneas de grid (rejilla) en el gráfico de precios, lo que puede ayudar a visualizar zonas de soporte, resistencia y niveles de interés en un rango de precios determinado.
Características:
Precio Mínimo y Máximo: Configura los precios entre los cuales se dibujarán las líneas de grid.
Número de Grids: Establece cuántas líneas de grid quieres ver en el gráfico.
Color y Grosor de las Líneas: Personaliza los colores y el grosor de las líneas de grid, incluyendo la primera y la última línea.
Estilo de las Líneas: Puedes elegir entre líneas discontinuas (Dotted) o sólidas (Solid), para personalizar aún más tu visualización.
Ticker Específico: Si lo deseas, puedes elegir un ticker específico para dibujar las líneas solo cuando el gráfico esté mostrando ese activo. De lo contrario, las líneas se dibujarán en el gráfico actual.
Parámetros:
Precio Mínimo: El precio más bajo para el rango del grid (por ejemplo: 0.82).
Precio Máximo: El precio más alto para el rango del grid (por ejemplo: 1.24).
Número de Grids: Define cuántas líneas quieres entre el precio mínimo y el máximo (por ejemplo: 30).
Estilo de Línea: Elige entre Dotted (líneas discontinuas) o Solid (líneas sólidas).
Ticker: Si deseas dibujar las líneas solo para un ticker específico, ingresa el símbolo del ticker (por ejemplo, ADAUSDT). Si dejas este campo vacío, las líneas se dibujarán en el gráfico actual.
Ejemplo de Uso:
Si estás analizando el par ADAUSDT, puedes escribir ADAUSDT en el campo del ticker para que las líneas solo se dibujen cuando este par esté visible. Si dejas el campo vacío, las líneas se dibujarán en cualquier ticker que tengas en el gráfico.
Descripción en Inglés:
"Grid Lines for Technical Analysis"
This indicator draws grid lines on the price chart, helping to visualize support, resistance, and key levels within a specific price range.
Features:
Min and Max Price: Set the price range for the grid lines to be drawn.
Number of Grids: Choose how many grid lines you want to display on the chart.
Line Color and Thickness: Customize the color and thickness of the grid lines, including the first and last line.
Line Style: Choose between Dotted (dashed lines) or Solid (solid lines) to further customize your view.
Specific Ticker: If desired, you can specify a ticker for the grid lines to only be drawn when that asset is shown. Otherwise, the lines will be drawn on the current chart.
Parameters:
Min Price: The lowest price for the grid range (for example, 0.82).
Max Price: The highest price for the grid range (for example, 1.24).
Number of Grids: Defines how many lines you want between the minimum and maximum price (for example, 30).
Line Style: Choose between Dotted or Solid.
Ticker: To draw the lines only for a specific ticker, enter the symbol of the ticker (for example, ADAUSDT). If left blank, the lines will be drawn on the current ticker.
Usage Example:
If you're analyzing the pair ADAUSDT, you can enter ADAUSDT in the ticker field to draw the lines only when that pair is visible. If you leave the field blank, the lines will be drawn for any ticker currently on the chart.
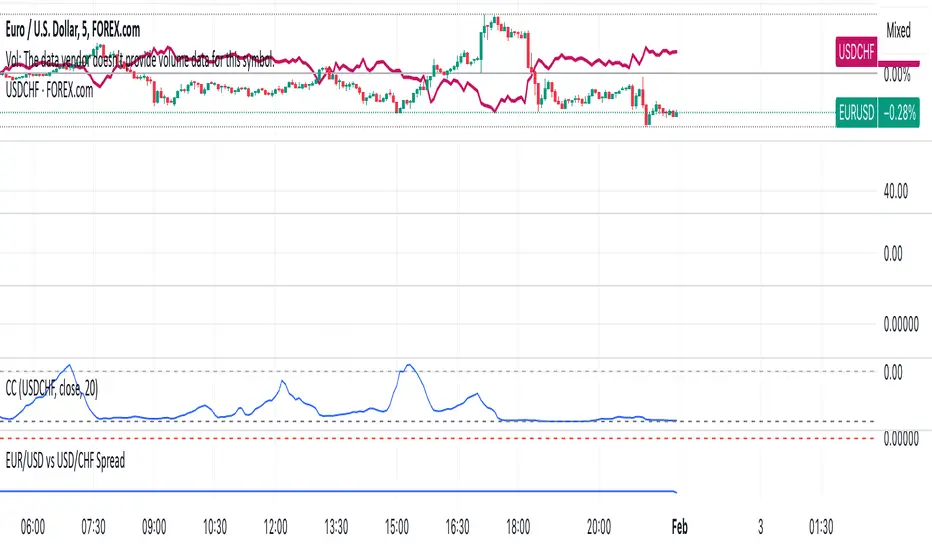
EUR/USD vs USD/CHF SpreadA typical Pine Script for spread trading would include:
Fetching Data: Getting the real-time price of EUR/USD and USD/CHF.
Calculating the Synthetic EUR/CHF Price: Since EUR/USD * USD/CHF ≈ EUR/CHF, we use this relation to analyze deviations.
Computing the Spread: Taking the difference between EUR/USD and the synthetic EUR/CHF price.
Z-Score Normalization: Measuring how far the spread deviates from the mean (Mean Reversion).
Overlay and Visuals: Plotting the spread and key levels to visualize trading signals.
Month Separator
Month Separator Indicator
This Pine Script indicator separates each month on the chart by visually marking the change between months.
Features:
The indicator detects when the month changes.
It highlights the background with a semi-transparent blue color to differentiate the months.
A small red triangle is plotted at the top of the chart at the beginning of each new month, providing a clear visual cue.
Customization:
You can easily adjust the colors or styles in the script by modifying the bgcolor and plotshape functions.
The indicator works on all timeframes, but it is especially useful on higher timeframes (like daily or weekly charts) to track monthly transitions.
This script is ideal for traders who want a clear visual representation of month boundaries to analyze trends and key levels more effectively.
