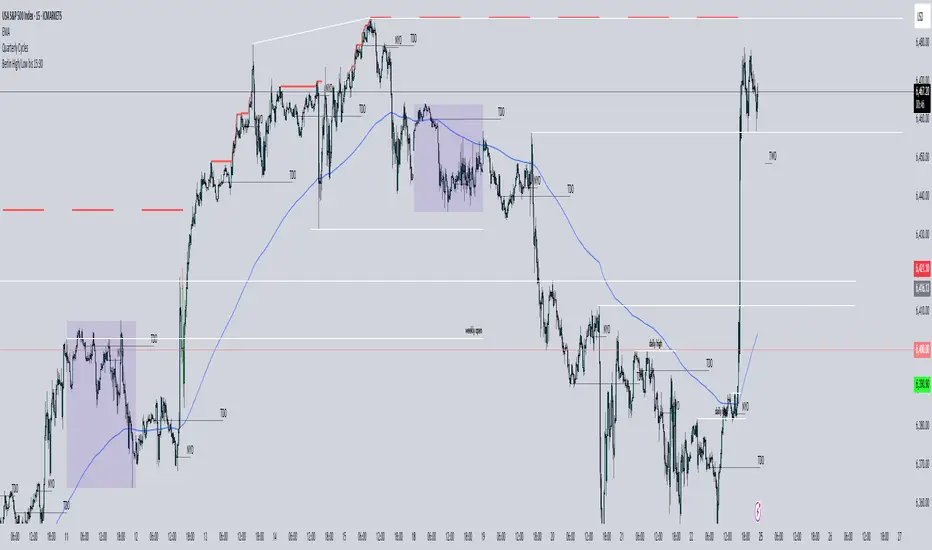
Berlin High/Low bis 15:30dayHigh := na(dayHigh) ? high : math.max(dayHigh, high)
dayLow := na(dayLow) ? low : math.min(dayLow, low)
"low"に関するスクリプトを検索
Key Levels & Session Highs/Lows by OdegosProfessional multi-timeframe support and resistance level indicator that automatically tracks and displays key price levels across different trading sessions and timeframes.
🎯 What it shows:
Session Open - Daily market open reference line
Asia & London Sessions - High/low levels from major trading sessions
Previous Day - Yesterday's actual high and low levels
Weekly & Monthly - Higher timeframe support/resistance levels
⚡ Smart Features:
Auto-combines overlapping levels with merged labels
Break detection - Lines stop when price breaks through (optional)
Timezone support - Works with any global timezone
Universal colors - Optimized for both light and dark chart themes
Clean interface - Organized settings with intuitive dropdowns
🛠️ Fully Customizable:
Individual show/hide toggles for each level type
Custom colors, line styles, and widths
Adjustable label text and positioning
Global text color override option
Perfect for day traders, swing traders, and anyone who relies on key support/resistance levels for market analysis.
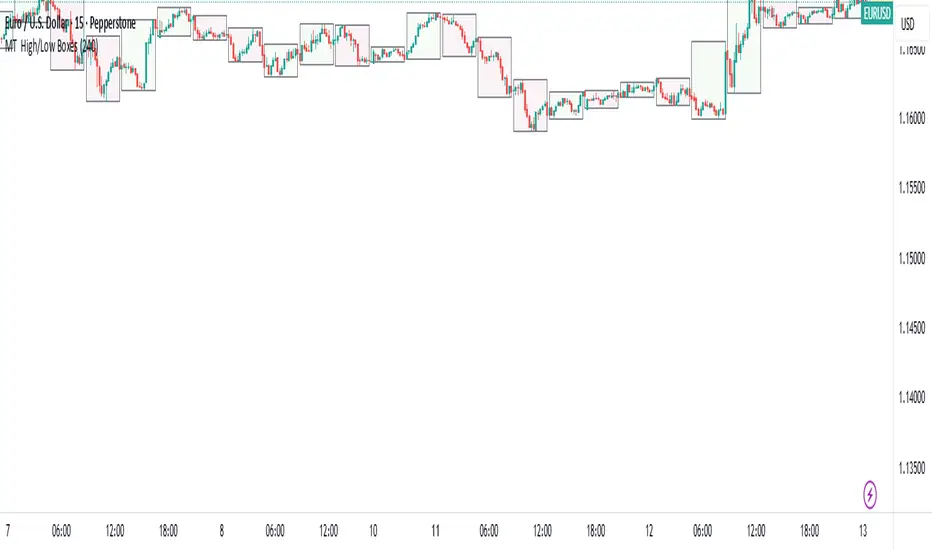
MT High/Low Boxes"Box out the High/Low at User-Defined Time Frame"
This feature allows users to set a custom time frame via an input panel, following TradingView's time frame conventions (e.g., "60," "240," "D," etc.).
The script dynamically captures timestamps for each custom interval to detect the start of new segments.
The box width is calculated based on the number of bars within the custom time frame, ensuring accurate coverage of the corresponding time range.
A central dashed line (yellow dotted) reflects the real-time midpoint between the high and low of the interval.
The background color adjusts based on bullish/bearish bias, comparing the opening price to the current closing price.
Simply select your desired time frame in the indicator settings—flexible and compatible with multiple time frames, including non-minute/hour units (e.g., daily, weekly).
915 Candle High/Low RaysDraws horizontal rays from the high and low of the first 5-minute candle for any selected date in the NSE equity session (09:15–15:30). Features include:
- Date picker for any trading day (defaults to today, exchange timezone)
- Session-limited rays (do not extend past the session end)
- Option to project levels to all timeframes
- Customizable ray style, label display, and color
- Optional breakout alerts for high/low crossing
- Designed for Indian markets and any NSE equity symbol

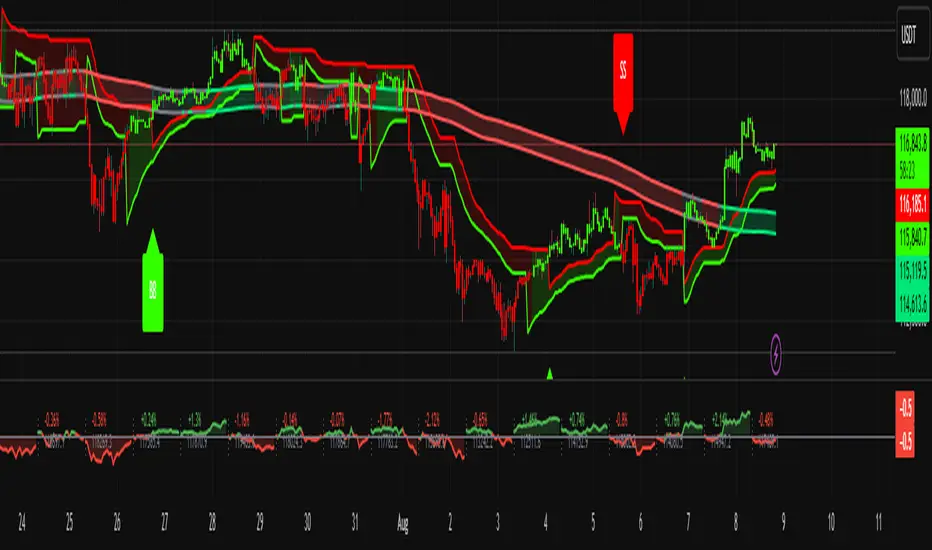
Kalman Supertrend (High vs Low) Bands by Skyito V2Inspired by BackQuant's Kalman Hull Supertrend, this upgraded version replaces the typical Kalman-close method with Kalman-filtered High and Low sources. This approach provides clearer trend visualization and helps confirm potential breakouts or reversals using clean, directional candle signals.
The core logic revolves around BB (Band Buy) and SS (Band Sell) signals:
BB appears only when a candle fully breaks above both Kalman High and Low bands.
SS appears when a candle fully breaks below both bands.
These clean triggers help avoid false signals and are excellent for capturing high-probability trend shifts.
✅ The Supertrend line is also included and can be toggled on or off — useful for those who prefer early trend detection or confirmation.
🆕 Why the SMA Band was Included
To complement the Kalman band system, a Moving Average Band (default: SMA 200) is added:
It helps detect the long-term trend direction.
Candles are colored green when above the SMA band and red when below.
This visual cue strengthens trend confidence and adds an extra layer for filtering trades.
The MA band and coloring can be turned on or off based on preference.
This tool is built for traders who want a clean trend-following and breakout confirmation system. It can be used as a standalone strategy or paired with price action, volume, or support/resistance tools.
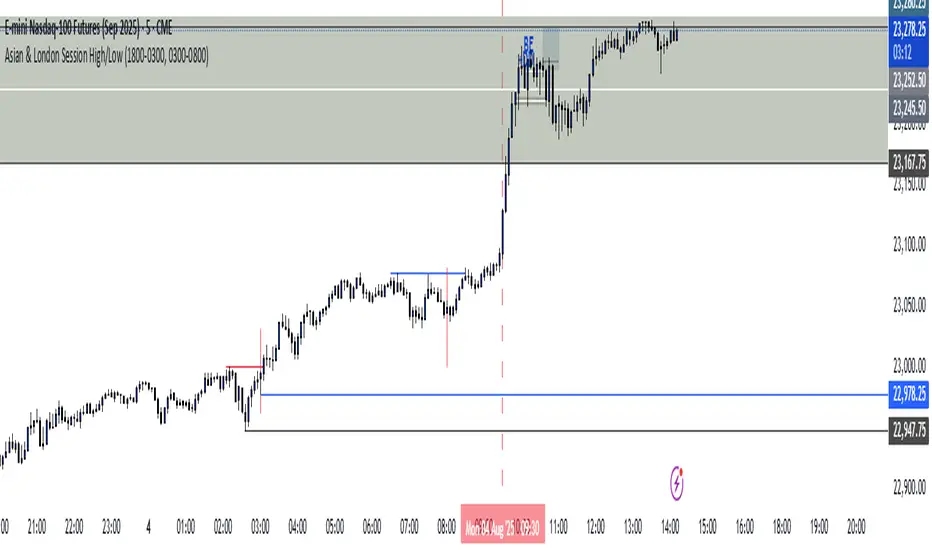
Asian & London Session High/Low (NEW)Marks out asian session high and low, london session high and low, so you dont have to, these levels are crucial to your trading, so use this indicator
Sessions and High/Low/andrewSessions and High/Low/andrew
this indictors covers all the session high and low including frankfurt

Daily High/Low Close Breakout - GOLD### **Daily High/Low Close Breakout Indicator**
This indicator is a powerful tool for identifying potential breakout opportunities based on the previous day's price action. It's built on a unique time-based logic that defines key support and resistance levels for the trading day.
---
### **How the Indicator Works**
The indicator operates in two main phases:
1. **Calculation Period (00:00 to 16:30 Tehran Time):** The indicator first observes the price action from the start of the day until 16:30. During this time, it records the highest and lowest **closing prices** of all candles. The chart background is shaded gray to visually mark this period.
2. **Trading Period (16:30 to 16:30 the next day):** At 16:30, the highest and lowest close levels are finalized and drawn as horizontal lines. These levels then become the primary breakout zones for the next 24 hours. The indicator will generate signals whenever the price crosses these lines.
---
### **Trading Signals**
The indicator uses a simple and effective crossover logic for its signals:
* **BUY Signal:** A signal is generated when a candle's closing price **crosses above** the high close line.
* **SELL Signal:** A signal is generated when a candle's closing price **crosses below** the low close line.
---
### **Important Usage Guidelines**
For optimal performance, please follow these specific recommendations:
* **Timeframe:** This indicator is designed and optimized to be used exclusively on the **15-minute timeframe**. Using it on other timeframes may produce inconsistent or unreliable results.
* **Primary Asset:** The logic for this indicator was developed and backtested primarily for **Gold (XAUUSD)**. Its performance and win rate have been observed to be the most consistent on this asset.
* **Asset Restriction:** It is strongly recommended to **avoid using this indicator on other currency pairs or assets**, as it has not been optimized for their specific market behavior.
---
### **Disclaimer**
*This indicator is provided for informational and educational purposes only. It is not financial advice. Past performance is not a guarantee of future results. All trading decisions should be based on your own research and risk analysis. Always use proper risk management.*

Asian & London Session High/LowMarks out asian session high and low, aswell as london session high and low, this makes it easier for you to have crucial key levels on your chart at all times

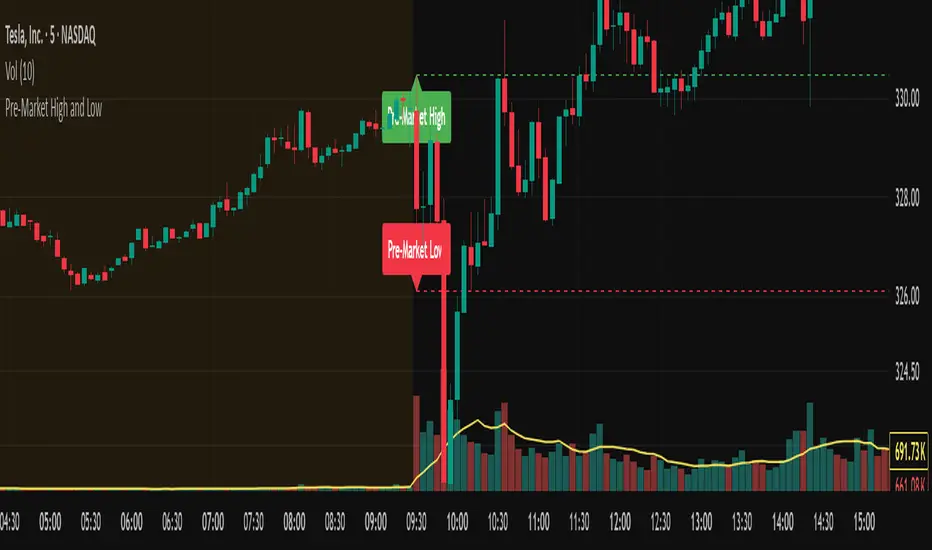
Pre-Market High and LowThis indicator automatically tracks and plots the daily pre-market high and low levels on your chart for U.S. stocks. It monitors the pre-market session from 4:30 AM to 9:30 AM Eastern Time (New York) and captures the highest and lowest prices during this period.
At exactly 9:30 AM ET, when the regular market opens, the indicator draws dashed horizontal lines representing the pre-market high and pre-market low, extending them forward for better visibility throughout the trading day.
Absolute High and Low {Darkoexe}This indicator identifies and visually highlights the absolute highest and lowest closing prices on a chart. It is designed to help traders quickly recognize major price extremes that can serve as significant support/resistance levels or turning points in historical price action.
🔧 What It Does
The script plots persistent horizontal lines on your chart to mark either:
The absolute highest and lowest closing prices of the entire visible chart, or
The highest and lowest closing prices within a custom range of candles, defined by the user.
These price levels are plotted using thick green and red lines, respectively, and are updated dynamically as new highs or lows are set.
⚙️ How It Works
When “Use all candles” is enabled, the script continuously updates the high and low lines based on the full price history of the chart. These lines remain until a new extreme is made.
When disabled, the script checks only the most recent N candles (max bars back input). It scans this window to find and plot the highest and lowest closes.
The lines extend to the right to help users visually anchor these key levels in future price action.
🎯 Use Cases
Spotting extreme price levels for potential mean-reversion strategies.
Confirming breakout or breakdown conditions.
Defining long-term support and resistance zones.
This tool is especially useful for discretionary traders who value historical context and want clear visual markers for past price extremes.
⚠️ Notes and Limitations
This script is not predictive. It simply marks historical price extremes based on closing values.
When using the fixed range mode (max bars back), be aware that values outside this range will not be considered.
The indicator does not repaint, but in full chart mode, it updates only when a new extreme is formed.

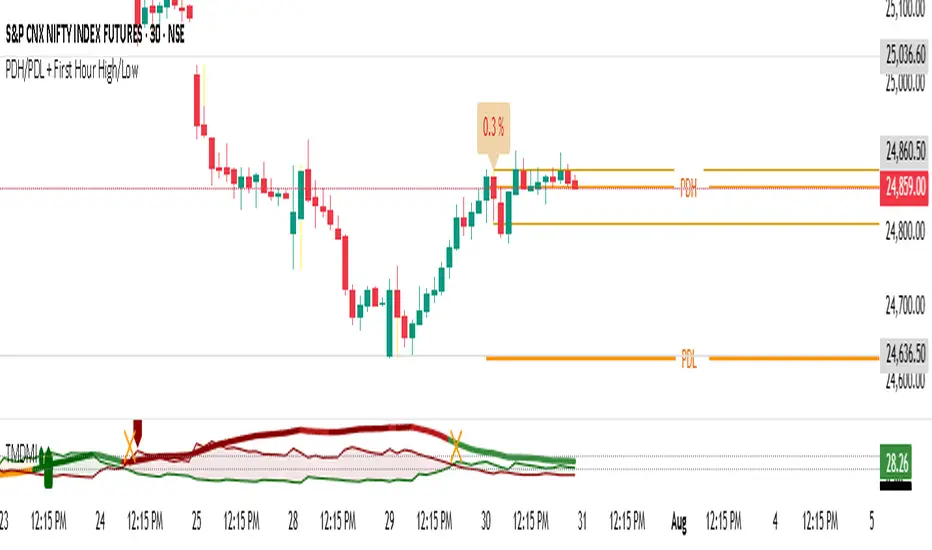
Previous Day High & Low)Previous Day High & Low (PDH/PDL)
This simple but essential tool plots the previous day's high and low as dynamic horizontal lines across the current trading session. Ideal for traders who rely on key support and resistance levels, this indicator automatically updates at the start of each new day and extends the levels across the chart.
🔹 Features:
Automatically tracks and draws the previous day’s high and low.
Lines update cleanly at each new session.
Helps identify breakout and reversal zones.
Perfect for scalpers, intraday traders, and anyone watching for reactions at key levels.
HTF 3rd Weekly High/LowThis indicator plots horizontal lines for the high and low of a selected past weekly candle, allowing traders to visualize higher time frame (HTF) structure on lower time frame charts (e.g., 1H, 4H, etc.).
Features:
Custom Weekly Range Selection: Use the dropdown to choose which weekly candle to reference — from the current week (0) to up to five weeks back.
Clean Horizontal Lines: High and low levels of the selected week are drawn as persistent horizontal lines.
Automatic Text Labels: Labels like Week-3H and Week-3L are shown on the right side of the chart, matching the week selected.
Customization:
Line colors
Line width and style (solid, dotted, dashed)
Text label offset
Automatic Refresh: Levels and labels are redrawn at the start of each new week to stay current with your selection.

RSI-Adaptive T3 [ChartPrime]The RSI-Adaptive T3 is a precision trend-following tool built around the legendary T3 smoothing algorithm developed by Tim Tillson , designed to enhance responsiveness while reducing lag compared to traditional moving averages. Current implementation takes it a step further by dynamically adapting the smoothing length based on real-time RSI conditions — allowing the T3 to “breathe” with market volatility. This dynamic length makes the curve faster in trending moves and smoother during consolidations.
To help traders visualize volatility and directional momentum, adaptive volatility bands are plotted around the T3 line, with visual crossover markers and a dynamic info panel on the chart. It’s ideal for identifying trend shifts, spotting momentum surges, and adapting strategy execution to the pace of the market.
HOIW IT WORKS
At its core, this indicator fuses two ideas:
The T3 Moving Average — a 6-stage recursively smoothed exponential average created by Tim Tillson , designed to reduce lag without sacrificing smoothness. It uses a volume factor to control curvature.
A Dynamic Length Engine — powered by the RSI. When RSI is low (market oversold), the T3 becomes shorter and more reactive. When RSI is high (overbought), the T3 becomes longer and smoother. This creates a feedback loop between price momentum and trend sensitivity.
// Step 1: Adaptive length via RSI
rsi = ta.rsi(src, rsiLen)
rsi_scale = 1 - rsi / 100
len = math.round(minLen + (maxLen - minLen) * rsi_scale)
pine_ema(src, length) =>
alpha = 2 / (length + 1)
sum = 0.0
sum := na(sum ) ? src : alpha * src + (1 - alpha) * nz(sum )
sum
// Step 2: T3 with adaptive length
e1 = pine_ema(src, len)
e2 = pine_ema(e1, len)
e3 = pine_ema(e2, len)
e4 = pine_ema(e3, len)
e5 = pine_ema(e4, len)
e6 = pine_ema(e5, len)
c1 = -v * v * v
c2 = 3 * v * v + 3 * v * v * v
c3 = -6 * v * v - 3 * v - 3 * v * v * v
c4 = 1 + 3 * v + v * v * v + 3 * v * v
t3 = c1 * e6 + c2 * e5 + c3 * e4 + c4 * e3
The result: an evolving trend line that adapts to market tempo in real-time.
KEY FEATURES
⯁ RSI-Based Adaptive Smoothing
The length of the T3 calculation dynamically adjusts between a Min Length and Max Length , based on the current RSI.
When RSI is low → the T3 shortens, tracking reversals faster.
When RSI is high → the T3 stretches, filtering out noise during euphoria phases.
Displayed length is shown in a floating table, colored on a gradient between min/max values.
⯁ T3 Calculation (Tim Tillson Method)
The script uses a 6-stage EMA cascade with a customizable Volume Factor (v) , as designed by Tillson (1998) .
Formula:
T3 = c1 * e6 + c2 * e5 + c3 * e4 + c4 * e3
This technique gives smoother yet faster curves than EMAs or DEMA/Triple EMA.
⯁ Visual Trend Direction & Transitions
The T3 line changes color dynamically:
Color Up (default: blue) → bullish curvature
Color Down (default: orange) → bearish curvature
Plot fill between T3 and delayed T3 creates a gradient ribbon to show momentum expansion/contraction.
Directional shift markers (“🞛”) are plotted when T3 crosses its own delayed value — helping traders spot trend flips or pullback entries.
⯁ Adaptive Volatility Bands
Optional upper/lower bands are plotted around the T3 line using a user-defined volatility window (default: 100).
Bands widen when volatility rises, and contract during compression — similar to Bollinger logic but centered on the adaptive T3.
Shaded band zones help frame breakout setups or mean-reversion zones.
⯁ Dynamic Info Table
A live stats panel shows:
Current adaptive length
Maximum smoothing (▲ MaxLen)
Minimum smoothing (▼ MinLen)
All values update in real time and are color-coded to match trend direction.
HOW TO USE
Use T3 crossovers to detect trend transitions, especially during periods of volatility compression.
Watch for volatility contraction in the bands — breakouts from narrow band periods often precede trend bursts.
The adaptive smoothing length can also be used to assess current market tempo — tighter = faster; wider = slower.
CONCLUSION
RSI-Adaptive T3 modernizes one of the most elegant smoothing algorithms in technical analysis with intelligent RSI responsiveness and built-in volatility bands. It gives traders a cleaner read on trend health, directional shifts, and expansion dynamics — all in a visually efficient package. Perfect for scalpers, swing traders, and algorithmic modelers alike, it delivers advanced logic in a plug-and-play format.

Sessions High/LowIndicator lines to show the prior days NY high/low, overnight Asian high/low, and recent London high/low. Time frame variables are included as well as the option to change colors for both the high and low. Good luck.

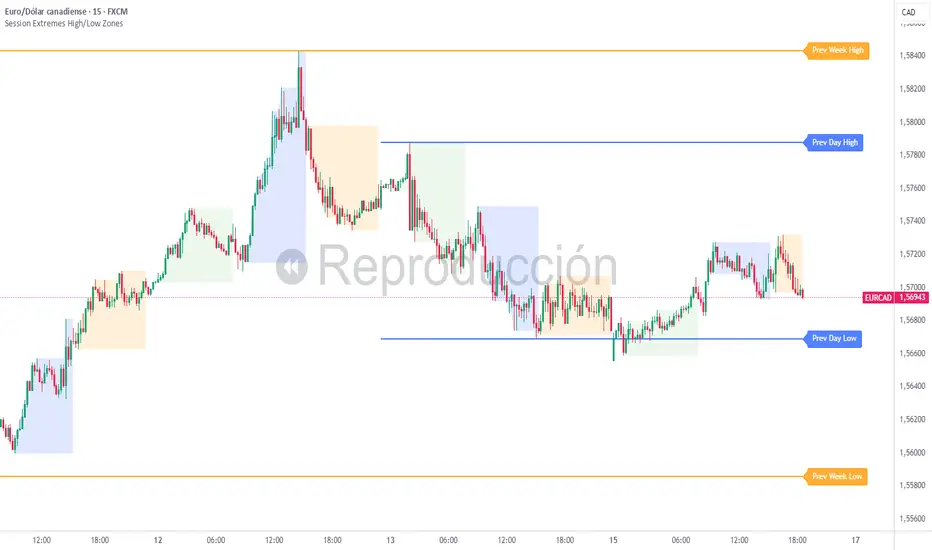
Session Extremes High/Low ZonesThis indicator highlights the High and Low of the three main trading sessions: Asia, London, and New York, based on configurable time ranges and UTC offset.
It also displays the previous day's and previous week's High and Low as dynamic lines with labels for reference.
🛠️ Features:
Customizable session times (HHMM-HHMM format)
Adjustable UTC offset for correct timezone alignment
Styling options for line colors, widths, styles and transparency
Optional session range shading
🔎 Ideal for traders who use intraday support/resistance levels or want to visualize volatility zones during different sessions.
Built with Pine Script v5. No alerts or trading signals included.
This script is intended for educational and informational purposes only.
Multi-Timeframe High/Low MarkerDescription
This indicator displays the previous period's high and low price levels from up to three different timeframes simultaneously. Lines extend from the previous period through the current period, providing clear visual reference points for key price levels across multiple time horizons.
Utility
Identify price ranges and key levels from multiple periods.Reduce chart switching by displaying multiple ranges on a single chart.
Function
Track up to 3 different timeframes simultaneously (default: 1H, 4H, Daily)
Customize each timeframe's high and low line colors, width, and style (solid/dashed/dotted)
Optional current period opening price display for each timeframe
Smart overlap detection prevents duplicate lines when multiple timeframes share the same price level
Each timeframe can be individually enabled or disabled
All visual elements fully customizable through indicator settings

Recent Session High Low Marker - SimpleDescription:
This Pine Script marks the high and low points of the most recent trading sessions: Asian, London, and New York.
Asian Session: From 19:00 to 21:00 New York time (UTC-4).
London Session: From 02:00 to 05:00 New York time (UTC-4).
New York Session: From 07:00 to 10:00 New York time (UTC-4).
For each session, the script draws two lines:
One for the high of the session.
One for the low of the session.
The lines are drawn horizontally across the chart, making them easy to spot. Each session is marked by two lines with specific colors:
Orange for the Asian session.
Blue for the London session.
Purple for the New York session.
The lines are dynamically updated during the active session, and they will reset when the next session begins. The width of the lines is set to 2 to ensure they are visible without being too thick.
Credits:
Script created by Jdv.

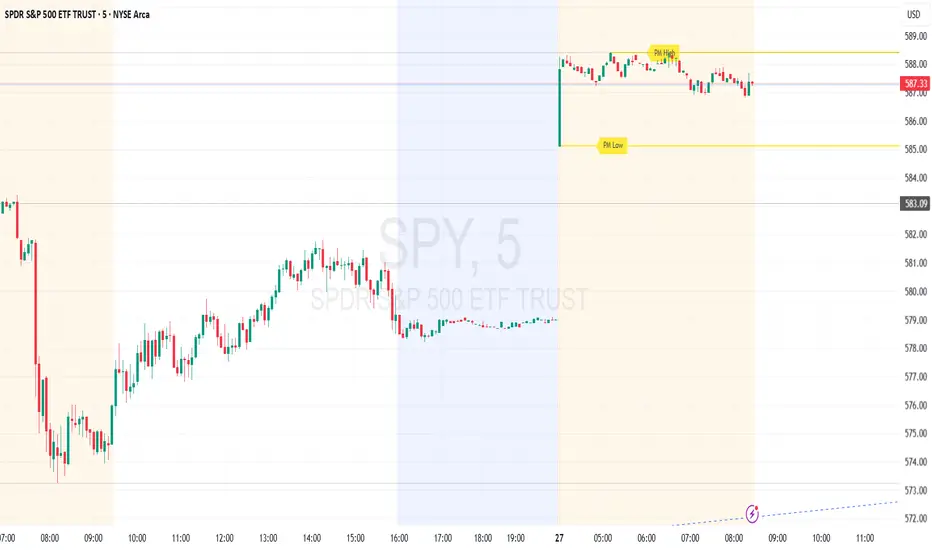
Premarket High/Low (Horizontal Rays)=== Script Description ===
This TradingView script automatically detects and displays the high and low prices
during the premarket session (04:00–09:30 Eastern Time) for the current trading day.
It draws horizontal rays that extend across the chart and labels them as "PM High" and "PM Low".
These markers are refreshed daily and only apply to today's session.
The script also provides full customization for:
- Line color, width, and style (solid, dotted, dashed)
- Label text color, background color, size, and style (left, right, up, down)
Time note: This script assumes data aligned with U.S. market hours.
Prev-Day High-Low Box 09:30-15:30This indicator plots a visual range box for the previous day's regular trading session, based specifically on 09:30 AM to 3:30 PM market hours (Eastern Time by default).
Features:
Automatically detects each new trading day
Draws a box from the previous day’s high to low
Box extends into the current session for a set number of bars (default: 160)
Labels mark the previous high and previous low individually
Clean and minimal — only one box and label set is drawn at a time
Works on intraday timeframes (1min, 5min, 15min, etc.)
Use it to:
Identify zones of interest from the last session
Watch for breakouts, reversals, or mean reversion setups
Combine with VWAP, moving averages, or price action for added context
This tool is handy for day traders and scalpers who want to map out the structure of prior sessions during live trading hours.

Current Fractal High/Low (Dynamic)
This indicator dynamically tracks the most recent confirmed Fractal High and Fractal Low across any timeframe using custom left/right bar configurations.
🔍 Key Features:
Detects Fractal Highs and Lows based on user-defined pivot settings.
Draws a green line and label ("FH") at the most recent Fractal High.
Draws a red line and label ("FL") at the most recent Fractal Low.
All lines extend from the confirmation bar to the current candle.
Automatically removes old lines and labels for a clean, uncluttered chart.
🛠️ Customizable Inputs:
Left & Right bars for pivot sensitivity
Line width for visibility
📌 Use Cases:
Identifying structure shifts
Recognizing key swing points
Supporting liquidity and breakout strategies
💡 Fractals are confirmed only after the full formation of the pattern (left and right bars). This ensures reliability over reactivity.
This script is designed for intraday to swing traders who want a reliable way to visualize market turning points with minimal noise.

QT NY Session High/LowShows Asia & London High/Low which are key liquidity points price will react to.
You can also adjust the NY AM 6am - 12pm EST range to divide the time frames into 4 quarters
It delivers NY AM true open and the true day open
It gives you previous day high & previous day low
