Current Fractal High/Low (Dynamic)
This indicator dynamically tracks the most recent confirmed Fractal High and Fractal Low across any timeframe using custom left/right bar configurations.
🔍 Key Features:
Detects Fractal Highs and Lows based on user-defined pivot settings.
Draws a green line and label ("FH") at the most recent Fractal High.
Draws a red line and label ("FL") at the most recent Fractal Low.
All lines extend from the confirmation bar to the current candle.
Automatically removes old lines and labels for a clean, uncluttered chart.
🛠️ Customizable Inputs:
Left & Right bars for pivot sensitivity
Line width for visibility
📌 Use Cases:
Identifying structure shifts
Recognizing key swing points
Supporting liquidity and breakout strategies
💡 Fractals are confirmed only after the full formation of the pattern (left and right bars). This ensures reliability over reactivity.
This script is designed for intraday to swing traders who want a reliable way to visualize market turning points with minimal noise.
"low"に関するスクリプトを検索

QT NY Session High/LowShows Asia & London High/Low which are key liquidity points price will react to.
You can also adjust the NY AM 6am - 12pm EST range to divide the time frames into 4 quarters
It delivers NY AM true open and the true day open
It gives you previous day high & previous day low

Advanced Swing High/Low Trend Lines with MA Filter# Advanced Swing High/Low Trend Lines Indicator
## Overview
This advanced indicator identifies and draws trend lines based on swing highs and lows across three different timeframes (large, middle, and small trends). It's designed to help traders visualize market structure and potential support/resistance levels at multiple scales simultaneously.
## Key Features
- *Multi-Timeframe Analysis*: Simultaneously tracks trends at large (200-bar), middle (100-bar), and small (50-bar) scales
- *Customizable Visualization*: Different colors, widths, and styles for each trend level
- *Trend Confirmation System*: Requires minimum consecutive pivot points to validate trends
- *Trend Filter Option*: Can align trends with 200 EMA direction for consistency
## Recommended Settings
### For Long-Term Investors:
- Large Swing Length: 200-300
- Middle Swing Length: 100-150
- Small Swing Length: 50-75
- Enable Trend Filter: Yes
- Confirmation Points: 4-5
### For Swing Traders:
- Large Swing Length: 100
- Middle Swing Length: 50
- Small Swing Length: 20-30
- Enable Trend Filter: Optional
- Confirmation Points: 3
### For Day Traders:
- Large Swing Length: 50
- Middle Swing Length: 20
- Small Swing Length: 5-10
- Enable Trend Filter: No
- Confirmation Points: 2-3
## How to Use
### Identification:
1. *Large Trend Lines* (Red/Green): Show major market structure
2. *Middle Trend Lines* (Purple/Aqua): Intermediate levels
3. *Small Trend Lines* (Orange/Blue): Short-term price action
### Trading Applications:
- *Breakout Trading*: Watch for price breaking through multiple trend lines
- *Bounce Trading*: Look for reactions at confluence of trend lines
- *Trend Confirmation*: Aligned trends across timeframes suggest stronger moves
### Best Markets:
- Works well in trending markets (forex, indices)
- Effective in higher timeframes (1H+)
- Can be used in ranging markets to identify boundaries
## Customization Tips
1. For cleaner charts, reduce line widths in congested markets
2. Use dotted styles for smaller trends to reduce visual clutter
3. Adjust confirmation points based on market volatility (higher for noisy markets)
## Limitations
- May repaint on current swing points
- Works best in trending conditions
- Requires sufficient historical data for longer swing lengths
This indicator provides a comprehensive view of market structure across multiple timeframes, helping traders make more informed decisions by visualizing the hierarchy of support and resistance levels.

High and Low in a Given Date/Time RangeThis Pine Script v5 indicator plots horizontal lines at both the highest and lowest price levels reached within a user-defined date/time range.
Description:
Inputs:
The user specifies a start and an end date/time by providing the year, month, day, hour, and minute for each. These inputs are converted into timestamps based on the chart’s timezone.
How It Works:
Timestamp Conversion: The script converts the provided start and end dates/times into timestamps using the chart’s timezone.
Bar Check: It examines every bar and checks if the bar’s timestamp falls between the start and end timestamps.
Price Updates:
If a bar’s time is within the specified range, the indicator updates the highest price if the current bar's high exceeds the previously recorded high, and it updates the lowest price if the current bar's low is lower than the previously recorded low.
Drawing Lines:
A red horizontal line is drawn at the highest price, and a green horizontal line is drawn at the lowest price. Both lines start from the first bar in the range and extend dynamically to the current bar, updating as new high or low values are reached.
End of Range: Once a bar's time exceeds the end timestamp, the lines stop updating.
This tool offers a clear and straightforward way to monitor key price levels during a defined period without any extra fluff.

Previous D, W, M High/LowThis indicator plots previous day's high,low,open and close values and plots previous week's and month's high and low value on the chart.
Highs & Lows RTH/OVN/IBs/D/W/M/YOverview
Plots the highs and lows of RTH, OVN/ETH, IBs of those sessions, previous Day, Week, Month, and Year.
Features
Allows the user to enable/disable plotting the high/low of each period.
Lines' length, offset, and colors can be customized
Labels' position, size, color, and style can be customized
Support
Questions, feedbacks, and requests are welcomed. Please feel free to use Comments or direct private message via TradingView.
Disclaimer
This stock chart indicator provided is for informational purposes only and should not be considered as financial or investment advice. The data and information presented in this indicator are obtained from sources believed to be reliable, but we do not warrant its completeness or accuracy.
Users should be aware that:
Any investment decisions made based on this indicator are at your own risk.
The creators and providers of this indicator disclaim all liability for any losses, damages, or other consequences resulting from its use. By using this stock chart indicator, you acknowledge and accept the inherent risks associated with trading and investing in financial markets.
Release Date: 2025-01-17
Release Version: v1 r1
Release Notes Date: 2025-01-17

JJ Open High and Open Low FinderThis script identifies candles where the open price matches the high price (Open High) and where the open price matches the low price (Open Low). It highlights these candles with labels directly on the chart, making it easy for traders to spot these conditions in real-time.
Features :
- Red "OH" label below candles for Open High.
- Green "OL" label above candles for Open Low.
Use this tool to enhance your trading insights.
** Disclaimer **: This script is for educational purposes only and should not be considered financial advice.

Session Averages: Open, High, LowThis indicator allows for the user to specify an intraday time based range and calculate the average open price, average high price, and average low price for that session. The indicator plots the 5 most recent sessions on the chart, which allows for the user to identify fair value, Power of 3 movements, trends, and consolidations.
If bullish the user can identify when price is below the average open or low price of a range, and if bearish can identify when price is above the open or high of a range.

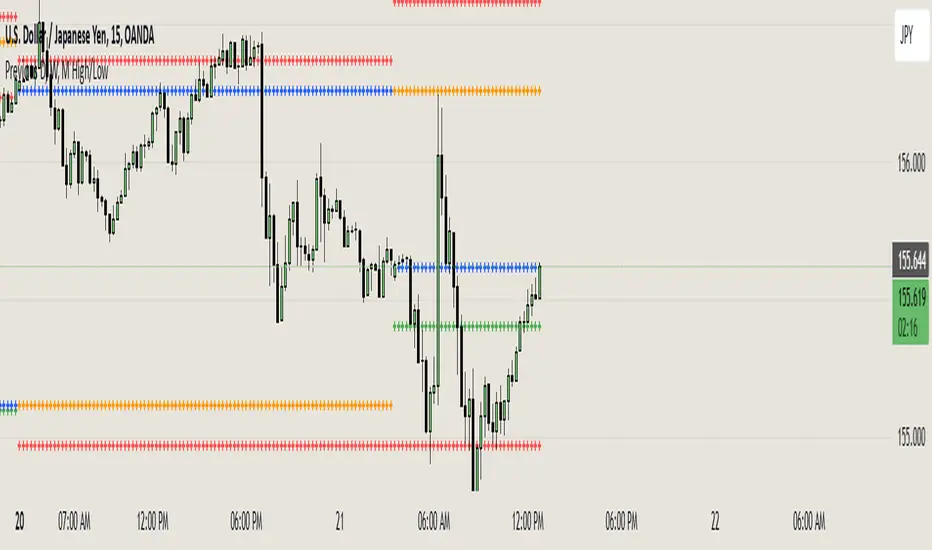
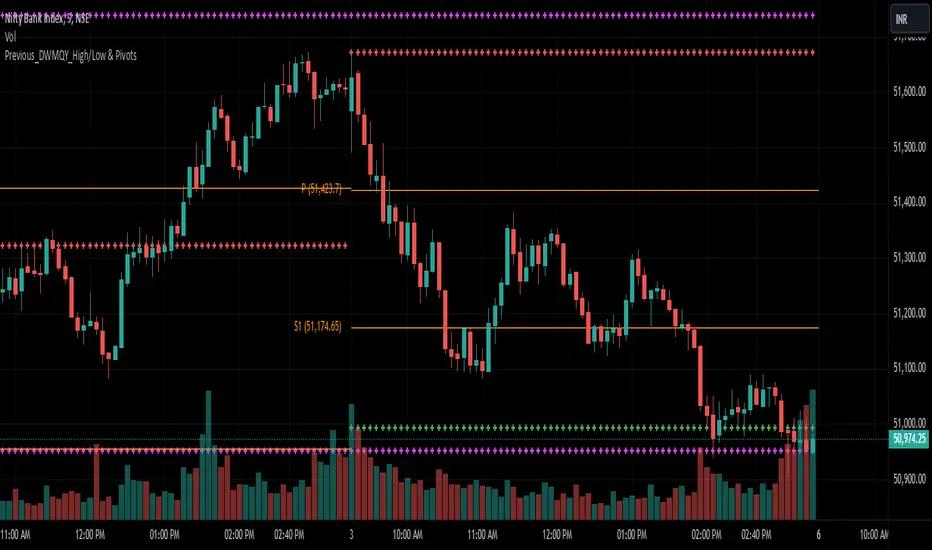
Previous_DWMQY_High/Low & PivotsThis script calculates high/low pivots for different timeframes (daily, weekly, monthly, quarterly, and yearly). You have various pivot point calculation methods (Traditional, Fibonacci, Woodie, Classic, DM, Camarilla) and have inputs that allow customization of the indicator. The script also accounts for custom year-based calculations (bi-yearly, tri-yearly, quinquennially, decennially).
The first part of your code calculates the high and low levels for different timeframes, which are plotted on the chart as crosses. The second part involves the pivot point calculations, where the user selects the type of pivot point calculation (Traditional, Fibonacci, etc.), the timeframe for pivots, and other display settings.
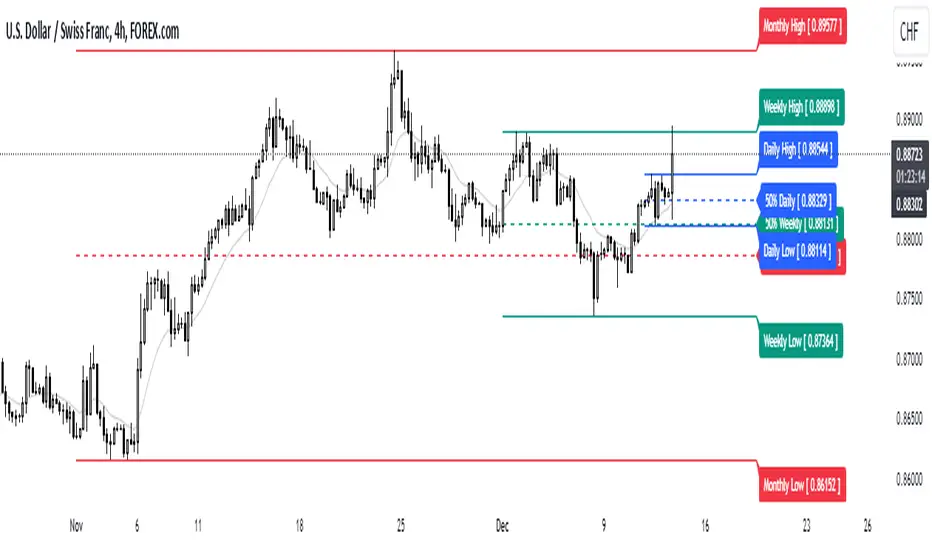
High/Mid/Low of the Previous Month, Week and Day + MAIntroducing the Ultimate Price Action Indicator
Take your trading to the next level with this feature-packed indicators. Designed to provide key price insights, this tool offers:
- Monthly, Weekly, and Daily Levels : Displays the High, Midpoint, and Low of the previous month, week, and day.
- Logarithmic Price Lines : Option to plot price levels logarithmically for enhanced accuracy.
- Customizable Labels : Display labels on price lines for better clarity. (This feature is optional.)
- Dual Moving Averages : Add two customizable Moving Averages (Simple, Exponential, or Weighted) directly on the price chart. (This feature is optional.)
This code combines features from the Moving Average Exponential and Daily Weekly Monthly Highs & Lows (sbtnc) indicators, with custom modifications to implement unique personal ideas.
Perfect for traders who want to combine precision with simplicity. Whether you're analyzing historical levels or integrating moving averages into your strategy, this indicator provides everything you need for informed decision-making.
To prevent change chart scale, right click on Price Scale and enable "Scale price chart only"
PDH & PDL Indicator: Previous Day's High/Low with AlertsThe PDH & PDL Indicator plots the Previous Day's High (PDH) and Previous Day's Low (PDL) directly on the chart, providing a clear visual reference for key price levels. These levels are often used by traders to identify potential breakout or breakdown zones and to gauge market strength or weakness.
Features:
PDH (Green Line) : Represents the high of the previous trading day.
PDL (Red Line): Represents the low of the previous trading day.
Alerts:
Get notified when the price crosses above PDH or below PDL.
Custom alert messages to keep you informed in real-time.
Use Cases:
Identify key breakout and breakdown points for potential trade entries or exits.
Confirm the strength of a trend by monitoring price action relative to PDH and PDL.
Useful for intraday, swing, and positional traders who rely on historical price levels for strategy development.

Session Highs and Lows IndicatorThis indicator marks the high and low levels for key trading sessions, allowing traders to identify significant price zones across different markets. The default session times are defined in UTC and will automatically adjust to your local timezone:
- **London Session (07:00-09:00 UTC)**: Tracks intraday liquidity zones for potential highs/lows.
- **New York Session (12:00-14:00 UTC)**: Highlights volatility during market overlaps with Europe.
- **Asia Session (23:00-01:00 UTC)**: Confirms trend continuation and retracement opportunities.
- **New York Close Session (19:00-21:00 UTC)**: Focuses on reversals and breakout tests during global transitions.
The script dynamically updates session highs and lows with clear labels and dashed horizontal lines for better visualization. **Time ranges can be adjusted to suit your trading preferences.** This makes the indicator flexible and effective for liquidity hunting, trend trading, and breakout strategies.

Dynamic Time Period CandlesThis indicator gives the dynamic history of the current price over various time frames as a series of candles on the right of the display, with optional lines on the chart, so that you can assess the current trend more easily.
In the library I found lots of indicators that looked at the previous xx time period candle, but they then immediately switched to the new xx time candle when it started to be formed. This indicator looks back at the rolling previous time period. With this indicator, you can clearly see how price has been behaving over time.
IMPORTANT SETUP INFO:
Initially, you must go into the settings and select the timeframe (in minutes) that your chart is displaying. If you don't do this then the indicator will look back the wrong number of candles and give you totally wrong results.
You can then setup how high you want the candle labels to be on the chart.
Then you can select settings for each candle that you want displayed. Anywhere between 1 and 5 different timeframes can be displayed on the chart at once.
I initially published an indicator called 'Dynamic 4-Hour Candle (Accurate Highs and Lows)', but this new indicator is so different that it needs to be forked and published as a separate indicator. The reasons for this are below:
The original indicator only looked at the previous 4 hour time period. This indicator allows the user to select any time period that they choose.
The original indicator only looked at one time period. This indicator allows to select between one and five time periods on the chart at once.
The original indicator did not put lines on the chart to show the lookback period and the highs and lows of that time period. This indicator does both those things.
The name of the original indicator in no way now describes what this new indicator is capable of, and would be very misleading to anyone who came across it. This new indicator has a name that much more accurately reflects what its' purpose and functionality is.

High & Low Of Custom Session - Breakout True Open [cognyto]This indicator is based on the High & Low Of Custom Session - OpeningRange Breakout (Expo) created by Zeiierman.
It adds new functionality and enhances existing settings, targeting ES, NQ, and YM:
Manages session defaults to 12:00 to 13:00
New true opening fully customizable (default 13:00)
Manages timeframe visualization (default 15m and below)
Manages session draw length until the end of the current session (default NY)
Manages previous sessions, allowing the to be hidden
Improves timezone selection (default NY)
Following the strategy called Paradox detailed by DayTradingRauf, it works with indices like ES, NQ, and YM.
The rules consider three possible profiles:
First
AM session as consolidation (08:00-12:00)
Lunch hour range as consolidation (less than 100 points)
PM session breaking either side of the session range
Second
AM session trending lower (08:00-12:00)
Lunch hour range as consolidation (less than 100 points)
PM session trending higher
Third
AM session trending higher (08:00-12:00)
Lunch hour range as consolidation (less than 100 points)
PM session trending lower
After the session ends, the opening price at 13:00 is automatically drawn as it is a key point for the entry strategy.
The strategy can be monitored using a 5-minute or 15-minute timeframe as follows:
- Wait for a liquidity hunt (either the high or low of the lunch session range or AM is taken).
- If liquidity is taken, switch to the 1-minute timeframe and wait for a CISD (change in the state of delivery), where the price closes below an OB, or consider a breaker block or iFVG to enter the trade.
- Bullish entries should happen below the opening price at 13:00, and bearish entries should happen above.
- Consider a 1:2 reward ratio. However, runners can target the opposite side of the range that was not yet taken.
This indicator is for informational purposes only and you should not rely on any information it provides as legal, tax, investment, financial or other advice. Nothing provided by this indicator constitutes a solicitation, recommendation, endorsement or offer by cognyto or any third party service provider to buy or sell any securities or other financial instruments in this or any other jurisdiction in which such solicitation or offer would be unlawful under the securities laws of such jurisdiction.

Open interest buildup & Session Open high-lowThis indicator is to be used on srcipts in Futures Segment.
1. It visually displays in tabular format the change in open interest and the change in price compared to the previous day.
2. It also displays the scenario where open price of session is near high price of session or low price of session, indicating a emergence of strong sellers or strong buyers from start of session respectively.
3. A positive change in open interest and a positive change in price is denoted by a long buildup and open price near low price is an additional confirmation for a probable long scenario in the script.
4. A positive change in open interest and a negative change in price is denoted by a short buildup and open price near high price is and additional confirmation for a probable short scenario in the script.
Key features of the indicator include:
Override Symbol Input: Traders can override the default symbol and input their preferred symbol for analysis.
Open Interest Data: The indicator retrieves open interest data for the selected symbol and time frame, facilitating analysis based on changes in open interest.
Dashboard: The indicator features a customizable dashboard that displays key information such as build-up conditions, OI change, and price change.
Build-Up Conditions: The indicator identifies long build-up and short build-up scenarios based on user-defined thresholds for OI change and price change percentages.
Customization Options: Traders have the flexibility to customize various aspects of the indicator, including colors for long build-up, short build-up, positive OI change, negative OI change, positive price change, and negative price change.
Label Plots: Buy and sell labels are plotted on the chart to highlight potential trading opportunities. Traders can customize the colors and text colors of these labels based on their preferences.
Overall, the indicator offers traders a comprehensive tool for analyzing price movements and open interest changes, helping them make informed trading decisions in the futures segment.

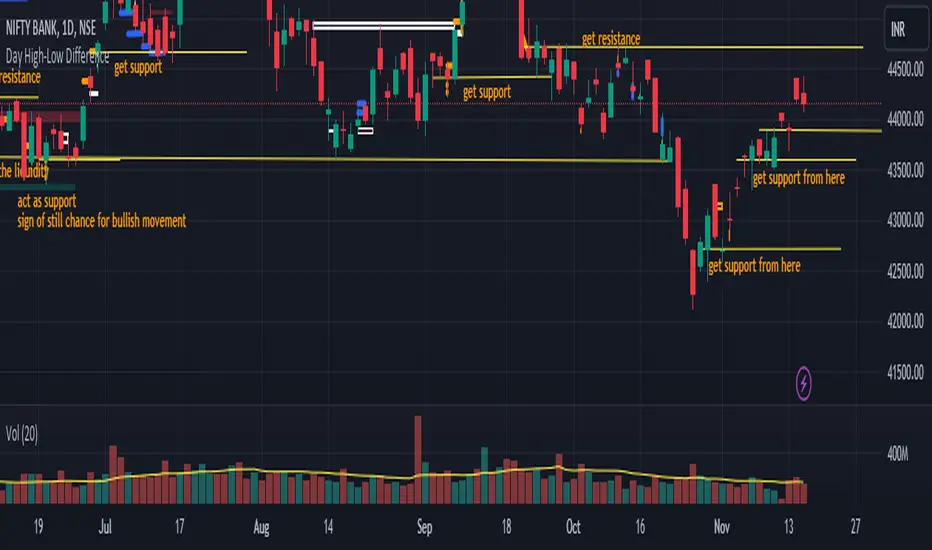
Day High-Low Difference ( The one trader )The "Day High-Low Difference" candle tool is an indicator that calculates and visually represents the difference between the highest price (day high) and the lowest price (day low) within each candle on a given chart. This tool is useful for traders and analysts to quickly assess the volatility or range of price movement within individual candles.
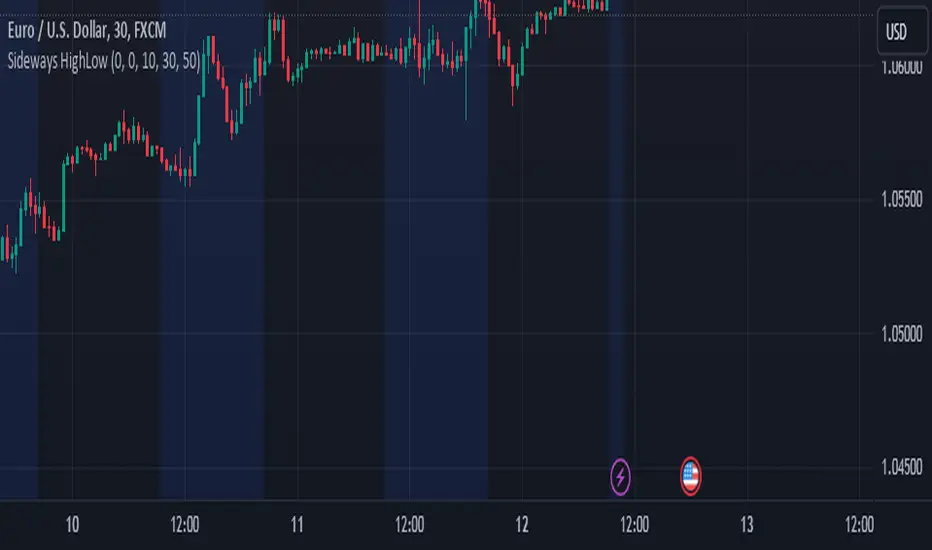
Sideways Market Detector with High/Low NJRCalculate the range as the difference between the high and low prices.
The maxRange input to specify the maximum allowable range that defines a sideways market.
The background color is set to blue during sideways market conditions, and it's transparent to some extent (transp=90). When the market is not sideways, the background color is not changed.
The indicator marks the start and end of the session with red triangles.
When the price range (high - low) is within the specified threshold, the indicator will indicate a sideways market with a blue background.
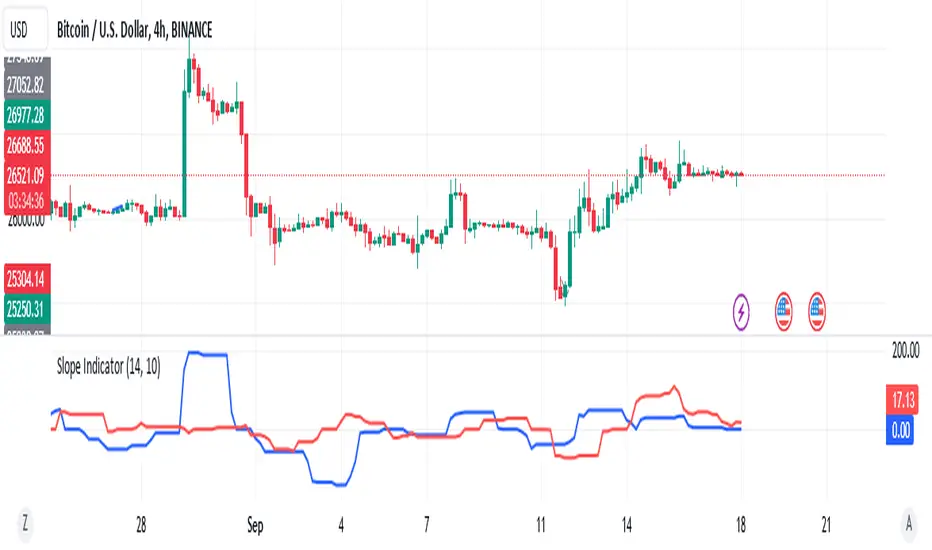
Slope Indicator of Highest Highs and Lowest Lows
In this example, the indicator calculates the slope between the highest high value of the current period and the highest high value candles bars ago. The result is plotted on the chart as a line.
And this example calculates the slope between the lowest low value of the current period and the lowest low value candles bars ago. It then plots the slope on the chart using a red line.
Feel free to adjust the input parameters and modify the code to fit your specific requirements. If you have any more questions or need further assistance, feel free to ask!
OBV Daily High Low Box Realtime (On Balance Volume)Overview
This indicator plots horizontal lines at the daily high and low levels of the On Balance Volume (OBV).
The numerical lines for each day are updated in real-time as the OBV high and low values change.
Please note that there are limitations on how far back in history the indicator can go due to Pine Script's object drawing limitations.

YDH/YDL to Current Day H/L - Zones- Draw boxes on the intersections between yesterday's high/low and the day's after high/low
This will help you to visualize areas at extreme points where algo hasn't yet pushed price to recover them

Key Levels (Open, Premarket, & Yesterday)OVERVIEW
This indicator automatically identifies and draws recent high-probability support and resistance levels (recent key levels). Specifically, yesterdays highs / lows, premarket highs / lows, as well as yesterdays end of day Volume Weighted Average Price and trader specified Moving Average.
This is most useful on charts with intraday time frames (1 minute, 5 minute etc.) commonly used for day trading. This is not ideal for larger time frames (greater than 1 hour) commonly used for swing trading or identifying larger trends.
INPUTS
You can configure:
Line size, style, and colors
Label colors
Which key levels you want to see
Moving Average Parameters
Market Hours and Time Zone
DEV NOTES
This script illustrates:
A method for iterative management of more complex data objects (not just discrete values) with loops and arrays.

BTC Log High/LowThis indicator aims to display the price index of Bitcoin based on its logarithmic high and low values. Indicator calculates the logarithmic high and low values of Bitcoin using specific mathematical formulas and then applies a price index formula to obtain a value for each bar on the chart. The resulting value is plotted on the chart as a line, representing the Bitcoin price index.
The indicator also includes several horizontal lines at specific levels, which can be adjusted by the user. The lines are used to indicate important price levels and act as support and resistance levels. Additionally, the indicator includes two moving averages, a 100-period exponential moving average (EMA) and a 200-period EMA, which can be used to identify trends.

Statistics: High & Low timings of custom session; 1yr historyGet statistics of the Session High and Session Low timings for any custom session; based on around 1yr of data.
//Purpose:
-To get data on the 'time of day' tendencies of an asset.
-Narrow in on a custom defined session and get statistics on that session.
//Notes:
-Input times are always in New York time (but changing the timezone after setting WILL adust both table stats and background highlight correctly.
-For particularly long sessions, make sure text size is set to 'tiny' (very long vertical table), or adjust table to display horizontally.
-You'll notice most assets show higher readings around NY equities open (9:30am NY time). Other assets will have 'hot-spots' at other times too.
-Timings represent the beginning of a 15m candle. i.e. reading for 15:45 represents a high occurring between 15:45 and 1600.
-Premium users should get 20k bars => around 1year's worth of data on a 15minute chart. Days of history is displayed in the top left corner of the table.
//Limitations
-only designed and working on 15minute timeframe (to gather a full year of meaningful/comparable % stats, need 15minute 'buckets' of time.
-sessions cannot cross through midnight, or start at midnight (00:15 is ok). 00:15 >> 23:45 is the max session length. On BTC, same applies but 01:00 instead of midnight (all in NY time).
-if your session crosses through 'dead time' (e.g. 17:00-18:00 S&P NY time); table will correctly omit these non-existent candles, but it will add on the missing hour before the start time.
//Cautionary note:
-Since markets are not uncommonly in a trending state when your defined session starts or ends, the high/low timings % readings for start and end of session may be misleadingly high. Try to look for unusually high readings that are not at the start/end of your session.
Wheat (ZW1!) 15min chart; Table displayed vertically:
Nasdaq (NQ1!) 15m chart; Table displayed horizontally and with smaller text to view a very long custom session:
