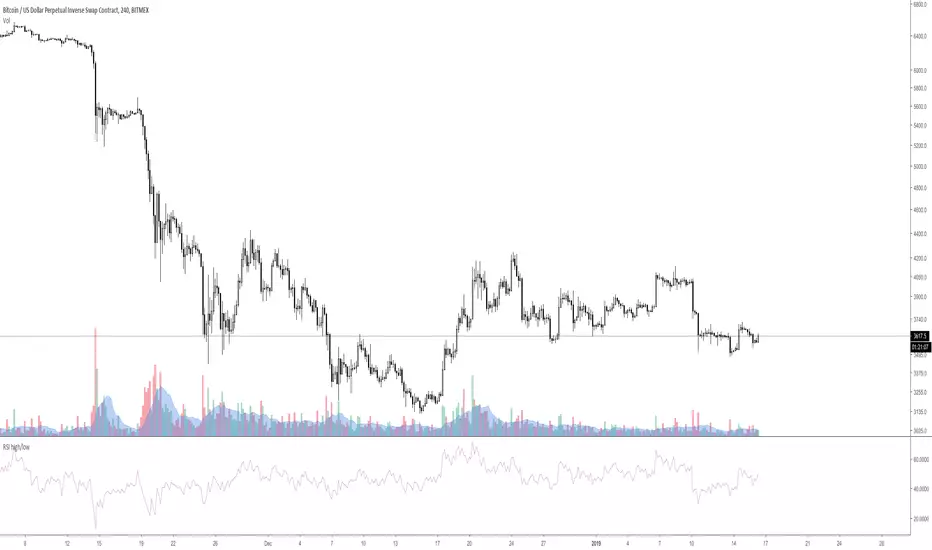
RSI high/low [experiment]This is an experiment.
This is a RSI based on candle high / low instead of close.
If the candle is up / green then the high is used.
If the candle is down / red then the low is used.
Feel free to ask if you have any question.
"low"に関するスクリプトを検索
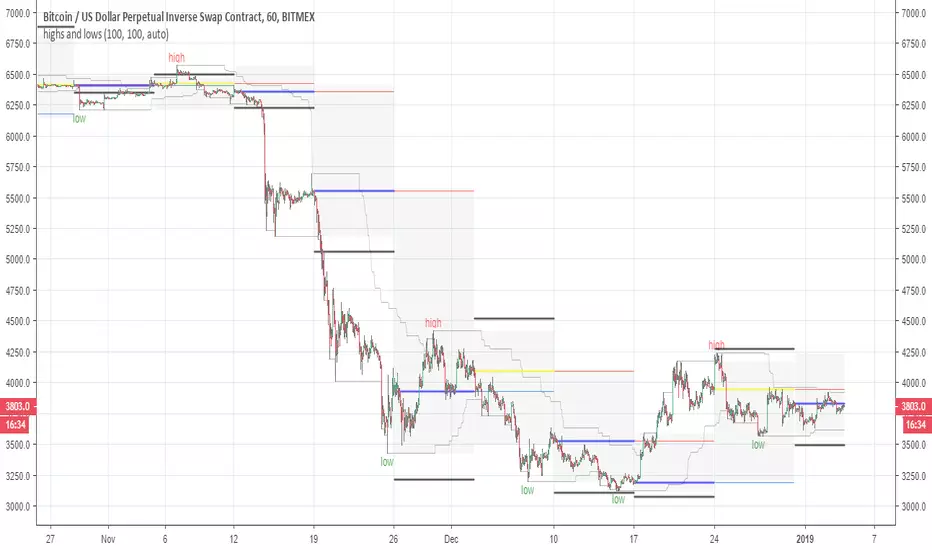
highs and lowsThis system allow you to detect the highs and the lows based on open and close and donchian channel
with this system you can easy find the resistance and the support level
good from 4 hour chart to 5 min chart
The black line are the 10% margin which you can use as you exit point or your stop once we find a low by the donochian cahannel
The system try to help you to find the target of your take profit once you decided to go either short or long
There is no alerts but they can be added if one wish to do it
one can add TP to it or change settings as he wish if want to play with code. I keep it as idea only
main scripts are made from scripts that are open in TV
15 min graph
4 hour graph
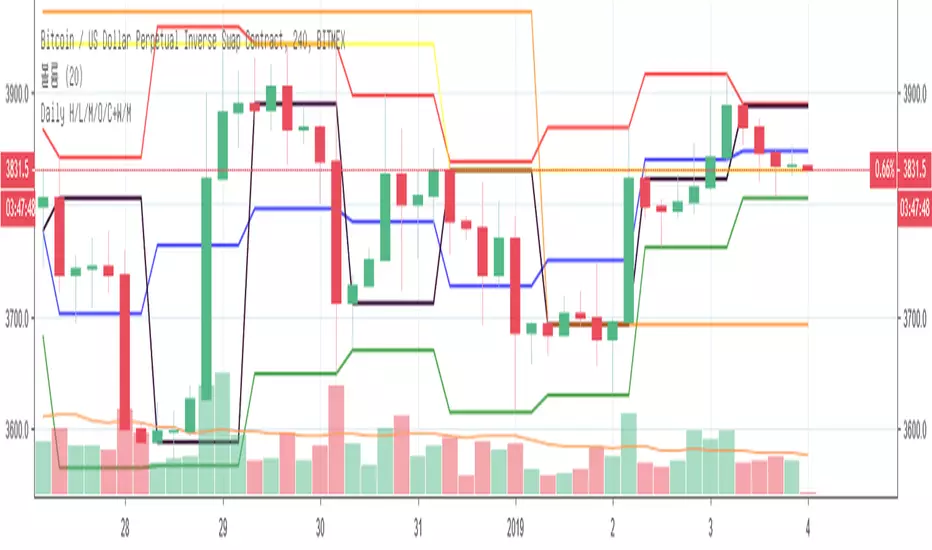
Daily High/Low/Mid/Open/CloseI modify existing scripts about Daily High/Low, Daily Open, Previous Daily Close, etc.
Daily High = red color
Daily Low = green color
Daily Mid = blue color
Daily Open = purple color
Previous Daily Close = black color

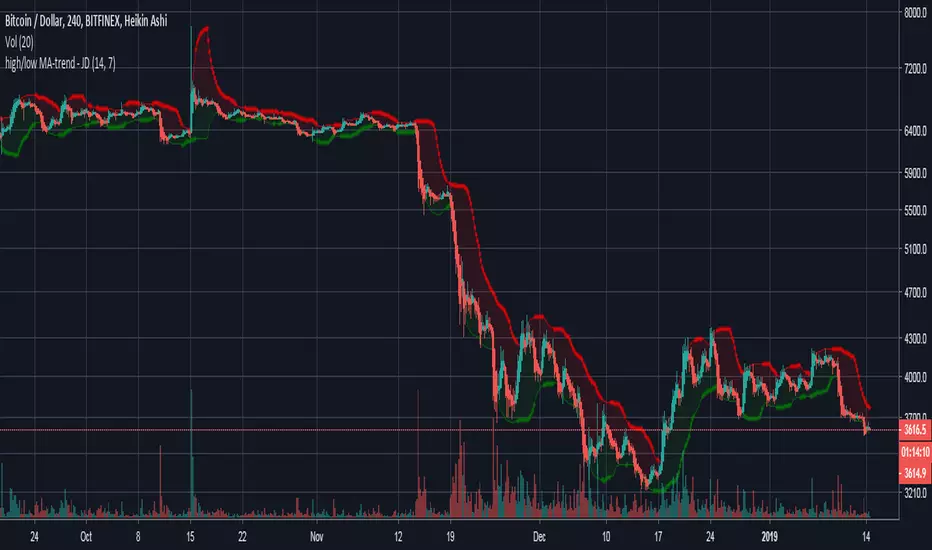
high/low MA-trend - JDShort script for trend indication taking a moving average of the highs and the lows seperately.
Lookback period for the highs/lows can be altered.
Ema length can be altered.
JD.
[M]HLC PlotsHLC Plots
Draws points (lines) to high low and close. In some trading situations, this method is more convenient than candles or bars.
--------------------------------------
Рисует точки(линии) по high low и close. В некоторых ситуациях торговли такой способ бывает удобней, чем свечи или бары. На вкус и цвет все фломастеры разные =)

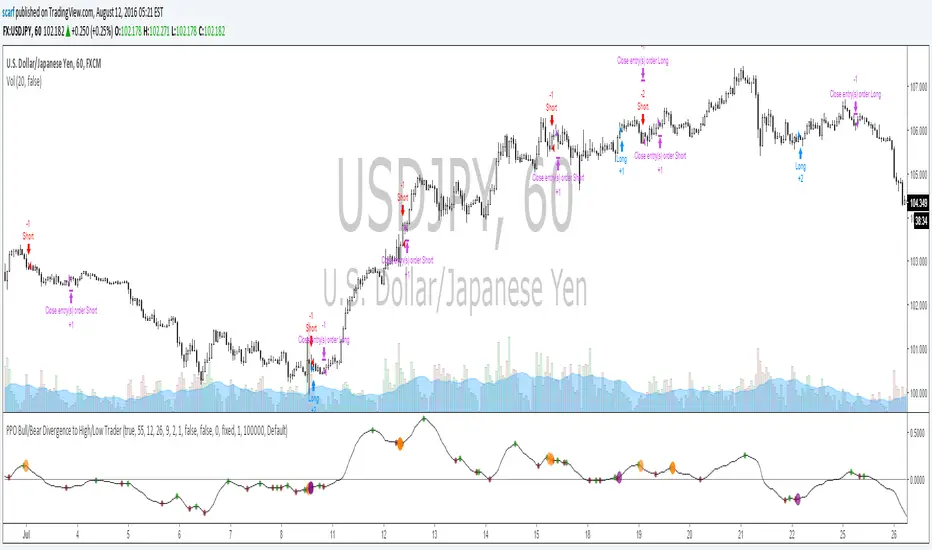
PPO Bull/Bear Divergence to High/Low StrategyA simple strategy that uses the PPO divergences to open trades and the highs/lows to close them. Credit to Pekipek for this PPO Divergence indicator (I changed the visuals a bit)
STRATEGY
Purple circle - bullish divergence - enter LONG
Orange circle - bearish divergence - enter SHORT
Green dot - high point - exit LONG
Red dot - low point - exit SHORT
That's it. Not very profitable, but I like Pekipek's indicator a lot so figured I'd see what a strategy was like. Would love to see any variations.
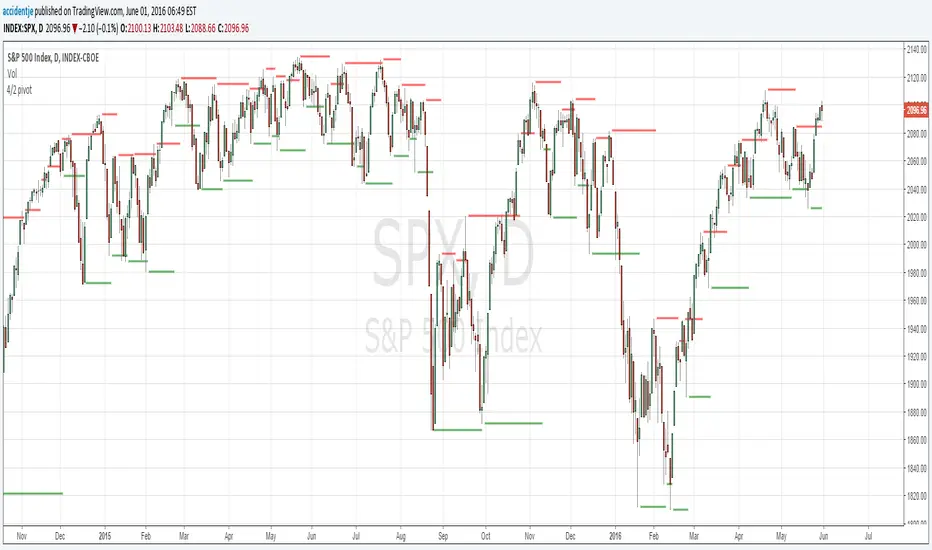
4/2 pivot levelsPlots...
Confirmed highs when 1. it's higher than the 4 prior (lower) highs AND 2. higher than the 2 following (lower) highs.
Confirmed lows when 1. it's lower than the 4 prior (higher) lows AND 2. lower than the 2 following (higher) lows.
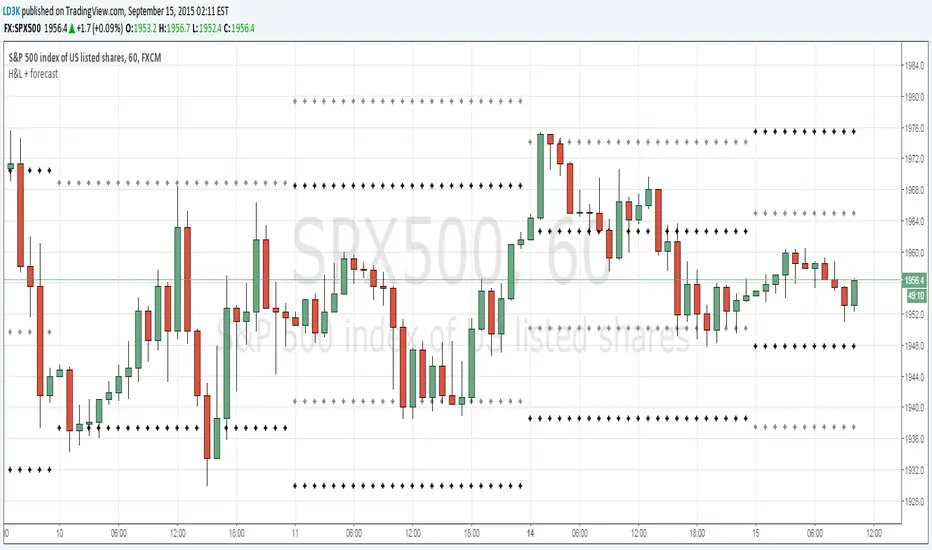
Previous H/Ls and Forecast H/LPlots the previous periods High and Lows (black crosses) and forecasts the next day's High and Lows (gray crosses)
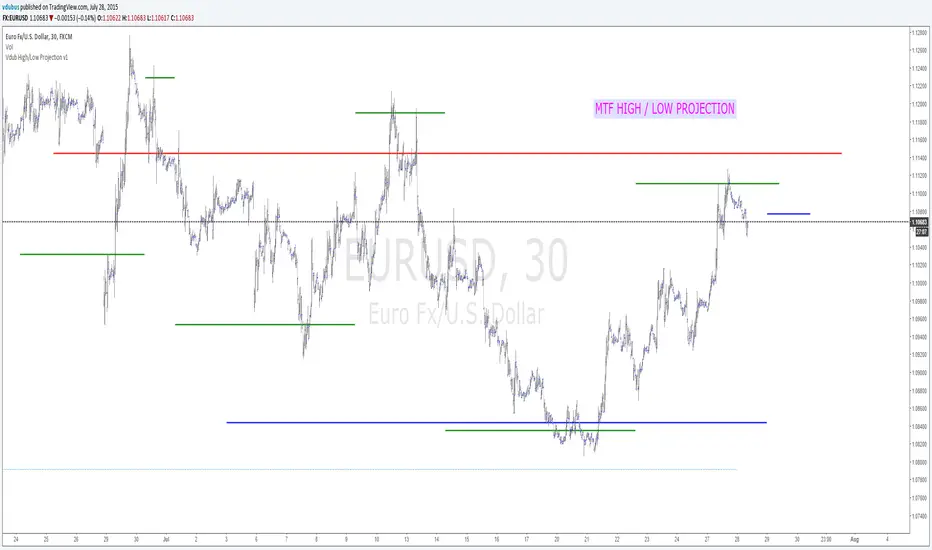
Vdub High/Low Projection v1Vdub High/Low Projection v1
Modified London Underground /
3 x MTF High/Low / projected targets Hourly, Daily, Weekly
RSI Stochastic Extreme Combo alertThis script will give you red or green columns as an indication for oversold/overbought based upon the rsi and stochastic both being at extreme levels (you set). The default oversold is at 35. If Stochastic and RSI fall below 35, you will get a green column (Both indicators at the extreme). Play with your levels to see how your stock reacts. RSI and Stochastic can both be changed along with each of the levels you would like the color change. I have set mine at RSI low: 37, RSI high: 63, Stoch low: 10, and Stoch high: 90. These levels have been working well for me on AAPL. Enjoy and don't forget to leave a comment if it helps your trading or you have other ideas about what is working for you.

Higher Timeframe MA High Low BandsHigher Timeframe Customer MA High Low Bands. There are 3 different Moving Average Parameters Available. Indicator will plot 3 lines of MA Length With Source of High, Close and Low. User can change relevant MA parameters / Show or Hide MA.
Happy Trading

Session Highs & Lows - Pinhead TradesMarks out the session highs and lows + Sweeps
*Very good for looking for reversal entry's targeting opposing session liquidity

Multi-TF Buy Low Sell High (based on coinrule)This strategy based on idea from Coinrule:
help.coinrule.com
ENTRY
To capture the strength behind the reversal on the asset, the strategy requires that MA50 be lower than the current market price. To capture a contrarian opportunity on the asset, the rule requires that RSI be lower than 35 on a higher timeframe.
The rule places the order when both conditions above are met. The buy order only ends up being placed on assets when it seems they are leaving the "oversold" status on the RSI.
EXIT
This strategy comes with a conditional stop loss and a target take profit.
The engine only engages the stop loss if, as a whole, the rule is in a certain pre-defined loss. The rule checks the total cumulative PnL across all trades (open and closed) by that strategy, and if this is greater than the predefined amount, only then does it apply the stop loss logic. This way you can adapt the risk management of the strategy to the market, becoming more risk-averse when the market turns against you and become more risk-loving when you are trading in favourable market conditions.

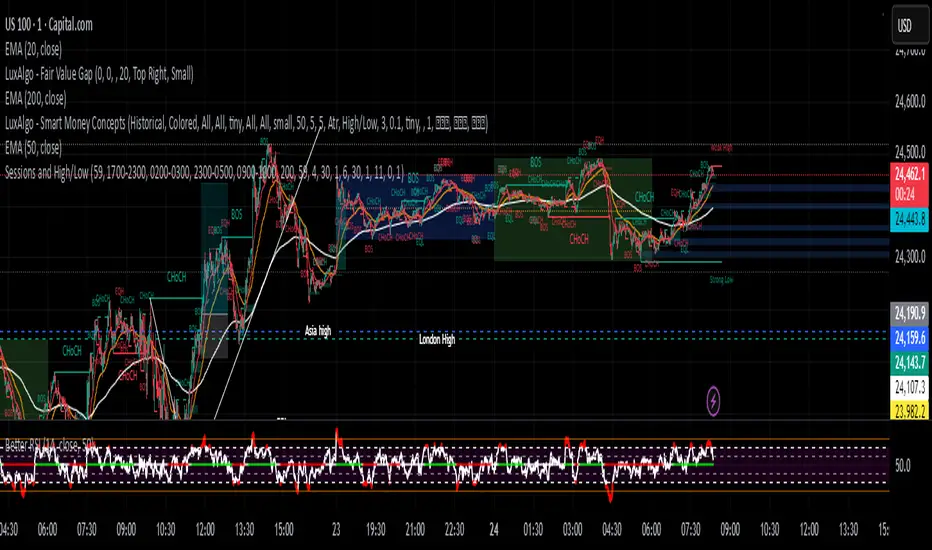
Sessions and High/LowCan be used to mark highs and lows of any sessions you desire can do 4 sessions
ATH/ATL/DaysThis indicator displays the All-Time High (ATH) and All-Time Low (ATL) — or more precisely, the highest and lowest price within the last N days. It works on any timeframe and uses only local chart data (no security() calls), ensuring stable and accurate results.
It plots horizontal lines for both the ATH and ATL and includes a clean, compact table showing:
Date of the extreme
Days since it occurred
Price
% distance from current price
$ distance from current price
A reliable tool for identifying local extremes, spotting market structure shifts, and tracking short-term price ranges.

Near N Bars Real Body High and Low Support and Resistance
This indicator dynamically identifies support and resistance levels based on the highest and lowest values of the real bodies (open and close prices) of the most recent N bars. Users can interactively select the starting bar by clicking on the chart, and the script calculates the highest high and lowest low within the specified range, drawing horizontal support and resistance lines accordingly. The lines can be extended to the left and right according to user inputs. This tool helps traders visually identify key price levels for technical analysis based on recent price action.

Previous Days High & Low (with back testing)Shows Previous Days High & Low with adjustable time for Futures after hours or regular market


session high and low (only for current day) -HITHVEERits about session highs and lows and only for the current day and main sessions are asia london and newyork

Pivot Points High Low & Missed Reversal Levels + Alertsmake alert if there come a new high and low, best in 15 min and pivot go from 50 to 15

Hourly High Low Short LinesDraws short horizontal lines at the previous hour’s high and low, aligned perfectly with the candle’s top and bottom.
It’s concise, clear, and fits well for the public script description box.
