High Low Differential MeterYet another trend follower that is based on a very simple principle: Take the highest high and lowest low from a user defined bars back period, do an average between them and smooth them up with 3 possible moving averages, VIDYA, EMA and SMA, while VIDYA is the default.
What is VIDYA ?
Variable Index Dynamic Average (VIDYA) is similar to the Exponential Moving Average (EMA), but automatically adjusts the smoothing weight based on price volatility.
How to use:
GREEN : Up trending
LIGHT GREEN : Up trend reversal might occur.
RED : Down trending
LIGHT RED : Down trend reversal might occur.
NOTE: BAR COLORS are set to TRUE by default!
Follow for more indicators: www.tradingview.com
"low"に関するスクリプトを検索

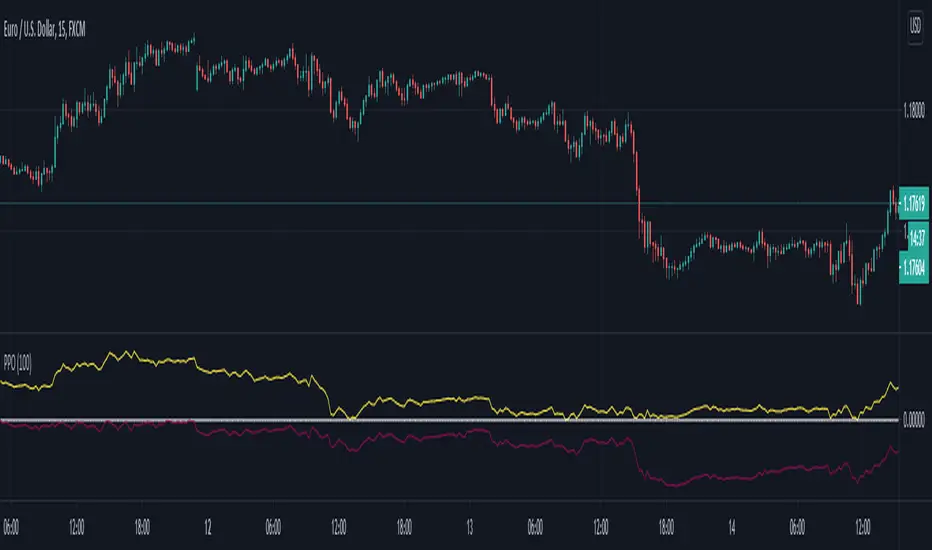
Percentage Oscillator Swing highest high and lowest lowThis is a simple but efficient indicator.
Its made from an oscillator, which is calculated from the current close price with the highest high and the lowest low over a period of time.
This way we can see how much prices has changed over a X ammount of candles ( in positive or negative ) .
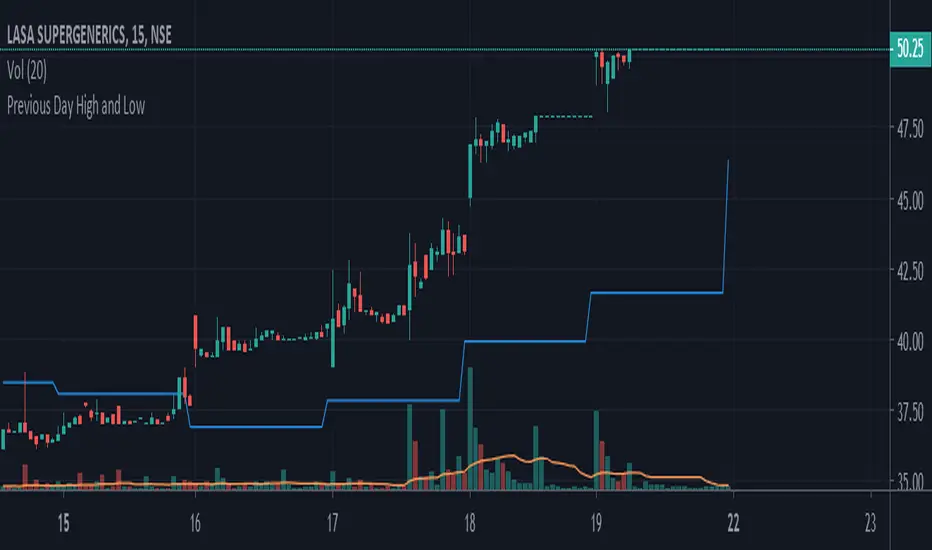
Yesterday's open, high, low and closeA very simple script to plot the yesterday's OHLC, to be used in an intraday graph.
There were other scripts like this, but their code was ugly, filthy, smelly, and WET, so I did this.

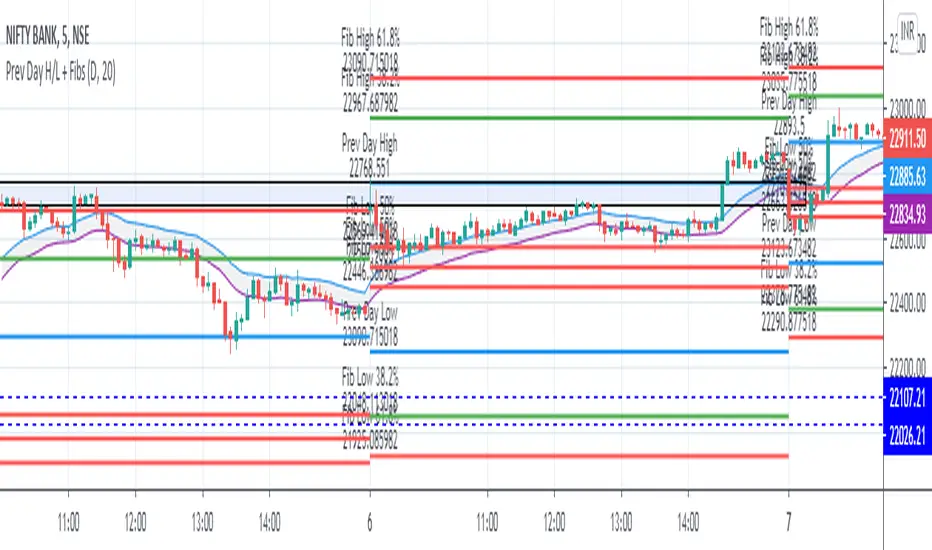
Previous Day High - Low and EMA BandThe fib are plotted to previous day High and low to find next days support and resistance based on fibs.
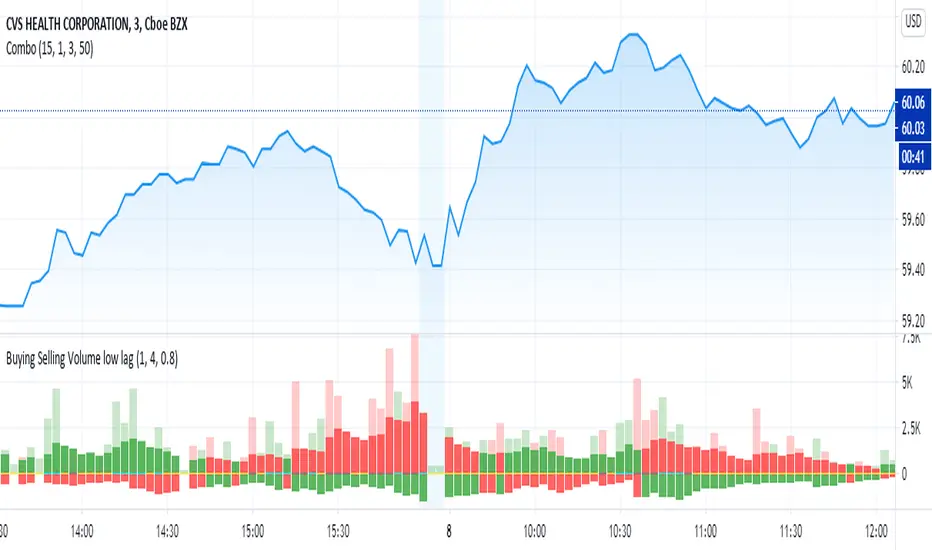
Buying Selling Volume low lagOriginally written by @ceyhun
I added a low lag filter to key components to smooth the bars. The user can adjust the parameters 'fast' and 'slow' to tune.
capam
The original comments of ceyhun are below repeated:
Buying Selling Volume
-Buy Volume
-Sell Volume
-Buy Volume Percent %
-Sell Volume Percent %
-Volume Index
-Buy Sell Volume-
BuyVolume>SellVolume=Blue barcolor
SellVolume>BuyVolume=Purple barcolor
-Volume Index-
VolumeIndex>length and close > open =Cyan barcolor
VolumeIndex>length and close < open =Gray barcolor
VolumeIndex<=length = Yellow barcolor
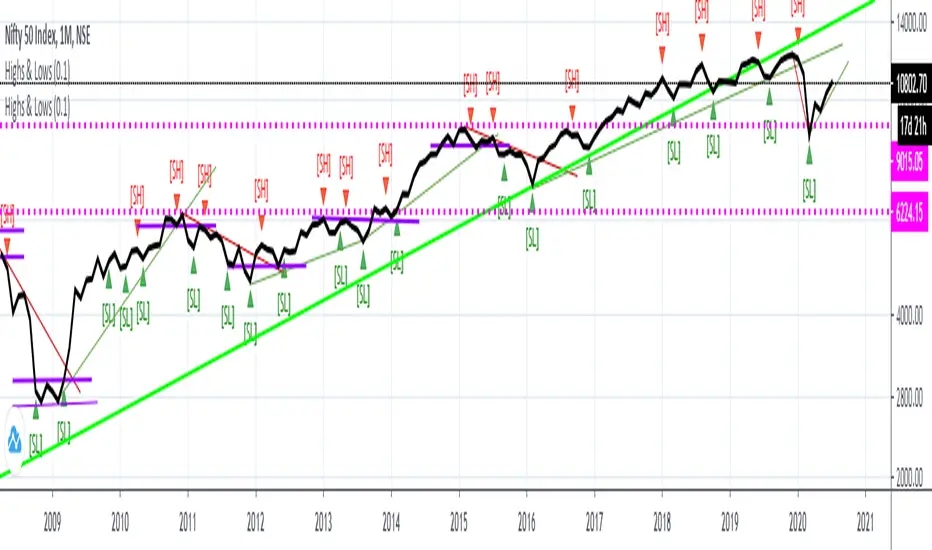
MWD Highs & LowsThis is a minor update and modification to the script by kisshore19: I updated a few pieces to make it v4 compliant (color. and syminfo. prefixes, etc), inserted the passed variables on the functions, and modified a few items per my preference (line style, removed the infinity offset, added transp). Very minor updates, the work is all credit to kisshore19. I wanted to be able to update which previous days/weeks were shown so bringing it up to date with v4 was the idea.

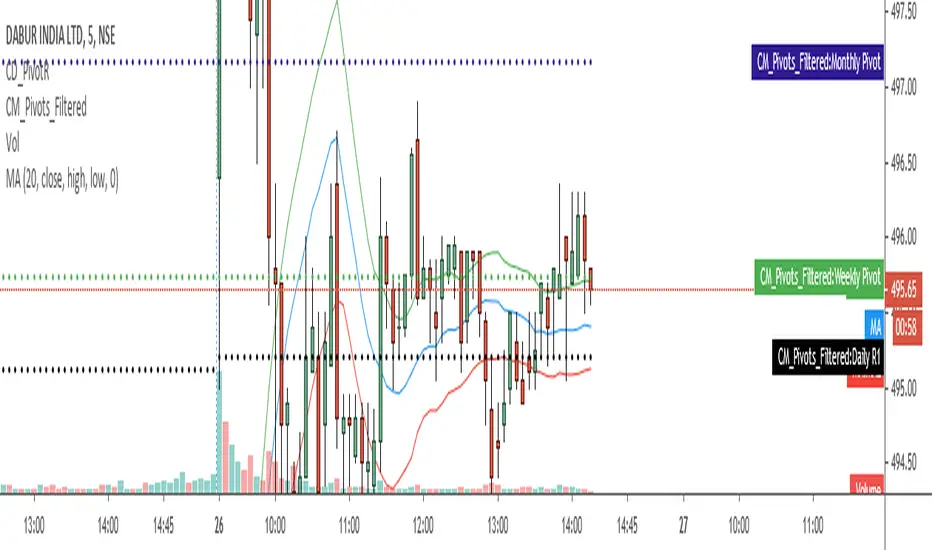
Derivative Pivot HL Points Hello.
This script aims to take into account mutable variable Pivot Points' periods.
While doing this, it takes the period between 2 signals that I use in the script:
And these periods in my Pivot HL function integrated into len length (Mutable variables) :
The cornerstone of the script is these facts.
Pivot can be optimized by playing with reversal periods.
These pre-formed levels can be used as Supply and Demand levels.
Regards.

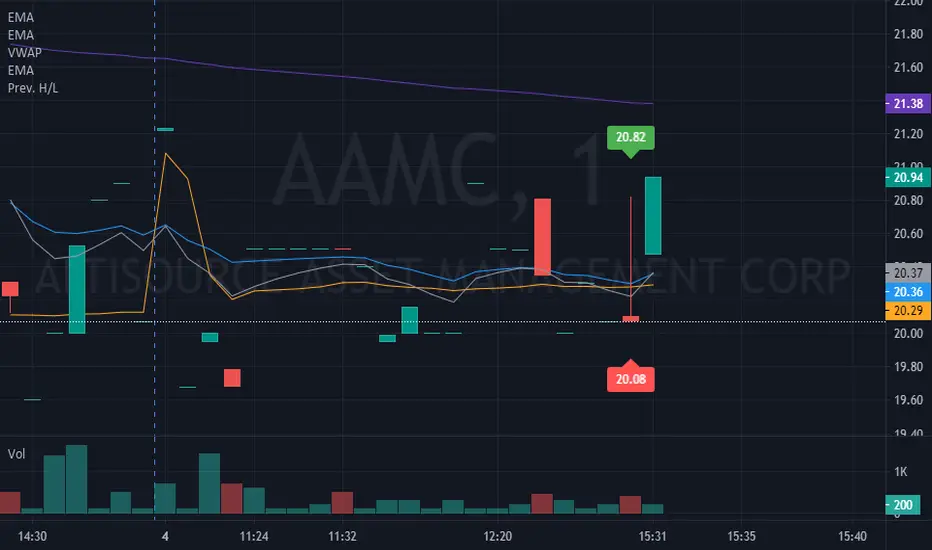
Previous Candle High and LowThis Indicator add's a label over and below the previous candle which show's it's high and low values.
Anas persistence high low mva band using High and low band of moving average , if price persistence to be above the high MVA its strong probability of uptrend started . and the line turn green
and vice versa if for down trend it will turn red .


BBVV Low IndicatorThis is an indicator that flags the lowest Bollinger Bands Width value for a set number of bars back.
This is based on my BBVV script seen here
Each dot on the BBVV indicator marks the rolling "X"-period low in BBVV value. You can set "X" as any number of bars back in the settings of this indicator.
This can be used to accurately predict when periods of high-volatility could come into play due to continually contracting Bollinger Bands on a time-frame that you can set manually.
Created from a request from a user.

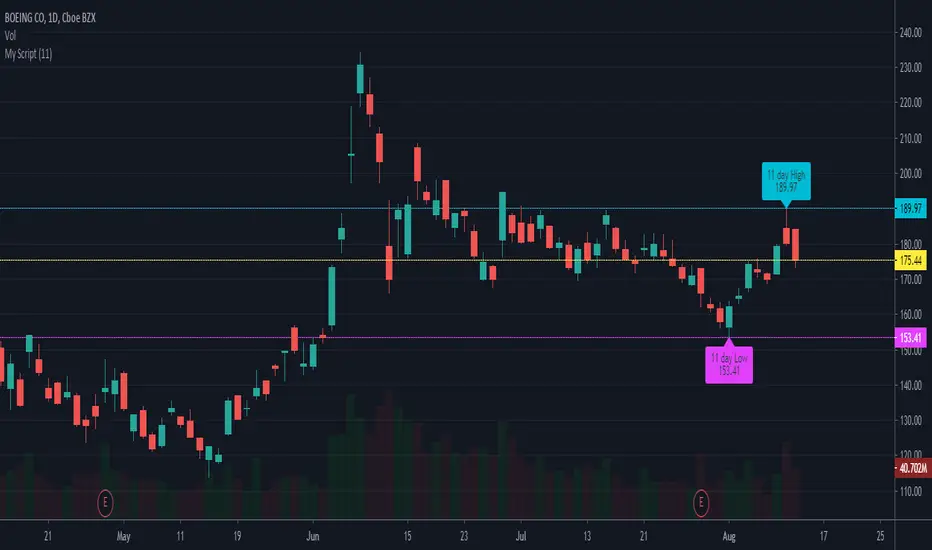

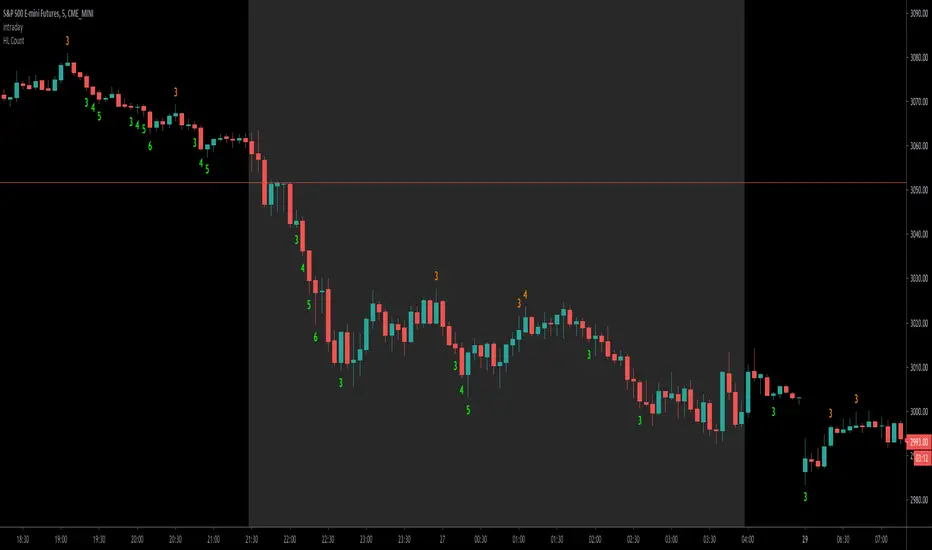
Higher High and Lower Low Bar CountThe importance of counting HH&LL is to find the possible extreme of the current leg and the potential reversal.
This script helps you count the number of bars which are constantly higher or lower than the previous ones.
I set the script to count from the first one, but only display the number from the third, in order to eliminate too much noise.
Note : I have loosened the criteria of HH and LL.
Let's take "higher high" as an example, I will count the number If the current bar's low is higher than the previous one's and its high is higher or equal to the previous one's , and vice versa.
If you prefer the strict definition of HH or LL, you can modify the code as you wish.
EMA of Highs/Lows with 3 day lookback colour change, by CanUK101Forms a key part of a trend following trading system.
Shows a channel formed by 2 EMA lines that use the highs and lows as inputs.
The 3 day look-back changes the colour of the line to denote rising and falling EMA .

High-Low BandsThis is a simple but powerful indicator. It calculates (selectable) moving averages separately from high , low and close .
It can be used as support-resistance, trend or volatility indicator.

Show ATR and 1st hour high+low1. Shows TR at daily bars
2. Shows ATR lines intraday: 100% and 75% (customizable)
3. Shows hint with ATR for current day and percent passed
4. Show high and low of the 1st hour

Major Event Price Indicators (Coronavirus Lows)This very simple script adds a corridor for two low price ranges, where Corona started to hit. Useful to visualize where a stock currently trades at, relative to the Corona / Covid-19 crisis.
Can easily be adjusted for different dates regarding any major events, crashes. Useful when you run out of Alarms and just want to see "is that still below or above where it was before ?".
Add as many dates as you want, just alter the names of each indicator.
Built upon the script of vitvlkv.

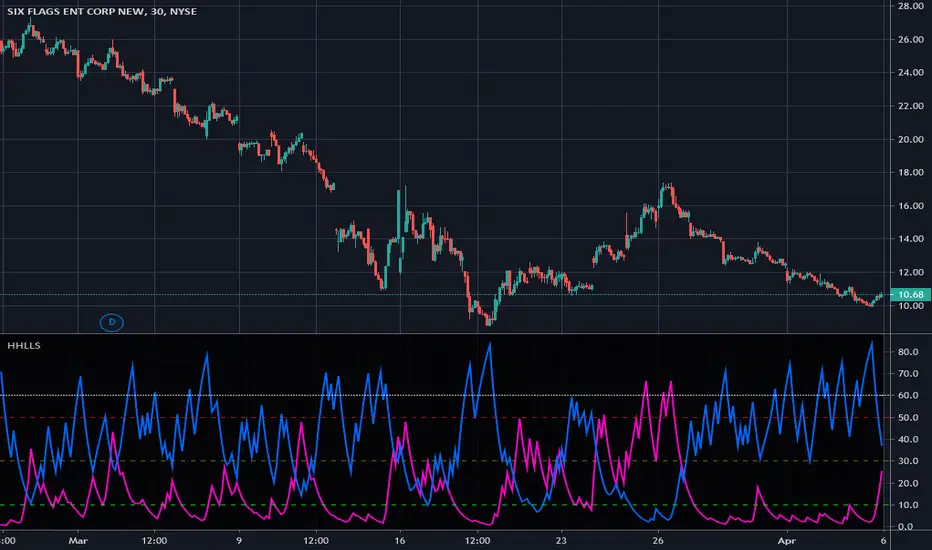
Higher Highs & Lower Lows Stochastics - Vitali ApirineThis is my modified "Higher Highs & Lower Lows Stochastics" employing PSv4.0, originally formulated by Vitali Apirine for TASC - February 2016 Traders Tips. Reading through a TASC magazine of mine, behold, I found a little known indicator that I can't find anywhere on all of Tradingview. That was a tragedy I felt I had to resolve... This indicator is best described as a dual momentum indicator, being helpful with anticipating reversals, spotting emerging trends, and defining correction periods. I felt it worthy of justice to unveil this for all TV members to utilize and also learn from. It's uniqueness is beyond past due for the honor it deserves on Tradingview.
As always, I have included advanced Pine programming techniques that conform to proper "Pine Etiquette". For those of you who are newcomers to Pine Script, this code release may also help you comprehend the "Power of Pine" by employing advanced programming techniques while exhibiting code utilization in a most effective manner. This script's uniqueness displays that we can now override built-in Pine functions. Firstly, you may have noticed that I replaced ema(), sma(), highest(), and lowest(). If you weren't aware of this Pine capability, well, here is a prime example... Now you know! Just heed caution when doing so to ensure your replacement algorithms are 100% sound. Lastly, I also added an additional "Median" line where the companion stochastics seemingly appear to gravitate within a central zone.
NOTICE: You may have observed, there is highest(), lowest(), ema(), and sma() custom functions overwriting Pine built-ins, some of which are audaciously used in ternary. "IF" you are planning to use Pine Script v4.0 functions in ternary, be forewarned, they WILL NOT operate as expected in most scenarios. The reason why I legitimately used them here in ternary is because they are ONLY manually controlled by an input(). If these were dynamically controlled with bar-to-bar dynamic conditional logic, you would most certainly run into serious unexpected programming issues, potentially resulting in hours of frustrations and guaranteed loss of hair. That's my lesson for this release, so never ever forget this when utilizing the full potential of the "Power of Pine". For more information concerning these potential dilemmas, please consult "Execution of Pine functions and historical context inside function blocks" in the "Pine Script v4 User Manual".
Features List Includes:
Dark Background - Easily disabled in indicator Settings->Style for "Light" charts or with Pine commenting
AND much, much more... You have the source!
The comments section below is solely just for commenting and other remarks, ideas, compliments, etc... regarding only this indicator, not others. When available time provides itself, I will consider your inquiries, thoughts, and concepts presented below in the comments section, should you have any questions or comments regarding this indicator. When my indicators achieve more prevalent use by TV members, I may implement more ideas when they present themselves as worthy additions. As always, "Like" it if you simply just like it with a proper thumbs up, and also return to my scripts list occasionally for additional postings. Have a profitable future everyone!