Intelle_city - World Cycle - Ath & Atl - Logarithmic - Strategy.Overview
Indicators: Strategy !
INTELLECT_city - World Cycle - ATH & ATL - Timeframe 1D and 1W - Logarithmic - Strategy - The Pi Cycle Top and Bottom Oscillator is an adaptation of the original Pi Cycle Top chart. It compares the 111-Day Moving Average circle and the 2 * 350-Day Moving Average circle of Bitcoin’s Price. These two moving averages were selected as 350 / 111 = 3.153; An approximation of the important mathematical number Pi.
When the 111-Day Moving Average circle reaches the 2 * 350-Day Moving Average circle, it indicates that the market is becoming overheated. That is because the mid time frame momentum reference of the 111-Day Moving Average has caught up with the long timeframe momentum reference of the 2 * 350-Day Moving Average.
Historically this has occurred within 3 days of the very top of each market cycle.
When the 111 Day Moving Average circle falls back beneath the 2 * 350 Day Moving Average circle, it indicates that the market momentum of that cycle is significantly cooling down. The oscillator drops down into the lower green band shown where the 111 Day Moving Average is moving at a 75% discount relative to the 2 * 350 Day Moving Average.
Historically, this has highlighted broad areas of bear market lows.
IMPORTANT: You need to set a LOGARITHMIC graph. (The function is located at the bottom right of the screen)
IMPORTANT: The INTELLECT_city indicator is made for a buy-sell strategy; there is also a signal indicator from INTELLECT_city
IMPORTANT: The Chart shows all cycles, both buying and selling.
IMPORTANT: Suitable timeframes are 1 daily (recommended) and 1 weekly
-----------------------------
Описание на русском:
-----------------------------
Обзор индикатора
INTELLECT_city - World Cycle - ATH & ATL - Timeframe 1D and 1W - Logarithmic - Strategy - Логарифмический - Сигнал - Осциллятор вершины и основания цикла Пи представляет собой адаптацию оригинального графика вершины цикла Пи. Он сравнивает круг 111-дневной скользящей средней и круг 2 * 350-дневной скользящей средней цены Биткойна. Эти две скользящие средние были выбраны как 350/111 = 3,153; Приближение важного математического числа Пи.
Когда круг 111-дневной скользящей средней достигает круга 2 * 350-дневной скользящей средней, это указывает на то, что рынок перегревается. Это происходит потому, что опорный моментум среднего временного интервала 111-дневной скользящей средней догнал опорный момент импульса длинного таймфрейма 2 * 350-дневной скользящей средней.
Исторически это происходило в течение трех дней после вершины каждого рыночного цикла.
Когда круг 111-дневной скользящей средней опускается ниже круга 2 * 350-дневной скользящей средней, это указывает на то, что рыночный импульс этого цикла значительно снижается. Осциллятор опускается в нижнюю зеленую полосу, показанную там, где 111-дневная скользящая средняя движется со скидкой 75% относительно 2 * 350-дневной скользящей средней.
Исторически это высветило широкие области минимумов медвежьего рынка.
ВАЖНО: Выставлять нужно ЛОГАРИФМИЧЕСКИЙ график. (Находиться функция с правой нижней части экрана)
ВАЖНО: Индикатор INTELLECT_city сделан для стратегии покупок продаж, есть также и сигнальный от INTELLECT_сity
ВАЖНО: На Графике видны все циклы, как на покупку так и на продажу.
ВАЖНО: Подходящие таймфреймы 1 дневной (рекомендовано) и 1 недельный
-----------------------------
Beschreibung - Deutsch
-----------------------------
Indikatorübersicht
INTELLECT_city – Weltzyklus – ATH & ATL – Zeitrahmen 1T und 1W – Logarithmisch – Strategy – Der Pi-Zyklus-Top- und Bottom-Oszillator ist eine Anpassung des ursprünglichen Pi-Zyklus-Top-Diagramms. Er vergleicht den 111-Tage-Gleitenden-Durchschnittskreis und den 2 * 350-Tage-Gleitenden-Durchschnittskreis des Bitcoin-Preises. Diese beiden gleitenden Durchschnitte wurden als 350 / 111 = 3,153 ausgewählt; eine Annäherung an die wichtige mathematische Zahl Pi.
Wenn der 111-Tage-Gleitenden-Durchschnittskreis den 2 * 350-Tage-Gleitenden-Durchschnittskreis erreicht, deutet dies darauf hin, dass der Markt überhitzt. Das liegt daran, dass der Momentum-Referenzwert des 111-Tage-Gleitenden-Durchschnitts im mittleren Zeitrahmen den Momentum-Referenzwert des 2 * 350-Tage-Gleitenden-Durchschnitts im langen Zeitrahmen eingeholt hat.
Historisch gesehen geschah dies innerhalb von 3 Tagen nach dem Höhepunkt jedes Marktzyklus.
Wenn der Kreis des 111-Tage-Durchschnitts wieder unter den Kreis des 2 x 350-Tage-Durchschnitts fällt, deutet dies darauf hin, dass die Marktdynamik dieses Zyklus deutlich nachlässt. Der Oszillator fällt in das untere grüne Band, in dem der 111-Tage-Durchschnitt mit einem Abschlag von 75 % gegenüber dem 2 x 350-Tage-Durchschnitt verläuft.
Historisch hat dies breite Bereiche mit Tiefstständen in der Baisse hervorgehoben.
WICHTIG: Sie müssen ein logarithmisches Diagramm festlegen. (Die Funktion befindet sich unten rechts auf dem Bildschirm)
WICHTIG: Der INTELLECT_city-Indikator ist für eine Kauf-Verkaufs-Strategie konzipiert; es gibt auch einen Signalindikator von INTELLECT_city
WICHTIG: Das Diagramm zeigt alle Zyklen, sowohl Kauf- als auch Verkaufszyklen.
WICHTIG: Geeignete Zeitrahmen sind 1 täglich (empfohlen) und 1 wöchentlich
"momentum"に関するスクリプトを検索

NASDAQ 100 Peak Hours StrategyNASDAQ 100 Peak Hours Trading Strategy
Description
Our NASDAQ 100 Peak Hours Trading Strategy leverages a carefully designed algorithm to trade within specific hours of high market activity, particularly focusing on the first two hours of the trading session from 09:30 AM to 11:30 AM GMT-5. This period is identified for its increased volatility and liquidity, offering numerous trading opportunities.
The strategy incorporates a blend of technical indicators to identify entry and exit points for both long and short positions. These indicators include:
Exponential Moving Averages (EMAs) : A short-term 9-period EMA and a longer-term 21-period EMA to determine the market trend and momentum.
Relative Strength Index (RSI) : A 14-period RSI to gauge the market's momentum.
Average True Range (ATR) : A 14-period ATR to assess market volatility and to set dynamic stop losses and trailing stops.
Volume Weighted Average Price (VWAP) : To identify the market's average price weighted by volume, serving as a benchmark for the trading day.
Our strategy uniquely applies a volatility filter using the ATR, ensuring trades are only executed in conditions that favor our setup. Additionally, we consider the direction of the EMAs to confirm the market's trend before entering trades.
Originality and Usefulness
This strategy stands out by combining these indicators within the NASDAQ 100's peak hours, exploiting the specific market conditions that prevail during these times. The inclusion of a volatility filter and dynamic stop-loss mechanisms based on the ATR provides a robust method for managing risk.
By focusing on the early trading hours, the strategy aims to capture the initial market movements driven by overnight news and the opening rush, often characterized by higher volatility. This approach is particularly useful for traders looking to maximize gains from short-term fluctuations while limiting exposure to longer-term market uncertainty.
Strategy Results
To ensure the strategy's effectiveness and reliability, it has undergone rigorous backtesting over a significant dataset to produce a sample size of more than 100 trades. This testing phase helps in identifying the strategy's potential in various market conditions, its consistency, and its risk-to-reward ratio.
Our backtesting adheres to realistic trading conditions, accounting for slippage and commission to reflect actual trading scenarios accurately. The strategy is designed with a conservative approach to risk management, advising not to risk more than 5-10% of equity on a single trade. The default settings in the script align with these principles, ensuring that users can replicate our tested conditions.
Using the Strategy
The strategy is designed for simplicity and ease of use:
Trade Hours : Focuses on 09:30 AM to 11:30 AM GMT-5, during the NASDAQ 100's peak activity hours.
Entry Conditions : Trades are initiated based on the alignment of EMAs, RSI, VWAP, and the ATR's volatility filter within the designated time frame.
Exit Conditions : Includes dynamic trailing stops based on ATR, a predefined time exit strategy, and a trend reversal exit condition for risk management.
This script is a powerful tool for traders looking to leverage the NASDAQ 100's peak hours, providing a structured approach to navigating the early market hours with a robust set of criteria for making informed trading decisions.

KT Litmus2
Hello everyone,
Recently I saw a very good indicator on TV called Ichimoku Oscillator. This is a K-line convergence and divergence indicator similar to MACD. After backtesting research, this indicator performs well on long-term trends.
Since it is an indicator, it is made into a strategy category. Several optimizations have also been made.
This strategy takes into account the following market factors:
EMA -> Trend
Fast line - slow line -> moving average
EMA Squeeze -> Momentum Conversion, Trend
ATR -> Noise Reduction
How does it compare to the original indicator?
Optimized background display so the canvas doesn't feel cluttered with excessive colors.
Optimized part of the position reduction logic so that too many trading signals will not affect the performance of the strategy.
NOTE: As you can see, there are potential improvements that can be made by merging volumes.
Signal
Input level -> Kinetic energy enhancement, +4 long, -4 short
Partial exit level -> moving average (EMA | fast and slow line) crossing, trend unchanged
All exit levels -> trend conversion
Risk Management
"Trend Stop Loss" and "Momentum Take Profit" are used here.
Trend stop loss: Use the conversion of the strategy trend parameter wave range to close the order.
Momentum take profit: take advantage of the weakening or reverse trend momentum of the strategy to take profit.
As described, the strategy has obvious advantages in trend trading, but in volatile markets, stop loss may be triggered due to frequent signals.
Now, a set of knowledge is provided for the inexperienced reader.
MACD usually consists of three components. The MACD line is the fast exponential moving average (usually taken on the 12th day) minus the slow exponential moving average (usually taken on the 26th day), generally called the difference (DIF). The second line is the signal line, which is the exponential moving average of DIF (usually 9 days), generally called DEA. The last component is the MACD histogram, whose value is the difference between DIF and DEA. However, the time value of the MACD indicator can also be adjusted according to the trader's preference and trading category.
The underlying logic of DIF is that the short-term exponential moving average reflects current price movements, while the long-term EMA reflects earlier price movements. Therefore, if there is a large gap between these two EMAs, then the market is trending up or down. While the MACD histogram is oscillating around the zero line, indicating the strength of the trend.
EMA: Exponential Moving Average; similar to a simple moving average but exponentially weights the input data.
Sincerely,
salute
---
Acknowledgments:
@LonesomeTheBlue
renew
March 14
Strategies for increasing Python version

INFINITY ALGO🆕Meet the updated version of our flagship indicator, now it's INFINITY ALGO!
🏃🏻 QUICK START
In very simple terms, our indicator generates complex trading signals on your chart (buy/sell), including Entry Point, Take Profit levels, Stop Loss level
To start, you need to add our indicator to your chart , choose a timeframe (we recommend 13min,15min and 4h but you can try any, these only have the best results) and set up notifications (how to do it told below) and that's it, you can work with it even without changing the settings!
Of course, to improve the accuracy of signals you will have to choose the optimal settings of the script for each trading pair and timeframe (you can find a guide below)
📊 SIGNALS
This script will generate complex trading recommendations, both Long and Short (signals); signals include:
- Entry Point:
Calculated based on pivot levels with confirmation by EMA/SMA (you can select this in the settings); also bullish/bearish cup is checked to confirm the entry.
Additionally, in the settings you can enable Heiken Ashi calculation mode (it shows much better on some trading pairs).
Why do we mashup these components and how they work together?
- The main indicator in our script is pivot levels, it is enabled by default and cannot be disabled. Auxiliary indicators (which you can switch on and off in the script settings) are EMA/SMA and Heiken Ashi. We have used pivot levels, which mark potential support and resistance zones based on previous price action. We have also used EMA/SMA that smooth out price fluctuations and show the direction of the trend. We have added an option to use Heiken Ashi that filters out noise and highlights the trend. We have also checked for bullish/bearish cup patterns, which are reversal patterns that indicate a change in momentum. By combining these indicators, we have created a more robust entry point that considers multiple factors such as price levels, trend, noise, and momentum.
- 6 Take Profit levels:
It is also possible to change in the settings (It is also possible to change the values for Short or Long positions separately), it will be fixed values in % (The default Take Profits for Long&Short are as follows: TP1-0.3%; TP2-1%; TP3-2%; TP4-3%; TP5-7.5%; TP6-16.5%)
- Stop Loss Level:
As with Take Profits, this is a fixed % value that you can customise to suit your risk management needs (It is also possible to change the values for Short or Long positions separately, by default is 4.5% for Long&Short positions)
*When trading on these signals, we strongly recommend that you exit the position in parts at each take profit or close your entire position at one particular take profit. Our script was designed specifically for exiting a position on take profits
⚙️ SETTINGS
Now let's talk about the settings of this script, which allow you to customise the signals quite a lot. In general, we recommend selecting the settings for each trading pair and timeframe separately, this will allow you to achieve better targets accuracy (the default settings are universal, you can trade with them without changing them if you want)
-> IMAGE <-
1. Period - minimum value of 2. Increasing this parameter will increase the accuracy of signals, but will reduce their number (accordingly, lowering the parameter will do the opposite). For the majority of trading pairs and timeframes the optimal period will be between 5 and 10 (the default value is 5).
2. Maximum Breakout length (in bars) - for most trading pairs you can set the value from 200 to 300 and it will be optimal. Below 200 is not recommended
3. T hreshold Rate % - this value also affects the accuracy and the number of signals - the higher this value is, the more often signals will be generated, but it can negatively affect the accuracy. The minimum value is 3, and the maximum value is 10. We recommend to try values in the range from 4 to 7 for most tickers
4. Minimum Number of tests - the number of level checks is required, we recommend to try 2, and only for some timeframes increase to 3
5. MA type & MA filter - The shorter the length of moving averages, the faster they react to trend changes, and show more local trends than global ones. If the length of MAs is longer, more global trends are shown. By default, the most optimal values are set.
By the way, you can ask us for a ready-made preset for any pair and we will be happy to help you!
📄 BACKTESTING
Now let's talk about how to properly test the settings and evaluate their effectiveness. Our script has a c ustom built-in backtester that shows statistics on the current trading pair and allows you to calculate the accuracy of each take profit target, as well as calculate values such as Gross profit/loss, net profit, and the ratio of initial deposit to profit. (you can enable/disable backtester "statistics" label in main settings)
In the main settings you can change the values for: initial deposit (Deposit $), trade size $ and leverage (by the way, it also affects the display of the label "Peak profit", which is calculated with this leverage)
-> IMAGE <-
Now let's look at the backtester - it shows detailed statistics for each Take Profit level, including: accuracy in % and number of trades; gross profit & loss; net profit in % and $ (based on selected settings); deposit to profit ratio in % and $.
Why did we choose such properties in the backtest for publication?
- Well, as the initial capital we took 5000$ and deposit 3% (150$) of the initial capital in each trade. For the fee was taken the value from the exchange Binance, which is 0.06% per trade (Taker + Maker, for a user without VIP on Binance and without taking into account additional fees such as funding, leverage fees, etc).
- Please also take a look at our inbuilt backtester ( IMAGE ) which counts the accuracy to each Take Profit. Also note that our inbuilt backtester does not take any fees into account. Pay attention to the last field "Deposit with Profit" it shows the value if you would close all positions at a certain target. For example, we can see that the most optimal is TP3 at these settings for this trading pair and timeframe, as the deposit to profit ratio will be +61.2%
- Also the script is more designed for swing and long term trading, so on most trading pairs you will be able to see statistics for 60-90 trades dataset
*disclaimer: please note that past results does not guarantee future performance! The accuracy of take profit targets in our backtester is calculated on past results, keep this in mind please
📥 NOTIFICATIONS
We have provided notifications that will deliver the latest signals to you in a convenient format in TradingView. The notification looks like this: It contains the entry point, Take Profits, Stop Loss, and a bit of advice on risk management. -> IMAGE <-
To set up notifications:
1. Select the script settings, trading pair and timeframe
2. Click "add alert on InfinityAlgo", then select "alert () function calls only" in the settings
-> IMAGE <-
3. That's it, now all that's left is to wait for a fresh alert
🔑 HOW TO GET ACCESS
We hope you will like this script :) We are always ready to help you with customisation, just let us know! To learn more about our scripts & get access - check out the “Author’s instructions” below 👇🏼

Dual-Supertrend with MACD - Strategy [presentTrading]## Introduction and How it is Different
The Dual-Supertrend with MACD strategy offers an amalgamation of two trend-following indicators (Supertrend 1 & 2) with a momentum oscillator (MACD). It aims to provide a cohesive and systematic approach to trading, eliminating the need for discretionary decision-making.
Key advantages over traditional single-indicator strategies:
- Dual Supertrend Validation: Utilizes two Supertrend indicators with different ATR periods and factors to confirm the trend direction. This double-check mechanism minimizes false signals.
- Momentum Confirmation: The MACD histogram acts as a momentum filter, confirming entries and exits, thus adding an extra layer of validation.
- Objective Entry and Exit: The strategy generates buy and sell signals based on a combination of trend direction and momentum, leaving no room for subjective interpretation.
- Automated Trade Management: The strategy includes built-in settings for commission, slippage, and initial capital, automating the trade execution process.
- Adaptability: The strategy allows for easy customization of all its parameters, adapting to a trader's specific needs and varying market conditions.
BTCUSD 8hr chart Long Condition
BTCUSD 6hr chart Long Short Condition
## Strategy, How it Works
The strategy operates on a set of clearly defined rules, primarily focusing on the trend direction confirmed by the Dual-Supertrend and the momentum as indicated by the MACD histogram.
### Entry Rules
- Long Entry: When both Supertrend indicators are bullish and the MACD histogram is above zero.
- Short Entry: When both Supertrend indicators are bearish and the MACD histogram is below zero.
### Exit Rules
- Exit long positions when either of the Supertrends turn bearish or the MACD histogram drops below zero.
- Exit short positions when either of the Supertrends turn bullish or the MACD histogram rises above zero.
### Trade Management
- The strategy uses a fixed commission rate and slippage in its calculations.
- Automated risk management features are integrated to avoid overexposure.
## Trade Direction
The strategy allows for trading in both bullish and bearish markets. Users can select their preferred trading direction ("long", "short", or "both") to align with their market outlook and trading objectives.
## Usage
- The strategy is best applied on timeframes where the trend is evident.
- Users can modify the ATR periods, factors for Supertrends, and MACD settings to suit their trading needs.
## Default Settings
- ATR Period for Supertrend 1: 10
- Factor for Supertrend 1: 3.0
- ATR Period for Supertrend 2: 20
- Factor for Supertrend 2: 5.0
- MACD Fast Length: 12
- MACD Slow Length: 26
- MACD Signal Smoothing: 9
- Commission: 0.1%
- Slippage: 1 point
- Trading Direction: Both
The strategy comes with these default settings to offer a balanced trading approach but can be customized according to individual trading preferences.

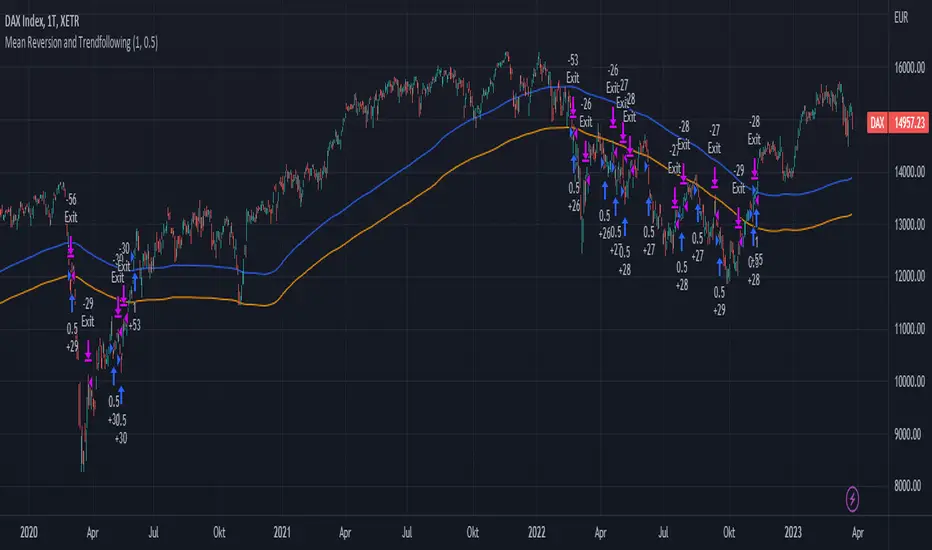
Mean Reversion and TrendfollowingTitle: Mean Reversion and Trendfollowing
Introduction:
This script presents a hybrid trading strategy that combines mean reversion and trend following techniques. The strategy aims to capitalize on short-term price corrections during a downtrend (mean reversion) as well as ride the momentum of a trending market (trend following). It uses a 200-period Simple Moving Average (SMA) and a 2-period Relative Strength Index (RSI) to generate buy and sell signals.
Key Features:
Combines mean reversion and trend following techniques
Utilizes 200-period SMA and 2-period RSI
Customizable starting date
Allows for enabling/disabling mean reversion or trend following modes
Adjustable position sizing for trend following and mean reversion
Script Description:
The script implements a trading strategy that combines mean reversion and trend following techniques. Users can enable or disable either of these techniques through the input options. The strategy uses a 200-period Simple Moving Average (SMA) and a 2-period Relative Strength Index (RSI) to generate buy and sell signals.
The mean reversion mode is active when the price is below the SMA200, while the trend following mode is active when the price is above the SMA200. The script generates buy signals when the RSI is below 20 (oversold) in mean reversion mode or when the price is above the SMA200 in trend following mode. The script generates sell signals when the RSI is above 80 (overbought) in mean reversion mode or when the price falls below 95% of the SMA200 in trend following mode.
Users can adjust the position sizing for both trend following and mean reversion modes using the input options.
To use this script on TradingView, follow these steps:
Open TradingView and load your preferred chart.
Click on the 'Pine Editor' tab located at the bottom of the screen.
Paste the provided script into the Pine Editor.
Click 'Add to Chart' to apply the strategy to your chart.
Please note that the past performance of any trading system or methodology is not necessarily indicative of future results. Always use proper risk management and consult a financial advisor before making any investment decisions.
------
The following is a summary of the underlying whitepaper (onlinelibrary.wiley.com) for this strategy:
This paper proposes a theory of securities market under- and overreactions based on two psychological biases: investor overconfidence about the precision of private information and biased self-attribution, which causes asymmetric shifts in investors' confidence as a function of their investment outcomes. The authors show that overconfidence implies negative long-lag autocorrelations, excess volatility, and public-event-based return predictability. Biased self-attribution adds positive short-lag autocorrelations (momentum), short-run earnings "drift," and negative correlation between future returns and long-term past stock market and accounting performance.
The paper explains that there is empirical evidence challenging the traditional view that securities are rationally priced to reflect all publicly available information. Some of these anomalies include event-based return predictability, short-term momentum, long-term reversal, high volatility of asset prices relative to fundamentals, and short-run post-earnings announcement stock price "drift."
The authors argue that investor overconfidence can lead to stock prices overreacting to private information signals and underreacting to public signals. This overreaction-correction pattern is consistent with long-run negative autocorrelation in stock returns, excess volatility, and further implications for volatility conditional on the type of signal. The market's tendency to over- or underreact to different types of information allows the authors to address the pattern that average announcement date returns in virtually all event studies are of the same sign as the average post-event abnormal returns.
Biased self-attribution implies short-run momentum and long-term reversals in security prices. The dynamic analysis based on biased self-attribution can also lead to a lag-dependent response to corporate events. Cash flow or earnings surprises at first tend to reinforce confidence, causing a same-direction average stock price trend. Later reversal of overreaction can lead to an opposing stock price trend.
The paper concludes by summarizing the findings, relating the analysis to the literature on exogenous noise trading, and discussing issues related to the survival of overconfident traders in financial markets.
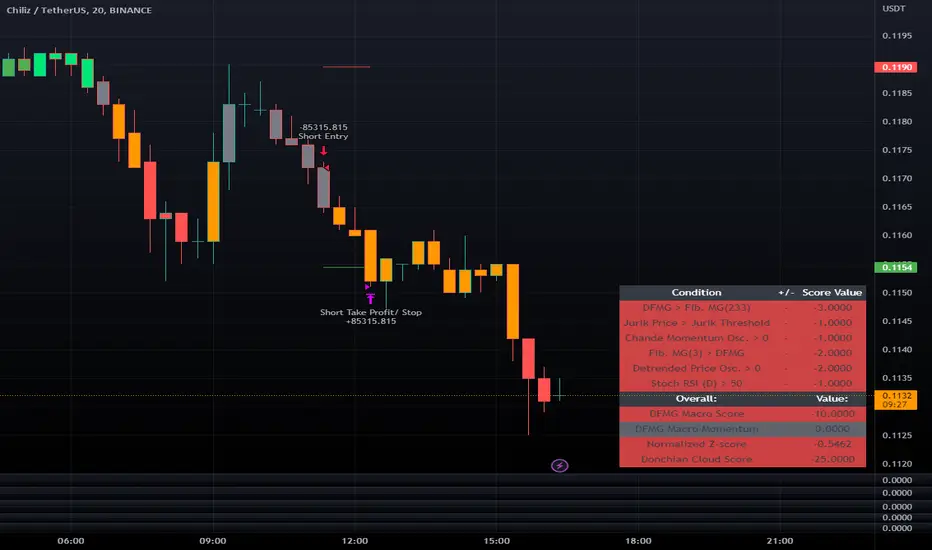
LeafAlgo Premium Macro StrategiesA "macro score", as defined here, is created by giving various weights to different signals and adding them together to get one smooth score. Positive or negative values are assigned to each of the signals depending on if the statement is true or false (e.g. DPO > 0: +1, DPO < 0: -1). This manner of strategy allows for a subset of the available signals to be present at one time as opposed to every technical signal having to be active in order for a long/short signal to trigger.
This strategy contains SIX different macro score strategies -- "Base DFMA", "Base DFMG", "Ichimoku", "TSI", "Donchian DFMA", and "Donchian DFMG". These strategies have the signals and weights pre-determined in the code. The "Base DFMA" strategy is based on our Democratic Fibonacci Moving Average (DFMA) indicator; the "Donchian DFMA" is the same as the base DFMA strategy, but with a signal from our Donchian Cloud Score indicator as added confluence. The "Base DFMG" strategy is based on our Democratic Fibonacci McGinley Dynamics (DFMG) indicator; the "Donchian DFMG" is the same, but with the Donchian Cloud Score as added confluence. The "Ichimoku" strategy is based on the major sub-indicators found within an Ichimoku Cloud in addition to our Donchian Cloud Score. The "TSI" strategy is based on the True Strength Index.
The ability to select your strategy of choice can be found at the top of the strategy settings under "Strategy Options", then in the drop-down menu labeled "Strategy Choice".
The DFMA - Democratic Fibonacci Moving Average - is a separate indicator that we have released that takes 10 different Fibonacci MAs (lengths of 3 to 233, at Fibonacci intervals) and averages them to form the DFMA line. This helps by creating a consensus on the trend based on moving averages alone. Crossovers of the DFMA with the various Fib MA lengths as well as a cross of the price source and these lines can provide adequate long and short signals. In the two DFMA strategies, the heaviest weights have been given to crosses of the DFMA line/Fib MA (233) as well as the crosses of the Fib MA (3)/DFMA. Additionally, there are thresholds for DPO ( Detrended Price Oscillator , above or below 0), CMO ( Chande Momentum Oscillator , above or below 0), Jurik Volatility Bands (above or below 0), and Stoch RSI (above or below 50). These four signals hold a lighter weight than the MA cross signals. The macro score itself ranges between -10 and 10. In addition to the macro score line, a momentum line (sourced by the macro score itself) has been included. A crossover/crossunder of the macro score and the macro momentum line is included into the long/short signal syntax in addition to a threshold for the macro score.
The DFMG - Democratic Fibonacci McGinley Dynamics - is a separate indicator that we have released that takes 10 different Fibonacci McGinley Dynamic liness (lengths of 3 to 233, at Fibonacci intervals) and averages them to form the DFMG line. This helps by creating a consensus on the trend based on moving averages alone. Crossovers of the DFMG with the various Fib MG lengths as well as a cross of the price source and these lines can provide adequate long and short signals. This strategy has the signals and weights pre-determined in the code. Heaviest weights have been given to crosses of the DFMG line/ McGinley (233) as well as the crosses of the McGinley (3)/DFMG. Additionally, there are thresholds for DPO ( Detrended Price Oscillator , above or below 0), CMO ( Chande Momentum Oscillator , above or below 0), Jurik Volatility Bands (above or below 0), and Stoch RSI (above or below 50). These four signals hold a lighter weight than the McGinley cross signals. The macro score itself ranges between -10 and 10. In addition to the macro score line, a momentum line (sourced by the macro score itself) has been included. A crossover/crossunder of the macro score and the macro momentum line is included into the long/short signal syntax in addition to a threshold for the macro score.
For the Ichimoku macro score, five signals were considered and weighted equally:
- Kijun-sen < Ichimoku Source
- Tenkan-sen < Ichimoku Source
- Kijun-sen > Chikou-span
- Tenkan-sen > Kijun-sen
- Senkou Span A > Senkou Span B
In addition to these factors, the Ichimoku strategy utilizes the Donchian Cloud Score in the long and short entry signals. Thus, the Donchian Cloud settings are applicable to this strategy.
For the True Strength Index strategy, the heaviest weights have been given to various TSI signals, including a crossover/crossunder of TSI signal and TSI value, a threshold for the TSI Signal (above or below 0), and a crossover/crossunder of the CMO ( Chande Momentum Oscillator ) and the TSI signal line. Additionally, there are thresholds for DPO ( Detrended Price Oscillator , above or below 0), Jurik Volatility Bands (above or below 0), and Stoch RSI (above or below 50). These three signals hold a lighter weight than the three TSI signals. The macro score itself ranges between -10 and 10. In addition to the macro score line, a momentum line (sourced by the macro score itself) has been included. A crossover/crossunder of the macro score and the macro momentum line is included into the long/short signal syntax in addition to a threshold for the macro score.
The Donchian Cloud Score is derived from a set of 5 Donchian channels (upper, lower, and basis plotted) defaulted to lengths of 25, 50, 100, 150, and 200. A set of conditions associated with the channels aims to determine ranging versus trending markets. Weights are given to these conditions accordingly, then tallied up to determine the "cloud score", ranging between -25 and 25. In general, a ranging market is determined by a cloud score between -10 and 10, while a positive trending market has a score higher than 10 and a negative trending market has a score lower than -10. That said, long and short thresholds similar to the macro score itself are included in the user settings and set to a default of 5 or -5. The cloud score is plotted as a line in the underlay with coloration reflecting ranging or trending markets (green color above the long threshold, gray between the thresholds, and red below the short threshold). The cloud score is incorporated into the strategy syntax for long and short positions in that the score must be above or below the set threshold for a trade to be placed. A breakdown for the Donchian scoring is as follows:
- Broke the 25-length DC (DC(25)) upper band in the previous 3 bars - +1 if true, 0 if false
- Broke the DC(50) upper band in the previous 3 bars - +2 if true, 0 if false
- Broke the DC(100) upper band in the previous 3 bars - +3 if true, 0 if false
- Broke the DC(150) upper band in the previous 3 bars - +4 if true, 0 if false
- Broke the DC(200) upper band in the previous 3 bars - +5 if true, 0 if false
- Broke the DC(25) lower band in the previous 3 bars - -1 if true, 0 if false
- Broke the DC(50) lower band in the previous 3 bars - -2 if true, 0 if false
- Broke the DC(100) lower band in the previous 3 bars - -3 if true, 0 if false
- Broke the DC(150) lower band in the previous 3 bars - -4 if true, 0 if false
- Broke the DC(200) lower band in the previous 3 bars - -5 if true, 0 if false
- DC(25) basis line above the DC(50) basis line - +1 if true, -1 if false
- DC(25) basis line above the DC(100) basis line - +1 if true, -1 if false
- DC(25)basis line above the DC(150) basis line - +1 if true, -1 if false
- DC(25) basis line above the DC(200) basis line - +1 if true, -1 if false
- DC(50) basis line above the DC(100) basis line - +1 if true, -1 if false
- DC(50) basis line above the DC(150) basis line - +1 if true, -1 if false
- DC(50) basis line above the DC(200) basis line - +1 if true, -1 if false
- DC(100) basis line above the DC(150) basis line - +1 if true, -1 if false
- DC(100) basis line above the DC(200) basis line - +1 if true, -1 if false
- DC(150) basis line above the DC(200) basis line - +1 if true, -1 if false
Thresholds for both the respective macro score and the Donchian Cloud score have been included. Entry signals for each strategy require the score to be >= the respective thresholds for longs and <= the respective thresholds for shorts.
Additionally, a normalized z-score has been included. The z-score does not affect the entry and exit signals, however, it is displayed on the chart in the form of bar coloration. The z-score has been normalized to a range of -1 to +1. A z-score under -0.60 is displayed as a red bar color, a score between -0.60 and -0.2 is displayed as an orange bar color, a score between -0.2 and 0.2 is displayed as a gray bar color, a score between 0.2 and 0.6 is displayed as a lime bar color, and a score over 0.6 is displayed in green.
Data for each respective strategy will be displayed in an overlaid table. This includes the factors that comprise the macro score of choice, the values of each signal that adds up to the macro score, the macro score itself, the value of the momentum line of the macro score, the normalized z-score value, and the Donchian Cloud score (if applicable). Green coloration notes bullish sentiment within the signals or values, gray coloration is neutral, and red coloration notes bearish sentiment.
Take profit, stop loss, and trailing percentages are also included, found at the bottom of the Input tab under “TT and TTP” as well as “Stop Loss”. The take profit and stop loss levels will be reflected as green and red lines respectively on the chart as they occur. Make sure to understand the TP/SL ratio that you desire before use, as the desired hit rate/profitability percentage will be affected accordingly. The option for adding in a trailing stop has also been included, with options to choose between an ATR-based trail or a percentage-based trail. This strategy does NOT guarantee future returns. Apply caution in trading regardless of discretionary or algorithmic. Understand the concepts of risk/reward and the intricacies of each strategy choice before utilizing them in your personal trading.
Profitview/Pineconnector Settings:
If you wish to utilize Profitview’s automation system, find the included “Profitview Settings” under the Input tab of the strategy settings menu. If not, skip this section entirely as it can be left blank. Options will be “OPEN LONG TITLE”, “OPEN SHORT TITLE”, “CLOSE LONG TITLE”, and “CLOSE SHORT TITLE”. If you wished to trade SOL, for example, you would put “SOL LONG”, “SOL SHORT”, “SOL CLOSE LONG”, and “SOL CLOSE SHORT” in these areas. Within your Profitview extension, ensure that your Alerts all match these titles. To set an alert for use with Profitview, go to the “Alerts” tab in TradingView, then create an alert. Make sure that your desired asset and timeframe are currently displayed on your screen when creating the alert. Under the “Condition” option of the alert, select the strategy, then select the expiration time. If using TradingView Premium, this can be open-ended. Otherwise, select your desired expiration time and date. This can be updated whenever desired to ensure the strategy does not expire. Under “Alert actions”, nothing necessarily needs to be selected unless so desired. Leave the “Alert name” option empty. For the “Message”, delete the generated message and replace it with {{strategy.order.alert_message}} and nothing else. If using Pineconnector, follow the same directions for setting up an alert, but use the ",buy,,risk=" syntax as noted in the tooltips.
Investments/swing trading strategy for different assetsStop worrying about catching the lowest price, it's almost impossible!: with this trend-following strategy and protection from bearish phases, you will know how to enter the market properly to obtain benefits in the long term.
Backtesting context: 1899-11-01 to 2023-02-16 of SPX by Tvc. Commissions: 0.05% for each entry, 0.05% for each exit. Risk per trade: 2.5% of the total account
For this strategy, 5 indicators are used:
One Ema of 200 periods
Atr Stop loss indicator from Gatherio
Squeeze momentum indicator from LazyBear
Moving average convergence/divergence or Macd
Relative strength index or Rsi
Trade conditions:
There are three type of entries, one of them depends if we want to trade against a bearish trend or not.
---If we keep Against trend option deactivated, the rules for two type of entries are:---
First type of entry:
With the next rules, we will be able to entry in a pull back situation:
Squeeze momentum is under 0 line (red)
Close is above 200 Ema and close is higher than the past close
Histogram from macd is under 0 line and is higher than the past one
Once these rules are met, we enter into a buy position. Stop loss will be determined by atr stop loss (white point) and break even(blue point) by a risk/reward ratio of 1:1.
For closing this position: Squeeze momentum crosses over 0 and, until squeeze momentum crosses under 0, we close the position. Otherwise, we would have closed the position due to break even or stop loss.
Second type of entry:
With the next rules, we will not lose a possible bullish movement:
Close is above 200 Ema
Squeeze momentum crosses under 0 line
Once these rules are met, we enter into a buy position. Stop loss will be determined by atr stop loss (white point) and break even(blue point) by a risk/reward ratio of 1:1.
Like in the past type of entry, for closing this position: Squeeze momentum crosses over 0 and, until squeeze momentum crosses under 0, we close the position. Otherwise, we would have closed the position due to break even or stop loss.
---If we keep Against trend option activated, the rules are the same as the ones above, but with one more type of entry. This is more useful in weekly timeframes, but could also be used in daily time frame:---
Third type of entry:
Close is under 200 Ema
Squeeze momentum crosses under 0 line
Once these rules are met, we enter into a buy position. Stop loss will be determined by atr stop loss (white point) and break even(blue point) by a risk/reward ratio of 1:1.
Like in the past type of entries, for closing this position: Squeeze momentum crosses over 0 and, until squeeze momentum crosses under 0, we close the position. Otherwise, we would have closed the position due to break even or stop loss.
Risk management
For calculating the amount of the position you will use just a small percent of your initial capital for the strategy and you will use the atr stop loss for this.
Example: You have 1000 usd and you just want to risk 2,5% of your account, there is a buy signal at price of 4,000 usd. The stop loss price from atr stop loss is 3,900. You calculate the distance in percent between 4,000 and 3,900. In this case, that distance would be of 2.50%. Then, you calculate your position by this way: (initial or current capital * risk per trade of your account) / (stop loss distance).
Using these values on the formula: (1000*2,5%)/(2,5%) = 1000usd. It means, you have to use 1000 usd for risking 2.5% of your account.
We will use this risk management for applying compound interest.
In settings, with position amount calculator, you can enter the amount in usd of your account and the amount in percentage for risking per trade of the account. You will see this value in green color in the upper left corner that shows the amount in usd to use for risking the specific percentage of your account.
Script functions
Inside of settings, you will find some utilities for display atr stop loss, break evens, positions, signals, indicators, etc.
You will find the settings for risk management at the end of the script if you want to change something. But rebember, do not change values from indicators, the idea is to not over optimize the strategy.
If you want to change the initial capital for backtest the strategy, go to properties, and also enter the commisions of your exchange and slippage for more realistic results.
If you activate break even using rsi, when rsi crosses under overbought zone break even will be activated. This can work in some assets.
---Important: In risk managment you can find an option called "Use leverage ?", activate this if you want to backtest using leverage, which means that in case of not having enough money for risking the % determined by you of your account using your initial capital, you will use leverage for using the enough amount for risking that % of your acount in a buy position. Otherwise, the amount will be limited by your initial/current capital---
Some things to consider
USE UNDER YOUR OWN RISK. PAST RESULTS DO NOT REPRESENT THE FUTURE.
DEPENDING OF % ACCOUNT RISK PER TRADE, YOU COULD REQUIRE LEVERAGE FOR OPEN SOME POSITIONS, SO PLEASE, BE CAREFULL AND USE CORRECTLY THE RISK MANAGEMENT
Do not forget to change commissions and other parameters related with back testing results!
Some assets and timeframes where the strategy has also worked:
BTCUSD : 4H, 1D, W
SPX (US500) : 4H, 1D, W
GOLD : 1D, W
SILVER : 1D, W
ETHUSD : 4H, 1D
DXY : 1D
AAPL : 4H, 1D, W
AMZN : 4H, 1D, W
META : 4H, 1D, W
(and others stocks)
BANKNIFTY : 4H, 1D, W
DAX : 1D, W
RUT : 1D, W
HSI : 1D, W
NI225 : 1D, W
USDCOP : 1D, W

Macro Score -- User-Customized Scores and SignalsA "macro score", as defined here, is created by giving various weights to different signals and adding them together to get one smooth score. Positive or negative values are assigned to each of the signals depending on if the statement is true or false (e.g. DPO > 0: +1, DPO < 0: -1). This manner of strategy allows for a subset of the available signals to be present at one time as opposed to every technical signal having to be active in order for a long/short signal to trigger. This particular strategy allows the user to choose between 18 different signals to be used in scoring as well as allowing the user to determine the individual weights of each score as well as the overall threshold to determine long or short signals. Weights for each score range between 1 and 5, with 5 being the greatest weight. The overall threshold for long or short is dependent on the total possible weights added together (i.e. if your weights total -10 or +10, a threshold within this range must be used).
The macro score itself is printed in an underlay as a white line that goes between the maximum positive and negative values for all weights added together for this strategy. In addition to the macro score line, a green momentum line (sourced by the macro score itself) has been included. A crossover/crossunder of the macro score and the macro momentum line is included into the long/short signal syntax in addition to a threshold for the macro score. The length of the Macro Score's momentum line can be found in the settings.
The current signals to choose from include:
- ADX Threshold - if the Average Directional Index is above a set threshold, signal positive or negative
- CMF Threshold - if the Chaikin Money Flow oscillator is above 0, signal positive; otherwise, signal negative
- CMO > TSI Signal - signal positive if there is a cross of the Chande Momentum Oscillator and the True Strength Index signal line
- CMO Threshold - if the Chande Momentum Oscillator is above 0, signal positive; otherwise, signal negative
- DPO Threshold - if the Detrended Price Oscillator is above 0, signal positive; otherwise, signal negative
- EOM Threshold - if the Ease of Money Oscillator is above 0, signal positive; otherwise, signal negative
- Jurik Threshold - if the Jurik price line (from the Jurik Volatility Bands) is above 0, signal positive; otherwise, signal negative
- MACD Threshold - if the MACD signal line is above 0, signal positive; otherwise, signal negative
- McGinley Cross - a crossover of a fast McGinley Dynamic length line and a slow McGinley Dynamic line signals positive; otherwise, signal negative
- PSAR - if the direction of the PSAR is heading long, signal positive; otherwise, signal negative
- ROC Threshold - if the Rate of Change oscillator is above 0, signal positive; otherwise, signal negative
- RSI Threshold - if the Relative Strength Index is above 50, signal positive; otherwise, signal negative
- Stoch RSI Threshold - if the Stoch RSI is above 50, signal positive; otherwise, signal negative
- Supertrend - if the Supertrend determines long, signal positive; otherwise, signal negative
- TSI Cross - a crossover of the True Strength Index value line and the TSI signal line signals positive; otherwise, signal negative
- TSI Signal Threshold - if the TSI signal line is above 0, signal positive; otherwise, signal negative
- Williams Alligator Cross - if the Williams Alligator lips cross the teeth and jaw, signal positive; otherwise, signal negative
- Williams %R - if the Williams %R is above -50, signal positive; otherwise, signal negative
Take profit, stop loss, and trailing percentages are also included, found at the bottom of the Input tab under “TT and TTP” as well as “Stop Loss”. Make sure to understand the TP/SL ratio that you desire before use, as the desired hit rate/profitability percentage will be affected accordingly. This strategy does NOT guarantee future returns. Apply caution in trading regardless of discretionary or algorithmic. Understand the concepts of risk/reward and the intricacies of each strategy choice before utilizing them in your personal trading.
Profitview Settings:
If you wish to utilize Profitview’s automation system, find the included “Profitview Settings” under the Input tab of the strategy settings menu. If not, skip this section entirely as it can be left blank. Options will be “OPEN LONG TITLE”, “OPEN SHORT TITLE”, “CLOSE LONG TITLE”, and “CLOSE SHORT TITLE”. If you wished to trade SOL, for example, you would put “SOL LONG”, “SOL SHORT”, “SOL CLOSE LONG”, and “SOL CLOSE SHORT” in these areas. Within your Profitview extension, ensure that your Alerts all match these titles. To set an alert for use with Profitview, go to the “Alerts” tab in TradingView, then create an alert. Make sure that your desired asset and timeframe are currently displayed on your screen when creating the alert. Under the “Condition” option of the alert, select the strategy, then select the expiration time. If using TradingView Premium, this can be open-ended. Otherwise, select your desired expiration time and date. This can be updated whenever desired to ensure the strategy does not expire. Under “Alert actions”, nothing necessarily needs to be selected unless so desired. Leave the “Alert name” option empty. For the “Message”, delete the generated message and replace it with {{strategy.order.alert_message}} and nothing else.
Sample setup for SOLUSDT 30M:
- Score 1 - Value 4, PSAR (0.05 start, 0.02 increment, 0.2 max value; sourced open)
- Score 2 - Value 4, Jurik Threshold (JVB Length 25, JVB Smoothing 6, JVB Price Threshold 0)
- Score 3 - Value 5, DPO Threshold (DPO Length 40, uncentered)
- Score 4 - Value 5, CMO Threshold (CMO Length 40, sourced open)
- Score 5 - Value 2, MACD Threshold (Fast Length 12, Slow Length 30, sourced open)
- Macro Length 21
- Long Threshold - -3
- Short Threshold - +3
- Take Profit % - 0.9/0.9
- Trail % - 0.005
- Stop Loss % - 1.4
Sample setup for AVAXUSDT 20M:
- Score 1 - Value 3, TSI Cross (Long Length 25, Short Length 16, Signal Length 17)
- Score 2 - Value 2, TSI Signal Threshold (same settings as the TSI Cross)
- Score 3 - Value 2, Jurik Threshold (JVB Length 20, JVB Smoothing 8, JVB Price Threshold 0)
- Score 4 - Value 2, DPO Threshold (DPO Length 40, uncentered)
- Score 5 - Value 1, Stoch Threshold (K/D 3, RSI (Stoch) Length 10, Stochastic Length 4, sourced open)
- Macro Length 13
- Long Threshold - +5
- Short Threshold - -5
- Take Profit % - 1.2/1.2
- Trail % - 0.005
- Stop Loss % - 1.5

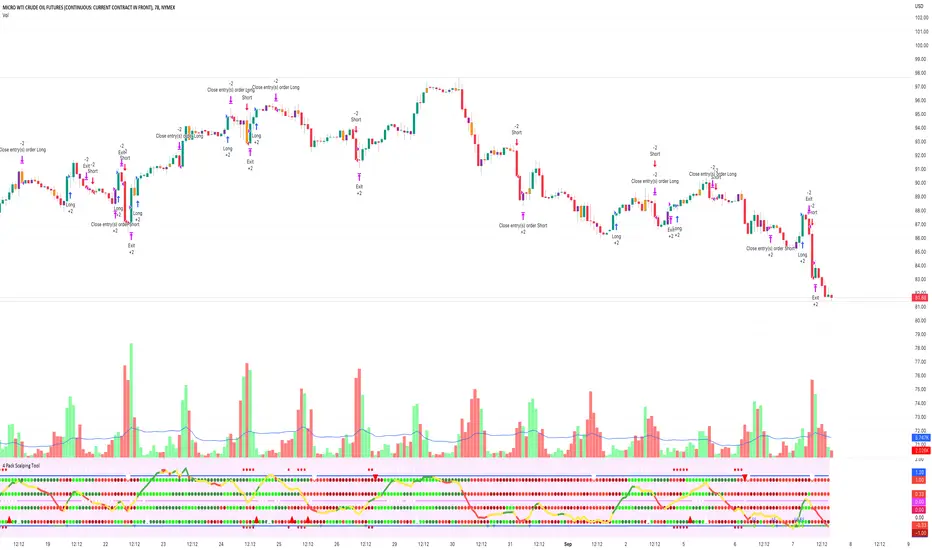
4 Pack Scalping ToolThe 4 Squeeze Scalp tool is a tool that I have developed over the past few years. I was always fascinated by the fact that most people don’t know where price is heading. While Fibonacci and other linear type methods work it never gelled with me. I started by going deep into the fundamentals of momentum with an understanding that an object in motion heading in a particular direction tends to stay heading in that direction (until something derails it). Price, in my opinion, is no different.
Price can move up, down and sideways. And it moves in a wave, getting stronger over time until eventually pulling back and starting over again. In my mind, the compression of price and the relationship of that pressure to various lengths of time as well as RSI, ADX and DMI across these same time frames gives you a view on how the underlying price momentum is building up and releasing. For trading you want to be building a trade when pressure starts to build and you want to take profits when the wave starts to pull back and build for the next cycle.
Each dot represents a length of the momentum indicator and the line inside the oscillator is a weighted composite of the underlying momentum structure for each of the lengths selected. A trade follows the directional alignment of the line (red = down, yellow = neutral / chop, green = up) and the dots should be aligned from the bottom to the top (bright green = very bullish, dark green = neutral / bullish, dark red = neutral / bearish, bright red = very bearish). When the line and the dots are aligned you will have a high probability trade.
The backtest results below are based on 2 years of backtesting, using a 2 contract trade on a 100K account. While the absolute return is not meaningful the win rate and PF are great for a trade on CL on this timeframe. The tool can be used on any asset over any timeframe in a multitude of combinations.
To get access to the tool, please contact the author.
MZ HTF HFT ROCit Bot - Non Repainting Scalper v1.2 ADX RSI MOM This is a new iteration based on my Momentum trading bot.
This is an original script meant to be a high frequency trader that works on higher time frame calculations.
I came up with the idea that using calculus I can figure out the actual rate of change and momentum with different calculations than the momentum indicator that is provided by trading view. Once momentum is shifted on a small time frame, it will provide an entry signal. The script is meant to be used on an algorithmic trading system for scalping purposes. It should be run on a one minute time frame. Unfortunately due to various plotting constraints in Pinescript, you cannot plot the rate of change and momentum and price in the same pane. To counter this, I have a showdata toggle to give you values of the indicators at each entry.
This version has two main entry settings toggled with a checkbox. There is the ROC (rate of change) version and the MOM (momentum) entry signals.
The rate of change version is meant to take a look at your moving average and try to trigger when it hits a certain rate of change point. This can be helpful if you rather play it safer. I have noticed that you can get slightly better entry points but also does not give you as many entries. The momentum algorithm will give you faster entry points and might work best with a slight offset (use your back test to help you figure it out).
I have started to add tooltips to help you along. If you have suggestions please let me know.
How does it work?
Let's just assume that you are looking at a one minute chart. I recommend using the one minute for bots because it will give you the fastest execution for entries. Pinescript has an issue where the signal is not usually sent until the end of the bar/beginning of next bar. If the signal was triggered at the beginning of a 15 minute bar, it might not actually send the signal until the following 15 minute bar. If you are trading on small time frames, this can make all the difference. If you are using an algo platform that trailing stops, stop losse, take profits, etc. I would recommend you use that platform to close your trade. The close trade message will work, but pinescript does not know the exact entry price you received, so if you are trying to collect small profits, it is best that intermediary platform does that calculation for you. If you are dealing with larger moves, instead of small 1-3% scalps, you are probably fine to use the close message setting from pinescript.
Ok, so to take an example. I like to use the 3L and 3S tokens on Kucoin. This gives you a lot of volatility to work with compared to other tokens and coins. However, it can also meas that you are likely taking a higher risk. However, there are some things that can help with that (more on that later).
So we have a token we want to run, and have it on the 1m chart.
First, be sure that all of your filters are OFF when you start playing with the back test. This allows you to see how to best optimize the bot.
Use the show data to show you additional data when you are backtesting. This can allow you to try to filter out results or market conditions that do not work. I typically work with the RSI and use the 30 minute and 15 minute RSIs. I make sure that it is trading within a certain band - about 40-75. You can try the inverse and only buy during really low RSI's as well.
www.dropbox.com
Find the source of your data with the variant drop down. You can use any time frame, open, close. high, low, olc4. Open is pretty much guaranteed to not have any repainting issues - although all the other calcs use a custom isbarconfirmed security repaint calculation. I have been finding that Open and SMA work well, but feel free to explore. If you use a source like open, close, high, low, etc - the interval will not change anything further. If you use a variant such as an sma, you should try to find an interval that works well for that token. For instance, try an sma of 8-11 minutes and see which gives you the best backtest result without changing anything else. Offset ALMA/LSMA parameters are only used for those specific variants. These specific parameters will also affect the ALMA and LSMA if you use that variant in the trend filter. In other words, you can skip these if you are not using those types of moving averages.
www.dropbox.com
Configure the ROC and MOM intervals. If you are using a source such as open, close, etc- this is where you set the interval for your change. So consider using OHLC4 or a interval of 5 thru 15 and see what works best. The Momentum inverval usually works best in the 2-5 bars. There is a custom calculation I added in to try to filter out false entries as momentum is waning. This calculation works best in 2-5 bar interval.
Configure the trigger point and offset. If you are using rate of change, the best settings will likely be between -1 to 0.5. If you are using momentum, you will likely want -20 to 10. This is where you will notice the entries will shift a bit. Try to find a balance between your backtest settings and actually finding what you thin will be the best entries based on a slight delay from trading view, to algo, to your trading platform. This can likely be a minute (maybe even) or so- so be sure to not get too caught up between the backtest results and be sure to finesse the entries to actually fit nicely - maybe a bar earlier than you would likely think. If your entries are coming in too early, you can use the offset to delay your entry by a few bars. This is both science and an art form- don't get too caught up on the back test results as that is based on having all the data tha already transpired, it's not based on how it will actually perform during deployment.
Take profit and stop loss. This should be self explanatory. This script can toggle between static take profit and a trailing profit. For scalping, you will likely want to limit it below 2% to get a good win ratio. Stop loss should be at least 5-6% for these types of 3L/3S tokens to give the strategy some room to move (if the token goes down 2% before it shoots back up, the price will go down 6%). This does not yield the best R/R ratio from a traditional trader perspective, but the statistical probabilities are in your favor for these events will happen. If you have better ideas for how to set this all up, feel free to contribute your ideas in the comments as we can all learn from each other. You can definitely set a much tighter stop loss with a larger take profit to get a lower win rate but in turn might get much better returns. It's all up to you.
FILTERS www.dropbox.com
These filters require you to know a bit about each indicator and how you want to use them. I will only go over the general idea.
Variant Filter - this is especially useful if you want to trade above a moving average. Say for instance you only want to take trades when we are over the 100 Day moving average. Or above a 30 minute, 30 bar EMA, etc. Although originally ported over from my other scripts, this is not a filter that I use often in conjunction with this script.
RSI - perhaps you want to buy when we are below the 30 line on the 30 minute RSI, or we want only want to have the strategy work when we are above the 50 RSI, this can all be configured here. I typically like to try a few different rationales here.
Now with brand NEW ADX filter - this is a brand new idea that seems to work rather well. Based on your ADX settings you can also turn on the "only uptrend" which will try to calculate if you are in an uptrend based on your ADX config. Please keep in mind that uptrend is based relatively on the ADX settings.
- There is a sprinkle of RSI magic in the entry signal to make sure that rsi is not declining in the calculation, so this can affect how many entries you get.
Some other tips:
Forward test.
Set up your algo bot on a one minute interval.
Set up take profit and stop loss on your algo trading platform.
Don't use the exact settings as your backtest, maybe try a slightly more conservative approach from the algo trading platform to make sure you are within range of triggering your events with a slight delay from signal to execution. If you have a 1.6% take profit, perhaps try 1.5% on your platform first.
By using these scripts you agree that you are trading at your own risk. I make no guarantees of returns or results. I just provide tools to help you trade better. However, I hope this ROCit will take you to the moon. And if it does, be sure to give me a shout as well as some tips of your own.
Send me a message with any questions or suggestions.

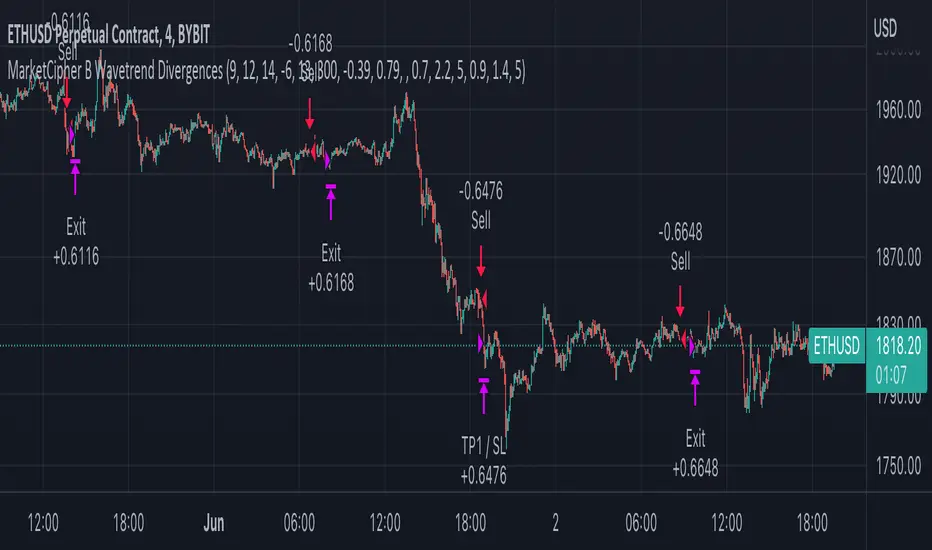
MarketCipher B Wavetrend DivergencesCreated for the MarketCipher Community and friends :)
I have published this before but it was taken down by Tradingview and PineCoders because they wanted a more in depth description so here it is:
This strategy is mainly based on Wavetrend Oscillator by LazyBear / blue momentum waves on MarketCipher B.
The Wavetrend indicator is a combination of 2 oscillator lines that signals the short term direction of the price once the lines cross. The Wavetrend indicator is useful but only once a divergence has been identified based on the crosses and the price which is what this strategy partly uses to open trades.
Here is a list and description of the different conditions that goes into the entries and exits.
Long trade:
1) Bullish divergence, regular or hidden
2) Price is above Exponential Moving Average
3) Chande Momentum Oscillator value is above x
Short trade:
1) Bearish divergence, regular or hidden
2) Price is below Exponential Moving Average
3) Chande Momentum Oscillator value is below x
The Exponential Moving Average (EMA) is a type of moving average that is price based, lagging (or reactive) indicator that displays the average price of a security over a set period of time. The EMA is however different from a normal moving average and values the recent price action. A Moving Average is a good way to confirm trends which is what it is used for in this strategy. If enabled the strategy will only open long trades above the EMA and only short trades below the EMA.
The Chande Momentum Oscillator is a technical momentum indicator and was designed specifically to track the movement and momentum of a security. The oscillator calculates the difference between the sum of both recent gains and recent losses, then dividing the result by the sum of all price movement over the same period. In this strategy it is used like the EMA to filter out bad trades that goes against the trend. The EMA is better at trading the overall trend but the Chande Momentum Oscillator is a lot better at identifying short term market conditions that are favorable for entering at divergences.
One of the most important aspects when creating a trading strategy is to know when to take profit and to make it as dynamic as possible so that it changes to the market conditions. This is what i have tried to do and the reason why this divergence trading strategy works well.
These are the 3 different exit conditions:
1) A dynamic take profit that will signal a short term trend reversal that is based on pivot points and moving averages.
2) Another dynamic take profit based on pivot points that like the previous take profit is used to determine and anticipate potential changes in market price and reversals.
3) A normal % fixed take profit
Photo of what the dynamic take profit looks like on the chart:
The pivot pointexit comes from this indicator that i have helped update and modify from the original script:
When you have found the right settings you can insert the messages from your automatic trading platform at the bottom of the inputs and then create an alert with your unique webhook address along with the alert message below:
{{strategy.order.alert_message}}
I hope this strategy will be useful to automate part of your trading or help you identify and backtest divergences for your manual trading.
Future updates to come.
Enjoy!
Sentiment by JDG v5.0Hi Trading View User,
First of all: Strictly use 1hr TF
This strategy uses the following indicators:
1. RSI (default and improved provided by trading view.
2. Fear and greed index
3. Slope of Fear and Greed Index( Drop over run formula)
Slope is calculated and fine tuned for every stock/coin.
All crypto coins have different slope structure / fear and greed DNA.
Slope is different for every coin/stock, this is automatically calculated by the script and optimized for best profit.
How the Fear and Greed Index is calculated
So how do they arrive at the final number? There are multiple factors that influence the ultimate output.
1. Volatility: The index compares volatility and max drawdowns (a drawdown is a decline in value) against the 30-day and 90-day average volatility and drawdown numbers. Higher volatility is considered fearful and increases the final output. Volatility represents 25% of the index value.
2. Momentum/volume: The index measures the current momentum and volume of the bitcoin market. Again, against the 30-day and 90-day averages. High volume and momentum are seen as negative metrics and increase the final index output. Momentum/ volume represents 25% of the index value.
3. Social Media: The index tracts mentions and hashtags for bitcoin , and compares them to historical averages. Higher mentions and hashtags are interpreted as increased market involvement and lead to an increase in the final index output. Social media represents 15% of the index value.
4. Surveys: The index conducts large, market-wide surveys on a weekly basis. Usually, there are 2,000-3,000 participants in each survey. More enthusiastic survey results drive the index higher, pointing to market greed prevailing. Surveys represent 15% of the index value.
5. Dominance: The index measures bitcoin dominance in the overall market. The higher the bitcoin dominance, the more fearful the market – as interpreted by the index. As alternative coins gain market share, the market is acting courageously and not fearfully. The lower the bitcoin dominance, the greedier the market is becoming. 6. 6. Dominance represents 10% of the index value.
7. Trends: The index includes Google trend numbers in the final value. The higher the search interest of cryptocurrency becomes; the higher amount of greed is seen in the market. Trends represent 10% of the index value.
For more information on Crypto Fear & Greed Index please do visit:
alternative.me
Strategy Buy Conditions:
1. Sentiment is at Extreme Fear and Fear , as this increases the price also increases.
2. Trading view RSI crossing up
Note: Wait for long signal, then enter a trade on the rocket emoji
Strategy Sell Conditions:
1. Sentiment is at Extreme Greed and Greed , as this decreases the price also decreases.
The current code/ strategy supports 55 coins from Binance for spot / futures trading.
Here are the list:
SHIBUSDT
AAVEUSDT
ADAUSDT
AKROUSDT
ALGOUSDT
ATOMUSDT
AUDIOUSDT
AVAXUSDT
AXSUSDT
BANDUSDT
BATUSDT
BLZUSDT
BTCDOMUSDTPERP
BTCUSDT
CTKUSDT
EGLDUSDT
EOSUSDT
ETHUSDT
FLMUSDT
FTMUSDT
GALAUSDT
IOTAUSDT
IOTXUSDT
KAVAUSDT
KLAYUSDT
LITUSDT
LRCUSDT
LUNAUSDT
MATICUSDT
MTLUSDT
NEARUSDT
NEOUSDT
ONTUSDT
ROSEUSDT
RUNEUSDT
SANDUSDT
SKLUSDT
SOLUSDT
THETAUSDT
WAVESUSDT
XRPUSDT
ZECUSDT
HBARUSDT
ONEUSDT
GRTUSDT
DOTUSDT
CTSIUSDT
VETUSDT
LINKUSDT
SRMUSDT
OGNUSDT
MANAUSDT
Reminding again, please use 1HR TF only when using this strategy.
Wait for long signal, then enter a trade on the rocket emoji
Message me for access.
-CodeFather

Pro Divergence [regular + hidden] by TradingClue█ Pro Divergence is my new divergence-based toolkit that will help you to spot lucrative opportunities in all kinds of markets.
I've developed toolkits and strategies that use divergences for many years, e.g. AutoDivergence and CCIDivergence . Pro Divergence is my latest development and benefits from those yearlong experiences.
The main algorithm to detect divergences has changed from using linear regressions and moving averages to algorithmic trendline detection like I've been using in TD Lines .
This new approach supports the detection of regular divergences but also hidden divergences can be identified.
Before going more into the details of the mechanics of Pro Divergence, let's recap, what divergences are all about when it comes to trading.
█ Regular Divergence
The basic idea is pretty simple: If price goes in the opposite direction than some other technical indicator - in most cases an oscillator - we speak of a divergence. A regular divergence might be a signal for a trend reversal. That's it.
For example, if the price is currently rising, while at the same time Momentum is falling - it might be time for a reversal and the price of an asset is about to fall soon. If there are additional indications to confirm the signal, e.g. if RSI is in the overbought area, it might be a good idea to go short on that specific asset.
Regular bullish divergences are indicated when price is forming lower lows while an oscillator shows higher lows.
Regular bearish divergences are indicated when price is forming higher highs while an oscillator shows lower highs.
█ Hidden Divergence
While regular divergences indicate trend reversals, hidden divergences indicate a trend continuation.
When the price is making higher lows and the oscillator is showing lower lows, we speak of a bullish hidden divergence. When the price is making lower highs and the oscillator shows higher highs, it's a bearish hidden divergence.
These rules for identifying divergences are pretty simple and straightforward. And they are also confusing at times. But that's what Pro Divergence is helping you with: trade based on customizable signals to identify all kinds of divergences.
You could either use the strategy settings of the toolkit to optimize the properties to show winning backtesting results. Or you use the signals as an extra confirmation to some other kind of signal/ strategy you are working with.
█ Summary of all current features
• Oscillator: choose between CCI, Momentum, MACD, or RSI. All oscillators-settings are customizable.
• RSI-filter: in some cases, the quality of the signals can be improved by an RSI filter, e.g. a bullish signal would only be valid if RSI is in the oversold area. Set the RSI period and the oversold/ overbought levels to your preferred values.
• You can display all divergences on the chart to get an idea of the current price action. Or you can pick any combination of signals you would like to include in a backtest. Possible signals are: regular bullish divergence, regular bearish divergence, hidden bullish divergence, hidden bearish divergence
• Exits: there are many ways to get exit signals - combinations of the below options are possible:
• fixed profit targets/ stop losses based on ticks
• Exit when momentum reverses
• Exit when price touches the opposite Bollinger Band (e.g. a long position will be closed when price touches the upper Bollinger Band). The settings for the Bollinger Bands are customizable.
• Entry: you can choose only to enter a trade if momentum is going in the same direction as the direction of your trade (e.g. only go long if momentum is rising)
• time and date filer
• Do a backtest only in a given time range (maybe you're not interested in the whole range of historical data when trading in a higher timeframe. Or you would like to do some kind of walk forward analysis)
• Only trade during special times of a day, e.g. only trade during the first hours of a trading session
Since this strategy is making heavy use of math and technical indicators, it is not tied to a certain asset class or timeframe. It was tested successfully on a large number of financial instruments like stocks, crypto, forex, and others.

Orion Algo Strategy v2.0Hi everyone.
I decided to make the latest Orion Algo open to people. I don't have enough time to work on it lately, so I figured it would be best that everyone can have it to work on it. I took out some stuff from the original but it should give an idea on how things work. I made two strategies with this so far so you can use that to come up with your own. I recommend the DCA strategy because it gives you the most bang for Orion Algo's buck. It's pretty good at finding long entries.
Overall I hope you guys like this one. Also, Banano is the best crypto currency :)
-INFO-
Orion Algo is a trading algorithm designed to help traders find the highs and lows of the market before, during, and after they happen. We wanted to give an indicator to people that was simple to use. In fact we created the algorithm in such a way that it currently only needs a single input from the user. Since no indicator can predict the market perfectly, Orion should be used as just another tool (although quite a sharp one) for you to trade with. Fundamental knowledge of price action and TA should be used with Orion Algo.
Being an oscillator, Orion currently has a bias towards market volatility . So you will want to be trading markets over 30% volatility . We have plans to develop future versions that take this into account and adjust automatically for dead conditions. Also, while there are some similarities across all oscillators, what sets ours apart is the prediction curve. The prediction curve looks at the current signal values and gives it a relative score to approximate tops and bottoms 1-2 bars ahead of the signal curve. We also designed a velocity curve that attempts to predict the signal curve 2+ bars ahead. You can find the relative change in velocity in the Info panel. The bottom momentum wave is based on the signal curve and helps find overall market direction of higher time-frames while in a lower one.
Settings and How to Use them:
User Agreement – Orion Algo is a tool for you to use while trading. We aren’t responsible for losses OR the gains you make with it. By clicking the checkbox on the left you are agreeing to the terms.
Super Smooth – Smooths the main signal line based on the value inside the box. Lower values shift the pivot points to the left but also make things more noisy. Higher values move things to the right making it lag a bit more while creating a smoother signal. 8 is a good value to start with.
Theme – Changes the color scheme of Orion.
Dashboard – Turns on a dashboard with useful stats, such as Delta v, Volatility , Rsi , etc. Changing the value box will move the dashboard left and right.
Prediction – A secondary prediction model that attempts to predict a reversal before it happens (0-2bars). This can be noisy some times so make your best judgement. Curve will toggle a curve view of the prediction. Pivots will toggle bull/bear dots.
∆v – Delta v (change in velocity). This shows momentum of the signal. Crossing 0 signals a reversal. If you see the delta v changing direction, it may signify a reversal in the several bars depending on the overall momentum of the market.
Momentum Wave – Uses the signal as a macro trend indicator. Changes in direction of the wave can signify macro changes in the market. Average will toggle an averaging algorithm of the momentum waves and makes it easy to understand.
-STRATEGIES-
Simple - Just buy and sell on the dots
DCA - Uses the settings in the script for entries. If a buy dot appears then it will buy, if the price goes below the percentage it will wait for another dot before entering. This drastically improves DCA potential.

MACandles-LinearRegression-StrategyThis is combination of multiple indicators and strategies. Mainly useful for indexes and to time the entry and exits of indexes. No stoploss used - makes it less desirable for leveraged trades or trading individual stocks.
Let us rewind and look back at some of the indicators/strategies published earlier.
1. Moving Average Candles - this is one of my favourite tool for general trend filtering. Applying supertrend on moving average candles is one of the easiest ways to find reversal in trending market without exiting positions too early. Few scripts published on this basis are:
MA Candles Supertrend
MA Candles Supertrend Strategy
2. VixFix and Linear Regression - this itself is combination of two indicators.
Williams-Vix-Fix-Finds-Market-Bottoms - by @ChrisMoody
Squeeze-Momentum-Indicator - by @LazyBear
I have combined these two indicators to derive VIX-Fix linear regression to find absolute market bottoms. More description here:
VixFixLinReg-Strategy
VixFixLinReg-Indicator
Now, in this strategy, we combine all these together.
Derive moving average candles
Derive momentum of moving average candles
Derive Linear regression on momentum
Optionally, also calculate VIX Fix and Linear regression on VixFix momentum
To find market bottom:
There are two options
1. Use when momentum of MA candles hit bottom (red) and slowly turn up (orange). In aggressiveLong mode, signals are also generated when momentum starts going positive from negative.
2. Use Vix Fix linear regression of MA candles as described in the original script of VixFixLinReg-Strategy
To find market top
Here only Ma candles momentum decreasing is used as signal. If looking for longTrades , exit signal is generated only when momentum is turning negative extreme(orange). Or else, exit signal is generated when momentum has turned neutral.
At this stage, it is very much experimental - use it with caution :)
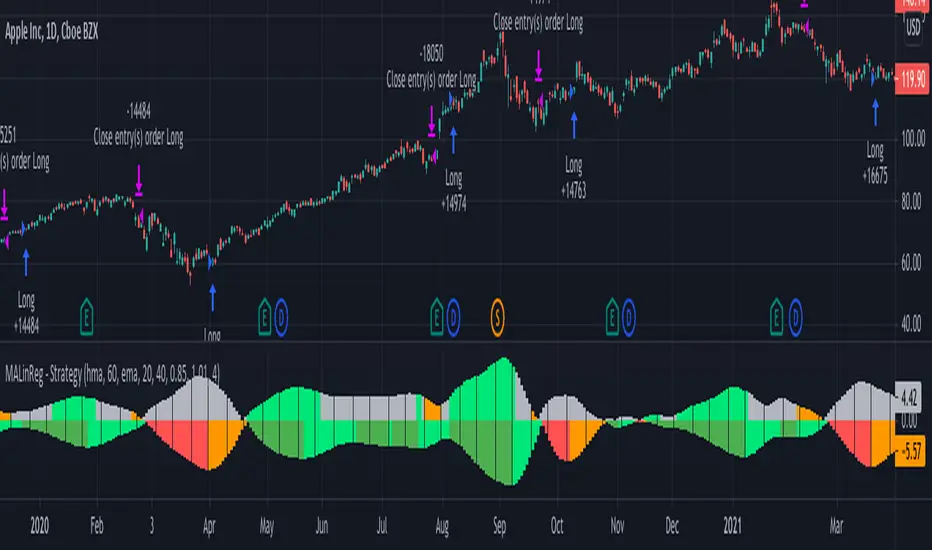
DEMA/EMA & VOLATILITY (VAMS)The biggest issue with momentum following strategies is over signaling during whipsaw periods. I created this strategy that measure momentum with DEMA (Fast Moving) and EMA (Slow moving). In order to mitigate over signaling during whipsaw periods I implemented the average true range percentage (ATRP) to measure realized volatility. If momentum is picking up while volatility is under a certain threshold it purchases the security. If momentum slows while volatility picks up it sells the security. Additionally, if momentum picks up, but volatility is high, it stays out of the security. This follows the theory that during sustained uptrends volatility will decrease, and during market corrections the volatility picks up. Following the old adage that markets climb up the stairs, and fall out the window. Note that this strategy does repaint due to it entering and closing positions at the close of the bars. I forgot to mention how volatility is measured high vs low. If the ATRP is above the EMA of the ATRP the strategy interprets the volatility is increasing and does not enter the security & Vice Versa for selling (with momentum signal of MAs)
This is just my first strategy, any feedback would be much appreciated.
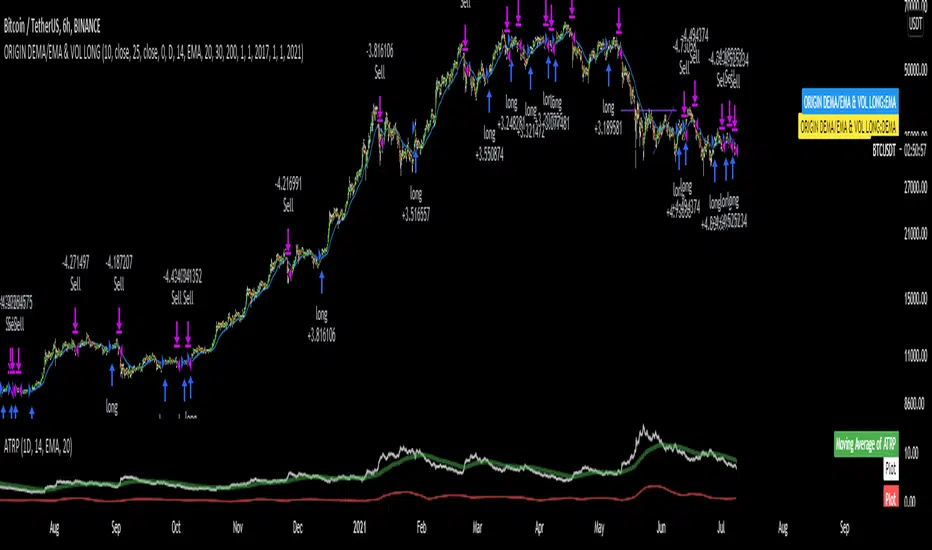
TopTenAlgo 10. SQZMOM Algorithmic Strategy with Alerts & SignalsEN: This Algorithm is a derivative of John Carter's "TTM Squeeze" volatility indicator. Many strategists have taken the indicator on Tradingview with simple moving averages and have looked at the biggest mistake only by dealing with squeeze and exit processes to squeeze. But I used the algorithm to determine where the markets would actually explode. For example, instead of using SMAs , I tested them on the Linear Regression Curve using Volume Weighted Moving Averages and Hull MAs. This gave me the opportunity to develop a more responsive algorithm and identify where the actual explosion would occur. The Gray Circles in the midline show that the market is entering a new jam (in the Bollinger Bands and Keltner Channel). This means low volatility , the market prepares itself for an explosive move (up or down). White Circles mean that it is about to get out of the jam. The Blue Circles, which no one can calculate, now inform that the exit is no longer jammed and that the explosion has taken place.
Mr. Carter recommends that you wait until the first gray after a gray cross and take a position in the momentum direction (for example, if the momentum value is above zero, relax). Exit position when the momentum changes (increase or decrease, this is indicated by a color change). In this algorithm, I tried to achieve good entry points using an additional indicator such as ADX and WaveTrend. To draw the histogram, I used a different method based on Linear Regression . Mr.Carter uses a simple momentum indicator. Strategy, alarms and signals have been added to the indicator so that you can optimize in algorithmic trading.
In summary, this algorithm is a strict algorithm in which additional 4-5 indicators are blended. Conveniences for Everyone ...
TR: Bu Algoritma John Carter'ın "TTM Squeeze" volatilite göstergesinin bir türevidir. Bir çok stratejist Tradingview' de gösterge' yi basit hareketli ortalamalarla ele almış ve en büyük hatayı sadece sıkışma ve sıkışmadan çıkış süreçlerini ele alarak bakmışlardır. Fakat ben algoritmayı piyasaların asıl patlama yapacağı yeri tespit etmek için kullandım. Örneğin SMA' ları kullanmak yerine Hacim Ağırlıklı Hareketli Ortalamaları ve Hull MA' ları kullanarak onları Linerar Regresyon Eğrisinde stress testine tabi tuttum. Buda bana daha duyarlı bir algoritma geliştirmem ve asıl patlamanın olacağı yerleri tespit etmem için fırsat verdi. Orta hattaki Gri Daireler, piyasanın yeni bir sıkışmaya girdiğini gösteriyor ( Bollinger Bantları ve Keltner Kanalı'nda). Bu, düşük volatilite anlamına gelir, piyasa kendisini patlayıcı bir harekete hazırlar (yukarı veya aşağı). Beyaz Daireler ise sıkışmadan çıkmak üzere olduğu anlamına gelir. Hiç kimsenin hesap edemediği Mavi Daireler ise artık sıkışmadan çıkıldığını ve patlamanın gerçekleştiğini haber verir.
Mr.Carter, gri bir çarpı işaretinden sonra ilk griye kadar beklemenizi ve momentum yönünde bir pozisyon almanızı önerir (örneğin, momentum değeri sıfırın üstünde ise, rahat olun). Momentum değiştiğinde pozisyondan çıkın (artırma veya azaltma, bunu o bir renk değişikliği ile belirtilir). Bu algoritmada ben, ADX ve WaveTrend gibi ek bir gösterge kullanarak iyi giriş noktalarıelde etmeye çalıştım. Histogramı çizmek için ise Linear Regresyon tabanlı farklı bir yöntem kullandım. Mr.Carter basit bir momentum göstergesi kullanır. Göstergeye algoritmik işlemlerde optimizasyon yapabilmeniz için strateji, alrmlar ve sinyaller eklenmiştir.
Özetle bu algoritma ek 4-5 göstergenin harmanlandığı sıkı bir algoritmadır. Herkese Kolaylıklar dilerim...

S&P Bear Warning IndicatorTHIS SCRIPT HAS BEEN BUILT TO BE USED AS A S&P500 SPY CRASH INDICATOR ON A DAILY TIME FRAME (should not be used as a strategy).
THIS SCRIPT HAS BEEN BUILT AS A STRATEGY FOR VISUALIZATION PURPOSES ONLY AND HAS NOT BEEN OPTIMIZED FOR PROFIT.
The script has been built to show as a lower indicator and also gives visual SELL signal on top when conditions are met. BARE IN MIND NO STOP LOSS, NOR ADVANCED EXIT STRATEGY HAS BEEN BUILT.
As well as the chart SELL signal an alert option has also been built into this script.
The script utilizes a VIX indicator (maroon line) and 50 period Momentum (blue line) and Danger/No trade zone(pink shading).
When the Momentum line crosses down across the VIX this is a sell off but in order to only signal major sell offs the SELL signal only triggers if the momentum continues down through the danger zone.
A SELL signal could be given earlier by removing the need to wait for momentum to continue down through the Danger Zone however this is designed only to catch major market weakness not small sell offs.
As you can see from the picture between the big October 2018 and March 2020 market declines only 2 additional SELLS were triggered.
To use this indicator to identify ideal buying then you should only buy when Momentum line is crossed above the VIX and the Momentum line is above the Danger Zone (ideally 3 - 5 days above danger zone)

Combo Backtest 123 Reversal & Ergodic TSI This is combo strategies for get a cumulative signal.
First strategy
This System was created from the Book "How I Tripled My Money In The
Futures Market" by Ulf Jensen, Page 183. This is reverse type of strategies.
The strategy buys at market, if close price is higher than the previous close
during 2 days and the meaning of 9-days Stochastic Slow Oscillator is lower than 50.
The strategy sells at market, if close price is lower than the previous close price
during 2 days and the meaning of 9-days Stochastic Fast Oscillator is higher than 50.
Second strategy
r - Length of first EMA smoothing of 1 day momentum 4
s - Length of second EMA smoothing of 1 day smoothing 8
u- Length of third EMA smoothing of 1 day momentum 6
Length of EMA signal line 3
Source of Ergotic TSI Close
This is one of the techniques described by William Blau in his book "Momentum,
Direction and Divergence" (1995). If you like to learn more, we advise you to
read this book. His book focuses on three key aspects of trading: momentum,
direction and divergence. Blau, who was an electrical engineer before becoming
a trader, thoroughly examines the relationship between price and momentum in
step-by-step examples. From this grounding, he then looks at the deficiencies
in other oscillators and introduces some innovative techniques, including a
fresh twist on Stochastics. On directional issues, he analyzes the intricacies
of ADX and offers a unique approach to help define trending and non-trending periods.
WARNING:
- For purpose educate only
- This script to change bars colors.

Script Criptomaníacos FuturesThis Script runs a strategy for long and short entries.
The strategy is based on a breakout system, that enters long or short based on previous support and resistences, and a series of indicators in order to read the trend and momentum of price charts.
We are only able to place entry orders when the background collor indicates price matches with the Trend/Momentum filters, being green for long and red for short trades.
The exit will always based on a trailling stop.
__________________________________________
Esse script roda uma estratégia para entradas em long e short.
A estratégia é baseada em um estratégias de rompimento, que entra Long ou Short baseado em suportes e resistências anteriores, além de uma série de indicadores afim de ler a tendência e o momentum do gráfico de preço.
Só estamos autorizados a emitir ordens de entrada quando o Background indica que o preço concorda com os filtros de Tendência/Momentum, sendo verde para Long (compra) e Short (venda).
A saída sempre vai ser baseada em um método de trailling stop.

IndianPivotBossMUPSThis is a new avatar of the MUPS (ManojUltimatePivotScalpingStrategy).
This Indicator is to be used with the following Indicators :
1) IndianPivotBossPEMA
2) IndianPivotBossPIVOTRSI
3) IndianPivotBossDPWMACD
4) IndianPivotBossPIVOTSHIFT
BcondA = crossover(close,dtime_up) or low > dtime_up
BcondB = crossover(low,imap) or crossover(low,dpivotema) or crossover(low,imapw) or crossover(low,imapm)
//BcondC = crossover(low,ddtime_pivot)
BcondD = crossover(low,wtime_pivot)
BcondE = crossover(low,mtime_pivot)
BcondF = crossover(low,idtime_pivot)
BcondG = imacd > 0 or imacdw > 0 or imacdm > 0
BcondH = (rsipe > 50 and rsipe > rsippe) or (rsipew > 50 and rsipew > rsippew) or (rsipem > 50 and rsipem > rsippem)
BcondI = crossover(imacd,0) and close > maFast
//BcondI = ( dtime_pwd < ema(dtime_pwd,8) and crossover(low,dtime_r1))
EcondS = (imacd < 0 or crossunder(imacd,0) or close < maSlow) and rsipe < 50 and rsippe < 50 //crossunder(high,dtime_pivot) or crossunder(high,dpivotema) or crossunder(close,wtime_pivot) or crossunder(high,idtime_pivot) or crossunder(rsipe,rsippe) or crossunder(rsipe,50) or crossunder(high,dtime_r1)
Objective :
To enter into a trade when the direction, trend and momentum is confirmed.
Rules :
The following are the broad conditions for taking a long position. Reverse is for Short.
Direction - Defined by price crossing either daily cpr / weekly pivot / monthly pivot / intraday 125 min pivot
Trend - Defined by IndianPivotBossPIVOTSHIFT and IndiaPivotBossDPWMACD. The latter is a variant of the former. The former gives advance indication of a trend, while the latter confirms moments later.
Momentum - Defined by IndianPivotBossPIVOTRSI.
The strategy takes long when direction is established by the price crossing pivots and trend is established with pivot shift indicator sloping upwards which is further confirmed by DPWMACD, which is a variant of pivot shift indicator, crossing midline and sloping upwards and Momentum is established by Pivot RSI indicator when it crosses 50 and is above its own EMA.
Exits are usually at close. In case if the combination fizzles out, the strategy shows exit signal if any of the 3 ie, direction / trend / momentum fizzles out.
It is suggested to close down the positions at day end as sometimes the strategy continues the position overnight if deemed fit.
Other Rules when you take a long trade based on the signal.
1) Ensure the price is above PEMA and PEMA is upward sloping.
2) Ensure the Pivot shift indicator is upward sloping; Ensure the DPWMACD is also upward sloping.
3) Ensure the Daily Pivot RSI is above 50 and is above its own EMA.
This is not a holy grail. Hence have a proper position sizing which is your ultimate defense.
IMPORTANT : WHEN YOU USE THIS INDICATOR ALONG WITH 1,2,3,4 MENTIONED IN THE TOP PORTION OF THIS POST, PLS ENSURE THAT THE STRATEGY CHOSEN IS MUPS AS ALL THOSE MENTIONED ABOVE ARE ALSO STRATEGIES ON ITS OWN. MUPS COMBINES ALL THESE.
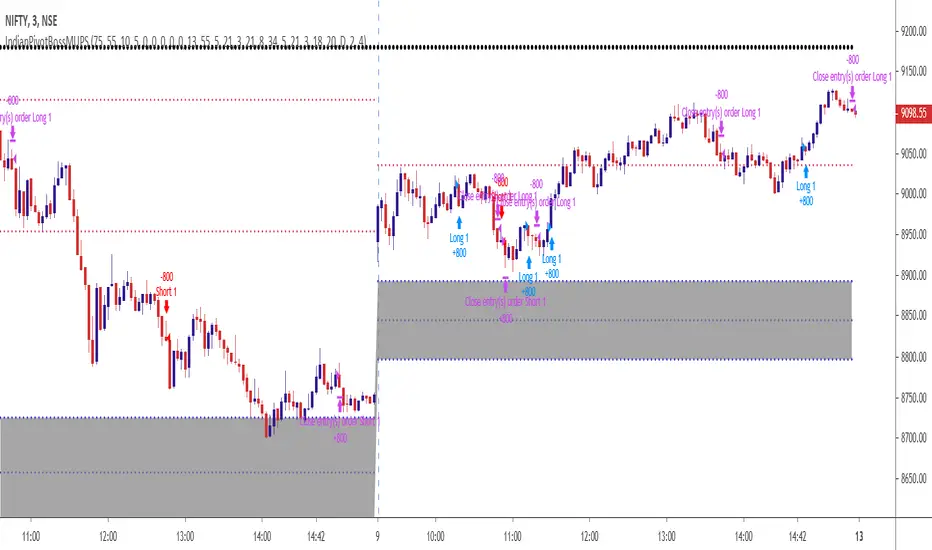
Trading Public School ST1This is a derivative of Trading Public School "TTM Squeeze" volatility indicator, as discussed in his book "Mastering the Trade" (chapter 11).
Black crosses on the midline show that the market just entered a squeeze ( Bollinger Bands are with in Keltner Channel). This signifies low volatility , market preparing itself for an explosive move (up or down). Gray crosses signify "Squeeze release".
Mr.Carter suggests waiting till the first gray after a black cross, and taking a position in the direction of the momentum (for ex., if momentum value is above zero, go long). Exit the position when the momentum changes (increase or decrease --- signified by a color change). My (limited) experience with this shows, an additional indicator like ADX / WaveTrend, is needed to not miss good entry points. Also, Mr.Carter uses simple momentum indicator , while I have used a different method (linreg based) to plot the histogram. 100% Profit & loss 10% Only
