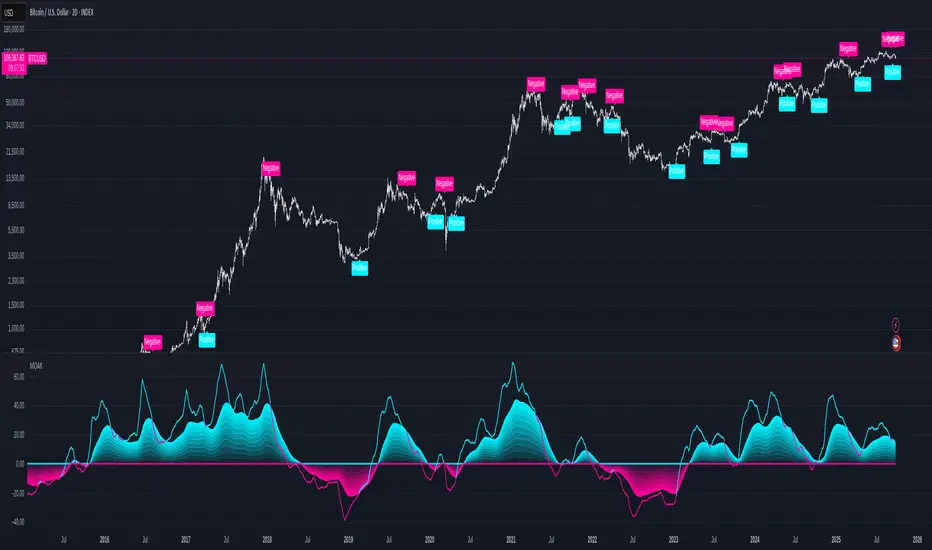
Closing MomentumClosing momentum calculates the moving averages of closes and highs vs previous highs plus those of closes and lows vs previous lows to create momentum moving averages. Closes above/below previous highs/lows are weighted more strongly than new high or low wicks above/below a previous highs or lows.
If momentum is up, the background will shade green; brighter is stronger. If momentum is down, likewise with red.
Shifts in momentum are indicated by symbols: triangles indicate a minor shifts, arrows moderate, big arrows major. Likewise, the shade of the symbols indicates strength (darker is stronger).
Using the indicator: long continuous stretches of the same color indicate trend - deeper is stronger. If the shade is lightening or clears and/or if symbols of the other color start appearing, the trend is weakening.
"momentum"に関するスクリプトを検索

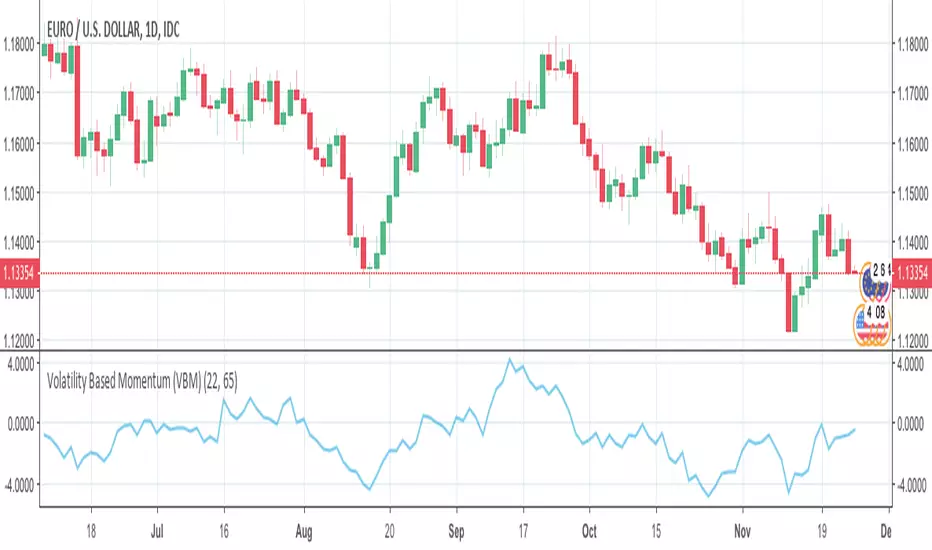
Volatility Based Momentum (VBM)The Volatility Based Momentum (VBM) indicator is a variation on the rate-of-change (ROC) indicator. Instead of expressing momentum in a percentage gain or loss, VBM normalizes momentum using the historical volatility of the underlying security.
The VBM indicator offers numerous benefits to traders who orient their trading around volatility. For these traders, VBM expresses momentum in a normalized, universally applicable ‘multiples of volatility’ (MoV) unit. Given the universal applicability of MoV, VBM is especially suited to traders whose trading incorporates numerous timeframes, different types of securities (e.g., stocks, Forex pairs), or the frequent comparison of momentum between multiple securities.
The calculation for a volatility based momentum (VBM) indicator is very similar to ROC, but divides by the security’s historical volatility instead. The average true range indicator (ATR) is used to compute historical volatility.
VBM(n,v) = (Close - Close n periods ago) / ATR(v periods)
For example, on a daily chart, VBM(22,65) calculates how many MoV price has increased or decreased over the last 22 trading days (approximately one calendar month). The second parameter is the number of periods to use with the ATR indicator to normalize the momentum in terms of volatility.
For more details, there is an article further describing VBM and its applicability versus ROC.
Multi-Oscillator Adaptive Kernel with MomentumMulti-Oscillator Adaptive Kernel w. Momentum
An adaptation of the indicator by AlphaAlgos : Multi-Oscillator-Adaptive-Kernel (MOAK) with Divergence . Please find the description of the indicator in the above link.
Apart from adding labels to show trend/momentum changes, the following changes have been made to the original script:
1. Sensitivity is used in the computation to scale the fast MOAK signal,
2. Selection between two indicator modes:
Trending - (the original script method) assesses whether smoothed MOAK is above/below 0 - for up/down trends respectively.
Momentum - assesses whether the fast MOAK signal is above/below the smoothed MOAK, and can be used to indicate potential trend reversals as momentum of current trend fades.
Multi-Timeframe Momentum Indicator [Ox_kali]The Multi-Timeframe Momentum Indicator is a trend analysis tool designed to examine market momentum across various timeframes on a single chart. Utilizing the Relative Strength Index (RSI) to assess the market’s strength and direction, this indicator offers a multidimensional perspective on current trends, enriching technical analysis with a deeper understanding of price movements. Other oscillators, such as the MACD and StochRSI, will be integrated in future updates.
Regarding the operation with the RSI: when its value is below 50 for a given period, the trend is considered bearish. Conversely, a value above 50 indicates a bullish trend. The indicator goes beyond the isolated analysis of each period by calculating an average of the displayed trends, based on user preferences. This average, ranging from “Strong Down” to “Strong Up,” reflects the percentage of periods indicating a bullish or bearish trend, thus providing a precise overview of the overall market condition.
Key Features:
Multi-Timeframe Analysis : Allows RSI analysis across multiple timeframes, offering an overview of market dynamics.
Advanced Customization : Includes options to adjust the RSI period, the RSI trend threshold, and more.
Color and Transparency Options : Offers color styles for bullish and bearish trends, as well as adjustable transparency levels for personalized visualization.
Average Trend Display : Calculates and displays the average trend based on activated timeframes, providing a quick summary of the current market state.
Flexible Table Positioning : Allows users to choose the indicator’s display location on the chart for seamless integration.
List of Parameters:
RSI Period : Defines the RSI period for calculation.
RSI Up/Down Threshold: Threshold for determining bullish or bearish trends of the RSI.
Table Position: Location of the indicator’s display on the chart.
Color Style : Selection of the color style for the indicator.
Strong Down/Up Color (User) : Customization of colors for strong market movements.
Table TF Transparency : Adjustment of the transparency level for the timeframe table.
Show X Minute/Hour/Day/Week Trend : Activation of the RSI display for specific timeframes.
Show AVG : Option to display or not the calculated average trend.
the Multi-Timeframe Momentum Indicator , stands as a comprehensive tool for market trend analysis across various timeframes, leveraging the RSI for in-depth market insights. With the promise of future updates including the integration of additional oscillators like the MACD and StochRSI, this indicator is set to offer even more robust analysis capabilities.
Please note that the MTF-Momentum is not a guarantee of future market performance and should be used in conjunction with proper risk management. Always ensure that you have a thorough understanding of the indicator’s methodology and its limitations before making any investment decisions. Additionally, past performance is not indicative of future results.

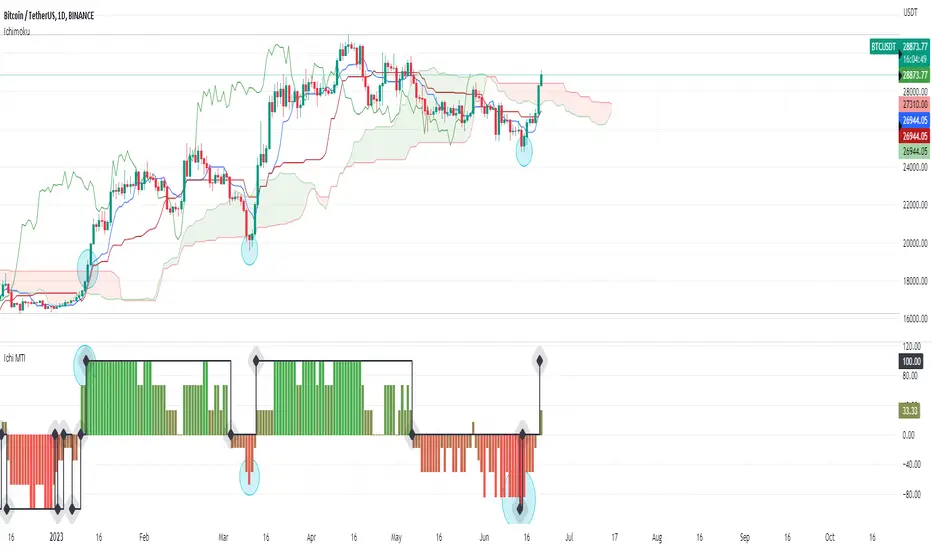
Ichimoku Cloud Momentum & Trend Indicator «NoaTrader»If you like Ichimoku cloud and use it in your analysis, or you are new to it and sometimes gets tricky to figure out all the details, this indicator tries to simplify that and visualize the change of trend and momentum relative to the past based on ichimoku.
The RED/GREEN columns are showing momentum strength while the black diamond line suggests the trend change. The conditions are simple enough to check them out on the script.
As you can see highlighted cyan circles on the chart as major important signals on the chart of Bitcoin daily timeframe.
This script tries to be complementary to the ichimoku cloud itself and cannot replace the levels represented by the cloud on chart.
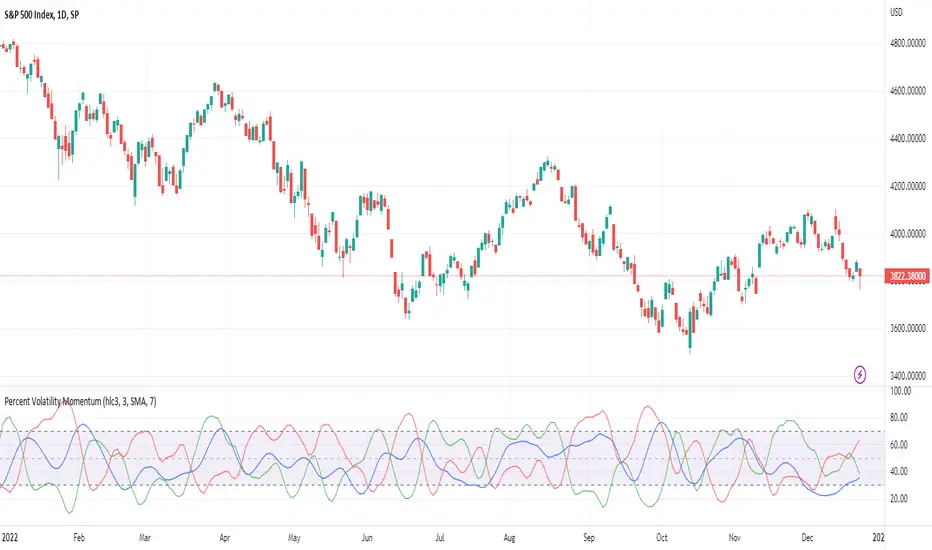
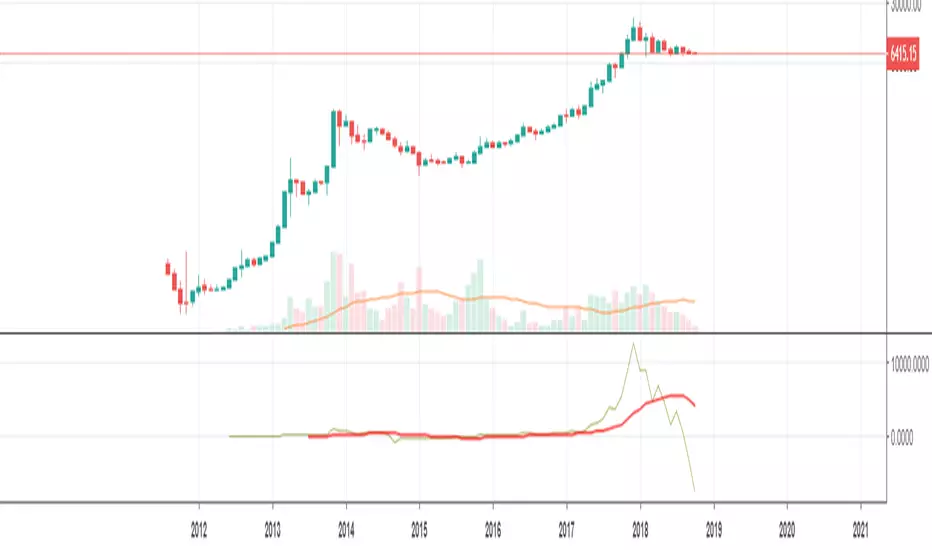
Percent Volatility MomentumThis pine script calculates percent volatility momentum, negative percent volatility and positive percent volatility. The blue line is the overall momentum of the current percent volatility trend. The red line only includes negative movements in the percent volatility of the source. The green line includes only positive movements of the percent volatility of the source. The script also includes an angle and a normalized angle setting that allows one to determine the angle of the source curve. Note, the angle was transformed from -90 to 90 to 0 to 100. Such that an angle of -90 is transformed to 0. An angle of 0 is transformed to 50 and an angle of 90 is transformed to 100. This is the first draft of this script and my first pine script published. Any feedback is welcome. I borrowed code from TradingView's Linear Regression Channel and Relative Strength Index pine scripts.
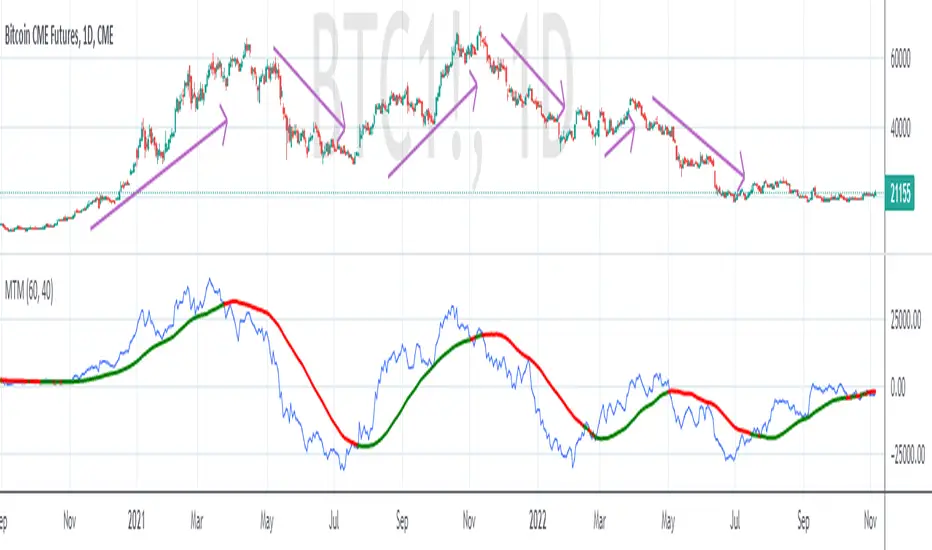
MTM - Momentum IndicatorMTM - Momentum
Description
The Momentum indicator is a speed of movement indicator that is designed to identify the speed (or strength) of price movement. This indicator compares the current close price to the close price N bars ago and also displays a moving average of this difference.
Category
Momentum Indicators
Parameters
N ( Default: 6 Min: 1 Max: 100 )
N1 ( Default: 6 Min: 1 Max: 100 )
Chart Script
MTM : CLOSE-REF(CLOSE,N);
MTMMA : MA(MTM,N1)
www.edgerater.com
Dap's Oscillator- Short Term Momentum and Trend. BINANCE:BTCUSDT BYBIT:BTCUSDT BYBIT:ETHUSDT BINANCE:ETHUSDT
DAP's OSCILLATOR:
WHAT IS IT?
This Oscillator was created to inspire confidence in the short-term trend of traders. This will work very well with a volatility metric (I recommend BBWP by @The_Caretaker)
WHAT IS IT MADE OF?
1. Consists of a series of equations (mainly the difference between simple to exponential moving averages) and Standard deviations of these moving average differences (length equivalent to the length of sampled ma's)
2. These equations are then boiled down through an averaging process array, after averaging the covariants are equated against the variants of the positive side of the array. This is what is presented as the aqua line.
3. The RC average (yellow) is the sma following the DAP'S Oscillator at a specified length
4. The most important part of this indicator is simply the momentum oscillator represented as a green or red line based on the value relative to the Oscillators.
HOW DO I USE THIS?
As I mentioned before mixed with a volatility metric, it should set you up for a good decision based on short-term trends. I would say to be careful for periods of consolidation, with the consolidation the momentum often meets hands with DAP's Oscillator and can cause fake-outs. You want to spot divergences from the price to the momentum difference, as well as room to work down or upward to secure a good entry on a position.
CHEAT CODE'S NOTES:
I appreciate everyone who has boosted my previous scripts, it means a lot. If you want to translate words to pine script onto a chart, feel free to PM me. I would be happy to help bring an indicator to life. I may take a quick break but will be back shortly to help create more cheat codes for yall. Thanks!
-Cheat Code

Trend Momentum Divergence (TMD)Shout out to Lazy Bear, Bunghole, and Trading View for script code for this make.
In this study you will have a visual representation of the strength and momentum of a trend and possibilities of where the market is heading. You can use the Blue and White momentum waves to spot divergences in a up oe down trend for potential reversals. When a green dot appears under the lower level with divergence then it is a indication that we should consider looking to buy. If the red dot appears over the upper level with divergence we should be looking to short/sell. The custom MFI indicator determines how much money is flowing into the market. If it is green that means money is flowing into the market and if it shows red it means that money is flowing out of the market. You can spot divergences in the money flow as well as the RSI. The Blue and Green lines from the RCI3line indicator are used for higher timeframe momentum based on current chart timeframe and we can see when they cross over.

Visual Squeeze MomentumSqueeze Momentum from LazyBear now visible at the chart so you can check when the Squeeze its about to release. All credits for him.

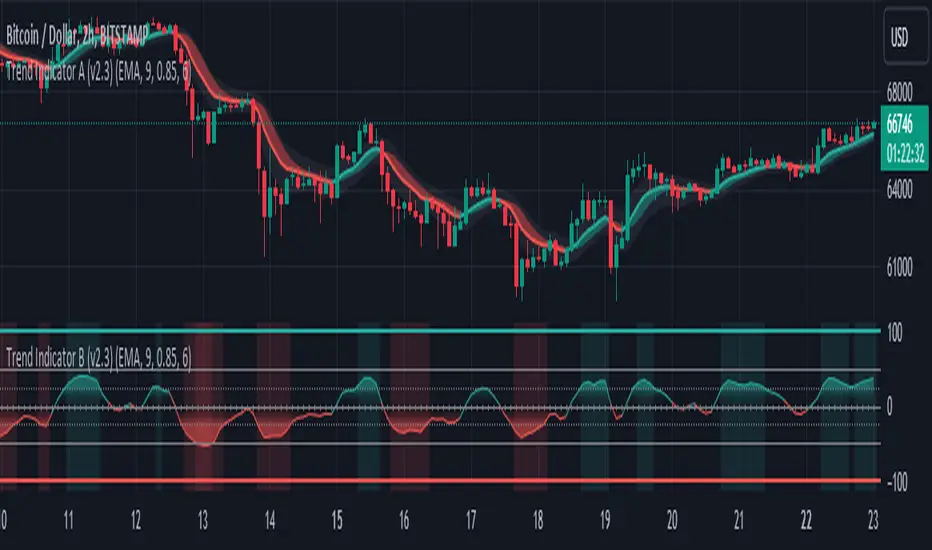
Trend Indicator B-V2 (Momentum measuring)"Trend Indicator A-V2" and "Trend Indicator B-V2" are updated and improved versions of my initial trend indicators. Totally rethinking the code, adding highs and lows in the calculations, including some more customisation through colour schemes.
In practice, this indicator uses EMAs and Heikin Ashi to provide an overall idea of the trend.
The "Trend Indicator A-V2" is an overlay showing “Smoothed Heikin Ashi” .
The "Trend Indicator B-V2" uses the same values in a different way to measure the momentum of the trend and identify potential trend rejections.
Please, take into account that it is a lagging indicator.
Squeeze Momentum [Plus]The "Momentum" in this indicator is smoothed out using linear regression. The Momentum is what is displayed on the indicator as a histogram, its purpose is obvious (to show momentum).
What is a Squeeze? A squeeze occurs when Bollinger Bands tighten up enough to slip inside of Keltner Channels .
This is interpreted as price is compressing and building up energy before releasing it and making a big move.
Traditionally, John Carter's version uses 20 period SMAs as the basis lines on both the BB and the KC.
In this version, I've given the freedom to change this and try out different types of moving averages.
The original squeeze indicator had only one Squeeze setting, though this new one has three.
The gray dot Squeeze, call it a "low squeeze" or an "early squeeze" - this is the easiest Squeeze to form based on its settings.
The orange dot Squeeze is the original from the first Squeeze indicator.
And finally, the yellow dot squeeze, call it a "high squeeze" or "power squeeze" - is the most difficult to form and suggests price is under extreme levels of compression.
Now to explain the parameters:
Squeeze Input - This is just the source for the Squeeze to use, default value is closing price.
Length - This is the length of time used to calculate the Bollinger Bands and Keltner Channels .
Bollinger Bands Calculation Type - Selects the type of moving average used to create the Bollinger Bands .
Keltner Channel Calculation Type - Selects the type of moving average used to create the Keltner Channel.
Color Format - you to choose one of 5 different color schemes.
Draw Divergence - Self explanatory here, this will auto-draw divergence on the indicator.
Gray Background for Dark Mode - to make them more visually appealing.
Added ADX (Average Directional Index) that measure a trend’s strength. The higher the ADX value, the stronger the trend. The ADX line is white when it has a positive slope, otherwise it is gray. When the ADX has a very large dispersion with respect to the momentum histogram, increase the scale number.
Added "H (Hull Moving Average) Signal". Hull is a extremely responsive and smooth moving average created by Alan Hull in 2005. Have option to chose between 3 Hull variations.
Added "Williams Vix Fix" signal. The Vix is one of the most reliable indicators in history for finding market bottoms. The Williams Vix Fix is simply a code from Larry Williams creating almost identical results for creating the same ability the Vix has to all assets.
The VIX has always been much better at signaling bottoms than tops. Simple reason is when market falls retail traders panic and increase volatility, and professionals come in and capitalize on the situation. At market tops there is no one panicking... just liquidity drying up.
The FE green triangles are "Filtered Entries"
The AE green triangles are "Aggressive Filtered Entries"


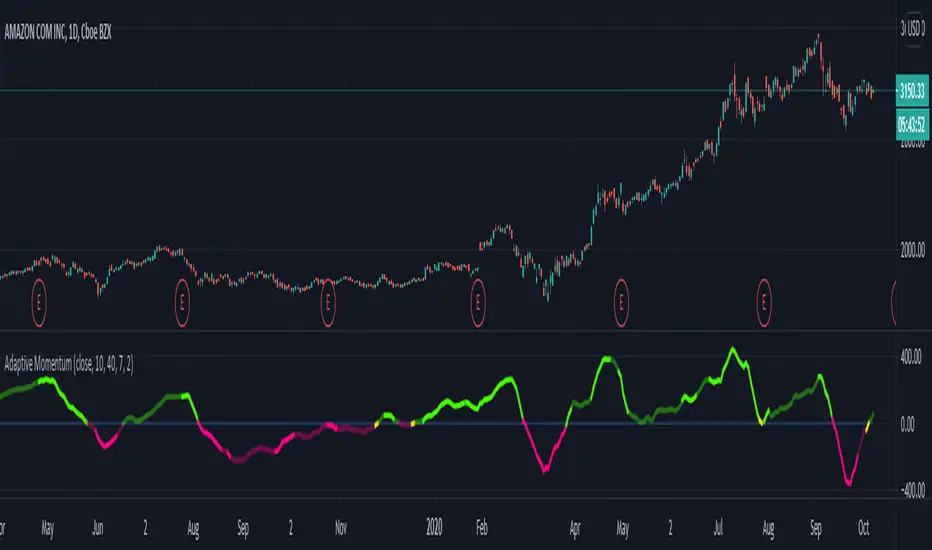
Adaptive MomentumAdaptive momentum indicator that uses the NEW Dynamic Length Arguments! Shows how to use volatility to shorten or lengthen the momentum period.
Based on pinescript blog example but with my own modifications.
Bright Green: Sharp movement above zero line
Bright Red: Sharp movement below zero line
Light Green: Slower movement above zero line
Light Red: Slower movement below zero line.
Yellow: Reversal might occur (near the zero line either side).
Thumb rule: Below zero line - SELL. Above zero line - BUY
VIX MTF MomentumSweet little momentum gadget to track the VIX Index.
What is the VIX?
The CBOE S&P 500 Volatility Index (VIX) is known as the 'Fear Index' which can measure how worried traders are that the S&P 500 might suddenly drop within the next 30 days.
When the VIX starts moving higher, it is telling you that traders are getting nervous. When the VIX starts moving lower, it is telling you that traders are gaining confidence.
VIX calculation?
The Chicago Board of Options Exchange Market Volatility Index (VIX) is a measure of implied volatility (Of the S&P 500 securities options), based on the prices of a basket of S&P 500 Index options with 30 days to expiration.
How to use:
If VIX Momentum is above 0 (RED) traders are getting nervous.
If VIX Momentum is below 0 (GREEN) traders are gaining confidence.
Follow to get updates and new scripts: www.tradingview.com

Volume Weighted MomentumThis momentum indicator uses the vwap.
U can see trend momentum and change and squeeze of momentum which can indicate that a bigger move is in preperation.

Squeeze Momentum Strategy based on Indicator [LazyBear][Bitduke]I improved Squeeze Momentum Indicator by LazyBear (momentum filter, changed data source to ohlc4) and transformed it into a strategy, adding a risk management system + ability to customize time frames for backtest.
Shortly about Squeeze Momentum Indicator:
This is a derivative of John Carter's "TTM Squeeze" volatility indicator, as discussed in his book "Mastering the Trade" (chapter 11).
Backtested on XBTUSD, ETHUSD (Bitmex). As you may notice it shows good results on 1h - 4h timeframes on these timeframes among these pairs. Relatively low drawdown ~ 12% (to date).

Rsi momentum experimentalThis is RSI momentum , I try to make it as experiment so I hope it not bad:)
the up strength is in blue and the down momentum is in red


Dynamic Momentum Index (DMI) Backtest This indicator plots Dynamic Momentum Index indicator. The Dynamic Momentum
Index (DMI) was developed by Tushar Chande and Stanley Kroll. The indicator
is covered in detail in their book The New Technical Trader.
The DMI is identical to Welles Wilder`s Relative Strength Index except the
number of periods is variable rather than fixed. The variability of the time
periods used in the DMI is controlled by the recent volatility of prices.
The more volatile the prices, the more sensitive the DMI is to price changes.
In other words, the DMI will use more time periods during quiet markets, and
less during active markets. The maximum time periods the DMI can reach is 30
and the minimum is 3. This calculation method is similar to the Variable
Moving Average, also developed by Tushar Chande.
The advantage of using a variable length time period when calculating the RSI
is that it overcomes the negative effects of smoothing, which often obscure short-term moves.
The volatility index used in controlling the time periods in the DMI is based
on a calculation using a five period standard deviation and a ten period average
of the standard deviation.
You can change long to short in the Input Settings
WARNING:
- For purpose educate only
- This script to change bars colors.

Log MomentumJust like regular momentum indicator except calculated in log space and with a horizontal line centered at zero for easier analysis

