DCA After Downtrend v2 (by BHD_Trade_Bot)The purpose of the strategy is to identify the end of a short-term downtrend . So that you can easily to DCA certain amount of money for each month.
ENTRY
The buy orders are placed on a monthly basis for assets at the end of a short-term downtrend:
- Each month condition: In 1-hour time frame, each month has 24 * 30 candles
- The end of short-term downtrend condition: use MACD for less delay
CLOSE
The sell orders are placed when:
- Is last bar
The strategy use $1000 and trading fee is 1.1% for each order.
Pro tip: The 1-hour time frame has the best results on average:
- Total spent: $1000 x 33 = $33,000
- Total profit: $65,578
"order"に関するスクリプトを検索

DCA After Downtrend (by BHD_Trade_Bot)The purpose of the strategy is to identify the end of a short-term downtrend . So that you can easily to DCA certain amount of money for each month.
ENTRY
The buy orders are placed on a monthly basis for assets at the end of a short-term downtrend:
- Each month condition: In 1-hour time frame, each month has 240 candles
- The end of short-term downtrend condition: use MACD for less delay
CLOSE
The sell orders are placed when:
- Is last bar
The strategy use $1000 and trading fee is 0.1% for each order.
Pro tip: The 1-hour time frame for TSLA has the best results on average:
- Total spent: $1000 x 85 = $85,000
- Total profit: $790,556

myAlertsLibrary "myAlerts"
My Alerts Functions - To use with autoview
f_order(_price, _qty, _position, _account, _exchange, _i, i_qtyTypeOrder, typeMsg, syminfoticker)
- Write the entry order message
Parameters:
_price : - The order price
_qty : - The order quantity
_position : - The order side
_account : - The user account
_exchange : - The user exchange
_i : - Used for multi-accounts, this represents the index of accounts
i_qtyTypeOrder : - String used to set Thether or Bitcoin Type Orders
typeMsg : - True = Autoview; False = Metatrader
syminfoticker : - Ticker
Returns: - Returns the open order message
f_stop(_stop_price, _slLimit_price, _account, _exchange, _i, i_delayOrders, typeMsg, syminfoticker)
- Write the stop order message
Parameters:
_stop_price : - The order stop price
_slLimit_price : - The order stop limit price
_account : - The user account
_exchange : - The user exchange
_i : - Used for multi-accounts, this represents the index of accounts
i_delayOrders : - Time in seconds to delay command on autoview
typeMsg : - True = Autoview; False = Metatrader
syminfoticker : - Ticker
Returns: - Returns the open order message
f_take(_take_price, _account, _exchange, _i, i_delayOrders, typeMsg, syminfoticker)
- Write the stop order message
Parameters:
_take_price : - The order stop price
_account : - The user account
_exchange : - The user exchange
_i : - Used for multi-accounts, this represents the index of accounts
i_delayOrders : - Time in seconds to delay command on autoview
typeMsg : - True = Autoview; False = Metatrader
syminfoticker : - Ticker
Returns: - Returns the open order message
f_update(_account, _exchange, _i, i_delayOrders, typeMsg, syminfoticker)
- Write the update order message
Parameters:
_account : - The user account
_exchange : - The user exchange
_i : - Used for multi-accounts, this represents the index of accounts
i_delayOrders : - Time in seconds to delay command on autoview
typeMsg : - True = Autoview; False = Metatrader
syminfoticker : - Ticker
Returns: - Returns the open order message
f_exit(_account, _exchange, _i, i_delayOrders, typeMsg, syminfoticker)
- Write the exit order message
Parameters:
_account : - The user account
_exchange : - The user exchange
_i : - Used for multi-accounts, this represents the index of accounts
i_delayOrders : - Time in seconds to delay command on autoview
typeMsg : - True = Autoview; False = Metatrader
syminfoticker : - Ticker
Returns: - Returns the open order message
f_hedge(_account, _exchange, _i, i_delayOrders, typeMsg, syminfoticker)
- Write the exit order message
Parameters:
_account : - The user account
_exchange : - The user exchange
_i : - Used for multi-accounts, this represents the index of accounts
i_delayOrders : - Time in seconds to delay command on autoview
typeMsg : - True = Autoview; False = Metatrader
syminfoticker : - Ticker
Returns: - Returns the open order message
Multi Yield CurveAn inversion between the 2 year and 10 year US treasury yield generally means a recession within 2 years. But the yield curve has more to it than that. This script helps analysis of the current and past yield curve (not limited to US treasury) and is very configurable.
"A yield curve is a line that plots yields (interest rates) of bonds having equal credit quality but differing maturity dates. The slope of the yield curve gives an idea of future interest rate changes and economic activity." (Investopedia)
When the slope is upward (longer maturity bonds have a higher interest rate than shorter maturity bonds), it generally means the economy is doing well and is expanding. When the slope is downward it generally means that there is more downside risk in the future.
The more inverted the curve is, and the more the inversion moves to the front, the more market participants are hedging against downside risk in the future.
The script draws up to 4 moments of a yield curve, which makes it easy to compare the current yield curve with past yield curves. It also draws lines in red when that part of the curve is inverted.
The script draws the lines with proper length between maturity (which most scripts do not) in order to make it more representative of the real maturity duration. The width cannot be scaled because TradingView does not allow drawing based on pixels.
This script is the only free script at time of writing with proper lengths, showing multiple yield curves, and being able to show yield curves other than the US treasury.
█ CONFIGURATION
(The following can be configured by clicking "Settings" when the script is added to a chart)
By default the script is configured to show the US treasury (government bond) yields of all maturities, but it can be configured for any yield curve.
A ticker represents yield data for a specific maturity of a bond.
To configure different tickers, go to the "TICKERS" section. Tickers in this section must be ordered from low maturity to high maturity.
• Enable: draw the ticker on the chart.
• Ticker: ticker symbol on TradingView to fetch data for.
• Months: amount of months of bond maturity the ticker represents.
To configure general settings, go to the "GENERAL" section.
• Period: used for calculating how far back to look for data for past yield curve lines. See "Times back" further in this description for more info.
• Min spacing: minimum amount of spacing between labels. Depending on the size of the screen, value labels can overlap. This setting sets how much empty space there must be between labels.
• Value format: how the value at that part of the line should be written on the label. For example, 0.000 means the value will have 3 digits precision.
To configure line settings per yield curve, each has its own "LINE" section with the line number after it.
• Enable: whether to enable drawing of this line.
• Times back: how many times period to go back in time. When period is D, and times value is 2, the line will be of data from 2 days ago.
• Color: color of the line when not inverted.
• Style: style of the line. Possible values: sol, dsh, dot
• Inversion color: color of the line when the curve inverses between the two maturities at that part of the curve.
• Thickness: thickness of the line in pixels.
• Labels: whether to draw value labels above the line. By default, this is only enabled for the first line.
• Label text color: text color of value label.
• Label background color: background color of value label.
To configure the durations axis at the bottom of the chart, go to the "DURATIONS" section.
• Durations: whether to show maturity term duration labels below the chart.
• Offset: amount to offset durations label to be below chart.
█ MISC
Script originally inspired by the US Treasury Yield Curve script by @longfiat but has been completely rewritten and changed.

All TimeFrame OscillatorsI have always fighted to understand the market direction because it looks different on different timeframes.
I wanted an indicator where I can see all the different timeframes at once.
This indicator shows already existing oscillators but not only in the current chart's timeframe, but all the most important higer timeframes at once.
I have started with the stoch, then added as many oscillators as I could.
Experimenting with this I have saw that confluence of 4H 1D and 1W Stoch can be very interesting and can highlight higher timeframe take profit areas and sometimes major tops/bottoms.
Also bounces can be interesting when a lower timeframe stoch is bounced or rejected from a higher one.
Oscillators:
Stoch - Stochastic Oscillator
SMI - Stochastic Momentum Index
Rsi - Relative Strength Index
StochRsi - Stochastic RSI
WaveTrend - Vumanchu alias Market Cypher Wave Trend line
CCI - Commodity Channel Index
CCIStoch - Stochastic CCI
Williams Percent Range - Williams %R
Norm. MACD - Normalized Moving Average Convergence Divergence
Norm. MACD Hist - Normalized MACD Histogramm
PVT - Normalized Price Volume Trend
MFI - Money Flow Index
CMF - Chaikin Money Flow
Chande Momentum - Chande Momentum
Volume - Normalized Volume
CandleValue - Vumanchu alias Market Cypher MoneyFlow
BBWP - Bollinger Band Width Percentile
Line Type
Smooth: lines are smoothed, but the actualy not closed values are not shown
Step: Step lines, the actually open timeframes are calculated as they closed at the current values
Plot Oscillator or it's Slope:
its possible to not plot the oscillator but it's slope
Print dots when:
Cross Up/Down oversold/overbougt level - best for most oscillators. for example when Stoch crosses above 20 or below 80
Cross os/ob and the one higher TF is about to cross - when it's crosses beolw 80 and the higher timeframe oscillator is still above ans sloping down
Cross above/below middle line - for example on RSI being above or below 50 can be interesting
Print triangles when:
All Slope Match - all visible timeframe lines are pointing up or down at the same time
All above/belove middle line - all visible lines are above or belove the middle line
All above/belove middle line and slope match - like the previous one and the slope direction is the same
All above/below oversold/overbougt - all lines are above or below os/ ob. this is the default. it can be a very important confluence
Lower TF in order - 5, 15, 30, 60 minute timeframes are in order.
Higher TF in order - 4H 1D 1W in order (like 4H above 1D abd 1D above 1W). can be interesting at RSI
4H-1D in order - 4H 1D in order .
Print triangles
Print all triangles - print all triangles when the condition is met
Print only first triangles - only show when the condition starts to met
Print only last triangles - small triangles when the condition met first, large when last. tis is the default.
Timeframes to show:
You can turn on/off different timeframs to show or not from the list below:
1m 5m 15m 30m 1H 4H D 5D W M
This is for experimenting/ understanding the market direction on multiple timeframes at once.
Don't take it's signals (and any other indicator's) as exact trade signals. use it as confirmation instead.
Any comments, insights, ideas are welcome.

Extreme Bars"Extreme Bars" is a simple but useful indicator that marks overbought and oversold candles. This indicator paints candles that fall far above the average red, and the candles that rise above the average green. Of course, they can change these colors if they want. "Extreme Bars" can be interpreted in many different ways. The starting points of colored candles can often be good support or resistance. In addition, it would be wise to close the positions opposite the colored candles and to maintain the positions compatible with the colored candles. It is also possible that the gaps formed by the colored candles will be closed in the future. The sensitivity of the indicator can be changed in the settings section.

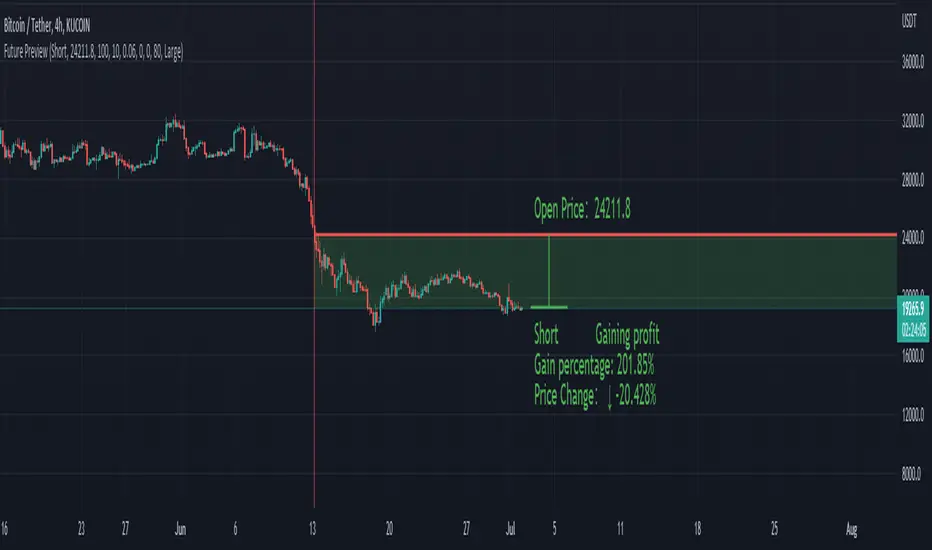
Future PreviewFuture Preview
Calculate real-time future order profit with open price, leverage and commission fee. Simple and straight forward. If you need any additional feature, please leave a comment below. I am glad to help.
Usage:
When adding Future Preview to chart, it will ask order open time and open price on the chart by clicking with left mouse on the desired value. These value can be changed lately, as well as the leverage and commission fee. Default leverage is 10 and default commission fee is 0.06% (taker).
There will be two horizontal lines. The solid longer line is the open price line, it shows the order open price. The shorter line moving with real-time price is the current price line, it shows the current price. There will be preview data shows on top or below the price line. Open price line is red for short order and green for long order. The current price line is red when the order is losing and it is green when it profiting. The back ground color follows the color of current price line. Background color transparency and gain/loss color can be changed in options.
There will be one horizontal line on the left if the option of showing open time is on (default is on). It shows the time stamp when current order opened.
After adding Future Preview to chart, there is option to add Taking Profit(TP) or Stop Loss(SL) to the chart.
Font size can be changed in option
STPFunctionsLibrary "STPFunctions"
These functions are used as part of the STP trading strategy and include commonly used candle patterns, trade triggers and frequently monitored stock parameters
MAs() Determines if the last price is abover or below key moving averages. MAs used on the daily are SMA20, SMA50 and SMA200. SMA20 and SMA50 are used intraday.
Returns: 1 if the last price/close was over the moving averages. -1 is returned if the last price/close is below the moving averages. 0 is returned otherwise.
HTFOrderFlow(HTF1_open, HTF2_open) Determine the state of the higher time frame order flow.
Parameters:
HTF1_open : float value representing the higher time frame open.
HTF2_open : float value representing the higher time frame open.
Returns: 1 if the last price/close was over the higher time frame open. -1 is returned if the last price/close is below the higher time frame open. 0 is returned otherwise.
OrderFlow() Determine the recent order flow... basically are we well bid or well offered
Returns: 1 if the last 2 candles are well bid. -1 is returned if the last 2 candles are well offered. 0 is returned otherwise.
isInside() Used to flag inside candles
Returns: 1 if the close >= open. -1 is returned if the close <= open. 0 is returned otherwise.
isOutside() Used to flag outside or engulfing candles
Returns: 1 if the close >= open. -1 is returned if the close <= open. 0 is returned otherwise.
isUTN() Used to flag the U-turn reversal pattern
Returns: 1 for a BUTN. -1 is returned for a BRUTN. 0 is returned otherwise.
isSNapBack() Flag for Snapback Entries
Returns: 1 for a bullish snapback setup. -1 is returned for a bearish snapback setup. 0 is returned otherwise.

Multi-Timeframe Squeeze Pro/DIM/Momentum/MAIMPORTANT NOTE:
-> The table will not display any timeframes lower than the current one
-> This indicator combine multiple popular indicators and give ability to use them on Multiple timeframes (MFT)
-> Indicators used for the MFT are: Squeeze / Momentum / 10X DIM and Stacked MA (or EMA)
-> Give at glance a good way to see the trend all different timeframes
-> If you are using in combination with squeeze pro please use the one from @Beardy_Fred since it matches the colours and condition used
Credits :
-> J. Welles Wilder creating the Directional Movement System (DMS) (1978); and
-> John Carter applying the DMS to create the popular Simpler Trading 10X Bars indicator.
-> @Beardy_Fred creating a first version including MOM and SQZ
-> Makit0's evolution of Lazybear's script to factor in the TTM Squeeze Pro upgrades - Squeeze PRO Arrows
I have adapted the version from @Beardy_Fred to provide a more complete and customisable indicator while including also the Stacked EMA/MA for further validation
Explanation:
You can learn more about each indicators following those links:
Squeeze Pro:
10X:
Momentum Histogram:
The stacked EMA/MA highlights when the MA/EMA are in order:
Red when they are stacked from the highest to the lowest
Green when they are stacked from the lowest to the highest
Yellow when they are stacked without a clear order
Customisation:
You can customise:
Timeframes
Settings for each indicators (10X/MA/Momentum/Squeeze)
Colors
Visibility
Trade Signals:
If you are going Long, Since this is a combination ideally on the timeframe you are trading you should have all green + green on the above timeframes (those colors are the default ones but can be changed)
-> Green on 10X indicator meaning you are in an uptrend
-> EMA or MA (depending on the configuration of the indicator) Green meaning EMA or MA
-> Squeeze should be Orange or Red ideally (indicating an high or medium Squeeze)
-> Momentum should be Cyan indicating an increase in momentum (while Dark Blue could indicate a reversal)
Standalone indicators:
- Squeeze Pro
- 10X Bar
- Stacked MA
- Momentum

Manual Harmonic Patterns - With interactive inputsThis script is a drawing tool which allows users to draw XABCD on the chart and script will tell whether there is any harmonic patterns on the drawings made. The script is based on interactive inputs and requires users to chose XABCD points.
Please note
This is not a scanner and it will not scan historical bars for harmonic patterns. This needs to be used rather as drawing tool instead.
Script will not check if selected pivots are correct. It assumes users to know how to select the right XABCD based on pivot high/lows. Bullish pattern will have X, B and D as pivot lows and A,C as pivot highs. Similarly bearish patterns will have X, B, D as pivot highs and A, C as pivot lows.
Script will not check for overflow conditions. For example, if price crosses, XB or BD line, then pattern is considered to be invalid. But, this check cannot be made in this script and we require users to be aware of this condition and select input accordingly.
Order of inputs should be in ascending order. X pivot should come before A and then, B, C, D and F. This again is users responsibility to select pivots in right order.
What happens after selecting XABCD?
If selected pattern is valid harmonic pattern, it will
Draw XABCD lines and labels
Fill harmonic triangles
Show PRZ box which shoes the name of valid patterns.
If it is not valid harmonic pattern, then users will see blank XABCD line without any PRZ or filled harmonic triangles.
Example:
1. When it is valid pattern
2. When it is not valid pattern

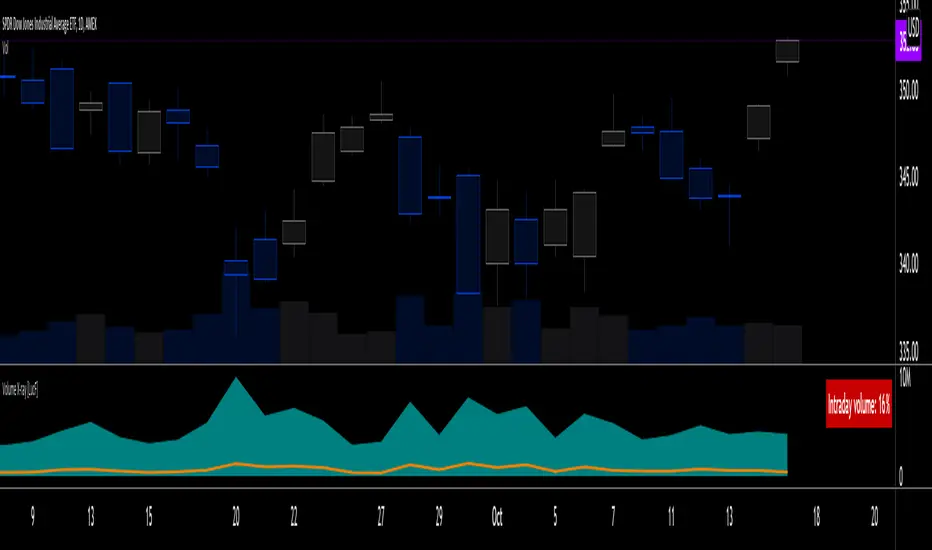
Volume X-ray [LucF]█ OVERVIEW
This tool analyzes the relative size of volume reported on intraday vs EOD (end of day) data feeds on historical bars. If you use volume data to make trading decisions, it can help you improve your understanding of its nature and quality, which is especially important if you trade on intraday timeframes.
I often mention, when discussing volume analysis, how it's important for traders to understand the volume data they are using: where it originates, what it includes and does not include. By helping you spot sizeable differences between volume reported on intraday and EOD data feeds for any given instrument, "Volume X-ray" can point you to instruments where you might want to research the causes of the difference.
█ CONCEPTS
The information used to build a chart's historical bars originates from data providers (exchanges, brokers, etc.) who often maintain distinct historical feeds for intraday and EOD timeframes. How volume data is assembled for intraday and EOD feeds varies with instruments, brokers and exchanges. Variations between the two feeds — or their absence — can be due to how instruments are traded in a particular sector and/or the volume reporting policy for the feeds you are using. Instruments from crypto and forex markets, for example, will often display similar volume on both feeds. Stocks will often display variations because block trades or other types of trades may not be included in their intraday volume data. Futures will also typically display variations. It is even possible that volume from different feeds may not be of the same nature, as you can get trade volume (market volume) on one feed and tick volume (transaction counts) on another. You will sometimes be able to find the details of what different feeds contain from the technical information provided by exchanges/brokers on their feeds. This is an example for the NASDAQ feeds . Once you determine which feeds you are using, you can look for the reporting specs for that feed. This is all research you will need to do on your own; "Volume X-ray" will not help you with that part.
You may elect to forego the deep dive in feed information and simply rely on the figure the indicator will calculate for the instruments you trade. One simple — and unproven — way to interpret "Volume X-ray" values is to infer that instruments with larger percentages of intraday/EOD volume ratios are more "democratic" because at intraday timeframes, you are seeing a greater proportion of the actual traded volume for the instrument. This could conceivably lead one to conclude that such volume data is more reliable than on an instrument where intraday volume accounts for only 3% of EOD volume, let's say.
Note that as intraday vs EOD variations exist for historical bars on some instruments, there will typically also be differences between the realtime feeds used on intraday vs 1D or greater timeframes for those same assets. Realtime reporting rules will often be different from historical feed reporting rules, so variations between realtime feeds will often be different from the variations between historical feeds for the same instrument. A deep dive in reporting rules will quickly reveal what a jungle they are for some instruments, yet it is the only way to really understand the volume information our charts display.
█ HOW TO USE IT
The script is very simple and has no inputs. Just add it to 1D charts and it will calculate the proportion of volume reported on the intraday feed over the EOD volume. The plots show the daily values for both volumes: the teal area is the EOD volume, the orange line is the intraday volume. A value representing the average, cumulative intraday/EOD volume percentage for the chart is displayed in the upper-right corner. Its background color changes with the percentage, with brightness levels proportional to the percentage for both the bull color (% >= 50) or the bear color (% < 50). When abnormal conditions are detected, such as missing volume of one kind or the other, a yellow background is used.
Daily and cumulative values are displayed in indicator values and the Data Window.
The indicator loads in a pane, but you can also use it in overlay mode by moving it on the chart with "Move to" in the script's "More" menu, and disabling the plot display from the "Settings/Style" tab.
█ LIMITATIONS
• The script will not run on timeframes >1D because it cannot produce useful values on them.
• The calculation of the cumulative average will vary on different intraday timeframes because of the varying number of days covered by the dataset.
Variations can also occur because of irregularities in reported volume data. That is the reason I recommend using it on 1D charts.
• The script only calculates on historical bars because in real time there is no distinction between intraday and EOD feeds.
• You will see plenty of special cases if you use the indicator on a variety of instruments:
• Some instruments have no intraday volume, while on others it's the opposite.
• Missing information will sometimes appear here and there on datasets.
• Some instruments have higher intraday than EOD volume.
Please do not ask me the reasons for these anomalies; it's your responsibility to find them. I supply a tool that will spot the anomalies for you — nothing more.
█ FOR PINE CODERS
• This script uses a little-known feature of request.security() , which allows us to specify `"1440"` for the `timeframe` argument.
When you do, data from the 1min intrabars of the historical intraday feed is aggregated over one day, as opposed to the usual EOD feed used with `"D"`.
• I use gaps on my request.security() calls. This is useful because at intraday timeframes I can cumulate non- na values only.
• I use fixnan() on some values. For those who don't know about it yet, it eliminates na values from a series, just like not using gaps will do in a request.security() call.
• I like how the new switch structure makes for more readable code than equivalent if structures.
• I wrote my script using the revised recommendations in the Style Guide from the Pine v5 User Manual.
• I use the new runtime.error() to throw an error when the script user tries to use a timeframe >1D.
Why? Because then, my request.security() calls would be returning values from the last 1D intrabar of the dilation of the, let's say, 1W chart bar.
This of course would be of no use whatsoever — and misleading. I encourage all Pine coders fetching HTF data to protect their script users in the same way.
As tool builders, it is our responsibility to shield unsuspecting users of our scripts from contexts where our calcs produce invalid results.
• While we're on the subject of accessing intrabar timeframes, I will add this to the intention of coders falling victim to what appears to be
a new misconception where the mere fact of using intrabar timeframes with request.security() is believed to provide some sort of edge.
This is a fallacy unless you are sending down functions specifically designed to mine values from request.security() 's intrabar context.
These coders do not seem to realize that:
• They are only retrieving information from the last intrabar of the chart bar.
• The already flawed behavior of their scripts on historical bars will not improve on realtime bars. It will actually worsen because in real time,
intrabars are not yet ordered sequentially as they are on historical bars.
• Alerts or strategy orders using intrabar information acquired through request.security() will be using flawed logic and data most of the time.
The situation reminds me of the mania where using Heikin-Ashi charts to backtest was all the rage because it produced magnificent — and flawed — results.
Trading is difficult enough when doing the right things; I hate to see traders infected by lethal beliefs.
Strive to sharpen your "herd immunity", as Lionel Shriver calls it. She also writes: "Be leery of orthodoxy. Hold back from shared cultural enthusiasms."
Be your own trader.
█ THANKS
This indicator would not exist without the invaluable insights from Tim, a member of the Pine team. Thanks Tim!
ROC_PA_Strategy (A3Sh)Hi there,
An experiment with rate of price change in combination with price averaging. The strategy is inspired by Price Change Scalping Strategy developed by Prosum Solutions and Scalping Dips On Trend Strategy developed by Coinrule. Both strategies look at the percentage of price change to open orders.
When the price drops beyond a specified percentage, a order entry threshold (yellow line) is setup. The order entry threshold is only active for a specified number of bars and will de-activate when not crossed within the specified number of bars. When the price drops further and crosses the entry threshold with a minimum of a specified percentage, a long position is entered. The same reverse logic (white line) used to close the long position.
I first ran the strategy without stop loss and take profit and that worked very well in a bullish market. I later added stop loss and take profit and that seems to work better in a side ways or bearisch market. There are a lot of tweaking possibilities in the settings.
In the settings you can specify the percentage of portfolio to use for each trade to spread the risk and for each order a trading fee of 0.075% is calculated.

Bollinger Bands strategy with RSI and MACD v1.0 This is a strategy based on the Bollinger Bands, where buy trades are made when the price crosses the lower line of the Bollinger Bands upwards, and sell trades are made when the price crosses the upper line downwards.
In addition, it is possible through the inputs to enable trading with RSI and MACD, so that buy or sell trades are supported by these two indicators.
Trades are partially and fully closed in the following way, a buy trade will close half of the position when the price touches the middle line of the Bollinger bands and will be fully closed when the price touches the upper band. In the case of a sell position, half of the position will be closed if the price touches the middle band and the entire position will be closed when the price touches the lower band. Alternatively, a fixed take profit can be placed. In case the price moves against us, trailing stops can be placed.
In case of selecting to use RSI, MACD, or MACD variation, trades will be executed as long as The Bollinger Bands, and all the above-mentioned indicators give the same signals, either buy or sell.
For example in the case of selecting only Use RSI, buy trades would be made as long as RSI and BB give buy signals.
Strategy inputs:
-BB source: Bollinger Bands price source.
-Bollinger Bands SMA length: Bollinger Bands simple moving average length.
-Bollinger Bands StdDev length: Bollinger Bands standard deviation length.
-Trail Long Loss (%): Distance in percentage at which the stop loss will initially be placed for buy trades.
-Trail Short Loss (%): Distance in percentage at which the stop loss will be initially placed for sell trades.
-Maximum orders: Maximum of simultaneous operations, for example, if it is 3, up to 3 parallel operations of buy and up to 3 parallel operations of sell will be carried out.
-Position size: Number of contracts per trade.
-Use RSI: If selected, the strategy will also trade based on oversold or overbought signals provided by the RSI.
-RSI source: RSI price source.
-RSI period: The RSI period to use.
-RSI value for buy: If the RSI is below this value, it will give a buy signal.
-RSI value for sell: If the RSI value is above this value, it will give a sell signal.
-Use MACD: If selected, buy trades will be made when the MACD crosses 0 upwards, and sell trades will be made when the MACD crosses 0 downwards.
-Use MACD variation: Only available if MACD is previously selected. In this case, buy trades are made if the MACD value in the last 3 candles has been decreasing, and sell trades are made if the MACD value has been increasing.
-MACD source: MACD price source.
-MACD fast length: MACD fast EMA lenght.
-MACD slow length: MACD slow EMA lenght.
-MACD signal length: MACD signal EMA lenght.
-Use maximum TP long: If selected, a fixed take profit will be placed for buy trades. The position could be closed before reaching this take profit if the price touches one of the lower or upper lines first.
-Maximum take profit long (%): Distance in percentage at which the take profit will be placed for buy trades.
-Use maximum TP short: if selected, a fixed take profit will be placed for sell trades. The position could be closed before reaching this take profit if the price touches one of the lower or upper lines first.
-Maximum take profit short (%): Distance in percentage at which the take profit will be set for sell trades.
I hope you like it and as always all feedback is welcome.

[blackcat] L2 Ehlers FilterLevel: 2
Background
John F. Ehlers introuced Ehlers Filter in his "Rocket Science for Traders" chapter 18 on 2001.
Function
blackcat L2 Ehlers Filter is used to follow trend. The filters Dr. Ehlers have invented are nonlinear FIR filters. It turns out that they provide both extraordinary smoothing in sideways markets and aggressively follow major price movements with minimal lag. The development of Ehlers filters starts with a general
class of FIR filters called Order Statistic (OS) filters. These filters are well-known for speech and image processing, to sharpen edges, increase contrast, and for robust estimation. In contrast to linear filters, where temporal ordering of the samples is preserved, OS filters base their operation on the ranking of samples
within the filter window. The data are ranked by their summary statistics, such as their mean or variance, rather than by their temporal position.
Among OS filters, the Median filter is the best known. In a Median filter, the output is the median value of all the data values within the observation window. As opposed to an averaging filter, the Median filter simply discards all data except the median value. In this way, impulsive noise spikes and extreme price data are eliminated rather than included in the average. The median value can fall at the first sample in the data window, at the last sample, or anywhere in between. Thus, temporal characteristics are lost. The Median filter tends to smooth out short-term variations that lead to whipsaw trades with linear filters. However, the lag of a Median filter in response to a sharp and sustained price movement is substantial --- it necessarily is about half the filter window width.
Key Signal
Coef --> Ehlers filter coefficients array
Filt --> Ehlers filter output
Pros and Cons
100% John F. Ehlers definition translation of original work, even variable names are the same. This help readers who would like to use pine to read his book. If you had read his works, then you will be quite familiar with my code style.
Remarks
The 14th script for Blackcat1402 John F. Ehlers Week publication.
Readme
In real life, I am a prolific inventor. I have successfully applied for more than 60 international and regional patents in the past 12 years. But in the past two years or so, I have tried to transfer my creativity to the development of trading strategies. Tradingview is the ideal platform for me. I am selecting and contributing some of the hundreds of scripts to publish in Tradingview community. Welcome everyone to interact with me to discuss these interesting pine scripts.
The scripts posted are categorized into 5 levels according to my efforts or manhours put into these works.
Level 1 : interesting script snippets or distinctive improvement from classic indicators or strategy. Level 1 scripts can usually appear in more complex indicators as a function module or element.
Level 2 : composite indicator/strategy. By selecting or combining several independent or dependent functions or sub indicators in proper way, the composite script exhibits a resonance phenomenon which can filter out noise or fake trading signal to enhance trading confidence level.
Level 3 : comprehensive indicator/strategy. They are simple trading systems based on my strategies. They are commonly containing several or all of entry signal, close signal, stop loss, take profit, re-entry, risk management, and position sizing techniques. Even some interesting fundamental and mass psychological aspects are incorporated.
Level 4 : script snippets or functions that do not disclose source code. Interesting element that can reveal market laws and work as raw material for indicators and strategies. If you find Level 1~2 scripts are helpful, Level 4 is a private version that took me far more efforts to develop.
Level 5 : indicator/strategy that do not disclose source code. private version of Level 3 script with my accumulated script processing skills or a large number of custom functions. I had a private function library built in past two years. Level 5 scripts use many of them to achieve private trading strategy.
[blackcat] L1 Close Histogram OscillatorLevel: 1
Background
A histogram is a special chart that is applied to statistical data that is divided into numerically ordered groups. For example groups with close relationships in the vicinity like "Close-ref(Close ,1)", "Close-ref(Close,2)" and so on. A histogram provides a snapshot of all the data so that you can quickly get an overview of the historical data, especially its general shape.In a histogram, the bars are linked - in contrast to a bar chart for categorical data, in which the bars represent categories that are in no particular order and are separated. The height of each bar in a histogram indicates either the number of individuals (called the frequency) in each group or the percentage of individuals (the relative frequency) in each group. Each individual in the data set falls into exactly one bar.
Function
L2 Close Histogram Oscillator is a novel overbought and oversold indicator that estimate the trend state by counting a specific bar relationship nearby. Once nearby bars reach consensus, it may spread to global quickly. The reason why I got this inspiration is because I have been engaged in the research of blockchain consensus mechanism. The market is a complex system, and its consensus depends on the common human characteristics: greed and fear. The trend of the market often also conforms to sociological characteristics. Maybe it's a bit complicated for me to say that. However, if you understand the principle of the spread of rumors and viruses, you can understand the situation where some individuals in the market have local consensus and gradually spread to the overall situation. This is the process of trend formation.
Key Signal
fastcounter --> fast close histogram counters
slowcounter --> slow close histogram counters
attention --> bottom price appears, with height of 10 in white
readybuy --> a small position buy opportunity after first bottom detected, with height of 20 in yellow
buylow --> a small position buy at low price, with height of 30 in lime
longentry --> a confirmed long entry signal by close histogram counter, with height of 40 in green
risk --> oscillator top is reached and trend reversal may happen, with height drop from 100 to 80 in red
Pros and Cons
Pros:
1. since this is based on consensus formation principle, i think this is a leading indicator by spreading local consensus to global
2. it is an oscillator, overbought and oversold can be easily observed.
Cons:
1. the model is not complex enough to depict market behavior exactly.
2. sideways and chop market will make this indicator's output hard to read.
Remarks
This is rare! I combined my previous theory of developing cellular automata with the market to produce such a weird indicator. I hope to inspire everyone and study market behavior in a deeper level.
Readme
In real life, I am a prolific inventor. I have successfully applied for more than 60 international and regional patents in the past 12 years. But in the past two years or so, I have tried to transfer my creativity to the development of trading strategies. Tradingview is the ideal platform for me. I am selecting and contributing some of the hundreds of scripts to publish in Tradingview community. Welcome everyone to interact with me to discuss these interesting pine scripts.
The scripts posted are categorized into 5 levels according to my efforts or manhours put into these works.
Level 1 : interesting script snippets or distinctive improvement from classic indicators or strategy. Level 1 scripts can usually appear in more complex indicators as a function module or element.
Level 2 : composite indicator/strategy. By selecting or combining several independent or dependent functions or sub indicators in proper way, the composite script exhibits a resonance phenomenon which can filter out noise or fake trading signal to enhance trading confidence level.
Level 3 : comprehensive indicator/strategy. They are simple trading systems based on my strategies. They are commonly containing several or all of entry signal, close signal, stop loss, take profit, re-entry, risk management, and position sizing techniques. Even some interesting fundamental and mass psychological aspects are incorporated.
Level 4 : script snippets or functions that do not disclose source code. Interesting element that can reveal market laws and work as raw material for indicators and strategies. If you find Level 1~2 scripts are helpful, Level 4 is a private version that took me far more efforts to develop.
Level 5 : indicator/strategy that do not disclose source code. private version of Level 3 script with my accumulated script processing skills or a large number of custom functions. I had a private function library built in past two years. Level 5 scripts use many of them to achieve private trading strategy.

Noro's RiskChannel StrategyIndicator
The Donchian price channel is used. There are 2 methods available to close the position. The user can choose a method.
Wikipedia: en.wikipedia.org
Strategy #1 (stop-loss type = channel)
Old classic trading strategy, using breakouts of the Donchan price channel.
If the price is above the price channel top line, open the long position (and close the short position)
If the price is below the lower line of the price channel, open the short position (and close the long position)
It is recommended that you all use market stop orders.
Strategy #2 (stop-loss type = center)
This metod is better. This method is recommended.
The central line (red) is the middle of the Donchian price channel. Used to close any positions.
If the price is higher than the price channel top line, open the long position.
If the price is lower than the lower line of the price channel, open the short position.
If the price has crossed the central line of the channel, close any position.
It is recommended that you all use market stop orders.
Risk
There are 2 options. Risk for long positions and risk for short positions. This is the size of the possible loss. Order size depends on the possible loss and is calculated for each position.
For
BTC/USD, BTC/USDT, XBT/USD, ETH/USD, ETH/USD (need USD!)
Timeframes: 1h and length of price channel = 50 bars or 4h and length of price channel = 12

Delta Volume Candles [LucF]█ OVERVIEW
This indicator plots on-chart volume delta information using candles that can replace your normal candles, tops and bottoms appended to normal candles, optional MAs of those tops and bottoms levels, a divergence channel and a chart background. The indicator calculates volume delta using intrabar analysis, meaning that it uses the lower timeframe bars constituting each chart bar.
█ CONCEPTS
Volume Delta
The volume delta concept divides a bar's volume in "up" and "down" volumes. The delta is calculated by subtracting down volume from up volume. Many calculation techniques exist to isolate up and down volume within a bar. The simplest use the polarity of interbar price changes to assign their volume to up or down slots, e.g., On Balance Volume or the Klinger Oscillator . Others such as Chaikin Money Flow use assumptions based on a bar's OHLC values. The most precise calculation method uses tick data and assigns the volume of each tick to the up or down slot depending on whether the transaction occurs at the bid or ask price. While this technique is ideal, it requires huge amounts of data on historical bars, which considerably limits the historical depth of charts and the number of symbols for which tick data is available. Furthermore, historical tick data is not yet available on TradingView.
This indicator uses intrabar analysis to achieve a compromise between the simplest and most precise methods of calculating volume delta. It is currently the most precise method usable on TradingView charts. TradingView's Volume Profile built-in indicators use it, as do the CVD - Cumulative Volume Delta Candles and CVD - Cumulative Volume Delta (Chart) indicators published from the TradingView account . My Delta Volume Channels and Volume Delta Columns Pro indicators also use intrabar analysis. Other volume delta indicators such as my Realtime 5D Profile use realtime chart updates to calculate volume delta without intrabar analysis, but that type of indicator only works in real time; they cannot calculate on historical bars.
This is the logic I use to determine the polarity of intrabars, which determines the up or down slot where its volume is added:
• If the intrabar's open and close values are different, their relative position is used.
• If the intrabar's open and close values are the same, the difference between the intrabar's close and the previous intrabar's close is used.
• As a last resort, when there is no movement during an intrabar, and it closes at the same price as the previous intrabar, the last known polarity is used.
Once all intrabars making up a chart bar have been analyzed and the up or down property of each intrabar's volume determined, the up volumes are added, and the down volumes subtracted. The resulting value is volume delta for that chart bar, which can be used as an estimate of the buying/selling pressure on an instrument. Not all markets have volume information. Without it, this indicator is useless.
Intrabar analysis
Intrabars are chart bars at a lower timeframe than the chart's. The timeframe used to access intrabars determines the number of intrabars accessible for each chart bar. On a 1H chart, each chart bar of an active market will, for example, usually contain 60 bars at the lower timeframe of 1min, provided there was market activity during each minute of the hour.
This indicator automatically calculates an appropriate lower timeframe using the chart's timeframe and the settings you use in the script's "Intrabars" section of the inputs. As it can access lower timeframes as small as seconds when available, the indicator can be used on charts at relatively small timeframes such as 1min, provided the market is active enough to produce bars at second timeframes.
The quantity of intrabars analyzed in each chart bar determines:
• The precision of calculations (more intrabars yield more precise results).
• The chart coverage of calculations (there is a 100K limit to the quantity of intrabars that can be analyzed on any chart,
so the more intrabars you analyze per chart bar, the less chart bars can be calculated by the indicator).
The information box displayed at the bottom right of the chart shows the lower timeframe used for intrabars, as well as the average number of intrabars detected for chart bars and statistics on chart coverage.
Balances
This indicator calculates five balances from volume delta values. The balances are oscillators with a zero centerline; positive values are bullish, and negative values are bearish. It is important to understand the balances as they can be used to:
• Color candle bodies.
• Calculate body and top and bottom divergences.
• Color an EMA channel.
• Color the chart's background.
• Configure markers and alerts.
The five balances are:
1 — Bar Balance : This is the only balance using instant values; it is simply the subtraction of the down volume from the up volume on the bar, so the instant volume delta for that bar.
2 — Average Balance : Calculates a distinct EMA for both the up and down volumes, and subtracts the down EMA from the up EMA.
The result is akin to MACD's histogram because it is the subtraction of two moving averages.
3 — Momentum Balance : Starts by calculating, separately for both up and down volumes, the difference between the same EMAs used in "Average Balance" and
an SMA of twice the period used for the "Average Balance" EMAs. The difference for the up side is subtracted from the difference for the down side,
and an RSI of that value is calculated and brought over the −50/+50 scale.
4 — Relative Balance : The reference values used in the calculation are the up and down EMAs used in the "Average Balance".
From those, we calculate two intermediate values using how much the instant up and down volumes on the bar exceed their respective EMA — but with a twist.
If the bar's up volume does not exceed the EMA of up volume, a zero value is used. The same goes for the down volume with the EMA of down volume.
Once we have our two intermediate values for the up and down volumes exceeding their respective MA, we subtract them. The final value is an ALMA of that subtraction.
The rationale behind using zero values when the bar's up/down volume does not exceed its EMA is to only take into account the more significant volume.
If both instant volume values exceed their MA, then the difference between the two is the signal's value.
The signal is called "relative" because the intermediate values are the difference between the instant up/down volumes and their respective MA.
This balance flatlines when the bar's up/down volumes do not exceed their EMAs, which makes it useful to spot areas where trader interest dwindles, such as consolidations.
The smaller the period of the final value's ALMA, the more easily it will flatline. These flat zones should be considered no-trade zones.
5 — Percent Balance : This balance is the ALMA of the ratio of the "Bar Balance" over the total volume for that bar.
From the balances and marker conditions, two more values are calculated:
1 — Marker Bias : This sums the up/down (+1/‒1) occurrences of the markers 1 to 4 over a period you define, so it ranges from −4 to +4, times the period.
Its calculation will depend on the modes used to calculate markers 3 and 4.
2 — Combined Balances : This is the sum of the bull/bear (+1/−1) states of each of the five balances, so it ranges from −5 to +5.
The periods for all of these balances can be configured in the "Periods" section at the bottom of the script's inputs. As you cannot see the balances on the chart, you can use my Volume Delta Columns Pro indicator in a pane; it can plot the same balances, so you will be able to analyze them.
Divergences
In the context of this indicator, a divergence is any bar where the bear/bull state of a balance (above/below its zero centerline) diverges from the polarity of a chart bar. No directional bias is assigned to divergences when they occur. Candle bodies and tops/bottoms can each be colored differently on divergences detected from distinct balances.
Divergence Channel
The divergence channel is the space between two levels (by default, the bar's open and close ) saved when divergences occur. When price (by default the close ) has breached a channel and a new divergence occurs, a new channel is created. Until that new channel is breached, bars where additional divergences occur will expand the channel's levels if the bar's price points are outside the channel.
Prices breaches of the divergence channel will change its state. Divergence channels can be in one of three different states:
• Bull (green): Price has breached the channel to the upside.
• Bear (red): Price has breached the channel to the downside.
• Neutral (gray): The channel has not yet been breached.
█ HOW TO USE THE INDICATOR
I do not make videos to explain how to use my indicators. I do, however, try hard to include in their description everything one needs to understand what they do. From there, it's up to you to explore and figure out if they can be useful in your trading practice. Communicating in videos what this description and the script's tooltips contain would make for very long videos that would likely exceed the attention span of most people who find this description too long. There is no quick way to understand an indicator such as this one because it uses many different concepts and has quite a bit of settings one can use to modify its visuals and behavior — thus how one uses it. I will happily answer questions on the inner workings of the indicator, but I do not answer questions like "How do I trade using this indicator?" A useful answer to that question would require an in-depth analysis of who you are, your trading methodology and objectives, which I do not have time for. I do not teach trading.
Start by loading the indicator on an active chart containing volume information. See here if you need help.
The default configuration displays:
• Normal candles where the bodies are only colored if the bar's volume has increased since the last bar.
If you want to use this indicator's candles, you may want to disable your chart's candles by clicking the eye icon to the right of the symbol's name in the top left of the chart.
• A top or bottom appended to the normal candles. It represents the difference between up and down volume for that bar
and is positioned at the top or bottom, depending on its polarity. If up volume is greater than down volume, a top is displayed. If down volume is greater, a bottom is plotted.
The size of tops and bottoms is determined by calculating a factor which is the proportion of volume delta over the bar's total volume.
That factor is then used to calculate the top or bottom size relative to a baseline of the average candle body size of the last 100 bars.
• An information box in the bottom right displaying intrabar and chart coverage information.
• A light red background when the intrabar volume differs from the chart's volume by more than 1%.
The script's inputs contain tooltips explaining most of the fields. I will not repeat them here. Following is a brief description of each section of the indicator's inputs which will give you an idea of what the indicator can do:
Normal Candles is where you configure the replacement candles plotted by the script. You can choose from different coloring schemes for their bodies and specify a unique color for bodies where a divergence calculated using the method you choose occurs.
Volume Tops & Botttoms is where you configure the display of tops and bottoms, and their EMAs. The EMAs are calculated from the high point of tops and the low point of bottoms. They can act as a channel to evaluate price, and you can choose to color the channel using a gradient reflecting the advances/declines in the balance of your choice.
Divergence Channel is where you set up the appearance and behavior of the divergence channel. These areas represent levels where price and volume delta information do not converge. They can be interpreted as regions with no clear direction from where one will look for breaches. You can configure the channel to take into account one or both types of divergences you have configured for candle bodies and tops/bottoms.
Background allows you to configure a gradient background color that reflects the advances/declines in the balance of your choice. You can use this to provide context to the volume delta values from bars. You can also control the background color displayed on volume discrepancies between the intrabar and the chart's timeframe.
Intrabars is where you choose the calculation mode determining the lower timeframe used to access intrabars. The indicator uses the chart's timeframe and the type of market you are on to calculate the lower timeframe. Your setting there should reflect which compromise you prefer between the precision of calculations and chart coverage. This is also where you control the display of the information box in the lower right corner of the chart.
Markers allows you to control the plotting of chart markers on different conditions. Their configuration determines when alerts generated from the indicator will fire. Note that in order to generate alerts from this script, they must be created from your chart. See this Help Center page to learn how. Only the last 500 markers will be visible on the chart, but this will not affect the generation of alerts.
Periods is where you configure the periods for the balances and the EMAs used in the indicator.
The raw values calculated by this script can be inspected using the Data Window.
█ INTERPRETATION
Rightly or wrongly, volume delta is considered by many a useful complement to the interpretation of price action. I use it extensively in an attempt to find convergence between my read of volume delta and price movement — not so much as a predictor of future price movement. No system or person can predict the future. Accordingly, I consider people who speak or act as if they know the future with certainty to be dangerous to themselves and others; they are charlatans, imprudent or blissfully ignorant.
I try to avoid elaborate volume delta interpretation schemes involving too many variables and prefer to keep things simple:
• Trends that have more chances of continuing should be accompanied by VD of the same polarity.
In trends, I am looking for "slow and steady". I work from the assumption that traders and systems often overreact, which translates into unproductive volatility.
Wild trends are more susceptible to overreactions.
• I prefer steady VD values over wildly increasing ones, as large VD increases often come with increased price volatility, which can backfire.
Large VD values caused by stopping volume will also often occur on trend reversals with abnormally high candles.
• Prices escaping divergence channels may be leading a trend in that direction, although there is no telling how long that trend will last; could be just a few bars or hundreds.
When price is in a channel, shifts in VD balances can sometimes give us an idea of the direction where price has the most chance of breaking.
• Dwindling VD will often indicate trend exhaustion and predate reversals by many bars, but the problem is that mere pauses in a trend will often produce the same behavior in VD.
I think it is too perilous to infer rigidly from VD decreases.
Divergence Channel
Here I have configured the divergence channels to be visible. First, I set the bodies to display divergences on the default Bar Balance. They are indicated by yellow bodies. Then I activated the divergence channels by choosing to draw levels on body divergences and checked the "Fill" checkbox to fill the channel with the same color as the levels. The divergence channel is best understood as a direction-less area from where a breach can be acted on if other variables converge with the breach's direction:
Tops and Bottoms EMAs
I find these EMAs rather interesting. They have no equivalent elsewhere, as they are calculated from the top and bottom values this indicator plots. The only similarity they have with volume-weighted MAs, including VWAP, is that they use price and volume. This indicator's Tops and Bottoms EMAs, however, use the price and volume delta. While the channel differs from other channels in how it is calculated, it can be used like others, as a baseline from which to evaluate price movement or, alternatively, as stop levels. Remember that you can change the period used for the EMAs in the "Periods" section of the inputs.
This chart shows the EMAs in action, filled with a gradient representing the advances/decline from the Momentum balance. Notice the anomaly in the chart's latest bars where the Momentum balance gradient has been indicating a bullish bias for some time, during which price was mostly below the EMAs. Price has just broken above the channel on positive VD. My interpretation of this situation would be that it is a risky opportunity for a long trade in the larger context where the market has been in a downtrend since the 5th. Intrepid traders choosing to enter here could do so with a "make or break" tight stop that will minimize their losses should the market continue its downtrend while hopefully preserving the potential upside of price continuing on the longer-term uptrend prevalent since the 28th:
█ NOTES
Volume
If you use indicators such as this one which depends on volume information, it is important to realize that the volume data they consume comes from data feeds, and that all data feeds are NOT created equally. Those who create the data feeds we use must make decisions concerning the nature of the transactions they tally and the way they are tallied in each feed, and these decisions affect the nature of our volume data. My Volume X-ray publication discusses some of the reasons why volume information from different timeframes, brokers/exchanges or sectors may vary considerably. I encourage you to read it. This indicator's display of a warning through a background color on volume discrepancies between the timeframe used to access intrabars and the chart's timeframe is an attempt to help you realize these variations in feeds. Don't take things for granted, and understand that the quality of a given feed's volume information affects the quality of the results this indicator calculates.
Markets as ecosystems
I believe it is perilous to think that behavioral patterns you discover in one market through the lens of this or any other indicator will necessarily port to other markets. While this may sometimes be the case, it will often not. Why is that? Because each market is its own ecosystem. As cities do, all markets share some common characteristics, but they also all have their idiosyncrasies. A proportion of a city's inhabitants is always composed of outsiders who come and go, but a core population of regulars and systems is usually the force that actually defines most of the city's observable characteristics. I believe markets work somewhat the same way; they may look the same, but if you live there for a while and pay attention, you will notice the idiosyncrasies. Some things that work in some markets will, accordingly, not work in others. Please keep that in mind when you draw conclusions.
On Up/Down or Buy/Sell Volume
Buying or selling volume are misnomers, as every unit of volume transacted is both bought and sold by two different traders. While this does not keep me from using the terms, there is no such thing as “buy only” or “sell only” volume. Trader lingo is riddled with peculiarities. Without access to order book information, traders work with the assumption that when price moves up during a bar, there was more buying pressure than selling pressure, just as when buy market orders take out limit ask orders in the order book at successively higher levels. The built-in volume indicator available on TradingView uses this logic to color the volume columns green or red. While this script’s calculations are more precise because it analyses intrabars to calculate its information, it uses pretty much the same imperfect logic. Until Pine scripts can have access to how much volume was transacted at the bid/ask prices, our volume delta calculations will remain a mere proxy.
Repainting
• The values calculated on the realtime bar will update as new information comes from the feed.
• Historical values may recalculate if the historical feed is updated or when calculations start from a new point in history.
• Markers and alerts will not repaint as they only occur on a bar's close. Keep this in mind when viewing markers on historical bars,
where one could understandably and incorrectly assume they appear at the bar's open.
To learn more about repainting, see the Pine Script™ User Manual's page on the subject .
Superfluity
In "The Bed of Procrustes", Nassim Nicholas Taleb writes: To bankrupt a fool, give him information . This indicator can display a lot of information. The inevitable adaptation period you will need to figure out how to use it should help you eliminate all the visuals you do not need. The more you eliminate, the easier it will be to focus on those that are the most useful to your trading practice. Don't be a fool.
█ THANKS
Thanks to alexgrover for his Dekidaka-Ashi indicator. His volume plots on candles were the inspiration for my top/bottom plots.
Kudos to PineCoders for their libraries. I use two of them in this script: Time and lower_tf .
The first versions of this script used functionality that I would not have known about were it not for these two guys:
— A guy called Kuan who commented on a Backtest Rookies presentation of their Volume Profile indicator.
— theheirophant , my partner in the exploration of the sometimes weird abysses of request.security() ’s behavior at lower timeframes.

Doji strategyThis is a simple strategy based on Doji star candlestick.
It places two orders: buy stop at doji star high or previous candle high and sell stop at doji star low or previous candle low.
Exit rules are with take profit and fixed stop loss or take profit and stop loss at doji min or max.
This strategy works very well with high time frames like Daily and Weekly because those are without noise in doji formation.
Each currency pair has its own optimal setting for TP and SL: it's up to user find the best ones.
I could implement SL based on ATR, maybe in next revision.
Please use comment section for any feedback.
Next improvement (only to whom is interested to this script and follows me): study with alerts on multiple tickers all at one. Leave a comment if you want to have access to study.

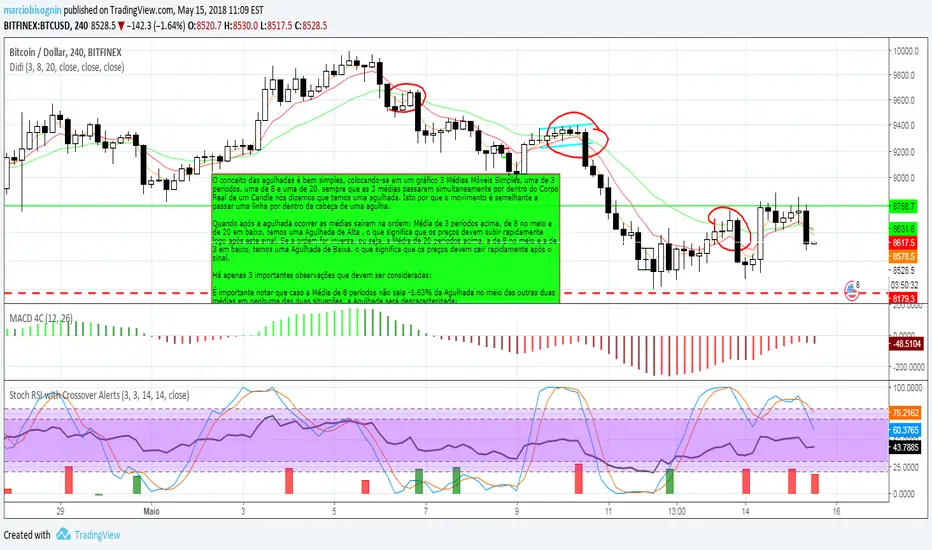
Didi Index OriginalO conceito das agulhadas é bem simples, colocando-se em um gráfico 3 Médias Móveis Simples, uma de 3 períodos, uma de 8 e uma de 20, sempre que as 3 médias passarem simultaneamente por dentro do Corpo Real de um Candle nós dizemos que temos uma agulhada. Isto por que o movimento é semelhante a passar uma linha por dentro da cabeça de uma agulha.
Quando após a agulhada ocorrer as médias saírem na ordem: Média de 3 períodos acima, de 8 no meio e de 20 em baixo, temos uma Agulhada de Alta , o que significa que os preços devem subir rapidamente logo após este sinal. Se a ordem for inversa, ou seja, a Média de 20 períodos acima, a de 8 no meio e a de 3 em baixo, temos uma Agulhada de Baixa, o que significa que os preços devem cair rapidamente após o sinal.
Há apenas 3 importantes observações que devem ser consideradas:
É importante notar que caso a Média de 8 períodos não saia -1.63% da Agulhada no meio das outras duas médias em nenhuma das duas situações, a Agulhada será descaracterizada;
Após a Agulhada ser observada, é importante aguardar pela confirmação do sinal por mais uma barra para evitar sinais falso.
Este é o conceito tradicional.
------
The concept of the needles is very simple, placing on a graph 3 Simple Moving Averages, one of 3 periods, one of 8 and one of 20, whenever the 3 means pass simultaneously inside the Real Body of a Candle we say that we have a needle. This is because the movement is similar to passing a line through the head of a needle.
When after the needling occurs the averages come out in the order: Average of 3 periods above, 8 in the middle and 20 in lower, we have a High Needle, which means that prices must rise rapidly soon after this signal. If the order is the reverse, ie the average of 20 periods above, that of 8 in the middle and that of 3 down, we have a Down Needle, which means that prices must drop quickly after the signal.
There are only 3 important observations that should be considered:
It is important to note that if the Mean of 8 periods does not leave the Needle in the middle of the other two means in either of the two situations, the Needle will be decharacterized;
After the Needle is observed, it is important to wait for the confirmation of the signal for another bar to avoid false signals.
This is the traditional concept.
Buyside & Sellside Liquidity The Buyside & Sellside Liquidity Indicator is an advanced Smart Money Concepts (SMC) tool that automatically detects and visualizes liquidity zones and liquidity voids (imbalances) directly on the chart.
🟢 Function and meaning:
1. Buyside Liquidity (green):
Highlights price zones above current price where short traders’ stop-loss orders are likely resting.
When price sweeps these areas, it often indicates a liquidity grab or stop hunt.
👉 These zones are labeled with 💵💰 emojis for a clear visual cue where smart money collects liquidity.
2. Sellside Liquidity (red):
Highlights zones below the current price where long traders’ stop-losses are likely placed.
Once breached, these often signal a potential reversal upward.
👉 The 💵💰🪙 emojis make these liquidity targets visually intuitive on the chart.
3. Liquidity Voids (bright areas):
Indicate inefficient price areas, where the market moved too quickly without filling orders.
These zones are often revisited later as the market seeks balance (fair value).
👉 Shown as light shaded boxes with 💰 emojis to emphasize imbalance regions.
💡 Usage:
• Helps spot smart money manipulation and stop hunts.
• Marks potential reversal or breakout zones.
• Great for traders applying SMC, ICT, or Fair Value Gap strategies.
✨ Highlight:
Dollar and money bag emojis (💵💰🪙💸) are integrated directly into chart labels to create a clear and visually engaging representation of liquidity areas.

FluxGate Daily Swing StrategySummary in one paragraph
FluxGate treats long and short as different ecosystems. It runs two independent engines so the long side can be bold when the tape rewards upside persistence while the short side can stay selective when downside is messy. The core reads three directional drivers from price geometry then removes overlap before gating with clean path checks. The complementary risk module anchors stop distance to a higher timeframe ATR so a unit means the same thing on SPY and BTC. It can add take profit breakeven and an ATR trail that only activates after the trade earns it. If a stop is hit the strategy can re enter in the same direction on the next bar with a daily retry cap that you control. Add it to a clean chart. Use defaults to see the intended behavior. For conservative workflows evaluate on bar close.
Scope and intent
• Markets. Large cap equities and liquid ETFs major FX pairs US index futures and liquid crypto pairs
• Timeframes. From one minute to daily
• Default demo in this publication. SPY on one day timeframe
• Purpose. Reduce false starts without missing sustained trends by fusing independent drivers and suppressing activity when the path is noisy
• Limits. This is a strategy. Orders are simulated on standard candles. Non standard chart types are not supported for execution
Originality and usefulness
• Unique fusion. FluxGate extracts three drivers that look at price from different angles. Direction measures slope of a smoothed guide and scales by realized volatility so a point of slope does not mean a different thing on different symbols. Persistence looks at short sign agreement to reward series of closes that keep direction. Curvature measures the second difference of a local fit to wake up during convex pushes. These three are then orthonormalized so a strong reading in one does not double count through another.
• Gates that matter. Efficiency ratio prefers direct paths over treadmills. Entropy turns up versus down frequency into an information read. Light fractal cohesion punishes wrinkly paths. Together they slow the system in chop and allow it to open up when the path is clean.
• Separate long and short engines. Threshold tilts adapt to the skew of score excursions. That lets long engage earlier when upside distribution supports it and keeps short cautious where downside surprise and venue frictions are common.
• Practical risk behavior. Stops are ATR anchored on a higher timeframe so the unit is portable. Take profit is expressed in R so two R means the same concept across symbols. Breakeven and trailing only activate after a chosen R so early noise does not squeeze a good entry. Re entry after stop lets the system try again without you babysitting the chart.
• Testability. Every major window and the aggression controls live in Inputs. There is no hidden magic number.
Method overview in plain language
Base measures
• Return basis. Natural log of close over prior close for stability and easy aggregation through time. Realized volatility is the standard deviation of returns over a moving window.
• Range basis for risk. ATR computed on a higher timeframe anchor such as day week or month. That anchor is steady across venues and avoids chasing chart specific quirks.
Components
• Directional intensity. Use an EMA of typical price as a guide. Take the day to day slope as raw direction. Divide by realized volatility to get a unit free measure. Soft clip to keep outliers from dominating.
• Persistence. Encode whether each bar closed up or down. Measure short sign agreement so a string of higher closes scores better than a jittery sequence. This favors push continuity without guessing tops or bottoms.
• Curvature. Fit a short linear regression and compute the second difference of the fitted series. Strong curvature flags acceleration that slope alone may miss.
• Efficiency gate. Compare net move to path length over a gate window. Values near one indicate direct paths. Values near zero indicate treadmill behavior.
• Entropy gate. Convert up versus down frequency into a probability of direction. High entropy means coin toss. The gate narrows there.
• Fractal cohesion. A light read of path wrinkliness relative to span. Lower cohesion reduces the urge to act.
• Phase assist. Map price inside a recent channel to a small signed bias that grows with confidence. This helps entries lean toward the right half of the channel without becoming a breakout rule.
• Shock control. Compare short volatility to long volatility. When short term volatility spikes the shock gate temporarily damps activity so the system waits for pressure to normalize.
Fusion rule
• Normalize the three drivers after removing overlap
• Blend with weights that adapt to your aggression input
• Multiply by the gates to respect path quality
• Smooth just enough to avoid jitter while keeping timing responsive
• Compute an adaptive mean and deviation of the score and set separate long and short thresholds with a small tilt informed by skew sign
• The result is one long score and one short score that can cross their thresholds at different times for the same tape which is a feature not a bug
Signal rule
• A long suggestion appears when the long score crosses above its long threshold while all gates are active
• A short suggestion appears when the short score crosses below its short threshold while all gates are active
• If any required gate is missing the state is wait
• When a position is open the status is in long or in short until the complementary risk engine exits or your entry mode closes and flips
Inputs with guidance
Setup Long
• Base length Long. Master window for the long engine. Typical range twenty four to eighty. Raising it improves selectivity and reduces trade count. Lowering it reacts faster but can increase noise
• Aggression Long. Zero to one. Higher values make thresholds more permissive and shorten smoothing
Setup Short
• Base length Short. Master window for the short engine. Typical range twenty eight to ninety six
• Aggression Short. Zero to one. Lower values keep shorts conservative which is often useful on upward drifting symbols
Entries and UI
• Entry mode. Both or Long only or Short only
Complementary risk engine
• Enable risk engine. Turns on bracket exits while keeping your signal logic untouched
• ATR anchor timeframe. Day Week or Month. This sets the structural unit of stop distance
• ATR length. Default fourteen
• Stop multiple. Default one point five times the anchor ATR
• Use take profit. On by default
• Take profit in R. Default two R
• Breakeven trigger in R. Default one R
Usage recipes
Intraday trend focus
• Entry mode Both
• ATR anchor Week
• Aggression Long zero point five Aggression Short zero point three
• Stop multiple one point five Take profit two R
• Expect fewer trades that stick to directional pushes and skip treadmill noise
Intraday mean reversion focus
• Session windows optional if you add them in your copy
• ATR anchor Day
• Lower aggression both sides
• Breakeven later and trailing later so the first bounce has room
• This favors fade entries that still convert into trends when the path stays clean
Swing continuation
• Signal timeframe four hours or one day
• Confirm timeframe one day if you choose to include bias
• ATR anchor Week or Month
• Larger base windows and a steady two R target
• This accepts fewer entries and aims for larger holds
Properties visible in this publication
• Initial capital 25.000
• Base currency USD
• Default order size percent of equity value three - 3% of the total capital
• Pyramiding zero
• Commission zero point zero three percent - 0.03% of total capital
• Slippage five ticks
• Process orders on close off
• Recalculate after order is filled off
• Calc on every tick off
• Bar magnifier off
• Any request security calls use lookahead off everywhere
Realism and responsible publication
• No performance promises. Past results never guarantee future outcomes
• Fills and slippage vary by venue and feed
• Strategies run on standard candles only
• Shapes can update while a bar is forming and settle on close
• Keep risk per trade sensible. Around one percent is typical for study. Above five to ten percent is rarely sustainable
Honest limitations and failure modes
• Sudden news and thin liquidity can break assumptions behind entropy and cohesion reads
• Gap heavy symbols often behave better with a True Range basis for risk than a simple range
• Very quiet regimes can reduce score contrast. Consider longer windows or higher thresholds when markets sleep
• Session windows follow the exchange time of the chart if you add them
• If stop and target can both be inside a single bar this strategy prefers stop first to keep accounting conservative
Open source reuse and credits
• No reused open source beyond public domain building blocks such as ATR EMA and linear regression concepts
Legal
Education and research only. Not investment advice. You are responsible for your decisions. Test on history and in simulation with realistic costs

Scalper Pro Pattern Recognition & Price ActionOVERVIEW
Scalper Pro is a comprehensive multi-timeframe trading indicator that combines Smart Money Concepts (SMC) with traditional technical analysis to provide scalpers and day traders with high-probability entry and exit signals. This indicator integrates multiple analytical frameworks into a unified visual system designed specifically for short-term trading strategies.
ORIGINALITY & PURPOSE
What Makes This Script Original
This script is not a simple mashup of existing indicators. Instead, it represents a carefully orchestrated integration of complementary analytical methods that work together to solve a specific problem: identifying high-probability scalping opportunities in volatile markets.
The unique value proposition:
Adaptive Trend Filtering System - Combines a customized SuperTrend algorithm with dual-period range filters (Cirrus Cloud) and Hull Moving Average trend cloud to create a three-layer trend confirmation system
Smart Money Concepts Integration - Incorporates institutional trading concepts (Order Blocks, Fair Value Gaps, Break of Structure) with retail technical indicators for a complete market structure view
Dynamic Risk Management - Automatically calculates stop-loss and take-profit levels based on ATR volatility, providing objective position sizing
ADX-Based Market Regime Detection - Identifies ranging vs. trending markets through ADX analysis with visual bar coloring to prevent whipsaws during consolidation
Why Combine These Specific Components
Each component addresses a specific weakness in scalping:
SuperTrend provides the primary directional bias but can generate false signals in ranging markets
Range Filters smooth out noise and confirm trend direction, reducing SuperTrend false positives
ADX Analysis prevents trading during low-volatility consolidation when most indicators fail
SMC Elements identify institutional activity zones where price is likely to react strongly
ATR-Based Risk Management adapts position sizing to current volatility conditions
The synergy creates a system where signals are only generated when multiple confirmation layers align, significantly reducing false signals common in single-indicator approaches.
HOW IT WORKS
Core Calculation Methodology
1. SuperTrend Signal Generation
The script uses a modified SuperTrend algorithm with the following calculation:
ATR = Average True Range (default: 10 periods)
Factor = 7 (default sensitivity multiplier)
Upper Band = Source + (Factor × ATR)
Lower Band = Source - (Factor × ATR)
Directional Logic:
When price crosses above SuperTrend → Bullish signal
When price crosses below SuperTrend → Bearish signal
SuperTrend value is plotted as dynamic support/resistance
Key Modification: The sensitivity parameter (nsensitivity * 7) allows users to adjust the aggressiveness of trend detection without changing the core ATR calculation.
2. Range Filter System (Cirrus Cloud)
The Range Filter uses a smoothed range calculation to filter out market noise:
Smooth Range Calculation:
WPER = (Period × 2) - 1
AVRNG = EMA(|Price - Price |, Period)
Smooth Range = EMA(AVRNG, WPER) × Multiplier
Two-Layer System:
Layer 1: 22-period with 6x multiplier (broader trend)
Layer 2: 15-period with 5x multiplier (tighter price action)
Visual Output: The space between these two filters is colored:
Green fill = Bullish trend (Layer 1 > Layer 2)
Red fill = Bearish trend (Layer 1 < Layer 2)
This creates a "cloud" that expands during strong trends and contracts during consolidation.
3. ADX Market Regime Detection
Calculation:
+DM = Positive Directional Movement
-DM = Negative Directional Movement
True Range = RMA of True Range (15 periods)
+DI = 100 × RMA(+DM, 15) / True Range
-DI = 100 × RMA(-DM, 15) / True Range
ADX = 100 × RMA(|+DI - -DI| / (+DI + -DI), 15)
Threshold System:
ADX < Threshold (default 15) = Ranging market → Bar color changes to purple
ADX > Threshold = Trending market → Normal bar coloring applies
Purpose: This prevents taking trend-following signals during sideways markets where most indicators produce whipsaws.
4. Smart Money Concepts (SMC) Integration
Order Blocks (OB):
Identified using swing high/low detection with customizable pivot length
Bullish OB: Last down-close candle before bullish Break of Structure (BOS)
Bearish OB: Last up-close candle before bearish BOS
Extended forward until price breaks through them
Fair Value Gaps (FVG):
Detected when a three-candle gap exists:
Bullish FVG: Low > High
Bearish FVG: High < Low
Filtered by price delta percentage to ensure significant gaps
Displayed as boxes that delete when price fills the gap
Break of Structure (BOS) vs. Change of Character (CHoCH):
BOS = Price breaks the previous structural high/low in the current trend direction
CHoCH = Price breaks structure in the opposite direction (potential trend reversal)
Both internal (minor) and swing (major) structures are tracked
Equal Highs/Lows (EQH/EQL):
Detected when consecutive swing highs/lows are within ATR threshold
Often indicates liquidity pools that price may sweep before reversing
5. ATR-Based Risk Management
Calculation:
ATR Band = ATR(14) × Risk Multiplier (default 3%)
Stop Loss = Entry - ATR Band (for longs) or Entry + ATR Band (for shorts)
Take Profit Levels:
TP1 = Entry + (Entry - Stop Loss) × 1
TP2 = Entry + (Entry - Stop Loss) × 2
TP3 = Entry + (Entry - Stop Loss) × 3
Dynamic Labels: Stop loss and take profit levels are automatically calculated and displayed as labels on the chart when new signals trigger.
6. Hull Moving Average Trend Cloud
HMA = WMA(2 × WMA(Close, Period/2) - WMA(Close, Period), sqrt(Period))
Period = 600 bars (long-term trend)
The HMA provides a smoothed long-term trend reference that's more responsive than traditional moving averages while filtering out short-term noise.
HOW TO USE THE INDICATOR
Entry Signals
Primary Buy Signal:
SuperTrend changes to green (price crosses above)
ADX shows market is NOT ranging (bars are NOT purple)
Price is within or near a bullish Order Block OR bullish FVG
Cirrus Cloud shows green fill (Layer 1 > Layer 2)
Primary Sell Signal:
SuperTrend changes to red (price crosses below)
ADX shows market is NOT ranging
Price is within or near a bearish Order Block OR bearish FVG
Cirrus Cloud shows red fill (Layer 1 < Layer 2)
Confirmation Layers
Higher Probability Trades Include:
Bullish/Bearish BOS in the same direction as signal
Equal highs/lows being swept before entry
Price respecting premium/discount zones (above/below equilibrium)
Multiple timeframe alignment (use MTF settings)
Exit Strategy
The indicator provides three take-profit levels:
TP1: Conservative target (1:1 risk-reward)
TP2: Moderate target (2:1 risk-reward)
TP3: Aggressive target (3:1 risk-reward)
Suggested Exit Approach:
Close 1/3 position at TP1
Move stop to breakeven
Close 1/3 position at TP2
Trail remaining position or exit at TP3
Risk Management
Stop Loss:
Use the ATR-based stop loss level displayed on chart
Alternatively, use percentage-based stop (adjustable in settings)
Never risk more than 1-2% of account per trade
Position Sizing:
Position Size = (Account Risk $) / (Entry Price - Stop Loss Price)
CUSTOMIZABLE SETTINGS
Core Parameters
Buy/Sell Signals:
Toggle signals on/off
Adjust SuperTrend sensitivity (0.5 - 2.0)
Risk Management:
Show/hide TP/SL levels
ATR period (default: 14)
Risk percentage (default: 3%)
Number of decimal places for price labels
Trend Features:
Cirrus Cloud display toggle
Range filter periods (x1, x2, x3, x4)
Hull MA length for trend cloud
Smart Money Concepts:
Order Block settings (swing length, display count)
Fair Value Gap parameters (auto-threshold, extend length)
Structure detection (internal vs swing)
EQH/EQL threshold
ADX Settings:
ADX length (default: 15)
Sideways threshold (10-30, default: 15)
Bar color toggle
Display Options:
Previous day/week/month high/low levels
Premium/Discount/Equilibrium zones
Trend candle coloring (colored or monochrome)
BEST PRACTICES & TRADING TIPS
Optimal Use Cases
Scalping on lower timeframes (1m, 5m, 15m)
Rapid entry/exit with clear TP levels
ADX filter prevents choppy market entries
Day trading on medium timeframes (30m, 1H)
Stronger trend confirmation
Better risk-reward ratios
Swing trading entries on higher timeframes (4H, Daily)
Higher-probability structural setups
Larger ATR-based stops accommodate volatility
Market Conditions
Best Performance:
Trending markets with clear directional bias
Post-news volatility with defined structure
Markets respecting support/resistance levels
Avoid Trading When:
ADX indicator shows purple bars (ranging market)
Multiple conflicting signals across timeframes
Major news events without clear price structure
Low volume periods (market open/close)
Common Mistakes to Avoid
Ignoring the ADX filter - Taking signals during ranging markets leads to whipsaws
Not waiting for confirmation - Enter only when multiple layers align
Overtrading - Fewer high-quality setups outperform many mediocre ones
Ignoring risk management - Always use the calculated stop losses
Fighting the trend - Trade WITH the SuperTrend and Cirrus Cloud direction
TECHNICAL SPECIFICATIONS
Indicator Type: Overlay (plots on price chart)
Calculation Resources:
Max labels: 500
Max lines: 500
Max boxes: 500
Max bars back: 500
Pine Script Version: 5
Compatible Timeframes: All timeframes (optimized for 1m to 1D)
Compatible Instruments:
Forex pairs
Crypto assets
Stock indices
Individual stocks
Commodities
THEORETICAL FOUNDATION
Trend-Following Concepts
This indicator is based on the principle that markets trend more often than they range, and that trends tend to persist. The SuperTrend component captures this momentum while the range filters prevent premature entries during pullbacks.
Smart Money Theory
The SMC elements are based on the concept that institutional traders (banks, hedge funds) leave footprints in the form of:
Order Blocks: Areas where large orders were placed
Fair Value Gaps: Inefficient price movements that may be revisited
Liquidity Sweeps: Stop hunts before continuation (EQH/EQL)
Volatility-Based Position Sizing
Using ATR for stop-loss placement ensures that stop distances adapt to current market conditions:
Tight stops in low volatility (avoids excessive risk)
Wider stops in high volatility (avoids premature stop-outs)
PERFORMANCE EXPECTATIONS
Realistic Expectations
Win Rate:
Expected: 45-55% (trend-following systems rarely exceed 60%)
Higher win rates on trending days
Lower win rates during consolidation (even with ADX filter)
Risk-Reward Ratio:
Target: 1.5:1 minimum (TP2)
Achievable: 2:1 to 3:1 on strong trends
Drawdowns:
Normal: 10-15% of account during choppy periods
Maximum: Should not exceed 20% with proper risk management
Optimization Tips
Backtesting Recommendations:
Test on at least 1 year of historical data
Include different market conditions (trending, ranging, volatile)
Adjust SuperTrend sensitivity per instrument
Optimize ADX threshold for your specific market
Record trades to identify personal execution errors
FREQUENTLY ASKED QUESTIONS
Q: Can I use this for automated trading?
A: The indicator provides signals, but you'll need to code a strategy script separately for automation. The signals can trigger alerts that connect to trading bots.
Q: Why do I see conflicting signals?
A: This is normal during transition periods. Wait for all confirmation layers to align before entering.
Q: How often should I expect signals?
A: Depends on timeframe and market conditions. On 5m charts during trending markets: 3-7 quality setups per session.
Q: Can I use only some features?
A: Yes, all components can be toggled on/off. However, the system works best with all confirmations active.
Q: What's the difference between internal and swing structures?
A: Internal = minor price structures (smaller pivots). Swing = major price structures (larger pivots). Both provide different levels of confirmation.
DISCLAIMER
This indicator is a tool for technical analysis and should not be the sole basis for trading decisions. Past performance does not guarantee future results. Always:
Use proper risk management
Test on demo accounts first
Never risk more than you can afford to lose
Combine with fundamental analysis when applicable
Understand that no indicator is 100% accurate
License: Mozilla Public License 2.0
Author: DrFXGOD
VERSION HISTORY & UPDATES
Initial Release - Version 1.0
Integrated SuperTrend, Range Filters, ADX, SMC concepts
ATR-based risk management
Multi-timeframe support
Customizable visual elements
SUPPORT & DOCUMENTATION
For questions, suggestions, or bug reports, please comment on the script page or contact the author through TradingView.
Additional Resources:
Smart Money Concepts: Research ICT (Inner Circle Trader) materials
ATR and Volatility: Refer to Wilder's original ATR documentation
SuperTrend Indicator: Study original SuperTrend strategy papers
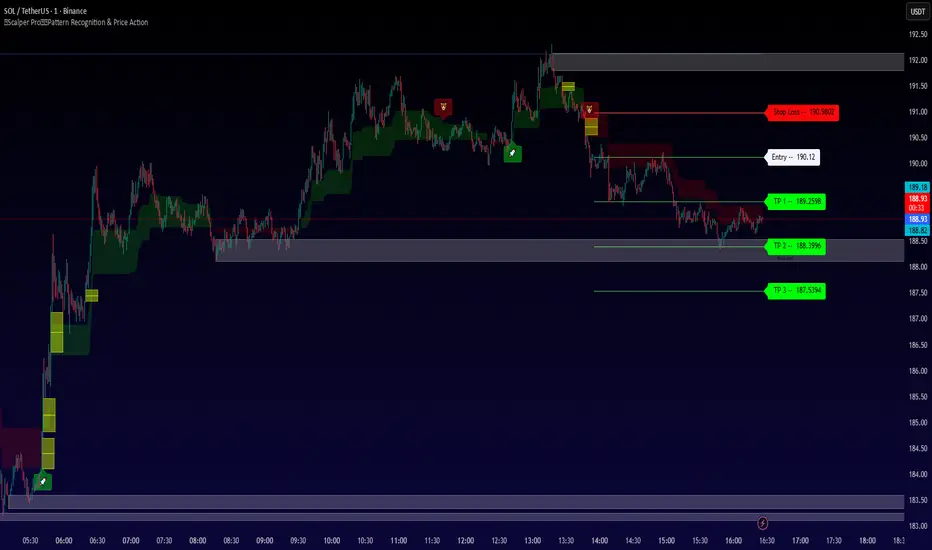
Smart Structure Pro - Market Structure & Smart Money Concepts═══════════════════════════════════════════════════════════════════════════════
SMART STRUCTURE PRO
═══════════════════════════════════════════════════════════════════════════════
A comprehensive market structure analysis tool that identifies institutional trading
patterns and smart money concepts for improved trade timing and decision-making.
═══════════════════════════════════════════════════════════════════════════════
📊 WHAT IT DOES
═══════════════════════════════════════════════════════════════════════════════
This indicator automatically detects and visualizes key market structure elements:
🔹 BOS (Break of Structure)
- Identifies trend continuation patterns
- Marks when price breaks above previous highs (bullish) or below previous lows (bearish)
- Confirms trend strength and momentum
🔹 CHoCH (Change of Character)
- Detects potential trend reversals
- Alerts when market structure shifts from bullish to bearish or vice versa
- Helps identify early reversal opportunities
🔹 Order Blocks
- Highlights institutional entry zones
- Identifies the last opposite candle before a structure break
- Shows areas where smart money likely entered positions
🔹 Fair Value Gaps (FVG)
- Detects price imbalances and inefficiencies
- Shows areas where price moved rapidly leaving gaps
- Often act as support/resistance when retested
🔹 Liquidity Zones
- Marks swing high and low levels
- Identifies areas where stop losses likely cluster
- Shows potential stop hunt and liquidity grab zones
═══════════════════════════════════════════════════════════════════════════════
🎯 HOW TO USE
═══════════════════════════════════════════════════════════════════════════════
BULLISH SETUP:
1. Wait for Bullish CHoCH (trend reversal signal) or BOS ↑ (continuation)
2. Look for price to pull back into an Order Block or Fair Value Gap
3. Enter long when price bounces from these zones
4. Place stop loss below the Order Block
5. Target the next liquidity zone or resistance level
BEARISH SETUP:
1. Wait for Bearish CHoCH (trend reversal signal) or BOS ↓ (continuation)
2. Look for price to retrace into an Order Block or Fair Value Gap
3. Enter short when price rejects from these zones
4. Place stop loss above the Order Block
5. Target the next liquidity zone or support level
DASHBOARD INTERPRETATION:
• Trend: Current market direction (Bullish/Bearish)
• Volume: Confirmation strength (High volume = stronger signals)
• Signal: Latest structure break detected
• Key High/Low: Critical levels for the current trend
• Position: Price location (Premium = expensive, Discount = cheap)
═══════════════════════════════════════════════════════════════════════════════
⚙️ SETTINGS GUIDE
═══════════════════════════════════════════════════════════════════════════════
STRUCTURE DETECTION:
• Pivot Length (Default: 10)
- Lower values = More signals but potentially weaker
- Higher values = Fewer signals but stronger/more reliable
- Recommended: 8-12 for intraday, 10-15 for higher timeframes
• Structure Line Extension
- Visual preference for how far lines extend
- Does not affect signal detection
SMART MONEY CONCEPTS:
• Order Block Extension: How long OB boxes remain visible
• FVG Extension: How long gap boxes remain visible
• Min FVG Size: Filter out small gaps (0 = show all)
- Set to 10-20% to reduce noise
- Set to 0 to see all gaps
VOLUME FILTER:
• Volume Confirmation (Recommended: ON)
- Filters weak signals without volume support
- Reduces false breakouts
• Volume Multiplier (Default: 1.5)
- Higher = Stricter filtering (fewer but stronger signals)
- Lower = More signals (but may include weak ones)
DISPLAY:
• Dashboard: Toggle information panel
• Trend Background: Subtle color tint showing current trend
• Dashboard Position: Choose corner placement
═══════════════════════════════════════════════════════════════════════════════
🔔 ALERTS
═══════════════════════════════════════════════════════════════════════════════
Available alert conditions:
✓ Bullish BOS - Uptrend continuation confirmed
✓ Bearish BOS - Downtrend continuation confirmed
✓ Bullish CHoCH - Reversal to uptrend detected
✓ Bearish CHoCH - Reversal to downtrend detected
✓ Structure Break - Any significant market structure change
To set up alerts:
1. Click the "⏰" alert icon
2. Select "Smart Structure Pro"
3. Choose your desired condition
4. Configure notification method
5. Click "Create"
═══════════════════════════════════════════════════════════════════════════════
⚠️ IMPORTANT DISCLOSURES
═══════════════════════════════════════════════════════════════════════════════
REPAINTING BEHAVIOR:
• Pivot points WILL repaint until confirmed (this is by design and unavoidable)
• Structure breaks (BOS/CHoCH) use CLOSED candles and do NOT repaint after confirmation
• Order Blocks and FVGs are drawn on confirmed signals and do NOT repaint
• All signals wait for candle close before triggering
BEST PRACTICES:
• Use on higher timeframes (15min+) for more reliable signals
• Combine with other analysis (support/resistance, volume profile, etc.)
• Wait for candle close confirmation before acting on signals
• Use proper risk management - this is not a standalone trading system
• Backtest on your preferred instrument and timeframe
PERFORMANCE:
• Limited to 100 boxes, 100 lines, 100 labels for optimal performance
• Older objects automatically removed as new ones appear
• Works on all markets (Forex, Crypto, Stocks, Indices, Commodities)
═══════════════════════════════════════════════════════════════════════════════
📚 CONCEPTS EXPLAINED
═══════════════════════════════════════════════════════════════════════════════
MARKET STRUCTURE:
Market structure refers to the pattern of price movements creating swing highs
and lows. Understanding structure helps identify trend direction and potential
reversal points.
SMART MONEY CONCEPTS:
These are trading techniques based on tracking institutional order flow and
understanding where large players (banks, funds, institutions) enter and exit
positions.
ORDER BLOCKS:
The last opposing candle before a strong directional move. Institutions often
leave unfilled orders in these zones, which can act as support/resistance when
price returns.
FAIR VALUE GAPS:
Areas where price moved so quickly that it left an imbalance. These gaps often
get "filled" as price returns to find equilibrium, creating trading opportunities.
═══════════════════════════════════════════════════════════════════════════════
🎓 EDUCATIONAL VALUE
═══════════════════════════════════════════════════════════════════════════════
This indicator helps traders:
✓ Understand market structure mechanics
✓ Identify institutional trading patterns
✓ Improve trade timing and entry precision
✓ Recognize trend continuation vs reversal
✓ Learn smart money concepts through visualization
═══════════════════════════════════════════════════════════════════════════════
📋 TECHNICAL DETAILS
═══════════════════════════════════════════════════════════════════════════════
• Version: 1.0.0
• Pine Script Version: 5
• Indicator Type: Overlay
• No Repainting: Structure breaks use confirmed candles
• Performance Optimized: Limited drawing objects
• Works On: All markets and timeframes
• Alerts: Yes, fully customizable
═══════════════════════════════════════════════════════════════════════════════
👤 AUTHOR
═══════════════════════════════════════════════════════════════════════════════
Created by: Zakaria Safri
Original Work: All code and concepts are original implementations
Based On: ICT (Inner Circle Trader) educational concepts
License: © 2024 Zakaria Safri - Personal Use Only
═══════════════════════════════════════════════════════════════════════════════
⚖️ DISCLAIMER
═══════════════════════════════════════════════════════════════════════════════
This indicator is for educational and informational purposes only. It does not
constitute financial advice. Trading involves substantial risk of loss. Past
performance does not guarantee future results. Always conduct your own research
and consult with a licensed financial advisor before making trading decisions.
The author is not responsible for any losses incurred from using this indicator.
═══════════════════════════════════════════════════════════════════════════════
If you find this indicator helpful, please:
👍 Like and favorite
⭐ Leave a review
📢 Share with other traders
💬 Comment with feedback or suggestions
Happy Trading! 📈
