Relative Volume Candles [QuantVue]In the words of Dan Zanger, "Trying to trade without using volume is like trying to drive a few hundred miles without putting gas in your tank. Trying to trade without chart patterns is like leaving without having an idea how to get there!"
Volume tends to show up at the beginning and the end of trends. As a general rule, when a stock goes up on low volume, it's seen as negative because it means buyers aren't committed. When a stock goes down on low volume, it means that not many people are trying to sell it, which is positive.
The Relative Volume Candles indicator is based on the Zanger Volume Ratio and designed to help identify key volume patterns effortlessly, with color coded candles and wicks.
The indicator is designed to be used on charts less than 1 Day and calculates the average volume for the user selected lookback period at the given time of day. From there a ratio of the current volume vs the average volume is used to determine the candle’s colors.
The candles wicks are color coded based on whether or not the volume ratio is rising or falling.
So when is it most important to have volume? When prices break out of a consolidation pattern like a bull flag or cup and handle pattern, volume plays a role. When a stock moves out of a range, volume shows how committed buyers are to that move.
Note in order to see this indicator you will need to change the visual order. This is done by selecting the the 3 dots next to the indicator name, scrolling down to visual order and selecting bring to front.
Indicator Features
🔹Selectable candle colors
🔹Selectable ratio levels
🔹Custom lookback period***
***TradingView has a maximum 5,000 bar lookback for most plans. If you are on a lower time frame chart and you select a lookback period larger than 5,000 bars the indicator will not show and you will need to select a shorter lookback period or move to a higher time frame chart.
Give this indicator a BOOST and COMMENT your thoughts!
We hope you enjoy.
Cheers!
"order"に関するスクリプトを検索

AI SuperTrend - Strategy [presentTrading]
█ Introduction and How it is Different
The AI Supertrend Strategy is a unique hybrid approach that employs both traditional technical indicators and machine learning techniques. Unlike standard strategies that rely solely on traditional indicators or mathematical models, this strategy integrates the power of k-Nearest Neighbors (KNN), a machine learning algorithm, with the tried-and-true SuperTrend indicator. This blend aims to provide traders with more accurate, responsive, and context-aware trading signals.
*The KNN part is mainly referred from @Zeiierman.
BTCUSD 8hr performance
ETHUSD 8hr performance
█ Strategy, How it Works: Detailed Explanation
SuperTrend Calculation
Volume-Weighted Moving Average (VWMA): A VWMA of the close price is calculated based on the user-defined length (len). This serves as the central line around which the upper and lower bands are calculated.
Average True Range (ATR): ATR is calculated over a period defined by len. It measures the market's volatility.
Upper and Lower Bands: The upper band is calculated as VWMA + (factor * ATR) and the lower band as VWMA - (factor * ATR). The factor is a user-defined multiplier that decides how wide the bands should be.
KNN Algorithm
Data Collection: An array (data) is populated with recent n SuperTrend values. Corresponding labels (labels) are determined by whether the weighted moving average price (price) is greater than the weighted moving average of the SuperTrend (sT).
Distance Calculation: The absolute distance between each data point and the current SuperTrend value is calculated.
Sorting & Weighting: The distances are sorted in ascending order, and the closest k points are selected. Each point is weighted by the inverse of its distance to the current point.
Classification: A weighted sum of the labels of the k closest points is calculated. If the sum is closer to 1, the trend is predicted as bullish; if closer to 0, bearish.
Signal Generation
Start of Trend: A new bullish trend (Start_TrendUp) is considered to have started if the current trend color is bullish and the previous was not bullish. Similarly for bearish trends (Start_TrendDn).
Trend Continuation: A bullish trend (TrendUp) is considered to be continuing if the direction is negative and the KNN prediction is 1. Similarly for bearish trends (TrendDn).
Trading Logic
Long Condition: If Start_TrendUp or TrendUp is true, a long position is entered.
Short Condition: If Start_TrendDn or TrendDn is true, a short position is entered.
Exit Condition: Dynamic trailing stops are used for exits. If the trend does not continue as indicated by the KNN prediction and SuperTrend direction, an exit signal is generated.
The synergy between SuperTrend and KNN aims to filter out noise and produce more reliable trading signals. While SuperTrend provides a broad sense of the market direction, KNN refines this by predicting short-term price movements, leading to a more nuanced trading strategy.
Local picture
█ Trade Direction
The strategy allows traders to choose between taking only long positions, only short positions, or both. This is particularly useful for adapting to different market conditions.
█ Usage
ToolTips: Explains what each parameter does and how to adjust them.
Inputs: Customize values like the number of neighbors in KNN, ATR multiplier, and moving average type.
Plotting: Visual cues on the chart to indicate bullish or bearish trends.
Order Execution: Based on the generated signals, the strategy will execute buy/sell orders.
█ Default Settings
The default settings are selected to provide a balanced approach, but they can be modified for different trading styles and asset classes.
Initial Capital: $10,000
Default Quantity Type: 10% of equity
Commission: 0.1%
Slippage: 1
Currency: USD
By combining both machine learning and traditional technical analysis, this strategy offers a sophisticated and adaptive trading solution.

YinYang RSI Volume Trend StrategyThere are many strategies that use RSI or Volume but very few that take advantage of how useful and important the two of them combined are. This strategy uses the Highs and Lows with Volume and RSI weighted calculations on top of them. You may be wondering how much of an impact Volume and RSI can have on the prices; the answer is a lot and we will discuss those with plenty of examples below, but first…
How does this strategy work?
It’s simple really, when the purchase source crosses above the inner low band (red) it creates a Buy or Long. This long has a Trailing Stop Loss band (the outer low band that's also red) that can be adjusted in the Settings. The Stop Loss is based on a % of the inner low band’s price and by default it is 0.1% lower than the inner band’s price. This Stop Loss is not only a stop loss but it can also act as a Purchase Available location.
You can get back into a trade after a stop loss / take profit has been hit when your Reset Purchase Availability After condition has been met. This can either be at Stop Loss, Entry or None.
It is advised to allow it to reset in case the stop loss was a fake out but the call was right. Sometimes it may trigger stop loss multiple times in a row, but you don’t lose much on stop loss and you gain lots when the call is right.
The Take Profit location is the basis line (white). Take Profit occurs when the Exit Source (close, open, high, low or other) crosses the basis line and then on a different bar the Exit Source crosses back over the basis line. For example, if it was a Long and the bar’s Exit Source closed above the basis line, and then 2 bars later its Exit Source closed below the basis line, Take Profit would occur. You can disable Take Profit in Settings, but it is very useful as many times the price will cross the Basis and then correct back rather than making it all the way to the opposing zone.
Longs:
If for instance your Long doesn’t need to Take Profit and instead reaches the top zone, it will close the position when it crosses above the inner top line (green).
Please note you can change the Exit Source too which is what source (close, open, high, low) it uses to end the trades.
The Shorts work the same way as the Long but just opposite, they start when the purchase source crosses under the inner upper band (green).
Shorts:
Shorts take profit when it crosses under the basis line and then crosses back.
Shorts will Stop loss when their outer upper band (green) is crossed with the Exit Source.
Short trades are completed and closed when its Exit Source crosses under the inner low red band.
So, now that you understand how the strategy works, let’s discuss why this strategy works and how it is profitable.
First we will discuss Volume as we deem it plays a much bigger role overall and in our strategy:
As I’m sure many of you know, Volume plays a huge factor in how much something moves, but it also plays a role in the strength of the movement. For instance, let’s look at two scenarios:
Bitcoin’s price goes up $1000 in 1 Day but the Volume was only 10 million
Bitcoin’s price goes up $200 in 1 Day but the Volume was 40 million
If you were to only look at the price, you’d say #1 was more important because the price moved x5 the amount as #2, but once you factor in the volume, you know this is not true. The reason why Volume plays such a huge role in Price movement is because it shows there is a large Limit Order battle going on. It means that both Bears and Bulls believe that price is a good time to Buy and Sell. This creates a strong Support and Resistance price point in this location. If we look at scenario #2, when there is high volume, especially if it is drastically larger than the average volume Bitcoin was displaying recently, what can we decipher from this? Well, the biggest take away is that the Bull’s won the battle, and that likely when that happens we will see bullish movement continuing to happen as most of the Bears Limit Orders have been fulfilled. Whereas with #2, when large price movement happens and Bitcoin goes up $1000 with low volume what can we deduce? The main takeaway is that Bull’s pressured the price up with Market Orders where they purchased the best available price, also what this means is there were very few people who were wanting to sell. This generally dictates that Whale Limit orders for Sells/Shorts are much higher up and theres room for movement, but it also means there is likely a whale that is ready to dump and crash it back down.
You may be wondering, what did this example have to do with YinYang RSI Volume Trend Strategy? Well the reason we’ve discussed this is because we use Volume multiple times to apply multiplications in our calculations to add large weight to the price when there is lots of volume (this is applied both positively and negatively). For instance, if the price drops a little and there is high volume, our strategy will move its bounds MUCH lower than the price actually dropped, and if there was low volume but the price dropped A LOT, our strategy will only move its bounds a little. We believe this reflects higher levels of price accuracy than just price alone based on the examples described above.
Don’t believe us?
Here is with Volume NOT factored in (VWMA = SMA and we remove our Volume Filter calculation):
Which produced -$2880 Profit
Here is with our Volume factored in:
Which produced $553,000 (55.3%)
As you can see, we wen’t from $-2800 profit with volume not factored to $553,000 with volume factored. That's quite a big difference! (Please note previous success does not predict future success we are simply displaying the $ amounts as example).
Now how about RSI and why does it matter in this strategy?
As I’m sure most of you are aware, RSI is one of the leading indicators used in trading. For this reason we figured it would only make sense to incorporate it into our calculations. We fiddled with RSI for quite awhile and sometimes what logically seems to be the right way to use it isn’t. Now, because of this, our RSI calculation is a little odd, but basically what we’re doing is we calculate the RSI, then turn it into a percentage (between 0-1) that can easily be multiplied to the price point we need. The price point we use is the difference between our high purchase zone and our low purchase zone. This allows us to see how much price movement there is between zones. We multiply our zone size with our RSI multiplication and we get the amount we will add +/- to our basis line (white line). This officially creates the NEW high and low purchase zones that we are actually using and displaying in our trades.
If you found that confusing, here are some examples to why it is an important calculation for this strategy:
Before RSI factored in:
Which produced 27.8% Profit
After RSI factored in:
Which produced 553% Profit
As you can see, the RSI makes not only the purchase zones more accurate, but it also greatly increases the profit the strategy is able to make. It also helps ensure an relatively linear profit slope so you know it is reliable with its trades.
This strategy can work on pretty much anything, but you should tweak the values a bit for each pair you are trading it with for best results.
We hope you can find some use out of this simple but effective strategy, if you have any questions, comments or concerns please let us know.
HAPPY TRADING!

TradingToolsLibraryLibrary "TradingToolsLibrary"
Easily create advanced entries, exits, filters and qualifiers to simulate strategies. Supports DCA (Dollar Cost Averaging) Lines, Stop Losses, Take Profits (with trailing or without) & ATR.
method deepCopy(this)
This creates a deep copy instead of a shallow copy of an entry_position. This does NOT deep copy the self_pyramiding_positions array reference, since only the master entry_position needs this to track the rest of its copies for efficiency reasons. This is to prevent a feedback loop.
Namespace types: entry_position
Parameters:
this (entry_position)
Returns: entry_position
method precision_fix(this, precision)
Convert a floating point number to a precise floating point number with digit precision to avoid floating point errors in quantity calculations.
Namespace types: series float, simple float, input float, const float
Parameters:
this (float)
precision (int)
Returns: float
xSellBuyMidInterpolation(_x, _high, _low, _sellRange, _buyRange)
Creates an interpolation for a sell range and buy range but with an emphasis on reaching the _low the closer to the middle of the _sell and _buy range you go.
Parameters:
_x (float) : is the value you want to use to control interpolation bewteen the _high and _low value. This will return the lowest percentage at the mid between high and low and highest percentage at the _high and _low.
_high (float)
_low (float)
_sellRange (float)
_buyRange (float)
Returns: an interpolated float between the _high and _low supplied.
xSellBuyInterpolation(_x, _high, _low, _sellRange, _buyRange)
Creates an interpolation a sell range and buy range
Parameters:
_x (float) : is the value you want to use to control interpolation bewteen the _high and _low value.
_high (float)
_low (float)
_sellRange (float)
_buyRange (float)
Returns: an interpolated float between the _high and _low supplied.
activate_entries_and_exits(_entries, _exits, _filters, _qualifiers, _equity)
Determines activation for entries or exits. Does not place the actual orders.
Parameters:
_entries (entry_position )
_exits (exit_position )
_filters (filter )
_qualifiers (qualifier )
_equity (equity_management)
Returns: void
create_entries_and_exits(_entries, _exits, _equity)
Creates actual entry and exit orders if activated
Parameters:
_entries (entry_position )
_exits (exit_position )
_equity (equity_management)
Returns: void
filter
Fields:
disabled (series__bool)
filter_for_entries_or_exits (series__string)
filter_for_groups (series__string)
condition (series__bool)
dynamic_condition (series__bool)
use_dynamic_condition (series__bool)
use_override_default_condition (series__bool)
dynamic_condition_operator (series__string)
dynamic_condition_source (series__float)
dynamic_compare_source (series__float)
dynamic_condition_source_prior (series__float)
dynamic_compare_source_prior (series__float)
use_dynamic_compare_source (series__bool)
dynamic_condition_activate_value (series__string)
expire_condition_activate_value (series__string)
expire_condition_source (series__float)
expire_condition_source_prior (series__float)
expire_compare_source (series__float)
expire_compare_source_prior (series__float)
use_expire_compare_source (series__bool)
expire_condition_operator (series__string)
qualifier
Fields:
disabled (series__bool)
qualify_for_entries_or_exits (series__string)
qualify_for_groups (series__string)
disqualify (series__bool)
condition (series__bool)
dynamic_condition (series__bool)
use_dynamic_condition (series__bool)
use_override_default_condition (series__bool)
dynamic_condition_operator (series__string)
dynamic_condition_source (series__float)
dynamic_compare_source (series__float)
dynamic_condition_source_prior (series__float)
dynamic_compare_source_prior (series__float)
use_dynamic_compare_source (series__bool)
dynamic_condition_activate_value (series__string)
expire_after_x_bars (series__integer)
use_expire_after_x_bars (series__bool)
use_expire_condition (series__bool)
use_override_expire_condition (series__bool)
expire_condition_operator (series__string)
expire_condition_source (series__float)
expire_compare_source (series__float)
expire_condition_source_prior (series__float)
expire_compare_source_prior (series__float)
use_expire_compare_source (series__bool)
expire_condition_activate_value (series__string)
active (series__bool)
expire_after_bars_bar_index (series__integer)
expire_after_bars_bar_index_prior (series__integer)
expire_bar_count (series__integer)
expire_bar_changed (series__bool)
entry_position
Fields:
disabled (series__bool)
activate (series__bool)
active (series__bool)
override_occured (series__bool)
passDebug (array__bool)
initial_activation_price (series__float)
dca_done (series__bool)
condition (series__bool)
dynamic_condition (series__bool)
use_dynamic_condition (series__bool)
use_override_default_condition (series__bool)
dynamic_condition_operator (series__string)
dynamic_condition_source (series__float)
dynamic_compare_source (series__float)
dynamic_condition_source_prior (series__float)
dynamic_compare_source_prior (series__float)
use_dynamic_compare_source (series__bool)
dynamic_condition_activate_value (series__string)
use_cash (series__bool)
use_percent_equity (series__bool)
percent_equity_amount (series__float)
cash_amount (series__float)
position_size (series__float)
total_position_size (series__float)
prior_total_position_size (series__float)
equity_remaining (series__float)
prior_equity_remaining (series__float)
initial_equity (series__float)
use_martingale (series__bool)
martingale_win_ratio (series__float)
martingale_lose_ratio (series__float)
martingale_win_limit (series__integer)
martingale_lose_limit (series__integer)
martingale_limit_reset_mode (series__string)
use_dynamic_percent_equity (series__bool)
dynamic_percent_equity_amount (series__float)
initial_dynamic_percent_equity_amount (series__float)
dynamic_percent_equity_source (series__float)
dynamic_percent_equity_min (series__float)
dynamic_percent_equity_max (series__float)
dynamic_percent_equity_source_sell_range (series__float)
dynamic_percent_equity_source_buy_range (series__float)
dynamic_equity_interpolation_method (series__string)
total_bars (series__integer)
bar_index_at_activate (series__integer)
bars_since_active (series__integer)
time_at_activate (series__integer)
time_since_active (series__integer)
bar_index_at_activated (series__integer)
bar_index_at_pyramid_change (series__integer)
name (series__string)
id (series__string)
group (series__string)
pyramiding_limit (series__integer)
self_pyramiding_limit (series__integer)
self_pyramiding_positions (array__|entry_position|#OBJ)
new_pyramid_cancels_dca (series__bool)
num_active_long_positions (series__integer)
num_active_short_positions (series__integer)
num_active_positions (series__integer)
position_remaining (series__float)
prior_position_remaining (series__float)
direction (series__string)
allow_flip_position (series__bool)
flip_occurred (series__bool)
ignore_flip (series__bool)
use_dca (series__bool)
dca_use_limit (series__bool)
dca_num_positions (series__integer)
dca_positions (array__float)
dca_deviation_percentage (series__float)
dca_scale (series__float)
dca_percentages (series__string)
dca_close_cancels (series__bool)
dca_active_positions (series__integer)
use_atr_deviation (series__bool)
dca_atr_length (series__integer)
dca_atr_mult (series__float)
dca_atr_updates_dca_positions (series__bool)
close_price_at_order (series__float)
dca_use_deviation_atr_min (series__bool)
dca_position_quantities (array__float)
use_dca_dynamic_percent_equity (series__bool)
dca_in_use (array__bool)
dca_activated (array__bool)
dca_money_used (array__float)
dca_lines (array__line)
dca_color (series__color)
show_dca_lines (series__bool)
atr_value (series__float)
atr_value_at_activation (series__float)
use_cooldown_bars (series__bool)
cooldown_bars (series__integer)
cooldown_bar_changed (series__bool)
cooldown_bar_index (series__integer)
cooldown_bar_index_prior (series__integer)
cooldown_bar_change_count (series__integer)
expire_condition_activate_value (series__string)
expire_condition_source (series__float)
expire_condition_source_prior (series__float)
expire_compare_source (series__float)
expire_compare_source_prior (series__float)
use_expire_compare_source (series__bool)
expire_condition_operator (series__string)
exit_position
Fields:
disabled (series__bool)
id (series__string)
group (series__string)
exit_for_entries (series__string)
exit_for_groups (series__string)
total_bars (series__integer)
name (series__string)
condition (series__bool)
dynamic_condition (series__bool)
use_dynamic_condition (series__bool)
use_override_default_condition (series__bool)
dynamic_condition_operator (series__string)
dynamic_condition_source (series__float)
dynamic_compare_source (series__float)
dynamic_condition_source_prior (series__float)
dynamic_compare_source_prior (series__float)
use_dynamic_compare_source (series__bool)
dynamic_condition_activate_value (series__string)
activate (series__bool)
active (series__bool)
reset_equity (series__bool)
use_limit (series__bool)
use_alerts (series__bool)
reset_entry_cooldowns (series__bool)
prevent_new_entries_on_partial_close (series__bool)
show_activation_zone (series__bool)
use_average_position (series__bool)
source_value (series__float)
trigger_x_times (series__integer)
amount_of_times_triggered (series__integer)
quantity_percent (series__float)
trade_qty (series__float)
exit_amount (series__float)
entries_exiting_for (array__|entry_position|#OBJ)
atr_value (series__float)
update_atr (series__bool)
use_activate_after_bars (series__bool)
show_activate_after_bars (series__bool)
activate_after_bars (series__integer)
activate_after_bars_bar_changed (series__bool)
activate_after_bars_bar_index (series__integer)
activate_after_bars_bar_index_prior (series__integer)
activate_after_bars_bar_change_count (series__integer)
all_conditions_pass (series__bool)
use_close_if_profit_only (series__bool)
profit_value (series__float)
exit_type (series__string)
exit_modifier (series__string)
update_atr_with_new_pyramid (series__bool)
percentage (series__float)
activation_percentage (series__float)
atr_multiplier (series__float)
use_cancel_if_percent (series__bool)
cancel_if_percent (series__float)
activation_value (series__float)
activation_value_crossed (series__bool)
exit_value (series__float)
hypo_long_exit_value (series__float)
hypo_short_exit_value (series__float)
close_exit_value (series__float)
debug (series__float)
expire_condition_activate_value (series__string)
expire_condition_source (series__float)
expire_condition_source_prior (series__float)
expire_compare_source (series__float)
expire_compare_source_prior (series__float)
use_expire_compare_source (series__bool)
expire_condition_operator (series__string)
equity_management
Fields:
equity (series__float)
prior_equity (series__float)
position_used (series__float)
prior_position_used (series__float)
prevent_future_entries (series__bool)
minimum_order_size (series__float)
decimal_rounding_precision (series__integer)
direction (series__string)
show_order_info_in_comments (series__bool)
show_order_info_in_labels (series__bool)
allow_longs (series__bool)
allow_shorts (series__bool)
override_occured (series__bool)
flip_occured (series__bool)
num_concurrent_wins (series__integer)
num_concurrent_losses (series__integer)
first_entry (|entry_position|#OBJ)
num_win_trades (series__integer)
num_losing_trades (series__integer)

Liquidation Ranges + Volume/OI Dots [Kioseff Trading]Hello!
Introducing a multi-faceted indicator "Liquidation Ranges + Volume Dots" - this indicator replicates the volume dot tools found on various charting platforms and populates a liquidation range on crypto assets!
Features
Volume/OI dots populated according to user settings
Size of volume/OI dots corresponds to degree of abnormality
Naked level volume dots
Fixed range capabilities for volume/OI dots
Visible time range capabilities for volume/OI dots
Lower timeframe data used to discover iceberg orders (estimated using 1-minute data)
S/R lines drawn at high volume/OI areas
Liquidation ranges for crypto assets (10x - 100x)
Liquidation ranges are calculated using a popular crypto exchange's method
# of violations of liquidation ranges are recorded and presented in table
Pertinent high volume/OI price areas are recorded and presented in table
Personalized coloring for volume/OI dots
Net shorts / net long for the price range recorded
Lines shows reflecting net short & net long increases/decreases
Configurable volume/OI heatmap (displayed between liquidation ranges)
And some more (:
Liquidation Range
The liquidation range component of the indicator uses a popular crypto exchange's calculation (for liquidation ranges) to populate the chart for where 10x - 100x leverage orders are stopped out.
The image above depicts features corresponding to net shorts and net longs.
The image above shows features corresponding to liquidation zones for the underlying coin.
The image above shows the option to display volume/oi delta at the time the corresponding grid was traded at.
The image above shows an instance of using the "fixed range" feature for the script.
*The average price of the range is calculated to project liquidation zones.
*Heatmap is calculated using OI (or volume) delta.
Huge thank you to Pine Wizard @DonovanWall for his range filter code!
Price ranges are automatically detected using his calculation (:
Volume / OI Dots
Similar to other charting platforms, the volume/OI dots component of the indicator distinguishes "abnormal" changes in volume/OI; the detected price area is subsequently identified on the chart.
The detection method uses percent rank and calculates on the last bar of the chart. The "agelessness" of detection is contingent on user settings.
The image above shows volume dots in action; the size of each volume dot corresponds to the amount of volume at the price area.
Smaller dots = lower volume
Larger dots = higher volume
The image above exemplifies the highest aggression setting for volume/OI dot detection.
The table oriented top-right shows the highest volume areas (discovered on the 1-minute chart) for the calculated period.
The open interest change and corresponding price level are also shown. Results are listed in descending order but can also be listed in order of occurrence (most relevant).
Additionally, you can use the visible time range feature to detect volume dots.
The feature shows and explains how the visible range feature works. You select how many levels you want to detect and the script will detect the selected number of levels.
For instance, if I select to show 20 levels, the script will find the 20 highest volume/OI change price areas and distinguish them.
The image above shows a narrower price range.
The image above shows the same price range; however, the script is detecting the highest OI change price areas instead of volume.
* You can also set a fixed range with this feature
* Naked levels can be used
Additionally, you can select for the script to show only the highest volume/ OI change price area for each bar. When active, the script will successively identify the highest volume / OI change price area for the most recent bars.
Naked Levels
The image above shows and explains how naked levels can be detected when using the script.
And that's pretty much it!
Of course, there're a few more features you can check out when you use the script that haven't been explained here (:
Thank you again to @DonovanWall
Thank you to @Trendoscope for his binary insertion sort library (:
Thank you to @PineCoders for their time library
Thank you for checking this out!

improved volumeIt is an indicator that displays the trading volume.
Red-colored candle bars indicate a decrease in trading volume.
Green-colored candle bars indicate an increase in trading volume.
The transparent yellow cloud above the volume bars represents the 21-bar moving average volume, which shows the average volume over the specified period. (You can change the number of bars and the type of moving average from the indicator settings.)
This allows for easier comparison between the current trading volume and the average volume.
In the price scale section, there are 4 target levels. They represent the following in ascending order: Average volume, Average volume multiplied by 2, Average volume multiplied by 3, Average volume multiplied by 4.
Additionally, you can use the alarm feature based on these average volume levels.

Grid Spot Trading Algorithm V2 - The Quant ScienceGrid Spot Trading Algorithm V2 is the last grid trading algorithm made by our developer team.
Grid Spot Trading Algorithm V2 is a fixed 10-level grid trading algorithm. The grid is divided into an accumulation area (red) and a selling area (green).
In the accumulation area, the algorithm will place new buy orders, selling the long positions on the top of the grid.
BUYING AND SELLING LOGIC
The algorithm places up to 5 limit orders on the accumulation section of the grid, each time the price cross through the middle grid. Each single order uses 20% of the equity.
Positions are closed at the top of the grid by default, with the algorithm closing all orders at the first sell level. The exit level can be adjusted using the user interface, from the first level up to the fifth level above.
CONFIGURING THE ALGORITHM
1) Add it to the chart: Add the script to the current chart that you want to analyze.
2) Select the top of the grid: Confirm a price level with the mouse on which to fix the top of the grid.
3) Select the bottom of the grid: Confirm a price level with the mouse on which to fix the bottom of the grid.
4) Wait for the automatic creation of the grid.
USING THE ALGORITHM
Once the grid configuration process is completed, the algorithm will generate automatic backtesting.
You can add a stop loss that destroys the grid by setting the destruction price and activating the feature from the user interface. When the stop loss is activated, you can view it on the chart.

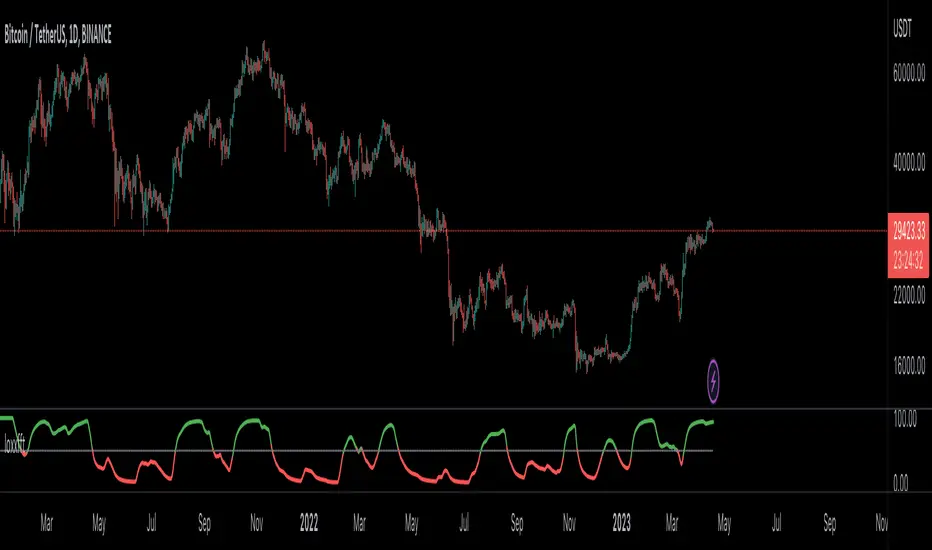
loxxfftLibrary "loxxfft"
This code is a library for performing Fast Fourier Transform (FFT) operations. FFT is an algorithm that can quickly compute the discrete Fourier transform (DFT) of a sequence. The library includes functions for performing FFTs on both real and complex data. It also includes functions for fast correlation and convolution, which are operations that can be performed efficiently using FFTs. Additionally, the library includes functions for fast sine and cosine transforms.
Reference:
www.alglib.net
fastfouriertransform(a, nn, inversefft)
Returns Fast Fourier Transform
Parameters:
a (float ) : float , An array of real and imaginary parts of the function values. The real part is stored at even indices, and the imaginary part is stored at odd indices.
nn (int) : int, The number of function values. It must be a power of two, but the algorithm does not validate this.
inversefft (bool) : bool, A boolean value that indicates the direction of the transformation. If True, it performs the inverse FFT; if False, it performs the direct FFT.
Returns: float , Modifies the input array a in-place, which means that the transformed data (the FFT result for direct transformation or the inverse FFT result for inverse transformation) will be stored in the same array a after the function execution. The transformed data will have real and imaginary parts interleaved, with the real parts at even indices and the imaginary parts at odd indices.
realfastfouriertransform(a, tnn, inversefft)
Returns Real Fast Fourier Transform
Parameters:
a (float ) : float , A float array containing the real-valued function samples.
tnn (int) : int, The number of function values (must be a power of 2, but the algorithm does not validate this condition).
inversefft (bool) : bool, A boolean flag that indicates the direction of the transformation (True for inverse, False for direct).
Returns: float , Modifies the input array a in-place, meaning that the transformed data (the FFT result for direct transformation or the inverse FFT result for inverse transformation) will be stored in the same array a after the function execution.
fastsinetransform(a, tnn, inversefst)
Returns Fast Discrete Sine Conversion
Parameters:
a (float ) : float , An array of real numbers representing the function values.
tnn (int) : int, Number of function values (must be a power of two, but the code doesn't validate this).
inversefst (bool) : bool, A boolean flag indicating the direction of the transformation. If True, it performs the inverse FST, and if False, it performs the direct FST.
Returns: float , The output is the transformed array 'a', which will contain the result of the transformation.
fastcosinetransform(a, tnn, inversefct)
Returns Fast Discrete Cosine Transform
Parameters:
a (float ) : float , This is a floating-point array representing the sequence of values (time-domain) that you want to transform. The function will perform the Fast Cosine Transform (FCT) or the inverse FCT on this input array, depending on the value of the inversefct parameter. The transformed result will also be stored in this same array, which means the function modifies the input array in-place.
tnn (int) : int, This is an integer value representing the number of data points in the input array a. It is used to determine the size of the input array and control the loops in the algorithm. Note that the size of the input array should be a power of 2 for the Fast Cosine Transform algorithm to work correctly.
inversefct (bool) : bool, This is a boolean value that controls whether the function performs the regular Fast Cosine Transform or the inverse FCT. If inversefct is set to true, the function will perform the inverse FCT, and if set to false, the regular FCT will be performed. The inverse FCT can be used to transform data back into its original form (time-domain) after the regular FCT has been applied.
Returns: float , The resulting transformed array is stored in the input array a. This means that the function modifies the input array in-place and does not return a new array.
fastconvolution(signal, signallen, response, negativelen, positivelen)
Convolution using FFT
Parameters:
signal (float ) : float , This is an array of real numbers representing the input signal that will be convolved with the response function. The elements are numbered from 0 to SignalLen-1.
signallen (int) : int, This is an integer representing the length of the input signal array. It specifies the number of elements in the signal array.
response (float ) : float , This is an array of real numbers representing the response function used for convolution. The response function consists of two parts: one corresponding to positive argument values and the other to negative argument values. Array elements with numbers from 0 to NegativeLen match the response values at points from -NegativeLen to 0, respectively. Array elements with numbers from NegativeLen+1 to NegativeLen+PositiveLen correspond to the response values in points from 1 to PositiveLen, respectively.
negativelen (int) : int, This is an integer representing the "negative length" of the response function. It indicates the number of elements in the response function array that correspond to negative argument values. Outside the range , the response function is considered zero.
positivelen (int) : int, This is an integer representing the "positive length" of the response function. It indicates the number of elements in the response function array that correspond to positive argument values. Similar to negativelen, outside the range , the response function is considered zero.
Returns: float , The resulting convolved values are stored back in the input signal array.
fastcorrelation(signal, signallen, pattern, patternlen)
Returns Correlation using FFT
Parameters:
signal (float ) : float ,This is an array of real numbers representing the signal to be correlated with the pattern. The elements are numbered from 0 to SignalLen-1.
signallen (int) : int, This is an integer representing the length of the input signal array.
pattern (float ) : float , This is an array of real numbers representing the pattern to be correlated with the signal. The elements are numbered from 0 to PatternLen-1.
patternlen (int) : int, This is an integer representing the length of the pattern array.
Returns: float , The signal array containing the correlation values at points from 0 to SignalLen-1.
tworealffts(a1, a2, a, b, tn)
Returns Fast Fourier Transform of Two Real Functions
Parameters:
a1 (float ) : float , An array of real numbers, representing the values of the first function.
a2 (float ) : float , An array of real numbers, representing the values of the second function.
a (float ) : float , An output array to store the Fourier transform of the first function.
b (float ) : float , An output array to store the Fourier transform of the second function.
tn (int) : float , An integer representing the number of function values. It must be a power of two, but the algorithm doesn't validate this condition.
Returns: float , The a and b arrays will contain the Fourier transform of the first and second functions, respectively. Note that the function overwrites the input arrays a and b.
█ Detailed explaination of each function
Fast Fourier Transform
The fastfouriertransform() function takes three input parameters:
1. a: An array of real and imaginary parts of the function values. The real part is stored at even indices, and the imaginary part is stored at odd indices.
2. nn: The number of function values. It must be a power of two, but the algorithm does not validate this.
3. inversefft: A boolean value that indicates the direction of the transformation. If True, it performs the inverse FFT; if False, it performs the direct FFT.
The function performs the FFT using the Cooley-Tukey algorithm, which is an efficient algorithm for computing the discrete Fourier transform (DFT) and its inverse. The Cooley-Tukey algorithm recursively breaks down the DFT of a sequence into smaller DFTs of subsequences, leading to a significant reduction in computational complexity. The algorithm's time complexity is O(n log n), where n is the number of samples.
The fastfouriertransform() function first initializes variables and determines the direction of the transformation based on the inversefft parameter. If inversefft is True, the isign variable is set to -1; otherwise, it is set to 1.
Next, the function performs the bit-reversal operation. This is a necessary step before calculating the FFT, as it rearranges the input data in a specific order required by the Cooley-Tukey algorithm. The bit-reversal is performed using a loop that iterates through the nn samples, swapping the data elements according to their bit-reversed index.
After the bit-reversal operation, the function iteratively computes the FFT using the Cooley-Tukey algorithm. It performs calculations in a loop that goes through different stages, doubling the size of the sub-FFT at each stage. Within each stage, the Cooley-Tukey algorithm calculates the butterfly operations, which are mathematical operations that combine the results of smaller DFTs into the final DFT. The butterfly operations involve complex number multiplication and addition, updating the input array a with the computed values.
The loop also calculates the twiddle factors, which are complex exponential factors used in the butterfly operations. The twiddle factors are calculated using trigonometric functions, such as sine and cosine, based on the angle theta. The variables wpr, wpi, wr, and wi are used to store intermediate values of the twiddle factors, which are updated in each iteration of the loop.
Finally, if the inversefft parameter is True, the function divides the result by the number of samples nn to obtain the correct inverse FFT result. This normalization step is performed using a loop that iterates through the array a and divides each element by nn.
In summary, the fastfouriertransform() function is an implementation of the Cooley-Tukey FFT algorithm, which is an efficient algorithm for computing the DFT and its inverse. This FFT library can be used for a variety of applications, such as signal processing, image processing, audio processing, and more.
Feal Fast Fourier Transform
The realfastfouriertransform() function performs a fast Fourier transform (FFT) specifically for real-valued functions. The FFT is an efficient algorithm used to compute the discrete Fourier transform (DFT) and its inverse, which are fundamental tools in signal processing, image processing, and other related fields.
This function takes three input parameters:
1. a - A float array containing the real-valued function samples.
2. tnn - The number of function values (must be a power of 2, but the algorithm does not validate this condition).
3. inversefft - A boolean flag that indicates the direction of the transformation (True for inverse, False for direct).
The function modifies the input array a in-place, meaning that the transformed data (the FFT result for direct transformation or the inverse FFT result for inverse transformation) will be stored in the same array a after the function execution.
The algorithm uses a combination of complex-to-complex FFT and additional transformations specific to real-valued data to optimize the computation. It takes into account the symmetry properties of the real-valued input data to reduce the computational complexity.
Here's a detailed walkthrough of the algorithm:
1. Depending on the inversefft flag, the initial values for ttheta, c1, and c2 are determined. These values are used for the initial data preprocessing and post-processing steps specific to the real-valued FFT.
2. The preprocessing step computes the initial real and imaginary parts of the data using a combination of sine and cosine terms with the input data. This step effectively converts the real-valued input data into complex-valued data suitable for the complex-to-complex FFT.
3. The complex-to-complex FFT is then performed on the preprocessed complex data. This involves bit-reversal reordering, followed by the Cooley-Tukey radix-2 decimation-in-time algorithm. This part of the code is similar to the fastfouriertransform() function you provided earlier.
4. After the complex-to-complex FFT, a post-processing step is performed to obtain the final real-valued output data. This involves updating the real and imaginary parts of the transformed data using sine and cosine terms, as well as the values c1 and c2.
5. Finally, if the inversefft flag is True, the output data is divided by the number of samples (nn) to obtain the inverse DFT.
The function does not return a value explicitly. Instead, the transformed data is stored in the input array a. After the function execution, you can access the transformed data in the a array, which will have the real part at even indices and the imaginary part at odd indices.
Fast Sine Transform
This code defines a function called fastsinetransform that performs a Fast Discrete Sine Transform (FST) on an array of real numbers. The function takes three input parameters:
1. a (float array): An array of real numbers representing the function values.
2. tnn (int): Number of function values (must be a power of two, but the code doesn't validate this).
3. inversefst (bool): A boolean flag indicating the direction of the transformation. If True, it performs the inverse FST, and if False, it performs the direct FST.
The output is the transformed array 'a', which will contain the result of the transformation.
The code starts by initializing several variables, including trigonometric constants for the sine transform. It then sets the first value of the array 'a' to 0 and calculates the initial values of 'y1' and 'y2', which are used to update the input array 'a' in the following loop.
The first loop (with index 'jx') iterates from 2 to (tm + 1), where 'tm' is half of the number of input samples 'tnn'. This loop is responsible for calculating the initial sine transform of the input data.
The second loop (with index 'ii') is a bit-reversal loop. It reorders the elements in the array 'a' based on the bit-reversed indices of the original order.
The third loop (with index 'ii') iterates while 'n' is greater than 'mmax', which starts at 2 and doubles each iteration. This loop performs the actual Fast Discrete Sine Transform. It calculates the sine transform using the Danielson-Lanczos lemma, which is a divide-and-conquer strategy for calculating Discrete Fourier Transforms (DFTs) efficiently.
The fourth loop (with index 'ix') is responsible for the final phase adjustments needed for the sine transform, updating the array 'a' accordingly.
The fifth loop (with index 'jj') updates the array 'a' one more time by dividing each element by 2 and calculating the sum of the even-indexed elements.
Finally, if the 'inversefst' flag is True, the code scales the transformed data by a factor of 2/tnn to get the inverse Fast Sine Transform.
In summary, the code performs a Fast Discrete Sine Transform on an input array of real numbers, either in the direct or inverse direction, and returns the transformed array. The algorithm is based on the Danielson-Lanczos lemma and uses a divide-and-conquer strategy for efficient computation.
Fast Cosine Transform
This code defines a function called fastcosinetransform that takes three parameters: a floating-point array a, an integer tnn, and a boolean inversefct. The function calculates the Fast Cosine Transform (FCT) or the inverse FCT of the input array, depending on the value of the inversefct parameter.
The Fast Cosine Transform is an algorithm that converts a sequence of values (time-domain) into a frequency domain representation. It is closely related to the Fast Fourier Transform (FFT) and can be used in various applications, such as signal processing and image compression.
Here's a detailed explanation of the code:
1. The function starts by initializing a number of variables, including counters, intermediate values, and constants.
2. The initial steps of the algorithm are performed. This includes calculating some trigonometric values and updating the input array a with the help of intermediate variables.
3. The code then enters a loop (from jx = 2 to tnn / 2). Within this loop, the algorithm computes and updates the elements of the input array a.
4. After the loop, the function prepares some variables for the next stage of the algorithm.
5. The next part of the algorithm is a series of nested loops that perform the bit-reversal permutation and apply the FCT to the input array a.
6. The code then calculates some additional trigonometric values, which are used in the next loop.
7. The following loop (from ix = 2 to tnn / 4 + 1) computes and updates the elements of the input array a using the previously calculated trigonometric values.
8. The input array a is further updated with the final calculations.
9. In the last loop (from j = 4 to tnn), the algorithm computes and updates the sum of elements in the input array a.
10. Finally, if the inversefct parameter is set to true, the function scales the input array a to obtain the inverse FCT.
The resulting transformed array is stored in the input array a. This means that the function modifies the input array in-place and does not return a new array.
Fast Convolution
This code defines a function called fastconvolution that performs the convolution of a given signal with a response function using the Fast Fourier Transform (FFT) technique. Convolution is a mathematical operation used in signal processing to combine two signals, producing a third signal representing how the shape of one signal is modified by the other.
The fastconvolution function takes the following input parameters:
1. float signal: This is an array of real numbers representing the input signal that will be convolved with the response function. The elements are numbered from 0 to SignalLen-1.
2. int signallen: This is an integer representing the length of the input signal array. It specifies the number of elements in the signal array.
3. float response: This is an array of real numbers representing the response function used for convolution. The response function consists of two parts: one corresponding to positive argument values and the other to negative argument values. Array elements with numbers from 0 to NegativeLen match the response values at points from -NegativeLen to 0, respectively. Array elements with numbers from NegativeLen+1 to NegativeLen+PositiveLen correspond to the response values in points from 1 to PositiveLen, respectively.
4. int negativelen: This is an integer representing the "negative length" of the response function. It indicates the number of elements in the response function array that correspond to negative argument values. Outside the range , the response function is considered zero.
5. int positivelen: This is an integer representing the "positive length" of the response function. It indicates the number of elements in the response function array that correspond to positive argument values. Similar to negativelen, outside the range , the response function is considered zero.
The function works by:
1. Calculating the length nl of the arrays used for FFT, ensuring it's a power of 2 and large enough to hold the signal and response.
2. Creating two new arrays, a1 and a2, of length nl and initializing them with the input signal and response function, respectively.
3. Applying the forward FFT (realfastfouriertransform) to both arrays, a1 and a2.
4. Performing element-wise multiplication of the FFT results in the frequency domain.
5. Applying the inverse FFT (realfastfouriertransform) to the multiplied results in a1.
6. Updating the original signal array with the convolution result, which is stored in the a1 array.
The result of the convolution is stored in the input signal array at the function exit.
Fast Correlation
This code defines a function called fastcorrelation that computes the correlation between a signal and a pattern using the Fast Fourier Transform (FFT) method. The function takes four input arguments and modifies the input signal array to store the correlation values.
Input arguments:
1. float signal: This is an array of real numbers representing the signal to be correlated with the pattern. The elements are numbered from 0 to SignalLen-1.
2. int signallen: This is an integer representing the length of the input signal array.
3. float pattern: This is an array of real numbers representing the pattern to be correlated with the signal. The elements are numbered from 0 to PatternLen-1.
4. int patternlen: This is an integer representing the length of the pattern array.
The function performs the following steps:
1. Calculate the required size nl for the FFT by finding the smallest power of 2 that is greater than or equal to the sum of the lengths of the signal and the pattern.
2. Create two new arrays a1 and a2 with the length nl and initialize them to 0.
3. Copy the signal array into a1 and pad it with zeros up to the length nl.
4. Copy the pattern array into a2 and pad it with zeros up to the length nl.
5. Compute the FFT of both a1 and a2.
6. Perform element-wise multiplication of the frequency-domain representation of a1 and the complex conjugate of the frequency-domain representation of a2.
7. Compute the inverse FFT of the result obtained in step 6.
8. Store the resulting correlation values in the original signal array.
At the end of the function, the signal array contains the correlation values at points from 0 to SignalLen-1.
Fast Fourier Transform of Two Real Functions
This code defines a function called tworealffts that computes the Fast Fourier Transform (FFT) of two real-valued functions (a1 and a2) using a Cooley-Tukey-based radix-2 Decimation in Time (DIT) algorithm. The FFT is a widely used algorithm for computing the discrete Fourier transform (DFT) and its inverse.
Input parameters:
1. float a1: an array of real numbers, representing the values of the first function.
2. float a2: an array of real numbers, representing the values of the second function.
3. float a: an output array to store the Fourier transform of the first function.
4. float b: an output array to store the Fourier transform of the second function.
5. int tn: an integer representing the number of function values. It must be a power of two, but the algorithm doesn't validate this condition.
The function performs the following steps:
1. Combine the two input arrays, a1 and a2, into a single array a by interleaving their elements.
2. Perform a 1D FFT on the combined array a using the radix-2 DIT algorithm.
3. Separate the FFT results of the two input functions from the combined array a and store them in output arrays a and b.
Here is a detailed breakdown of the radix-2 DIT algorithm used in this code:
1. Bit-reverse the order of the elements in the combined array a.
2. Initialize the loop variables mmax, istep, and theta.
3. Enter the main loop that iterates through different stages of the FFT.
a. Compute the sine and cosine values for the current stage using the theta variable.
b. Initialize the loop variables wr and wi for the current stage.
c. Enter the inner loop that iterates through the butterfly operations within each stage.
i. Perform the butterfly operation on the elements of array a.
ii. Update the loop variables wr and wi for the next butterfly operation.
d. Update the loop variables mmax, istep, and theta for the next stage.
4. Separate the FFT results of the two input functions from the combined array a and store them in output arrays a and b.
At the end of the function, the a and b arrays will contain the Fourier transform of the first and second functions, respectively. Note that the function overwrites the input arrays a and b.
█ Example scripts using functions contained in loxxfft
Real-Fast Fourier Transform of Price w/ Linear Regression
Real-Fast Fourier Transform of Price Oscillator
Normalized, Variety, Fast Fourier Transform Explorer
Variety RSI of Fast Discrete Cosine Transform
STD-Stepped Fast Cosine Transform Moving Average
Ectopic Bar by Moti RakamEctopic Bar is an indicator that highlights a pin-bar candle that has divergence in it's shape and volume delta. To find volume delta, code of standard Up/Down volume indicator has been used.
PIN BAR : pin bar are marked by using Close Range option parameter. Default value is set to 0.35 which implies any candle that closes in the 35% of its high/low will be considered a pin bar (of course the code also ensures that rest of the bar body is only a wick).
HOW IT WORKS:
Up/Down volume variables "Up Volume" and "Down Volume" are checked against the shape of the pin bar to find an ectopic situation. For example, if a bullish pin bar candle (a bullish hammer) has more sell volume than buy volume, that's an ectopic situation. The bullish hammer shows a buying push from the bottom of the wick, instead the up/down volume indicator shows there were more sell orders than buy orders. Hence the ectopic situation. Similarly, an inverted hammer (a bearish hammer) in general should have more sell volume, but instead if it has more buying volume, the indicator highlights it as an ectopic bar.
Ectopic Bars are painted in yellow colour.

X48 - Strategy | BreakOut & Consecutive (11in1) + Alert | V.1.2================== Read This First Before Use This Strategy ==============
*********** Please be aware that this strategy is not a guarantee of success and may lead to losses.
*********** Trading involves risk and you should always do your own research before making any decisions.
================= Thanks Source Script and Explain This Strategy ===================
► Description
Write a detailed and meaningful description that allows users to understand how your script is original, what it does, how it does it and how to use it
This Strategy Are Combine Strategy and Indicators Alert Function For Systematic Trading User.
Strategy List, Thanks For Original Source Script , From Tradingview Build-in Script From fmzquant Github
// Channel BreakOut Strategy : Calculate BreakOut Zone For Buy and Sell.
// Consecutive Bars UP/Down Strategy : The consecutive bars up/down strategy is a trading strategy used to identify potential buy and sell signals in the stock market. This strategy involves looking for a series of bars (or candles) that are either all increasing or all decreasing in price. If the bars are all increasing, it can be a signal to buy, and if the bars are all decreasing, it can be a signal to sell. This strategy can be used on any timeframe, from a daily chart to an intraday chart.
// 15m Range Length SD : Range Of High and Low Candle Price and Lookback For Calculate Buy and Sell.
Indicators Are Simple Source Script (Almost I'm Chating With CHAT-GPT and Convert pinescript V4 to V5 again for complete almost script and combine after)
// SwingHigh and SwingLow Plot For SL (StopLoss by Last Swing).
// Engulfing and 3 Candle Engulfing Plot.
// Stochastic RSI for Plot and Fill Background Paint and Plot TEXT For BULL and BEAR TREND.
// MA TYPE MODE are plot 2 line of MA Type (EMA, SMA, HMA, WMA, VWMA) for Crossover and Crossunder.
// Donchian Fans MODE are Plot Dot Line With Triangle Degree Bull Trend is Green Plot and Bear Trend is Red Plot.
// Ichimoku Cloud Are Plot Cloud A-B For Bull and Bear Trend.
// RSI OB and OS for TEXT PLOT 'OB' , 'OS' you will know after OB and OS, you can combo with other indicators that's make you know what's the similar trend look like?
// MACD for Plot Diamond when MACD > 0 and MACD < 0, you can combo with other indicators that's make you know what's the similar trend look like?
Alert Can Alert Sent When Buy and Sell or TP and SL, you can adjust text to alert sent by your self or use default setting.
========== Let'e Me Explain How To Use This Strategy =============
========== Properties Setting ==========
// Capital : Default : 1,000 USDT For Alot Of People Are Beginner Investor = It's Capital Your Cash For Investment
// Ordersize : Default Are Setting 5% / Order We Call Compounded
========== INPUT Setting ==========
// First Part Use Must Choose Checkbox For Use of Strategy and Choose TP/SL by Swing or % (can choose both)
// In Detail Of Setting Are Not Too Much, Please Read The Header Of Setting Before Change The Value
// For The Indicator In List You Want To Add Just Check ✅ From MODE Setting, It's Show On Your Chart
// You Can Custom TP/SL % You Want
========== ##### No trading strategy is guaranteed to be 100% successful. ###### =========
For Example In My Systematic Trading
Select 1/3 Strategy Setting TP/SL % Match With Timeframe TP Long Are Not Set It's Can 161.8 - 423.6% but Short Position Are Not Than 100% Just Fine From Your Aset
Choose Indicators For Make Sure Trend and Strategy are the same way like Strategy are Long Position but MACD and Sto background is bear. that's mean this time not open position.
Donchian Fans is Simple Support and Ressistant If You Don't Know How To Plot That's, This indicator plot a simple for you ><.
Make Sure With Engulfing and 3 Candle Engulfing If You Don't Know, What's The Engulfing, This Indicator are plot for you too ><.
For a Big Trend You can use Ichimoku Cloud For Check Trend, Candle Upper Than Cloud or Lower Than Cloud for Bull and Bear Trend.

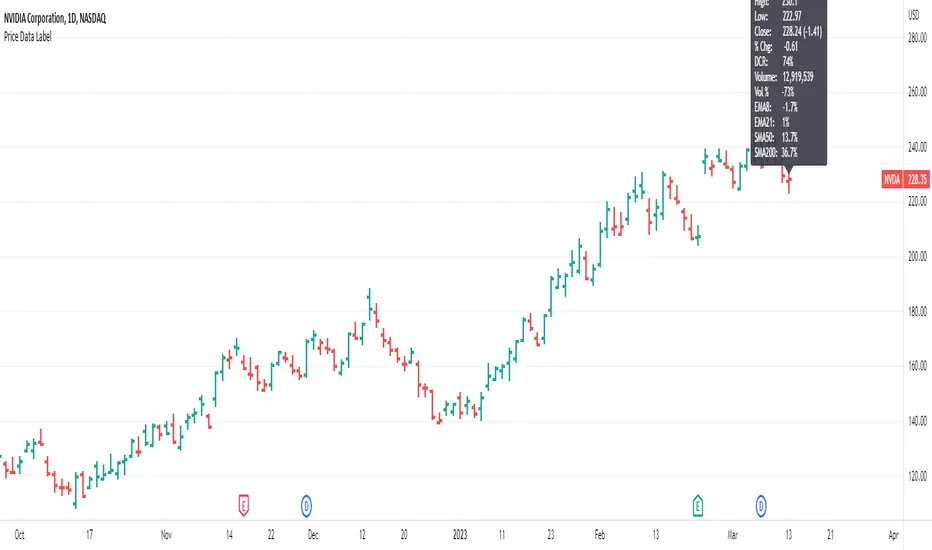
Price Data LabelThis indicator gives you the ability to see historical data for each bar on the chart by simply hovering over the high of the bar, similar to the functionality of MarketSmith.
Data for each bar includes:
Open
High
Low
Close + Change
Percentage Change
Closing Range
Volume
Volume Percent based on 50 day average
Distance to 4 selectable moving averages
Example of stats on a historical bar:
* Note this only works on the last 500 historical bars. If you use bar replay it will work with 500 historical bars from the last bar.
* If you have multiple indicators on your chart, in order to see the data you will need to use visual order to bring to front. This can be done by clicking the three dots next to the indicator name and selecting visual order.
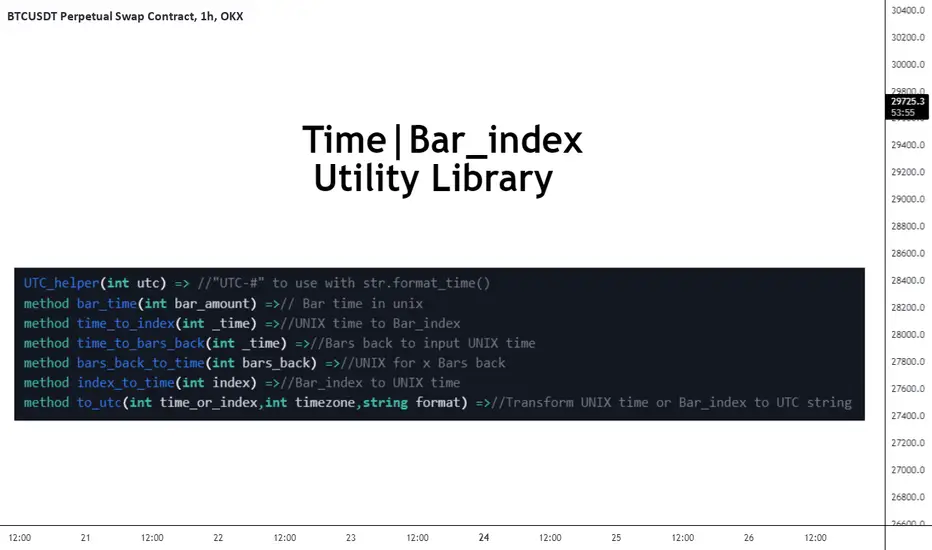
FrizLabz_Time_Utility_MethodsLibrary "FrizLabz_Time_Utility_Methods"
Some time to index and index to time helper methods made them for another library thought I would try to make
them as methods
UTC_helper(utc)
UTC helper function this adds the + to the positive utc times, add "UTC" to the string
and can be used in the timezone arg of for format_time()
Parameters:
utc : (int) | +/- utc offset
Returns: string | string to be added to the timezone paramater for utc timezone usage
bar_time(bar_amount)
from a time to index
Parameters:
bar_amount : (int) | default - 1)
Returns: int bar_time
time_to_index(_time)
from time to bar_index
Parameters:
_time : (int)
Returns: int time_to_index | bar_index that corresponds to time provided
time_to_bars_back(_time)
from a time quanity to bar quanity for use with .
Parameters:
_time : (int)
Returns: int bars_back | yeilds the amount of bars from current bar to reach _time provided
bars_back_to_time(bars_back)
from bars_back to time
Parameters:
bars_back
Returns: int | using same logic as this will return the
time of the bar = to the bar that corresponds to bars_back
index_time(index)
bar_index to UNIX time
Parameters:
index : (int)
Returns: int time | time in unix that corrresponds to the bar_index
to_utc(time_or_index, timezone, format)
method to use with a time or bar_index variable that will detect if it is an index or unix time
and convert it to a printable string
Parameters:
time_or_index : (int) required) | time in unix or bar_index
timezone : (int) required) | utc offset to be appled to output
format : (string) | default - "yyyy-MM-dd'T'HH:mm:ssZ") | the format for the time, provided string is
default one from str.format_time()
Returns: string | time formatted string
GET(line)
Gets the location paramaters of a Line
Parameters:
line : (line)
Returns: tuple
GET(box)
Gets the location paramaters of a Box
Parameters:
box : (box)
Returns: tuple
GET(label)
Gets the location paramaters and text of a Label
Parameters:
label : (label)
Returns: tuple
GET(linefill)
Gets line 1 and 2 from a Linefill
Parameters:
linefill : (linefill)
Returns: tuple
Format(line, timezone)
converts Unix time in time or index params to formatted time
and returns a tuple of the params as string with the time/index params formatted
Parameters:
line : (line) | required
timezone : (int) | default - na
Returns: tuple
Line(x1, y1, x2, y2, extend, color, style, width)
similar to line.new() with the exception
of not needing to include y2 for a flat line, y1 defaults to close,
and it doesnt require xloc.bar_time or xloc.bar_index, if no x1
Parameters:
x1 : (int) default - time
y1 : (float) default - close
x2 : (int) default - last_bar_time/last_bar_index | not required for line that ends on current bar
y2 : (float) default - y1 | not required for flat line
extend : (string) default - extend.none | extend.left, extend.right, extend.both
color : (color) default - chart.fg_color
style : (string) default - line.style_solid | line.style_dotted, line.style_dashed,
line.style_arrow_both, line.style_arrow_left, line.style_arrow_right
width
Returns: line
Box(left, top, right, bottom, extend, border_color, bgcolor, text_color, border_width, border_style, txt, text_halign, text_valign, text_size, text_wrap)
similar to box.new() but only requires top and bottom to create box,
auto detects if it is bar_index or time used in the (left) arg. xloc.bar_time and xloc.bar_index are not used
args are ordered by purpose | position -> colors -> styling -> text options
Parameters:
left : (int) default - time
top : (float) required
right : (int) default - last_bar_time/last_bar_index | will default to current bar index or time
depending on (left) arg
bottom : (float) required
extend : (string) default - extend.none | extend.left, extend.right, extend.both
border_color : (color) default - chart.fg_color
bgcolor : (color) default - color.new(chart.fg_color,75)
text_color : (color) default - chart.bg_color
border_width : (int) default - 1
border_style : (string) default - line.style_solid | line.style_dotted, line.style_dashed,
txt : (string) default - ''
text_halign : (string) default - text.align_center | text.align_left, text.align_right
text_valign : (string) default - text.align_center | text.align_top, text.align_bottom
text_size : (string) default - size.normal | size.tiny, size.small, size.large, size.huge
text_wrap : (string) default - text.wrap_auto | text.wrap_none
Returns: box
Label(x, y, txt, yloc, color, textcolor, style, size, textalign, text_font_family, tooltip)
similar to label.new() but only requires no args to create label,
auto detects if it is bar_index or time used in the (x) arg. xloc.bar_time and xloc.bar_index are not used
args are ordered by purpose | position -> colors -> styling -> text options
Parameters:
x : (int) default - time
y : (float) default - high or low | depending on bar direction
txt : (string) default - ''
yloc : (string) default - yloc.price | yloc.price, yloc.abovebar, yloc.belowbar
color : (color) default - chart.fg_color
textcolor : (color) default - chart.bg_color
style : (string) default - label.style_label_down | label.style_none
label.style_xcross,label.style_cross,label.style_triangleup,label.style_triangledown
label.style_flag, label.style_circle, label.style_arrowup, label.style_arrowdown,
label.style_label_up, label.style_label_down, label.style_label_left, label.style_label_right,
label.style_label_lower_left, label.style_label_lower_right, label.style_label_upper_left,
label.style_label_upper_right, label.style_label_center, label.style_square,
label.style_diamond
size : (string) default - size.normal | size.tiny, size.small, size.large, size.huge
textalign : (string) default - text.align_center | text.align_left, text.align_right
text_font_family : (string) default - font.family_default | font.family_monospace
tooltip : (string) default - na
Returns: label
Assassin's Grid
Introduction: Are you a fan of automated grid-based trading and holding onto your crypto assets like they're the last Snickers bar in the world? If so, this Pine script could be your new best friend!
Grid Trading Genius: The script uses some seriously advanced grid trading techniques to automatically place orders at different price levels, creating a mesh of positions that move with the market like a well-oiled machine. This strategy can be great for traders who are willing to sit back and let their positions grow like a fine wine over time.
Optimization Features: The script comes loaded with all sorts of features and tools to help traders optimize their grid positions, like position exits and custom alerts for creating limit and market orders. This helps keep traders in the loop and allows them to take action as needed, like a ninja in the night.
Unique Twists: One of the unique features of this script is the option to choose between normal or incremental entry steps in a 1,2,3,... ratio. By choosing incremental entries, traders can potentially improve their average price and increase their potential profits like a boss. Just keep in mind that this script doesn't have a stop loss feature, but it does include the option to sell without profit on the final entry or on all entries if desired. Additionally, the script is always open to improvement and any ideas for improving it are welcome, like a blank canvas.
Conclusion: If you love automated trading and have the patience and determination to stick to a solid strategy, this Pine script could be a great fit for you. It's suitable for traders who are comfortable with more complex trading approaches and are willing to put in the time and effort to learn and master the script's various features and techniques, like a Jedi Knight
MarketStructureLibrary "MarketStructure"
This library contains functions for identifying Lows and Highs in a rule-based way, and deriving useful information from them.
f_simpleLowHigh()
This function finds Local Lows and Highs, but NOT in order. A Local High is any candle that has its Low taken out on close by a subsequent candle (and vice-versa for Local Lows).
The Local High does NOT have to be the candle with the highest High out of recent candles. It does NOT have to be a Williams High. It is not necessarily a swing high or a reversal or anything else.
It doesn't have to be "the" high, so don't be confused.
By the rules, Local Lows and Highs must alternate. In this function they do not, so I'm calling them Simple Lows and Highs.
Simple Highs and Lows, by the above definition, can be useful for entries and stops. Because I intend to use them for stops, I want them all, not just the ones that alternate in strict order.
@param - there are no parameters. The function uses the chart OHLC.
@returns boolean values for whether this bar confirms a Simple Low/High, and ints for the bar_index of that Low/High.
f_localLowHigh()
This function finds Local Lows and Highs, in order. A Local High is any candle that has its Low taken out on close by a subsequent candle (and vice-versa for Local Lows).
The Local High does NOT have to be the candle with the highest High out of recent candles. It does NOT have to be a Williams High. It is not necessarily a swing high or a reversal or anything else.
By the rules, Local Lows and Highs must alternate, and in this function they do.
@param - there are no parameters. The function uses the chart OHLC.
@returns boolean values for whether this bar confirms a Local Low/High, and ints for the bar_index of that Low/High.
f_enhancedSimpleLowHigh()
This function finds Local Lows and Highs, but NOT in order. A Local High is any candle that has its Low taken out on close by a subsequent candle (and vice-versa for Local Lows).
The Local High does NOT have to be the candle with the highest High out of recent candles. It does NOT have to be a Williams High. It is not necessarily a swing high or a reversal or anything else.
By the rules, Local Lows and Highs must alternate. In this function they do not, so I'm calling them Simple Lows and Highs.
Simple Highs and Lows, by the above definition, can be useful for entries and stops. Because I intend to use them for trailing stops, I want them all, not just the ones that alternate in strict order.
The difference between this function and f_simpleLowHigh() is that it also tracks the lowest/highest recent level. This level can be useful for trailing stops.
In effect, these are like more "normal" highs and lows that you would pick by eye, but confirmed faster in many cases than by waiting for the low/high of that particular candle to be taken out on close,
because they are instead confirmed by ANY subsequent candle having its low/high exceeded. Hence, I call these Enhanced Simple Lows/Highs.
The levels are taken from the extreme highs/lows, but the bar indexes are given for the candles that were actually used to confirm the Low/High.
This is by design, because it might be misleading to label the extreme, since we didn't use that candle to confirm the Low/High..
@param - there are no parameters. The function uses the chart OHLC.
@returns - boolean values for whether this bar confirms an Enhanced Simple Low/High
ints for the bar_index of that Low/High
floats for the values of the recent high/low levels
floats for the trailing high/low levels (for debug/post-processing)
bools for market structure bias
f_trueLowHigh()
This function finds True Lows and Highs.
A True High is the candle with the highest recent high, which then has its low taken out on close by a subsequent candle (and vice-versa for True Lows).
The difference between this and an Enhanced High is that confirmation requires not just any Simple High, but confirmation of the very candle that has the highest high.
Because of this, confirmation is often later, and multiple Simple Highs and Lows can develop within ranges formed by a single big candle without any of them being confirmed. This is by design.
A True High looks like the intuitive "real high" when you look at the chart. True Lows and Highs must alternate.
@param - there are no parameters. The function uses the chart OHLC.
@returns - boolean values for whether this bar confirms an Enhanced Simple Low/High
ints for the bar_index of that Low/High
floats for the values of the recent high/low levels
floats for the trailing high/low levels (for debug/post-processing)
bools for market structure bias

PowerX by jwitt98This strategy attempts to replicate the PowerX strategy as described in the book by by Markus Heitkoetter
Three indicators are used:
RSI (7) - An RSI above 50 indicates and uptrend. An RSI below 50 indicates a downtrend.
Slow Stochastics (14, 3, 3) - A %K above 50 indicates an uptrend. A %K below 50 indicates a downtrend.
MACD (12, 26, 9) - A MACD above the signal line indicates an uptrend. A MACD below the signal line indicates a downtrend
In addition, multiples of ADR (7) is used for setting the stops and profit targets
Setup:
When all 3 indicators are indicating an uptrend, the OHLC bar is green.
When all 3 indicators are indicating a downtrend, the OHLC bar is red.
When one or more indicators are conflicting, the OHLC bar is black
The basic rules are:
When the OHLC bar is green and the preceding bar is black or Red, enter a long stop-limit order .01 above the high of the first green bar
When the OHLC bar is red and the preceding bar is black or green, enter a short stop-limit order .01 below the low of the first red bar
If a red or black bar is encountered while in a long trade, or a green or black bar for a short trade, exit the trade at the close of that bar with a market order.
Stop losses are set by default at a multiple of 1.5 times the ADR.
Profit targets are set by default at a multiple of 3 times the ADR.
Options:
You can adjust the start and end dates for the trading range
You can configure this strategy for long only, short only, or both long and short.
You can adjust the multiples used to set the stop losses and profit targets.
There is an option to use a money management system very similar to the one described in the PowerX book. Some assumptions had to be made for cases where the equity is underwater as those cases are not clearly defined in the book. There is an option to override this behavior and keep the risk at or above the set point (2% by default), rather than further reduce the risk when equity is underwater. Position sizing is limited when using money management so as not to exceed the current strategy equity. The starting risk can be adjusted from the default of 2%.
Final notes: If you find any errors, have any questions, or have suggestions for improvements, please leave your message in the comments.
Happy trading!
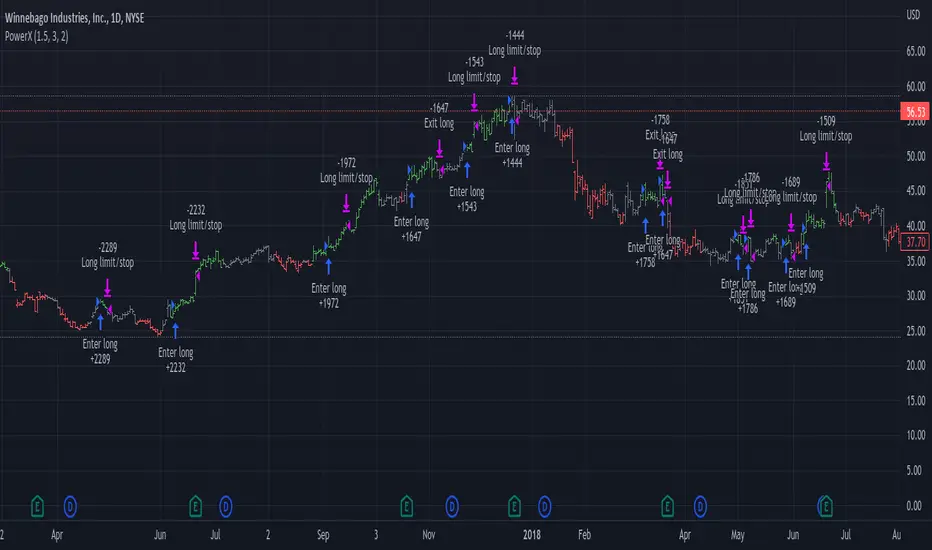
Take Profit On Trend v2 (by BHD_Trade_Bot)The purpose of strategy is to detect long-term uptrend and short-term downtrend so that you can easy to take profit.
The strategy also using BHD unit to detect how big you win and lose, so that you can use this strategy for all coins without worry about it have different percentage of price change.
ENTRY
The buy order is placed on assets that have long-term uptrend and short-term downtrend:
- Long-term uptrend condition: ema200 is going up
- Short-term downtrend condition: 2 last candles are down price (use candlestick for less delay)
CLOSE
The sell order is placed when take profit or stop loss:
- Take profit: price increase 2 BHD unit
- Stop loss: price decrease 3 BHD unit
The strategy use $1000 for initial capital and trading fee is 0.1% for each order.
Pro tip: The 1-hour time frame for ETH/USDT has the best results on average.

RELATIVE VALUE TRADE MANAGEMENT WEBHOOKThis script it's created to send open-close signals via webhook. It allows you to open a relative value position based in the relative graph. You can set the TP and SL levels and the script will send the signal to your exchange.
Due a pine limitations it is necessary apply the script in the 2 different actives and set the alerts. You can just do the relative analysis and then go to the first asset and set the script. Create your alert and then just go to the other asset and create the alert. It doesn't necessary to change anything in the script because the levels are the same.
It is also possible to do the analysis using the script, deploying the relative graph, but could be annoying sometimes due scales.
Positions will be placed at close always.
THIS IS IMPORTANT: I use Zignaly as a exhange so if you are using Binance or other YOU MUST CHANGE the code. If you know the JSON format that It requires would be easy.
Here is tips in all the important imputs. But let me explain the most important.
The MANDATORY fields are:
Ticker IDs: Here you must write the EXACT ID code for the active. Caps included.
Example : BINANCE:SUSHIUSDTPERP
It is also important select the correct market side. If you want to be long of ANY active you must write that ID in the LONG ID. For short positions is the same.
Time frame: Here you can select the time frame of the graph (not the current active graph, I mean the relative one.) The orders will be send using that time frame. I recommend to do the analysis in other window and then use the script to trigger the order in the time frame that you want.
Money management: In these fields you can select the qty that you will lose if the SL level is reach. Based in a determinated amount of currency or in a % of your capital.
Dates: It is important to select the start date. If the order is already open, we must look for the moment where the activation price was reached. If the order is unopened it is better to select the current date, so the order will be triggered when the entry level is reached.
Ids: If you have current open position you can set here that ID to send the correct order to the exchange.
To set the alert just call the function {{{strategy.order.alert_message}}}
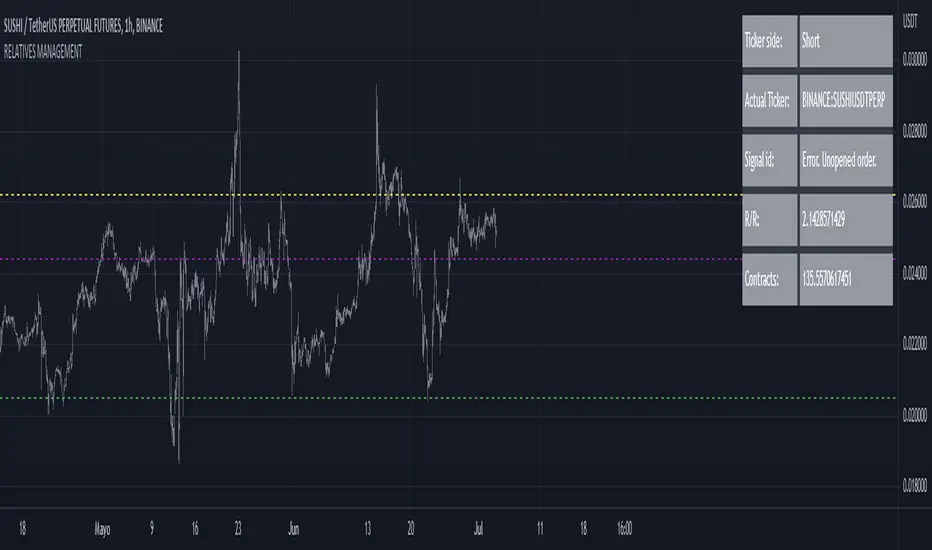
Buy/Sell on the levelsThis script is generally
My describe is:
There are a lot of levels we would like to buy some crypto.
When the price has crossed the level-line - we buy, but only if we have the permission in array(2)
When we have bought the crypto - we lose the permission for buy for now(till we will sell it on the next higher level)
When we sell some crypto(on the buying level + 1) we have the permission again.
There also are 2 protect indicators. We can buy if these indicators both green only(super trend and PIVOT )
Jun 12
Release Notes: Hello there,
Uncomment this section before use for real trade:
if array.get(price_to_sellBue, i) >= open and array.get(price_to_sellBue, i) <= close// and
//direction < 0 and permission_for_buy != 0
Here is my script.
In general - this is incredible simple script to use and understand.
First of all You can see this script working with only long orders, it means we going to get money if crypto grows only. Short orders we need to close the position on time.
In this script we buy crypto and sell with step 1% upper.
You can simply change the step by changing the price arrays.
Please note, if You want to see where the levels of this script is You Have to copy the next my indicator called LEVEL 1%
In general - if the price has across the price-level we buy some crypto and loose permission for buying for this level till we sell some crypto. There is ''count_of_orders" array field with value 2. When we bought some crypto the value turns to 0. 0 means not allowed to by on this level!!! The script buy if the bar is green only(last tick).
The script check every level(those we can see in "price_to_sellBue" array).
If the price across one of them - full script runs. After buying(if it possible) we check is there any crypto for sell on the level.
We check all levels below actual level( of actual level - ''i'' than we check all levels from 0 to i-1).
If there is any order that has value 0 in count of orders and index <= i-1 - we count it to var SELL amount and in the end of loop sell all of it.
Pay attention - it sells only if price across the level with red bar AND HAS ORDERS TO SELL WHICH WAS BOUGHT BELOW!!!
In Strategy tester it shows not-profitables orders sometimes, because if You have old Long position - it sells it first. First in - first out.
If the price goes down for a long time and You sell after 5 buys You sell the first of it with the highest value.
There is 2 protection from horrible buying in this strategy. The first one - Supertrend. If the supertrend is red - there is no permission for buy.
The second one - something between PIVOT and supertrend but with switcher.
If the price across last minimum - switcher is red - no permission for buy and the actual price becomes last minimum . The last maximum calculated for last 100 bars.
When the price across last maximum - switcher is green, we can buy. The last minimum calculation for last 100 bars, last maximum is actual price.
This two protections will save You from buying if price get crash down.
Enjoy my script.
Should You need the code or explanation, You have any ideas how to improve this crypt, contact me.
Vladyslav.
Jun 12
Release Notes: Here has been uncommented the protection for buy in case of price get down.
5 hours ago
Release Notes: Changed rages up to actual price to make it work

Supply & DemandWe can think of imbalanced as a signal of a huge order being filled.
For those who do not know what imbalanced candle are, an imbalanced candles are formed when the price move with force in a direction.
Taking the last 3 candles, when the wicks the of 1st and 3rd candle does not fully overlap the middle one, an imbalanced candle is formed.
Usually when a huge hands place its order it never gets filled entirely and the price usually comes back to this zone to fulfil the remaining order.
This indicator highlight range defined by previous high and low pivot right before an imbalanced candle.
Zones highlighted become zones to watch to enter a trade and become either supply or demand zone.
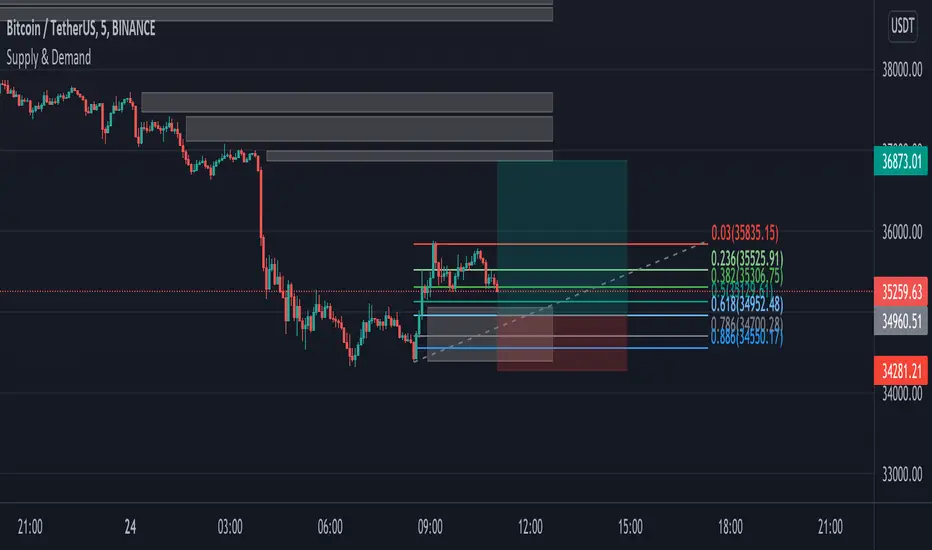
Chimpanzee V2.5 part A by joylay83Hi everyone, I am an amateur pinecoder. I would like to share my script which is coded with the intention of generating signals to send to 3commas webhook. It is still in development and revision.
This collection of indicators use:
Chart: 15m.
Inverse Fisher Transformation of the RSI to detect dips in the 15m timeframe.
Bollinger band (4H) to filter out false signals.
Triple EMA 21: to mimic price action for easier coding alerts. Currently not involved in generating signals. will be incorporated in the future.
StochRSI: As a visual filter. Currently not involved in generating signals. will be incorporated in the future.
Background will be green if stochRSI is low and red if stockRSI is high.
Candlesticks will be marked with a flag is TEMA breached BB.
One would need to play around with timeframes, BB settings and IFTRSI threshold for different signals.
There are 2 Signal Modes (with regards to IFTRSI):
Threshold: When price action falls below BB and IFTRSI hits buy threshold, a buy/sell signal is generated. Eg if IFTRSI buy threshold is set to -0.9, the buy signal will remain continuously positive as long as IFTRSI is < 0.9.
Cross: When price action falls below BB and IFTRSI hits threshold, nothing happens. It will wait until the IFTRSI cross back over the threshold before firing a signal.
There is another identical set of indicators running on a higher time frame (IFTRSI: 4H, BB: D or 3D, TEMA 21 4H) but on the same chart. This tend to generate less signals but are more reliable. A usage example would be to send a larger buy order if the signal comes from this higher time frame, or execute a sell order after multiple buys from the lower time frame.
It comes in 2 parts:
Part A: Contains overlay display. This displays BB, Triple EMA, buy/sell and StochRSI in labels. the labels are self explanatory.
Part B (please search for it): which is actually the same code but contain non-overlay display. You may also put part B overlay=true but scale to LEFT. The advantage of using overlay=true is that you can move the signal right over the candlesticks (mainly for troubleshooting/debugging). This part contains Inverse Fisher RSI, %B, Signal Line. %B is supposedly idential to Bollinger Bands in Part A.
By default, when there is a buy/sell signal:
lower time frame 15m: Signal Line in Part B will turn blue with a value 1 or -1 which corresponds to a buy or sell label in Part A
higher time frame 4H: Signal Line in Part B will turn red with a value 2 or -2 which corresponds to a HTF buy or sell label in Part A
Part A or B may be used to send signal to the webhook. You have to make sure that the settings of Part A and B are identical.
You may choose to un-display some items to reduce clutter.
Current problems:
1. Still too many buy signals
Although many times it will generate excellent buy signal at many swing lows, but there are many buy signals prior to a major swing low. This can be observed in the picture above. It also generate a couple of buy signals prior to the swing lows. I am currently experimenting with 20m and hourly timeframe to address this issue. More filters are needed eg an oscillator or detecting candlestick patterns.
2. Premature sell signals.
The sell signal is often generated at the beginning of a major bull run. My idea to solve this problem is to move to a higher timeframe and sell only when TEMA crossunder the upper bollinger band.
3. Lack of a backtester that can test multiple concurrent deals.
Buy -> Buy (average down) -> Buy (average down) -> Buy (average down) -> Sell
4. Lack of the ability to calculate average purchase price
Probably have to code it as a strategy
5. Display lag
As the browser is running 2 copies of the idential script, it tends to lag when you drag your chart around. So far there are no timeouts or delay in firing alerts to 3commas.
I do welcome any suggestion for improvement and constructive criticism. tqvm.
Credits : Thank you for doing an awesome job. I learnt a lot from your codes and tutorials.
Credits not listed in any order. If your code is used here and did not receive due credit, kindly drop me a note. tq.
Blessing 3 by JTA Today
@ZenAndTheArtOfTrading (extremely-easy-to-understand tutorials eg fixing repainting)
@LazyBear (various codes)
@Galactus-B Argo I
@TheTradingParrot (Inverse Fisher RSI and Gavin's backtester)
@zendog123 (backtester and various codes)
@ydeniz2000 (Bollinger Bands)
TradingView built-in scripts
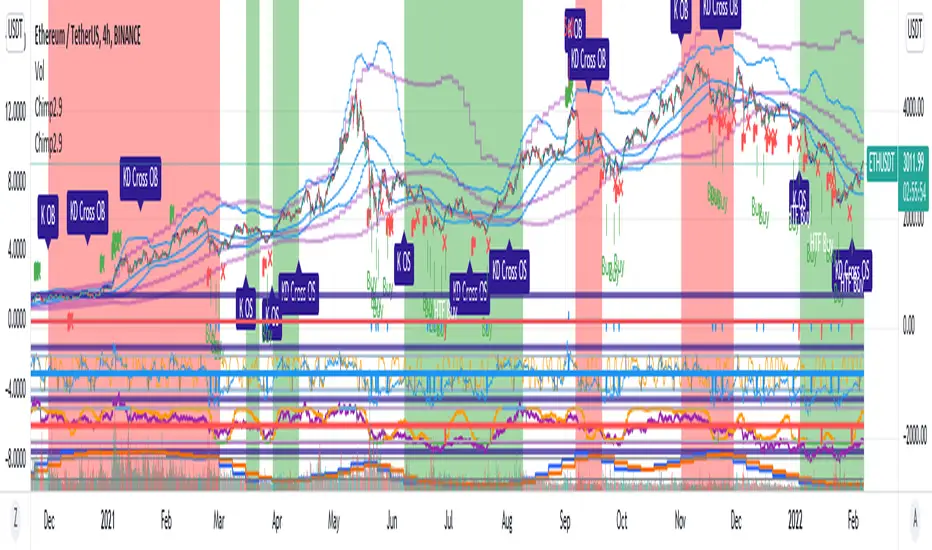
Double SupertrendThis strategy is based on a custom indicator that was created based on the Supertrend indicator. At its core, there are always 2 super trend indicators with different factors to reduce market noise (false signals).
The strategy/indicator has some parameters to improve the signals and filters.
TECHNICAL ANALYSIS
☑ Show Indicators
This option will enable/disable the Supertrend indicators on the chart.
☑ Length
The length will be used on the Supertrend Indicator to calculate its values.
☑ Dev Fast
The fast deviation or factor from one of the super trend indicators. This will be the leading indicator for entry signals, as well as for the exit signals.
☑ Dev Slow
The slow deviation or factor from one of the super trend indicators. This will be the confirmation indicator for entry and exit signals.
☑ Exit Type
It's possible to select from 4 options for the exit signals. Exit signals always take profit target.
☑ ⥹ Reversals
This option will make the strategy/indicator calculate the exit signals based on the difference between the given period's highest and lowest candle value (see Period on this list). It's displayed on the chart with the cross. As it's possible to verify in the image below, there are multiple exit spots for every entry.
☑ ⥹ ATR
Using ATR as a base indicator for exit signals will make the strategy/indicator place limit/stop orders. Candle High + ATR for longs, Candle Low - ATR for shorts. The strategy will show the ATR level for take profit and stick with it until the next signal. This way, the take profit value remains based on the candle of the entry signal.
☑ ⥹ Fast Supertrend
With this option selected, the exit signals will be based on the Fast Supertsignal value, mirrored to make a profit.
☑ ⥹ Slow Supertrend
With this option selected, the exit signals will be based on the Slow Supertsignal value, which is mirrored to take profit.
☑ Period
This will represent the number of candles used on the exit signals when Reversals is selected as Exit Type. It's also used to calculate the gradient used on the Fills and Supertrend signals.
☑ Multiplier
It's used on the take profit when the ATR option is selected on the Exit Type.
STRATEGY
☑ Use The Strategy
This will enable/disable the strategy to show the trades calculations.
☑ Show Use Long/Short Entries
Option to make the strategy show/use Long or Short signals. Available only if Use The Strategy is enabled
☑ Show Use Exit Long/Short
Option to make the strategy show/use Exit Long or Short signals (valid when Reversals option is selected on the Exit Type). Available only if Use The Strategy is enabled
☑ Show Use Add Long/Short
Option to make the strategy show/use Add Long or Short signals. With this option enabled, the strategy will place multiple trades in the same direction, almost the same concept as a pyramiding parameter. It's based on the Fast Supersignal when the candle fails to cross and reverses. Available only if Use The Strategy is enabled
☑ Trades Date Start/End
The date range that the strategy will check the market data and make the trades
HOW TO USE
It's very straightforward. A long signal will appear as a green arrow with a text Long below it. A short signal will appear as a red arrow with a text Short above it. It's ideal to wait for the candle to finish to validate the signal.
The exit signals are optional but give a good idea of the configuration used when backtesting. Each market and timeframe will have its own configuration for the best results. On average, sticking to ATR as an exit signal will have less risk than the other options.
☑ Entry Signals
Follow the arrows with Long/Short texts on them. Wait for the signal candle to close to validate the entry.
☑ Exit Signals
Use them to close your position or to trail stop your orders and maximize profits. Select the exit type suitable for each timeframe and market
☑ Add Entries
It's possible to increase the position following the add margin/contracts based on the Add signals. Not mandatory, but may work as reentries or late entries using the same signal.
☑ What about Stop Loss?
The stop-loss levels were not included as a separated signal because it's already in the chart. There are some possible ideas for the stop loss:
☑⥹ Candle High/Low (2nd recommend option)
When it's a Long signal from the entry signal candle, the stop loss can be the Low value of the same candle. Very tight stop loss in some cases, depending on the candle range
☑⥹ Local Top/Bottom
Selecting the local top/bottom as stop loss will give the strategy more room for false breakouts or reversals, keeping the trade open and minimizing noises. Increases the risk
☑⥹ Fast Supertrend (1st recommend option)
The fast supertrend can be used as stop-loss as well. making it a moving level and working close to trail stop management
☑⥹ Fixed Percentage
It's possible to use a fixed risk percentage for the trades, making the risk easier to control and project. Since the market volatility is not fixed, this may affect the accuracy of the trades
☑⥹ Based on the ATR (3rd recommend option)
When the exit type option ATR is selected, it will display the take profit level for that entry. Just mirror that value and put it as stop-loss, or multiply that amount by 1.5 to have more room for market noise.
EXAMPLE CONFIGURATIONS
Here are some configuration ideas for some markets (all of them are from crypto, especially futures markets)
BTCUSDT 15min - Default configuration
BTCUSDT 1h - Length 10 | Dev Fast 3 | Dev Slow 4 | Exit Type ATR | Period 50 | Multiplier 1
BTCUSDT 4h - Length 10 | Dev Fast 2 | Dev Slow 4 | Exit Type ATR | Period 50 | Multiplier 1
ETHUSDT 15min - Length 20 | Dev Fast 1 | Dev Slow 3 | Exit Type Fast Supertrend | Period 50 | Multiplier 1
IOTAUSDT 15min - Length 10 | Dev Fast 1 | Dev Slow 2 | Exit Type Slow Supertrend | Period 50 | Multiplier 1
OMGUSDT 15min - Length 10 | Dev Fast 1 | Dev Slow 4 | Exit Type Slow Supertrend | Period 50 | Multiplier 1
VETUSDT 15min - Length 10 | Dev Fast 3 | Dev Slow 4 | Exit Type Slow Supertrend | Period 50 | Multiplier 1
HOW TO FIND OTHER CONFIGURATIONS
Here are some steps to find suitable configurations
select a market and time frame
enable the Use This Strategy option on the strategy
open the strategy tester panel and select the performance summary
open the strategy configuration and go to properties
change the balance to the same price of the symbol (example: BTCUSDT 60.000, use 60.000 as balance)
go back to the inputs tab and keep changing the parameters until you see the net profit be positive and bigger than the absolute value of the drawdown
in case you can't find a suitable configuration, try other timeframes
Since the tester reflects what happened in the past candles, it's not guaranteed to give the same results. However, this indicator/Strategy can be used with other indicators as a leading signal or confirmation signal.

Forex Fractal EMA ScalperThis is a forex scalper designed for very short timeframes 1-5 min max.
At the same time due to the short timeframe, is recommend to re optimize it weekly .
Its components are
Fractals
Triple EMA with different lengths
Rules for entry:
For long : we have an up fractal and all 3 ema are in ascending order
For short: we have a down fractal and all 3 ema are in descending order.
Rules for exit
We exit when we either get a reverse order or when we hit the take profit or stop loss calculated in fixed pips.

Take Profit On Trend (by BHD_Trade_Bot)The purpose of strategy is to detect long-term uptrend and short-term downtrend so that you can easy to take profit.
The strategy also using BHD unit to detect how big you win and lose, so that you can use this strategy for all coins without worry about it have different percentage of price change.
ENTRY
The buy order is placed on assets that have long-term uptrend and short-term downtrend:
- Long-term uptrend condition: ema200 is going up (rsi200 greater than 51)
- Short-term downtrend condition: 2 last candles are down price (use candlestick for less delay)
CLOSE
The sell order is placed when take profit or stop loss:
- Take profit: price increase 1 BHD unit
- Stop loss: price decrease 2 BHD units
The strategy use $15 and trading fee is 0.1% for each order. So that, in the real-life, if you are using trade bot, it will need $1500 for trading 100 coins at the same time.
Pro tip : The 1-hour time frame for altcoin/USDT has the best results on average.
