Pivot Point SupertrendHello All,
There are many types of SuperTrend around. Recently I thought about a Supertrend based on Pivot Points then I wrote "Pivot Point SuperTrend" script. It looks it has better performance on keeping you in the trend more.
The idea is behind this script is finding pivot point, calculating average of them and like in supertrend creating higher/lower bands by ATR. As you can see in the algorithm the script gives weigth to past pivot points, this is done for smoothing it a bit.
As I wrote above it may keep you in the trend more, lets see an example:
As an option the script can show main center line and I realized that when you are in a position, this line can be used as early exit points. (maybe half of the position size)
While using Pivot Points, I added support resistance lines by using Pivot Point, as an option the script can show S/R lines:
And also it can show Pivot Points:
When you changed Pivot Point Period you can see its reaction, in following example PP period is 4 (default value is 2). Smaller PP periods more sensitive trendlines.
Alerts added for Buy/Sell entries and Trend Reversals. (when you set alerts use the option " Once Per Bar Close ")
ENJOY!
"pivot"に関するスクリプトを検索

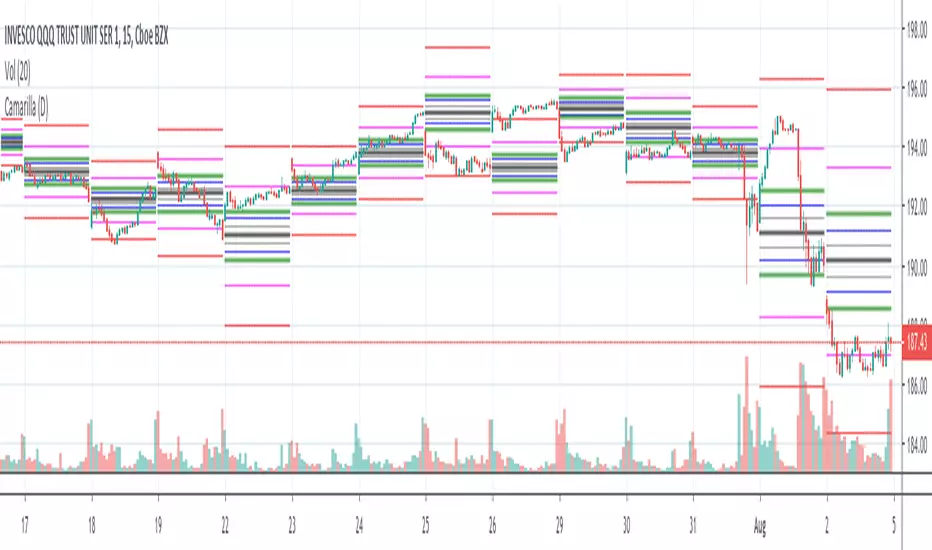
Camarilla Pivots (D,W,M) Secrets of a Pivot BossPrimarily for equities as no provision has been made to control the timing at which the open close high low are determined, indeed, I see no straightforward mechanism to do so in Pinescript.
Development aided by: but with the entirely different calculations presented in "Secrets of a Pivot Boss" by Franklin Ochoa. And far cleaner and less-redundant code.
To trade the indicator, watch the H3,H4,H5 and L3,L4,L5 bars. There are two built-in strategies. Depending on pivot width, sell at H3 and buy at L3 with stop at H4/L4 or above. For strongly trending environments: buy at H4, cover at H5--similarly for downtrends.
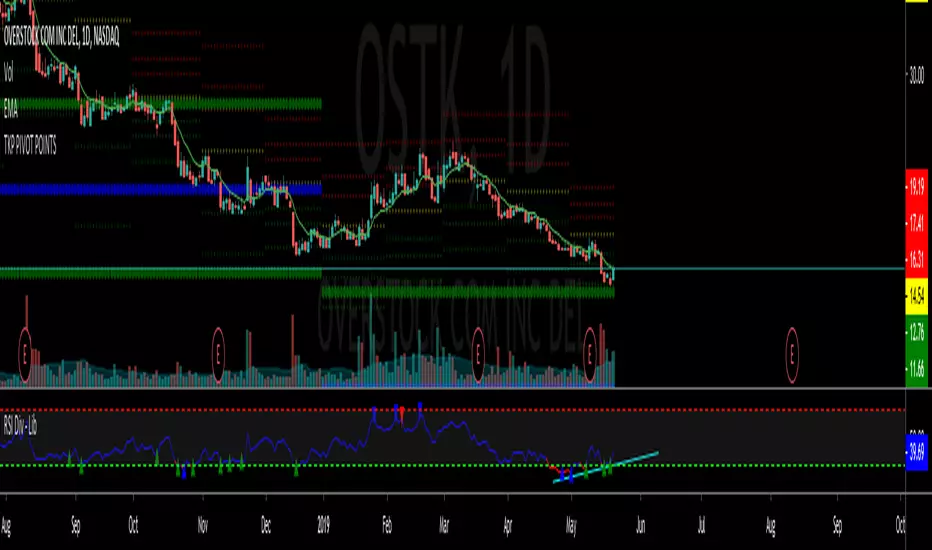
TKP Weekly, Monthly and Yearly Fib Pivot PointsThis script allows you to plot Weekly, Monthly and Yearly Fibonacci Pivot Points. I used templates from others I found on TradingView, special thanks given in the Script. I prefer Longer time frames, especially yearly Pivots, to predict reversals and places to trim risk, so this was tailored to my needs. Hope this helps!
Pivots High/Low [Simpelyfe]These are interconnected pivot highs and lows to help you determine the direction and magnitude of the next impulse. A hard pivot finishing off C or E of a corrective wave means there's a higher probability for price to reverse thereafter.
Cheers,
Simpelyfe

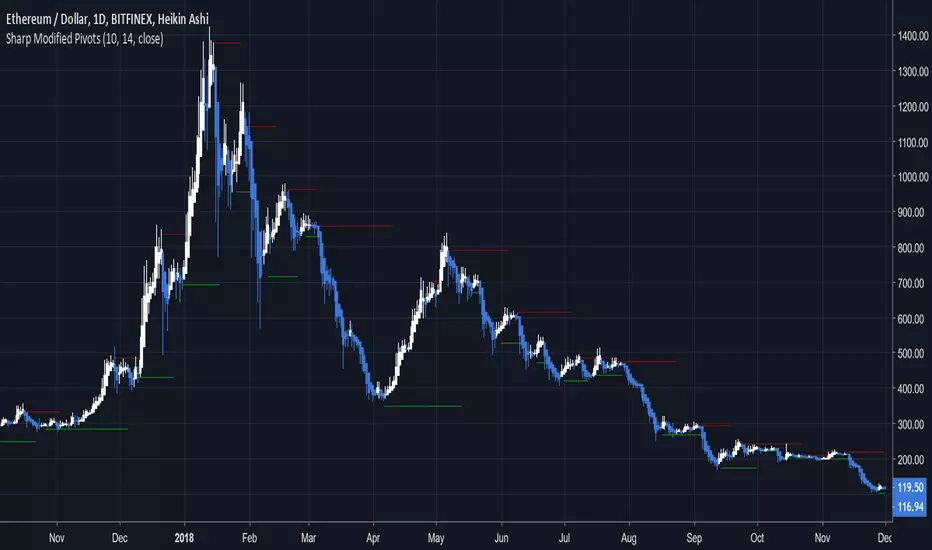
Sharp Modified PivotsThis uses everget's implementation of the Sharp Modified Moving Average to plot pivot points.
It can also show you when to exit your long or short positions if you toggle the option.
Check out everget's scripts at www.tradingview.com
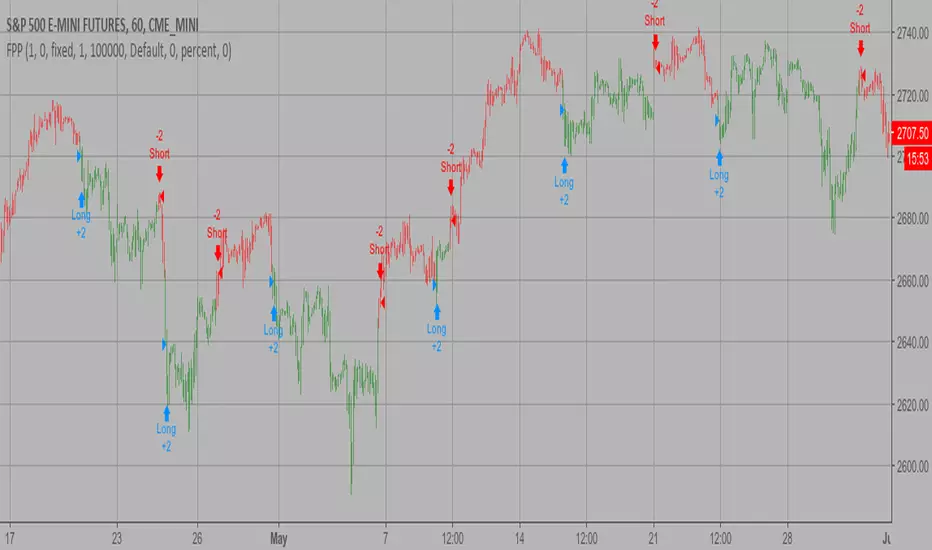
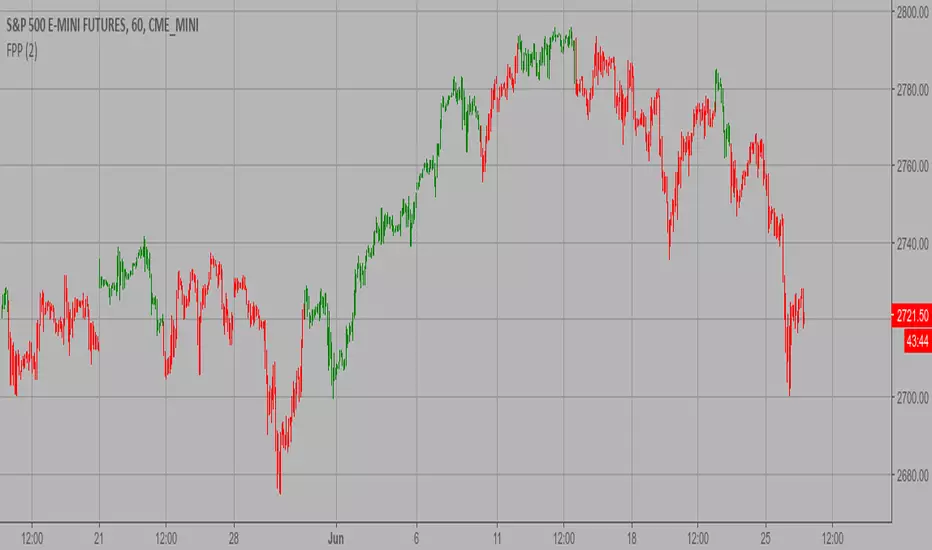
Floor Pivot Points Backtest The name ‘Floor-Trader Pivot,’ came from the fact that Pivot points can
be calculated quickly, on the fly using price data from the previous day
as an input. Although time-frames of less than a day can be used, Pivots are
commonly plotted on the Daily Chart; using price data from the previous day’s
trading activity.
You can change long to short in the Input Settings
WARNING:
- For purpose educate only
- This script to change bars colors.
Floor Pivot Points Strategy The name ‘Floor-Trader Pivot,’ came from the fact that Pivot points can
be calculated quickly, on the fly using price data from the previous day
as an input. Although time-frames of less than a day can be used, Pivots are
commonly plotted on the Daily Chart; using price data from the previous day’s
trading activity.
WARNING:
- This script to change bars colors.

Eminaest Pivots V2Simple Pivot Points plotting script.
You can choose to plot Daily, Weekly and Monthly Pivot Points. Separate or two of them or all together.

Makuchaku's Trade Tools - Pivots/Fractals & CrossoversPivots/Fractals are at minimum a 3 candlestick pattern.
Bearish pivot/fractal is formed when a candle is flanked by 2 lower candles on either side
Bullish pivot/fractal is formed when a candle is flanked by 2 higher candles on either side
They are great to determine market structure.
This indicator also prints boxes when those pivots/fractals are crossed over, printing bearish & bullish boxes.


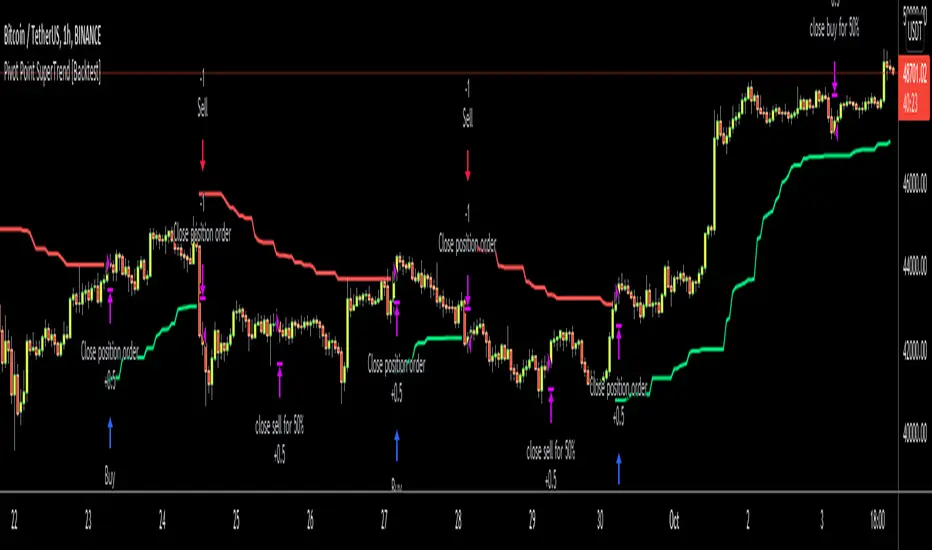
Pivot Point SuperTrend [Backtest]Hello All,
This is backtesting result of following indicator/strategy. I didn't work on adding other indicators. maybe in the future I can try to combine this with other indicators.
You can visit following link to see "Pivot Point SuperTrend" . by using this backtesting tool, you can test&find better options
There is option "Use Center Line to Close Entry for 50%" . by default it's not enabled. if you enable this option, pivot point center line may push you to close your entry for 50% (can be used as early stoploss/take profit line if you think it's risky)
Enjoy!
Pivot Boss 4 EMA + BB + Parabolic SAR + IchimokuA combination of a few of my favorite indicators.
1) Pivot Boss 4 EMA
2) Bollinger Bands
3) Parabolic SAR
4) Ichimoku Cloud
All credit to original authors.

PivotBoss TriggersI have collected the four PivotBoss indicators into one big indicator. Eventually I will delete the individual ones, since you can just turn off the ones you don't need in the style controller. Cheers.
Wick Reversal
When the market has been trending lower then suddenly forms a reversal wick candlestick , the likelihood of
a reversal increases since buyers have finally begun to overwhelm the sellers. Selling pressure rules the decline,
but responsive buyers entered the market due to perceived undervaluation. For the reversal wick to open near the
high of the candle, sell off sharply intra-bar, and then rally back toward the open of the candle is bullish , as it
signifies that the bears no longer have control since they were not able to extend the decline of the candle, or the
trend. Instead, the bulls were able to rally price from the lows of the candle and close the bar near the top of its
range, which is bullish - at least for one bar, which hadn't been the case during the bearish trend.
Essentially, when a reversal wick forms at the extreme of a trend, the market is telling you that the trend
either has stalled or is on the verge of a reversal. Remember, the market auctions higher in search of sellers, and
lower in search of buyers. When the market over-extends itself in search of market participants, it will find itself
out of value, which means responsive market participants will look to enter the market to push price back toward
an area of perceived value. This will help price find a value area for two-sided trade to take place. When the
market finds itself too far out of value, responsive market participants will sometimes enter the market with
force, which aggressively pushes price in the opposite direction, essentially forming reversal wick candlesticks .
This pattern is perhaps the most telling and common reversal setup, but requires steadfast confirmation in order
to capitalize on its power. Understanding the psychology behind these formations and learning to identify them
quickly will allow you to enter positions well ahead of the crowd, especially if you've spotted these patterns at
potentially overvalued or undervalued areas.
Fade (Extreme) Reversal
The extreme reversal setup is a clever pattern that capitalizes on the ongoing psychological patterns of
investors, traders, and institutions. Basically, the setup looks for an extreme pattern of selling pressure and then
looks to fade this behavior to capture a bullish move higher (reverse for shorts). In essence, this setup is visually
pointing out oversold and overbought scenarios that forces responsive buyers and sellers to come out of the dark
and put their money to work-price has been over-extended and must be pushed back toward a fair area of value
so two-sided trade can take place.
This setup works because many normal investors, or casual traders, head for the exits once their trade
begins to move sharply against them. When this happens, price becomes extremely overbought or oversold,
creating value for responsive buyers and sellers. Therefore, savvy professionals will see that price is above or
below value and will seize the opportunity. When the scared money is selling, the smart money begins to buy, and
Vice versa.
Look at it this way, when the market sells off sharply in one giant candlestick , traders that were short
during the drop begin to cover their profitable positions by buying. Likewise, the traders that were on the
sidelines during the sell-off now see value in lower prices and begin to buy, thus doubling up on the buying
pressure. This helps to spark a sharp v-bottom reversal that pushes price in the opposite direction back toward
fair value.
Engulfing (Outside) Reversal
The power behind this pattern lies in the psychology behind the traders involved in this setup. If you have
ever participated in a breakout at support or resistance only to have the market reverse sharply against you, then
you are familiar with the market dynamics of this setup. What exactly is going on at these levels? To understand
this concept is to understand the outside reversal pattern. Basically, market participants are testing the waters
above resistance or below support to make sure there is no new business to be done at these levels. When no
initiative buyers or sellers participate in range extension, responsive participants have all the information they
need to reverse price back toward a new area of perceived value.
As you look at a bullish outside reversal pattern, you will notice that the current bar's low is lower than the
prior bar's low. Essentially, the market is testing the waters below recently established lows to see if a downside
follow-through will occur. When no additional selling pressure enters the market, the result is a flood of buying
pressure that causes a springboard effect, thereby shooting price above the prior bar's highs and creating the
beginning of a bullish advance.
If you recall the child on the trampoline for a moment, you'll realize that the child had to force the bounce
mat down before he could spring into the air. Also, remember Jennifer the cake baker? She initially pushed price
to $20 per cake, which sent a flood of orders into her shop. The flood of buying pressure eventually sent the price
of her cakes to $35 apiece. Basically, price had to test the $20 level before it could rise to $35.
Let's analyze the outside reversal setup in a different light for a moment. One of the reasons I like this setup
is because the two-bar pattern reduces into the wick reversal setup, which we covered earlier in the chapter. If
you are not familiar with candlestick reduction, the idea is simple. You are taking the price data over two or more
candlesticks and combining them to create a single candlestick . Therefore, you will be taking the open, high, low,
and close prices of the bars in question to create a single composite candlestick .
Doji Reversal
The doji candlestick is the epitome of indecision. The pattern illustrates a virtual stalemate between buyers
and sellers, which means the existing trend may be on the verge of a reversal. If buyers have been controlling a
bullish advance over a period of time, you will typically see full-bodied candlesticks that personify the bullish
nature of the move. However, if a doji candlestick suddenly appears, the indication is that buyers are suddenly
not as confident in upside price potential as they once were. This is clearly a point of indecision, as buyers are no
longer pushing price to higher valuation, and have allowed sellers to battle them to a draw-at least for this one
candlestick . This leads to profit taking, as buyers begin to sell their profitable long positions, which is heightened
by responsive sellers entering the market due to perceived overvaluation. This "double whammy" of selling
pressure essentially pushes price lower, as responsive sellers take control of the market and push price back
toward fair value.

Pivot Matrix & Multi-Timeframe Support-Resistance Analytics________________________________________
📘 Study Material for Pivot Matrix & Multi Timeframe Support-Resistance Analytics
(By aiTrendview — Educational Use Only)
________________________________________
🎯 Introduction
The Pivot Matrix & Multi Timeframe Support-Resistance Analytics indicator is designed to help traders visualize pivot points, support/resistance levels, VWAP, and volume flow analytics all in one place. Rather than giving explicit buy/sell calls, the dashboard provides reference insights so a learner may understand how different technical levels interact in real time.
This document explains its functionality step by step with formulas and usage guides.
________________________________________
1️⃣ Pivot System Logic
Pivot points are classic tools for mapping market support and resistance levels.
✦ How Calculated?
Using the Traditional Method:
• Pivot Point (PP):
PP=Highprev+Lowprev+Closeprev3PP = \frac{High_{prev} + Low_{prev} + Close_{prev}}{3}PP=3Highprev+Lowprev+Closeprev
• First Support/Resistance:
R1=2×PP−Lowprev,S1=2×PP−HighprevR1 = 2 \times PP - Low_{prev}, \quad S1 = 2 \times PP - High_{prev}R1=2×PP−Lowprev,S1=2×PP−Highprev
• Second Support/Resistance:
R2=PP+(Highprev−Lowprev),S2=PP−(Highprev−Lowprev)R2 = PP + (High_{prev} - Low_{prev}), \quad S2 = PP - (High_{prev} - Low_{prev})R2=PP+(Highprev−Lowprev),S2=PP−(Highprev−Lowprev)
• Third Levels:
R3=Highprev+2×(PP−Lowprev),S3=Lowprev−2×(Highprev−PP)R3 = High_{prev} + 2 \times (PP - Low_{prev}), \quad S3 = Low_{prev} - 2 \times (High_{prev} - PP)R3=Highprev+2×(PP−Lowprev),S3=Lowprev−2×(Highprev−PP)
• Similarly, R4/R5 and S4/S5 are extrapolated from extended range multipliers.
✦ How Used?
• Price above PP → bullish control bias.
• Price below PP → bearish control bias.
• R1–R5 levels act as resistances; S1–S5 act as supports.
Learners should watch how candles behave when approaching R/S zones to spot breakout vs. rejection conditions.
________________________________________
2️⃣ Multi Timeframe Logic
The indicator allows using daily-based pivot values (via request.security). This ensures alignment with institutional daily levels, not just intraday recalculations.
✦ Teaching Value
Understanding MTF pivots shows how markets respect higher timeframe levels (daily > intraday, weekly > daily). This helps learners grasp nested support-resistance structures.
________________________________________
3️⃣ VWAP (Volume Weighted Average Price)
Formula:
VWAPt=∑(Pricei×Volumei)∑(Volumei),Pricei=High+Low+Close3VWAP_t = \frac{\sum (Price_i \times Volume_i)}{\sum (Volume_i)}, \quad Price_i = \frac{High + Low + Close}{3}VWAPt=∑(Volumei)∑(Pricei×Volumei),Pricei=3High+Low+Close
Usage:
• VWAP is used as an institutional benchmark of fair value.
• Above VWAP = bullish flow.
• Below VWAP = bearish flow.
Learners should check whether price respects VWAP as a magnet or uses it as support/resistance.
________________________________________
4️⃣ Volume Flow Analysis
The script classifies buy volume, sell volume, and neutral volume.
• Buy Volume = if close > open.
• Sell Volume = if close < open.
• Neutral Volume = if close = open.
For daily tracking:
Buy%=DayBuyVolDayTotalVol×100,Sell%=DaySellVolDayTotalVol×100Buy\% = \frac{DayBuyVol}{DayTotalVol} \times 100, \quad Sell\% = \frac{DaySellVol}{DayTotalVol} \times 100Buy%=DayTotalVolDayBuyVol×100,Sell%=DayTotalVolDaySellVol×100
Usage for Learners:
• Dominant Buy% → accumulation/ bullish pressure.
• Dominant Sell% → distribution/ bearish pressure.
• Balanced → sideways liquidity building.
This teaches observation of order flow bias rather than relying only on price.
________________________________________
5️⃣ Dashboard Progress Bars & Colors
The script uses visual progress bars and dynamic colors for clarity. For example:
• VWAP Backgrounds: Green shades when price strongly above VWAP, Red when below.
• Volume Bars: More green blocks mean buying dominance, red means selling pressure.
This visual design turns concepts into easy-to-digest cues, useful for training.
________________________________________
6️⃣ Market Status Summary
Finally, the dashboard synthesizes all data points:
• Price vs Pivot (above or below).
• Price vs VWAP (above or below).
• Volume Pressure (buy side vs sell side).
Status Rule:
• If all three align bullish → Status box turns green.
• If mixed → Neutral grey.
• If bearish dominance → weaker tone.
Why Important?
This teaches learners that market conditions should align in confluence across indicators before confidence arises.
________________________________________
⚠️ Strict Disclaimer (aiTrendview)
The Pivot Matrix & Multi Timeframe Support-Resistance Analytics tool is developed by aiTrendview for strictly educational and research purposes.
❌ It does NOT provide buy/sell recommendations.
❌ It does NOT guarantee profits.
❌ Unauthorized use, copying, or redistribution of this code is prohibited.
⚠️ Trading Risk Warning:
• Trading involves high risk of financial loss.
• You may lose more than your capital.
• Past levels and indicators do not predict future outcomes.
This tool must be viewed as a visual education aid to practice technical analysis skills, not as trading advice.
________________________________________
✅ Now you have a step by step study guide:
• Pivot calculations explained
• VWAP with logic
• Volume breakdown
• Visual analytics
• Status confluence logic
• Disclaimer for compliance
________________________________________
⚠️ Warning:
• Trading financial markets involves substantial risk.
• You can lose more money than you invest.
• Past performance of indicators does not guarantee future results.
• This script must not be copied, resold, or republished without authorization from aiTrendview.
By using this material or the code, you agree to take full responsibility for your trading decisions and acknowledge that this is not financial advice.
________________________________________
⚠️ Disclaimer and Warning (From aiTrendview)
This Dynamic Trading Dashboard is created strictly for educational and research purposes on the TradingView platform. It does not provide financial advice, buy/sell recommendations, or guaranteed returns. Any use of this tool in live trading is completely at the user’s own risk. Markets are inherently risky; losses can exceed initial investment.
The intellectual property of this script and its methodology belongs to aiTrendview. Unauthorized reproduction, modification, or redistribution of this code is strictly prohibited. By using this study material or the script, you acknowledge personal responsibility for any trading outcomes. Always consult professional financial advisors before making investment decisions.

Smart Money Pivot Strategy [Jason Kasei]This strategy is designed to identify key pivot points (Pivot High and Pivot Low) in the market and leverage the "Smart Money" concept to capture price breakout opportunities. It supports both long and short trades, offering customizable stop-loss (SL) and take-profit (TP) settings, while visually plotting pivot points and breakout signals on the chart.
Core Features
Pivot Point Detection:
Utilizes ta.pivothigh and ta.pivotlow functions to detect the highest (Pivot High) and lowest (Pivot Low) points within a specified period (default: 20 bars).
Trading Signals:
Long Signal: Triggered when the price breaks above a previous Pivot High, indicating a potential uptrend.
Short Signal: Triggered when the price breaks below a previous Pivot Low, indicating a potential downtrend.
How It Works
Detects Pivot High (PH) and Pivot Low (PL) over the specified period and records their price and time.
Triggers a long entry when the price breaks above a Pivot High and a short entry when it falls below a Pivot Low.
Sets exit conditions automatically based on predefined SL and TP percentages after entry.
Plots breakout points and levels on the chart for analysis.
Considerations
The strategy relies on accurate pivot point detection; adjust the period parameter based on market volatility.
In highly volatile markets, consider widening the stop loss to avoid frequent triggering.
Combine with other indicators or analysis methods to validate signals and avoid blind trading.

Custom Gold Pivot LevelsThis indicator plots custom resistance and support levels based on a central Ziro Pivot Level. The levels are adjusted dynamically based on whether you're preparing for a Buy or Sell trade. The script allows you to set percentage-based levels for both resistance and support, making it a versatile tool for traders.
Features:
Pivot Level: Set the central pivot level (Ziro Pivot) around which resistance and support levels are calculated.
Dynamic Resistance & Support Levels: Input your preferred percentages for Resistance 1, Resistance 2, Support 1 , and Support 2 .
For Buy: Resistance levels are higher, and support levels are lower.
For Sell: Resistance levels are adjusted lower, and support levels are adjusted higher.
Label Display: The indicator will display a Buy label in green above the pivot level or a Sell label in red below the pivot level, depending on the trade type you select.
Adjustable Parameters:
Ziro Pivot Level: Set the central pivot level.
Resistance & Support Levels: Adjust resistance and support levels using percentages.
Trade Type: Choose between "Buy" and "Sell" to dynamically adjust resistance and support levels.
Inputs:
1- Trade Type: Select between Buy or Sell to set the relevant resistance and support levels.
Ziro Pivot Level: Set the main pivot level around which all other levels are calculated.
Resistance Level 1 & 2: Input percentages for Resistance 1 and Resistance 2.
Support Level 1 & 2: Input percentages for Support 1 and Support 2.
How to Use:
1- Select "Buy" or "Sell" from the input options.
For Buy: The indicator will plot higher resistance levels and lower support levels.
For Sell: The indicator will plot lower resistance levels and higher support levels.
2- Adjust the Pivot Level: Set the central pivot level for the levels to be calculated around.
3- Adjust the Resistance & Support Percentages: Modify the resistance and support levels to fit your trading strategy.
4- Visual Feedback: The indicator will show a Buy label in green above the pivot level or a Sell label in red below the pivot level, making it easy to identify the trade direction at a glance.
Use Cases:
Gold & Commodity Trading: This tool is particularly useful for traders working with commodities like gold, where pivot levels can help determine potential price action points.
Swing & Day Trading: The dynamic nature of this indicator makes it great for both swing and day traders who want to monitor short-term market movements.
Support and Resistance Strategy: Traders who rely on support and resistance levels to make buy/sell decisions can use this indicator to automate and visualize these levels more effectively.

Pivot Candles with MFI Opacity (No Plot)How to Use the Pivot Candles with MFI Opacity Indicator for Trade Entries and Position Management
Overview
This indicator is designed not only to display key pivot levels (support and resistance) and Money Flow Index (MFI) signals on your chart, but also to help you structure systematic order entries and position management. By combining pivot levels with dynamic MFI-based candle opacity, the indicator provides a visual framework that technical analysts and quants can use to time buy and sell stop orders as well as to pyramid positions or take profits.
Trade Entry with Pivot Levels
Buy Stop Orders Above R1:
Concept: In many technical setups, resistance levels such as R1 are viewed as potential breakout points. A buy stop order placed just above R1 allows you to enter a long position only when price decisively breaks the prior resistance, confirming bullish momentum.
How It Works:
The indicator calculates pivot levels based on the previous higher‑timeframe bar, so R1 is “locked in” for the current period.
When the current candle closes above R1, it may signal a breakout.
Technical analysts often place a buy stop order slightly above R1 (for example, a few ticks or pips above the level) to confirm the move.
Practical Application:
Quants and systematic traders can program their models to monitor when the current close exceeds R1.
Once this condition is met, a buy stop order is triggered to capture the breakout move, ensuring that you only participate if the price decisively moves upward.
Sell Stop Orders Below S1:
Concept: Conversely, S1 acts as a support level. A sell stop order placed just below S1 is designed to capture a breakdown. This order is activated when price closes below S1, indicating that selling pressure may be overwhelming.
How It Works:
With pivot levels fixed from the previous higher‑timeframe bar, S1 provides a reference for potential support.
A close below S1 can be interpreted as a sign of a bearish reversal or a continuation of a downtrend.
Practical Application:
Quants set up their systems to watch for a break below S1.
A sell stop order is positioned just below S1 to ensure that if the support level fails, the system can quickly initiate a short position to capture the downward move.
Using MFI for Position Management
Pyramiding and Profit Taking:
Dynamic Candle Opacity:
The Money Flow Index (MFI) in this indicator not only provides overbought/oversold alerts but also controls the opacity of your candlesticks. When MFI readings are high, the candles become more opaque, indicating strong buying pressure. Conversely, lower MFI values lead to more transparent candles, suggesting reduced momentum.
Pyramiding Long Positions:
Strategy:
In a strong trend, technical analysts might choose to add to a winning position gradually—a process known as pyramiding.
Implementation:
As long as the price remains above R1 and MFI readings are supportive (high and consistent), you may consider adding to your long position incrementally.
Each new buy stop order can be set above R1 with slightly adjusted trigger levels to capture further breakout strength.
Risk Management:
Quants use the MFI reading as a risk filter; if MFI begins to drop or the candles become significantly more transparent, it may be a cue to stop pyramiding or even begin taking profits.
Taking Profit Using MFI and Pivot Reversals:
Profit Targeting:
When price reaches higher resistance levels (e.g., R2 or R3) or shows signs of overextension in conjunction with extreme MFI levels (for instance, a sudden drop in MFI after a strong rally), you can begin taking partial profits.
Systematic Exit:
A systematic strategy might include scaling out of the position as the price approaches the next resistance level or when the MFI indicates that buying momentum is waning.
Similarly, for short positions entered below S1, profit targets might be set near subsequent support levels, with exits triggered if MFI suggests a reversal.
Summary
Entry Orders:
Place buy stop orders just above R1 to capture breakouts.
Place sell stop orders just below S1 to capture breakdowns.
Position Management with MFI:
Use MFI-based candle opacity as a visual indicator of momentum.
Pyramid positions in the direction of the trend when MFI confirms strength.
Consider partial exits if MFI readings start to reverse or if the price nears the next pivot level.
By following this systematic approach, technical analysts and quants can use the indicator not only as a visual tool but as an integral part of an automated or semi-automated trading system that emphasizes disciplined entries, pyramiding, and profit-taking.

Pivot PointsPivot Points Indicator
The Pivot Points indicator highlights areas on the chart where candles close in opposite colors. These points occur when the price shifts from bullish to bearish, or vice versa, indicating potential reversals or continuation patterns. These points are more easily seen on a line chart and represent areas where the price changes direction to create peak formations.
Foundational Concepts
Before diving into the indicator, it’s important to understand a few key concepts:
When price is trending upward, it creates higher highs and higher lows. Each high or low acts as a pivot point. In an uptrend, the price is more likely to break the previous high (pivot point) and continue higher. You can enter a buy trade when the price breaks the previous high, anticipating the continuation of the trend.
When price is trending downward, it creates lower lows and lower highs. Each high or low is also a pivot point. In a downtrend, the price is more likely to break the previous low (pivot point) and continue lower. You can enter a sell trade when the price breaks the previous low, anticipating the continuation of the trend.
For reversal trades, it’s helpful to be familiar with chart patterns like double tops, double bottoms, and head and shoulders. The Pivot Points indicator can assist in identifying these patterns, helping you determine entry points, as well as where to place your stop loss.
Recommended Setup
It’s recommended to have two charts open side by side: one displaying a line chart and the other showing a candlestick chart, with the Pivot Points indicator applied to both. This setup allows you to easily identify the market structure and price action as it approaches these levels. You can also add a 20-period Simple Moving Average (SMA) to both charts to help identify the overall trend. Additionally, consider adding the Relative Strength Index (RSI) to the line chart to confirm overbought or oversold conditions.
This approach can be used on any timeframe.
Contributing
If you have suggestions, improvements, or bug fixes, I encourage you to submit pull requests. Collaboration helps make the indicator more versatile and useful for everyone.
Disclaimer
Any trading decisions you make are entirely your responsibility.
The MetaTrader 5 version of this indicator is available on my GitHub repository: roshaneforde/pivot-points-indicator
ICT KillZones + Pivot Points [TradingFinder] Support/Resistance 🟣 Introduction
Pivot Points are critical levels on a price chart where trading activity is notably high. These points are derived from the prior day's price data and serve as key reference markers for traders' decision-making processes.
Types of Pivot Points :
Floor
Woodie
Camarilla
Fibonacci
🔵 Floor Pivot Points
Widely utilized in technical analysis, floor pivot points are essential in identifying support and resistance levels. The central pivot point (PP) acts as the primary level, suggesting the trend's likely direction.
The additional resistance levels (R1, R2, R3) and support levels (S1, S2, S3) offer further insight into potential trend reversals or continuations.
🔵 Camarilla Pivot Points
Featuring eight distinct levels, Camarilla pivot points closely correspond with support and resistance, making them highly effective for setting stop-loss orders and profit targets.
🔵 Woodie Pivot Points
Similar to floor pivot points, Woodie pivot points differ by placing greater emphasis on the closing price, often resulting in different pivot levels compared to the floor method.
🔵 Fibonacci Pivot Points
Fibonacci pivot points combine the standard floor pivot points with Fibonacci retracement levels applied to the previous trading period's range. Common retracement levels used are 38.2%, 61.8%, and 100%.
🟣 Sessions
Financial markets are divided into specific time segments, known as sessions, each with unique characteristics and activity levels. These sessions are active at different times throughout the day.
The primary sessions in financial markets include :
Asian Session
European Session
New York Session
The timing of these major sessions in UTC is as follows :
Asian Session: 23:00 to 06:00
European Session: 07:00 to 14:25
New York Session: 14:30 to 22:55
🟣 Kill Zones
Kill zones are periods within a session marked by heightened trading activity. During these times, trading volume surges and price movements become more pronounced.
The timing of the major kill zones in UTC is :
Asian Kill Zone: 23:00 to 03:55
European Kill Zone: 07:00 to 09:55
New York Kill Zone: 14:30 to 16:55
Combining kill zones and pivot points in financial market analysis provides several advantages :
Enhanced Market Sentiment Analysis : Aligns key price levels with high-activity periods for a clearer market sentiment.
Improved Timing for Trade Entries and Exits : Helps better time trades based on when price movements are most likely.
Higher Probability of Successful Trades : Increases the accuracy of predicting market movements and placing profitable trades.
Strategic Stop-Loss and Profit Target Placement : Allows for precise risk management by strategically setting stop-loss and profit targets.
Versatility Across Different Time Frames : Effective in both short and long time frames, suitable for various trading strategies.
Enhanced Trend Identification and Confirmation : Confirms trends using both pivot levels and high-activity periods, ensuring stronger trend validation.
In essence, this integrated approach enhances decision-making, optimizes trading performance, and improves risk management.
🟣 How to Use
🔵 Two Approaches to Trading Pivot Points
There are two main strategies for trading pivot points: utilizing "pivot point breakouts" and "price reversals."
🔵 Pivot Point Breakout
When the price breaks through pivot lines, it signals a shift in market sentiment to the trader. In the case of an upward breakout, where the price crosses these pivot lines, a trader might enter a long position, placing their stop-loss just below the pivot point (P).
Conversely, if the price breaks downward, a short position can be initiated below the pivot point. When using the pivot point breakout strategy, the first and second support levels can serve as profit targets in an upward trend. In a downward trend, these roles are filled by the first and second resistance levels.
🔵 Price Reversal
An alternative method involves waiting for the price to reverse at the support and resistance levels. To implement this strategy, traders should take positions opposite to the prevailing trend as the price rebounds from the pivot point.
While this tool is commonly used in higher time frames, it tends to produce better results in shorter time frames, such as 1-hour, 30-minute, and 15-minute intervals.
Three Strategies for Trading the Kill Zone
There are three principal strategies for trading within the kill zone :
Kill Zone Hunt
Breakout and Pullback to Kill Zone
Trading in the Trend of the Kill Zone
🔵 Kill Zone Hunt
This strategy involves waiting until the kill zone concludes and its high and low lines are established. If the price reaches one of these lines within the same session and is strongly rejected, a trade can be executed.
🔵 Breakout and Pullback to Kill Zone
In this approach, once the kill zone ends and its high and low lines stabilize, a trade can be made if the price breaks one of these lines decisively within the same session and then pulls back to that level.
🔵 Trading in the Trend of the Kill Zone
Kill zones are characterized by high trading volumes and strong trends. Therefore, trades can be placed in the direction of the prevailing trend. For instance, if an upward trend dominates this area, a buy trade can be entered when the price reaches a demand order block.

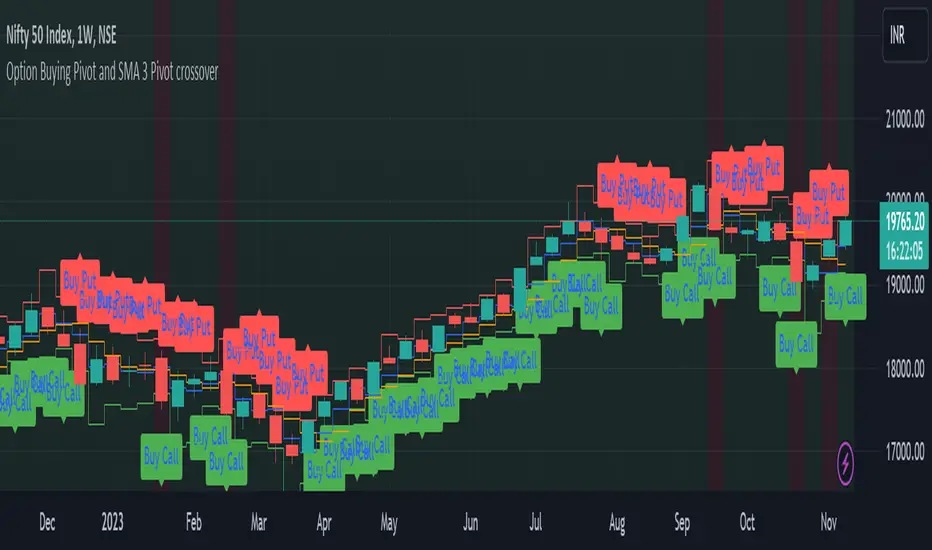
Option Buying Pivot and SMA 3 Pivot crossoverThis script is designed as a visual aid for options trading specifically for option buying, providing information about potential entry points, Option levels, and trade outcomes. Here's a summary of the key elements:
1. Pivot Point and True Range:*
- The script calculates the current candle's pivot point, representing an average of high, low, and close prices from the previous candle.
- True range, a measure of volatility, is determined using the high, low, and close prices of the last two candles.
2. Option Levels:
- Downside (PutValue - Red colour line) and upside (CallValue - Green Colour line) are calculated based on the current pivot point and true range.
PutValue = currentCandlePivot + currentCandleTrueRange
CallValue = currentCandlePivot - currentCandleTrueRange
3. Simple Moving Average (SMA) of Pivot Point:
- A 3-period SMA is applied to the pivot point to smooth out fluctuations.
4. Trade Entry Logic:
- Long entry is signalled when the current pivot point is above the SMA. (longEntry = currentCandlePivot > smaPivot)
- At the time of long entry BUY THE CALL OPTION OR SELL THE PUT OPTION near the CallValue Green line
- Short entry is signalled when the current pivot point is below the SMA. (shortEntry = currentCandlePivot < smaPivot)
- At the time of Short entry BUY THE PUT OPTION OR SELL THE CALL OPTION near the PutValue Red line
The indicator having option to change the background of the candle as a green for long; and change the background of the candle as red for short. Also, Having the option to plot as label.
5. Win and Loss Logic:
- Winning conditions are assessed based on the close price relative to CallValue (for Long) and PutValue (for Short).
- Losing conditions are determined similarly.
- winLong = close > CallValue and longEntry
- winShort = close < PutValue and shortEntry
-lossLong = close < CallValue and longEntry
-lossShort = close > PutValue and shortEntry
The indicator having option to change the background of the candle as a green for win; and change the background of the candle as red for loss. Also, Having the option to plot as label.
6. Background Coloring and Plots:
- The script uses background colors to highlight Long, Short, Win, and Loss scenarios.
- Shapes and labels are plotted on the chart to visually represent entry points, stop-loss levels, and trade outcomes.
The overall purpose is to provide traders with a clear visual representation of potential trading opportunities and outcomes, helping them make informed decisions in the options market.
Candle Pivot and Stop LossThe script plot upside and down side stop loss using pivot point and trure range.
The True Range, representing market volatility, is determined by finding the maximum value among the differences between the previous high-low, high-close, and low-close. The Downside Stop Loss is calculated by adding the True Range to the Pivot Point, while the Upside Stop Loss is calculated by subtracting the True Range from the Pivot Point.
These levels are plotted on the chart in blue (Pivot Point), red (Downside Stop Loss), and green (Upside Stop Loss), providing traders with essential reference points for their trading strategies.
The provided Pine Script calculates key trading levels for the current candle, including the Pivot Point, Downside Stop Loss, and Upside Stop Loss. The Pivot Point is computed as the average of the previous candle's high, low, and close prices.

Pivot Support & Resistance [DeltaAlgo]Pivot Support & Resistance Indicator - DeltaAlgo
Concept:
The "Pivot Support & Resistance" indicator is designed to help traders identify and visualize key support and resistance levels based on pivot points. It calculates and plots lines representing these levels on a price chart. This indicator's concept is rooted in the idea that pivot points can act as significant price reference points, which can be instrumental in making trading decisions.
Settings:
Pivot Period: Users can customize the period for calculating pivot points. This period determines how many bars are considered when calculating support and resistance levels.
Maximum Lines: The indicator allows traders to set a maximum number of support and resistance lines that will be displayed. When the maximum is reached, older lines are removed to keep the chart uncluttered.
Line Colors and Width: Users can choose the colors and width for both the support and resistance lines to tailor the indicator's appearance to their preferences.
Use Case:
The "Pivot Support & Resistance" indicator is beneficial for traders who employ pivot points in their technical analysis and trading strategies. It aids in identifying potential reversal and breakout levels, which can inform trading decisions. Traders can use this indicator to:
Identify key price levels: The indicator highlights significant support and resistance levels based on pivot points.
Plan entries and exits: Traders can incorporate these levels into their trading strategies to make more informed decisions about when to enter or exit trades.
Manage risk: Knowing where support and resistance levels are can help traders set stop-loss and take-profit orders more effectively.
This indicator simplifies the process of identifying and visualizing pivot-based support and resistance levels, making it a valuable tool for traders who rely on these levels in their technical analysis. It helps streamline the decision-making process and enhances overall trading effectiveness.
