MKAST V2 (monthly)PLEASE READ THE ENTIRE POST BEFORE PURCHASING & USING THE MKAST Algorithm. Saves you and me some time in emails and messages. :)
This is the NEW MONTHLY ACCESS Version of the MKAST
The MKAST Buy Sell Algorithm is a very specific strategy, cut down to its roots and made perfect for the volatile crypto market.
Many Algorithms focus only on one aspect, one side, one specific rule.
As you know, this is not how life, the market or anything else works.
MKAST combines many different aspects at the same time, scans multiple other Algorithms and comes to a conclusion based on over 1350 lines of code.
It is based on Divergences, Elliott Waves , Ichimoku , MACD , MACD Histogram, RSI , Stoch , CCI , Momentum, OBV, DIOSC, VWMACD, CMF and multiple EMAs.
Every single aspect is weighted into the decision before giving out an indication.
Most buy/sell Algorithms FAIL because they try to apply the same strategy to every single chart, which
are as individual as humans.
To conquer this problem, MKAST has a wide range of settings and variables which can be easily
modified.
To make it a true strategy, MKAST has as well settings for Take Profit Points, Multiple Entries and Stop
Losses. Everything with an Alert Feature of course.
I know from experience that many people take one Algorithm and are simply too LAZY to add multiple Algorithms to make a rational choice.
The result of that is that they lose money, by following blatantly only one Algorithm.
MKAST has additional 9 Indicators, perfect for the crypto market, which can be turned on and off.
Manual
MKAST Signals Settings
“Show Signals?” - On/Off to show the Buy/Sell Signals.
“Aggressiveness” - Increase to make the signals less aggressive and decrease to make them more aggressive.
“Show Custom Signals?” - On/Off to show custom MKAST Signals as chosen in the settings below.
“Custom Buy/Sell Aggressiveness” - Choose a custom Aggressiveness for each buy and sell signal individually.
“TJ-Index Requirement For Buy/Sell” - If the TJ-Index is below the given number, it will show the signal in grey, this also applies for normal signals. Buy 0 and Sell 15 shows all signals in their original colour again.
“Don’t show signals that don’t meet index requirement?” - Checked, it will completely not show signals which would be “grey” as in the explanation above.
“Change Backgroundcolour if index is at 15 or 0?” - Checked, changes the colour of the chart if the index is at 15 or 0 points
MKAST Panel Settings
“Show Info Panel?” - Shows Info Panel on the chart.
“Move Info Panel UP by %” - Moves Info Panel up/down.
“Move Info Panel Left/Right ” - Moves Info Panel Left/Right.
“Show BitMEX Panel?” - Shows BitMEX Panel on the chart.
“Move BitMEX Panel by % ” - Moves BitMEX Panel up/down.
“Move BitMEX Panel Left/Right” - Moves BitMEX Panel Left/Right. “Signal Source” - Choose source of candle open/close for Equity calculation.
“Leverage Used?” - Select the used Leverage for your strategy and Equity calculation.
“Fees Per Trade in % ” - Deducts these fees after each trade from Equity calculation.
“Round Current Profit Price?” - Rounds the number on the Panel. “Trading Periods ” - Choose a trading Period which will be used to calculate Period Equity.
“Show separations of each Trading Period?” - Show separations on the chart of each Trading Period.
The very new feature on Tradingview and obviously now as well on MKAST are Information Panels.
I have chosen to add an Info Panel and a BitMEX Price Panel into MKAST, to make live and even
backtesting easier.
With only one blink of an eye the user is able to see ALL relevant information, without having to go
through various ways of checking and using other tools.
The Info Panel:
The first row shows the current profit. This is calculated since the signal initiation and the current candle close. Followed by a single number, which represents the current TJ-Index, removing the need of having to add the actual TJ-Index Oscillator on the chart.
The second row shows the current position and its status. This was added on request of many users wanting to know if their position is “about to change” or not. The status shows the users if the position is “endangered” or “okay”.
Followed by the “backtesting tool” already included inside the Panel. No need for complex oscillators with a hard reading for backtesting. With this one and simple panel, you see the Period Equity for the period chosen previously in the settings. This calculates all profits made inside that period and re-sets when the period ends. Right next to it, the Total Equity calculating ALL profits since the beginning of the chart.
Right below, you see the information about the last long and short position which have been open. This helps with the evaluation and documentation of the last trade.
The BitMEX Panel:
A convenient panel which shows all BitMEX contracts and their LIVE prices. The need for opening each chart goes away, the quality and experience of trading increases.
MKAST custom Signals are one of the notorious possibilities for ADVANCED strategies with MKAST.
Users who requested these features and use them frequently are the ones, having already a very unique trading strategy and they use these very custom signals as confluence or for multiple entry trades.
These custom signals and their settings can be mostly ignored by the majority of traders who are using this Algorithm.
The idea behind the grey signals has its roots in the idea of the TJ-Index. The TJ-Index being 15 Algorithms and conditions possible showing a bullish or bearish interpretation. The index counts the Algorithms which are showing a bullish interpretation.
Like that we can make sure that signals are shown in the original colour, are only those who have an additional confluence with the TJ-Index, not letting the user buy, if at least the majority is not bullish , and not letting the user sell, if at least the majority is bearish .
The custom buy and sell aggressiveness lets the user customise the MKAST algorithm even more.
Either the users wants to see how signals are changing on a different (slightly lower or higher) aggressiveness, being able to expect a change on their own settings. OR seeing that some signals of the same sort are a little out of place and is able to move these to a different aggressiveness, increasing the profitability even more.
Needless to say, custom signals are NOT a part of the Info Panel.
MKAST Label & Trendline Settings
“Show Labels?” - On/Off to show Labels above each signal, with the percentage gain or loss, calculated from the last signal to the new signal.
“Show Trendlines?” - On/Off to show automatic Trendlines following Gainzy Lines.
“Lookback Length” - Choose a length that the automatic trendiness use for calculation. Comparable to Aggressiveness.
“Wicks//Bodies” - Change between trendiness connecting from wick to wick or from body to body.
“Black lines// Coloured lines” - Change between simply black lines or changing colour lines.
“Filter Trendlines?” - On/Off to show all trendiness or just resistance decreasing and support increasing ones.
“Limit Extensions Of The Lines?” - This value increases by how much the trendiness are being extended. 0 = endless extension, otherwise 100 = maximum custom extension.MKAST Strategy “Take Profit 1” - On/Off to show TP1 points.
“Take Profit After %” - Set the percentage after which TP1 is active.
“Take Profit 2 ” - On/Off to show TP2 points.
“Take Profit 2 After %” - Set the percentage after which TP1 is
active.
“Take Profit 3” - On/Off to show TP3 points.
“Take Profit 3 After %” - Set the percentage after which TP1 is active.
“Second Entry” - On/Off to show Second Entry points.
“Second Entry After %” - Set the percentage after which Second Entry is active.
“Third Entry” - On/Off to show Third Entry points.
“Third Entry After %” - Set the percentage after which Third Entry is active.
“Stop Loss” - On/Off to show Stop Loss points.
“Stop Loss After %” - Set the percentage after which Stop Loss is active.
MKAST Strategy
To make the life of the MKAST user even easier, I have added all adjustable Take Profit Points, Multiple entry points and Stop Loss points.
I have never seen a sustainable and reliable trading strategy without TPs, Multiple entry and especially without a stop loss. Everything in the usual and fully customisable MKAST style.
Simply choose how many Take Profit points you would like to have and choose the percentage after which you would like to see the Take Profit point appear on the chart and notify you to take profits.
Are you a Trader who likes Multiple Entries? Also no problem with MKAST. Select how many additional entries you would like to have and after how many percent you would like them to appear on the chart and remind you of adding to the position.
What would a Strategy be without a Stop Loss? Same settings apply here as on the TPs and MEs .
All of the settings are able to take fractions of a number as well. This enables users to even use all of the strategy settings for scalping or FX pairs, where high leverage and the smallest of moves are used for trading.
Needless to say, all of these settings work on RENKO and Heikin Ashi as well. These might need adjustment, since the calculation is different, yet there is nothing standing in the way of it anymore.
Crypto Modified Indicators
“Show Divergences?” - On/Off to show Divergences on the Chart based on the data of 10 different Algorithms.
“Show Oversold/bought?” - On/Off to change the colour of the chart in Oversold/bought conditions.
“Oversold/bought value?” - Choose a value for which the chart is Oversold/bought.
“Show Fibonacci Levels?” - On/Off to show automatic Fibonacci Levels.
“Fibonacci Lookback Lenght” - This value states how many candles from right now are taken into account to paint the Fibonacci Levels.
“Fibonacci Custom Period” - Choose a custom Timeframe that should be used to paint the Fibonacci Levels.
“2nd-7th Fibonacci Level” - Enter a value for the Fibonacci Levels you would like to use and see on the chart.
“Plot 1.618 Level?” - On/Off for the Fibonacci extension level.
Crypto Modified Indicators
“Show Bands?” - On/Off to show the TJ-Bands on the chart.
“Bands Length” - Choose a value for the TJ-Bands Lenght
“Show Show EMA 1-3?” - On/Off to show the EMAs 1-3 on the chart.
“EMA Lenght 1-3” - Choose a value for the first to third EMA Lenght
“Show Ichimoku? ” - On/Off to show Ichimoku on the chart.
“Show Tenkin?” - On/Off to show Tenkin on the chart. “Tenkin” - Set the lenght of the Tenkin.
“Show Kijun?” - On/Off to show Kijun on the chart.
“Kijun” - Set the lenght of the Kijun.
“Show Senkou?” - On/Off to show the Senkou on the chart. “Senkou” - Set the lenght of the Senkou.
“Displacement” - Set the value of the Displacement.
“Show Chikou Span?” - On/Off to show the Chikou Span on the chart.
Crypto Custom Indicators
In the picture above, you see the first pair of Crypto Custom Indicators. The oversold and overbought conditions are highlighted.
Bullish and Bearish divergences are also plotted on the chart.
This is personally my favourite combination of Indicators and MKAST settings. It shows nicely
everything one needs to know and makes it easier to decide wether to follow a signal or not.
We here as well a perfect example of the Automatic Fibonacci Lines (Lookback 50, Timeframe 1D).
It shows all significant levels, which we can see being respected.
Orange = 23.6%, Green = 38.2%, Red = 50%, Yellow = 61.8%, Blue = 78.6%, White = 0%;100%
In this picture above, we observe the perfect ensemble of MKAST and an EMA strategy, especially modified for crypto markets.
Here, as by default, we have the EMAs at 21, 90 and 200. These have shown to be very significant moving support and resistance points in the crypto market.
In this picture above, I lowered the timeframe to show the highly significant levels of the Ichimoku . It has not the “usual values”. These here have been modified for the volatile crypto market and set as default.
An incredibly powerful tool for anyone who is ready to step up their trading game. It is a huge part of the MKAST back end and the strategy behind it.
MKAST Custom Alerts
1
MKAST without any doubt has Custom Alerts for all Signals that it is painting on the chart.
One can even choose to receive custom notifications for Take Profit points, Multiple Entry points and
the Stop Loss points.
The signals appear on the chart DURING the candle, not at the end of the candle. Therefore, the
alerts do this as well. These appear during the candle.
Here we can see all of the possible Alerts that can be chosen to be displayed. In total it is 14 different custom alerts, based on what the trader is looking for and how he is trading.
Personally, I have 10-15 coins that I trade the most and for these I have custom notifications, mostly though only the MKAST Buy/Sell and Stop Loss Signals.
To activate Alerts for MKAST,
1) Go to the “ALERT” icon on the top tool bar of your Tradingview.
2) Select “CONDITION” as “—MKAST—“
3) Then choose ONE condition from the list of conditions.
4) On “OPTIONS” you can set how many times it appears, I have “Once per Bar”.
4.1) If you want to make sure that the signal is truly there and not just a condition for a second during the candle, choose “ONCE PER BAR CLOSE”.
5) “Expiration Time” sets the time until the alert expires. PRO users have no expiration for alerts.
6) “Alert Actions” give you a row of choices what happens and how you want to be notified.
7) “Message” is the message that you receive inside the notification.
Thank you, Kong
"profit"に関するスクリプトを検索

MKAST V2 (lifetime)PLEASE READ THE ENTIRE POST BEFORE PURCHASING & USING THE MKAST Algorithm. Saves you and me some time in emails and messages. :)
This is the NEW LIFETIME ACCESS Version of the MKAST
The MKAST Buy Sell Algorithm is a very specific strategy, cut down to its roots and made perfect for the volatile crypto market.
Many Algorithms focus only on one aspect, one side, one specific rule.
As you know, this is not how life, the market or anything else works.
MKAST combines many different aspects at the same time, scans multiple other Algorithms and comes to a conclusion based on over 1350 lines of code.
It is based on Divergences, Elliott Waves, Ichimoku, MACD, MACD Histogram, RSI, Stoch, CCI, Momentum, OBV, DIOSC, VWMACD, CMF and multiple EMAs.
Every single aspect is weighted into the decision before giving out an indication.
Most buy/sell Algorithms FAIL because they try to apply the same strategy to every single chart, which
are as individual as humans.
To conquer this problem, MKAST has a wide range of settings and variables which can be easily
modified.
To make it a true strategy, MKAST has as well settings for Take Profit Points, Multiple Entries and Stop
Losses. Everything with an Alert Feature of course.
I know from experience that many people take one Algorithm and are simply too LAZY to add multiple Algorithms to make a rational choice.
The result of that is that they lose money, by following blatantly only one Algorithm.
MKAST has additional 9 Indicators, perfect for the crypto market, which can be turned on and off.
Manual
MKAST Signals Settings
“Show Signals?” - On/Off to show the Buy/Sell Signals.
“Aggressiveness” - Increase to make the signals less aggressive and decrease to make them more aggressive.
“Show Custom Signals?” - On/Off to show custom MKAST Signals as chosen in the settings below.
“Custom Buy/Sell Aggressiveness” - Choose a custom Aggressiveness for each buy and sell signal individually.
“TJ-Index Requirement For Buy/Sell” - If the TJ-Index is below the given number, it will show the signal in grey, this also applies for normal signals. Buy 0 and Sell 15 shows all signals in their original colour again.
“Don’t show signals that don’t meet index requirement?” - Checked, it will completely not show signals which would be “grey” as in the explanation above.
“Change Backgroundcolour if index is at 15 or 0?” - Checked, changes the colour of the chart if the index is at 15 or 0 points
MKAST Panel Settings
“Show Info Panel?” - Shows Info Panel on the chart.
“Move Info Panel UP by %” - Moves Info Panel up/down.
“Move Info Panel Left/Right ” - Moves Info Panel Left/Right.
“Show BitMEX Panel?” - Shows BitMEX Panel on the chart.
“Move BitMEX Panel by % ” - Moves BitMEX Panel up/down.
“Move BitMEX Panel Left/Right” - Moves BitMEX Panel Left/Right. “Signal Source” - Choose source of candle open/close for Equity calculation.
“Leverage Used?” - Select the used Leverage for your strategy and Equity calculation.
“Fees Per Trade in % ” - Deducts these fees after each trade from Equity calculation.
“Round Current Profit Price?” - Rounds the number on the Panel. “Trading Periods ” - Choose a trading Period which will be used to calculate Period Equity.
“Show separations of each Trading Period?” - Show separations on the chart of each Trading Period.
The very new feature on Tradingview and obviously now as well on MKAST are Information Panels.
I have chosen to add an Info Panel and a BitMEX Price Panel into MKAST, to make live and even
backtesting easier.
With only one blink of an eye the user is able to see ALL relevant information, without having to go
through various ways of checking and using other tools.
The Info Panel:
The first row shows the current profit. This is calculated since the signal initiation and the current candle close. Followed by a single number, which represents the current TJ-Index, removing the need of having to add the actual TJ-Index Oscillator on the chart.
The second row shows the current position and its status. This was added on request of many users wanting to know if their position is “about to change” or not. The status shows the users if the position is “endangered” or “okay”.
Followed by the “backtesting tool” already included inside the Panel. No need for complex oscillators with a hard reading for backtesting. With this one and simple panel, you see the Period Equity for the period chosen previously in the settings. This calculates all profits made inside that period and re-sets when the period ends. Right next to it, the Total Equity calculating ALL profits since the beginning of the chart.
Right below, you see the information about the last long and short position which have been open. This helps with the evaluation and documentation of the last trade.
The BitMEX Panel:
A convenient panel which shows all BitMEX contracts and their LIVE prices. The need for opening each chart goes away, the quality and experience of trading increases.
MKAST custom Signals are one of the notorious possibilities for ADVANCED strategies with MKAST.
Users who requested these features and use them frequently are the ones, having already a very unique trading strategy and they use these very custom signals as confluence or for multiple entry trades.
These custom signals and their settings can be mostly ignored by the majority of traders who are using this Algorithm.
The idea behind the grey signals has its roots in the idea of the TJ-Index. The TJ-Index being 15 Algorithms and conditions possible showing a bullish or bearish interpretation. The index counts the Algorithms which are showing a bullish interpretation.
Like that we can make sure that signals are shown in the original colour, are only those who have an additional confluence with the TJ-Index, not letting the user buy, if at least the majority is not bullish, and not letting the user sell, if at least the majority is bearish.
The custom buy and sell aggressiveness lets the user customise the MKAST algorithm even more.
Either the users wants to see how signals are changing on a different (slightly lower or higher) aggressiveness, being able to expect a change on their own settings. OR seeing that some signals of the same sort are a little out of place and is able to move these to a different aggressiveness, increasing the profitability even more.
Needless to say, custom signals are NOT a part of the Info Panel.
MKAST Label & Trendline Settings
“Show Labels?” - On/Off to show Labels above each signal, with the percentage gain or loss, calculated from the last signal to the new signal.
“Show Trendlines?” - On/Off to show automatic Trendlines following Gainzy Lines.
“Lookback Length” - Choose a length that the automatic trendiness use for calculation. Comparable to Aggressiveness.
“Wicks//Bodies” - Change between trendiness connecting from wick to wick or from body to body.
“Black lines// Coloured lines” - Change between simply black lines or changing colour lines.
“Filter Trendlines?” - On/Off to show all trendiness or just resistance decreasing and support increasing ones.
“Limit Extensions Of The Lines?” - This value increases by how much the trendiness are being extended. 0 = endless extension, otherwise 100 = maximum custom extension.MKAST Strategy “Take Profit 1” - On/Off to show TP1 points.
“Take Profit After %” - Set the percentage after which TP1 is active.
“Take Profit 2 ” - On/Off to show TP2 points.
“Take Profit 2 After %” - Set the percentage after which TP1 is
active.
“Take Profit 3” - On/Off to show TP3 points.
“Take Profit 3 After %” - Set the percentage after which TP1 is active.
“Second Entry” - On/Off to show Second Entry points.
“Second Entry After %” - Set the percentage after which Second Entry is active.
“Third Entry” - On/Off to show Third Entry points.
“Third Entry After %” - Set the percentage after which Third Entry is active.
“Stop Loss” - On/Off to show Stop Loss points.
“Stop Loss After %” - Set the percentage after which Stop Loss is active.
MKAST Strategy
To make the life of the MKAST user even easier, I have added all adjustable Take Profit Points, Multiple entry points and Stop Loss points.
I have never seen a sustainable and reliable trading strategy without TPs, Multiple entry and especially without a stop loss. Everything in the usual and fully customisable MKAST style.
Simply choose how many Take Profit points you would like to have and choose the percentage after which you would like to see the Take Profit point appear on the chart and notify you to take profits.
Are you a Trader who likes Multiple Entries? Also no problem with MKAST. Select how many additional entries you would like to have and after how many percent you would like them to appear on the chart and remind you of adding to the position.
What would a Strategy be without a Stop Loss? Same settings apply here as on the TPs and MEs.
All of the settings are able to take fractions of a number as well. This enables users to even use all of the strategy settings for scalping or FX pairs, where high leverage and the smallest of moves are used for trading.
Needless to say, all of these settings work on RENKO and Heikin Ashi as well. These might need adjustment, since the calculation is different, yet there is nothing standing in the way of it anymore.
Crypto Modified Indicators
“Show Divergences?” - On/Off to show Divergences on the Chart based on the data of 10 different Algorithms.
“Show Oversold/bought?” - On/Off to change the colour of the chart in Oversold/bought conditions.
“Oversold/bought value?” - Choose a value for which the chart is Oversold/bought.
“Show Fibonacci Levels?” - On/Off to show automatic Fibonacci Levels.
“Fibonacci Lookback Lenght” - This value states how many candles from right now are taken into account to paint the Fibonacci Levels.
“Fibonacci Custom Period” - Choose a custom Timeframe that should be used to paint the Fibonacci Levels.
“2nd-7th Fibonacci Level” - Enter a value for the Fibonacci Levels you would like to use and see on the chart.
“Plot 1.618 Level?” - On/Off for the Fibonacci extension level.
Crypto Modified Indicators
“Show Bands?” - On/Off to show the TJ-Bands on the chart.
“Bands Length” - Choose a value for the TJ-Bands Lenght
“Show Show EMA 1-3?” - On/Off to show the EMAs 1-3 on the chart.
“EMA Lenght 1-3” - Choose a value for the first to third EMA Lenght
“Show Ichimoku? ” - On/Off to show Ichimoku on the chart.
“Show Tenkin?” - On/Off to show Tenkin on the chart. “Tenkin” - Set the lenght of the Tenkin.
“Show Kijun?” - On/Off to show Kijun on the chart.
“Kijun” - Set the lenght of the Kijun.
“Show Senkou?” - On/Off to show the Senkou on the chart. “Senkou” - Set the lenght of the Senkou.
“Displacement” - Set the value of the Displacement.
“Show Chikou Span?” - On/Off to show the Chikou Span on the chart.
Crypto Custom Indicators
In the picture above, you see the first pair of Crypto Custom Indicators. The oversold and overbought conditions are highlighted.
Bullish and Bearish divergences are also plotted on the chart.
This is personally my favourite combination of Indicators and MKAST settings. It shows nicely
everything one needs to know and makes it easier to decide wether to follow a signal or not.
We here as well a perfect example of the Automatic Fibonacci Lines (Lookback 50, Timeframe 1D).
It shows all significant levels, which we can see being respected.
Orange = 23.6%, Green = 38.2%, Red = 50%, Yellow = 61.8%, Blue = 78.6%, White = 0%;100%
In this picture above, we observe the perfect ensemble of MKAST and an EMA strategy, especially modified for crypto markets.
Here, as by default, we have the EMAs at 21, 90 and 200. These have shown to be very significant moving support and resistance points in the crypto market.
In this picture above, I lowered the timeframe to show the highly significant levels of the Ichimoku. It has not the “usual values”. These here have been modified for the volatile crypto market and set as default.
An incredibly powerful tool for anyone who is ready to step up their trading game. It is a huge part of the MKAST back end and the strategy behind it.
MKAST Custom Alerts
1
MKAST without any doubt has Custom Alerts for all Signals that it is painting on the chart.
One can even choose to receive custom notifications for Take Profit points, Multiple Entry points and
the Stop Loss points.
The signals appear on the chart DURING the candle, not at the end of the candle. Therefore, the
alerts do this as well. These appear during the candle.
Here we can see all of the possible Alerts that can be chosen to be displayed. In total it is 14 different custom alerts, based on what the trader is looking for and how he is trading.
Personally, I have 10-15 coins that I trade the most and for these I have custom notifications, mostly though only the MKAST Buy/Sell and Stop Loss Signals.
To activate Alerts for MKAST,
1) Go to the “ALERT” icon on the top tool bar of your Tradingview.
2) Select “CONDITION” as “—MKAST—“
3) Then choose ONE condition from the list of conditions.
4) On “OPTIONS” you can set how many times it appears, I have “Once per Bar”.
4.1) If you want to make sure that the signal is truly there and not just a condition for a second during the candle, choose “ONCE PER BAR CLOSE”.
5) “Expiration Time” sets the time until the alert expires. PRO users have no expiration for alerts.
6) “Alert Actions” give you a row of choices what happens and how you want to be notified.
7) “Message” is the message that you receive inside the notification.
Thank you, Kong

CryptoEngineering 🔥Isn’t It Time You Made Your Crypto Portfolio Great Again? 🔥
The falling knives, the heartbreaking crashes, the devastating feeling of watching a missed trade soar all the way to the moon.
The markets aren’t fair, which means you need a tool that gives you an edge. So,It is time to try EngineeringRobo.
The Engineeringrobo is a great ally in a crypto market - when the price moves the algorithm will automatically show Buy and Sell orders when there is a best opportunity to make a profit. It is a just SMART trading system script on TradingView that brings the easiest approach to trading with a high profitability rate.
I created EngineeringRobo to help you on your traders as a robo advisor , It will "not " trade on behalf of you on exchanges via API. It is not an AI robot,It is am ALGO Trading robot. You can use it on any trading markets (BIST, S&P 500,Commodities ,Forex, Crypto ) with any time frame!
My unique algorithm find profitable altcoins based on their Ichimoku, McGinley, MA, RSI, MACD, Stochastic, Volumes and Price Changes gives you BUY and SELL signals. The EngineeringRobo indicator displays two different signals for entry and exit on a coin to maximize its profitability on the chart. The signals can appear at any time during an open candle, but once closed the signal is final and wont change in the future.
One of the biggest advantages of algo trading is removing human emotion from the crypto markets,humans trading are susceptible to emotions that lead to irrational decisions.Robo doesn't have to think or feel good to make a trade. If conditions are met, it enters.When the trade goes the wrong way or hits a profit target, It exits. It doesn't get angry at the market or feel invincible after making a few good trades. The two emotions that lead to poor decisions that algo traders aren't susceptible to are fear,and greed.
That's why It makes money but most of you not!
What Are the Advantages of using it as a ROBO Advisor?
🔴Reduce your required screen-time
🔴Reduce anxiety over missing setups when you are busy
🔴Turn existing indicators into alerts (eg. Whenever RSI goes overbought)
🔴Find comfort in knowing that you have me on your side
To get the maximized results from @EngineeringRobo
Open tradingview
Decide the coin/BTC
Pick 1M
Draw the Support & Resistance lines
Change the 1W
Draw the lines - Support & Resistance
Find out Chart Patterns
Change to 3D/1D / 3H
Check Robo' signals
Set your orders
Enjoy your profits💰
***Even the best automated day trading software can trigger false trends.
In August 2012 by Knight Capital group;who lost over $440 million in just half an hour when their trading software went rogue in response to market conditions. That's why it is a Robo advisor not trading bot! Engineeringrobo is not a get-rich-quick scheme as well!
Disclaimer
Information on EngineeringRobo should not be seen as a recommendation to trade BIST, S&P 500,Commodities ,Forex, Crypto.
EngineeringRobo is not licensed nor authorized to provide advice on investing and related matters.
Information on the page is not, nor should it be seen as investment advice.Any trading decisions that you make are solely your responsibility. Clients without sufficient knowledge should seek individual advice from an authorized source.
Crypto and Forex trading entails significant risks and there is a chance that clients lose all of their invested money. Past performance is not a guarantee of future returns. Before trading with any of the Algos, clients should make sure they understand the risks.
EngineeringRobo nor its agents or partners are not registered and do not provide any services on the US territory.
***I have been trading since 2016 . Got my first bitcoin in 2013

cryptomars 1.0 Concussion trend alarm Description:
1. In the indicator, there is an orange signal that fluctuates linearly. It is a buy signal when it goes from bottom to top. When the signal line remains in the upper position, it indicates a multi-party trend.
2. When it goes from top to bottom, it indicates a sell signal. When the signal line remains below, it indicates a sales trend.
3. Depending on the time level, when the position of the signal line changes, determine whether the current candle is completed or not according to the time level of the chart you selected to determine the signal. For example, if you select a chart level of 5 meters, then when the signal line changes, for example, it will send a sell signal from top to bottom. At this time, please do not rush to sell. You should wait for this 5 meter candlestick to complete. When the candle is over and the next candle is started, if the signal line remains in the top-down form, the sell signal is normal and you can sell it.
Because the position of the signal appears, it is the location of the sale. During the completion of the candlestick , the signal may disappear after disappearing. We only have to wait for a while to get a more stable deal.
4. The alarm setting is very simple. There are two lines in the indicator. One is the orange signal line that fluctuates up and down, and the other is the fixed zero line of “zero”.
We set it in the alarm. When the signal line passes "zero" from the top, the short signal is sent only when the candle map is completed. When the signal line passes "zero" from "up" below, the signal is sent for a long time when the candlestick is completed.
One trick, the appearance of the signal, is that the price runs in one direction for a while, so it appears at or near the bottom. Because, when we have already made a profit in the transaction, we can make a profit in advance, and we do not need to wait for the opposite signal to stop the profit and reduce the risk of profit retracement.
Because in this market, the fluctuations are very large, and the people who compete are also very fierce. What we need to do is to make every transaction as possible, and we are all profitable. If we sell and find that the price is still rising, please don't feel sorry, don't consider eating all the profits.
6. When the signal appears, in most cases, even in the impact trend, it will still run a distance in the direction of the signal, that is, you will profit, so please close the position and make a profit in time. Otherwise, when the price volatility is too small, you miss the profit point, the price starts to run in the opposite direction, and you may change from profit to loss.
BITMEX's trailing stop loss is a great feature, please use it flexibly.
7, if it is a shock trend, please try not to trade.
8. We recommend that you turn on the “cryptomars 3.0” and “cryptomars 2.0” indicators. No matter who signs the trade first, you can trade, which can help you get more profit.
9. Remember, I hope this indicator will be your powerful assistant, but please don't rely on it completely. Learning more trading knowledge and skills is even more important. Therefore, when we consider the profitable position, you can use your trading skills, MACD , KDJ, etc. to assist and profit in a more suitable position.

cryptomars 2.0 short alarmDescription:
1. In the indicator, there is an orange signal that fluctuates linearly. It is a buy signal when it goes from bottom to top. When the signal line remains in the upper position, it indicates a multi-party trend.
2. When it goes from top to bottom, it indicates a sell signal. When the signal line remains below, it indicates a sales trend.
3. Depending on the time level, when the position of the signal line changes, determine whether the current candle is completed or not according to the time level of the chart you selected to determine the signal. For example, if you select a chart level of 5 meters, then when the signal line changes, for example, it will send a sell signal from top to bottom. At this time, please do not rush to sell. You should wait for this 5 meter candlestick to complete. When the candle is over and the next candle is started, if the signal line remains in the top-down form, the sell signal is normal and you can sell it.
Because the position of the signal appears, it is the location of the sale. During the completion of the candlestick , the signal may disappear after disappearing. We only have to wait for a while to get a more stable deal.
4. The alarm setting is very simple. There are two lines in the indicator. One is the orange signal line that fluctuates up and down, and the other is the fixed zero line of “zero”.
We set it in the alarm. When the signal line passes "zero" from the top, the short signal is sent only when the candle map is completed. When the signal line passes "zero" from "up" below, the signal is sent for a long time when the candlestick is completed.
One trick, the appearance of the signal, is that the price runs in one direction for a while, so it appears at or near the bottom. Because, when we have already made a profit in the transaction, we can make a profit in advance, and we do not need to wait for the opposite signal to stop the profit and reduce the risk of profit retracement.
Because in this market, the fluctuations are very large, and the people who compete are also very fierce. What we need to do is to make every transaction as possible, and we are all profitable. If we sell and find that the price is still rising, please don't feel sorry, don't consider eating all the profits.
6. When the signal appears, in most cases, even in the impact trend, it will still run a distance in the direction of the signal, that is, you will profit, so please close the position and make a profit in time. Otherwise, when the price volatility is too small, you miss the profit point, the price starts to run in the opposite direction, and you may change from profit to loss.
BITMEX's trailing stop loss is a great feature, please use it flexibly.
7, if it is a shock trend, please try not to trade.
8. We recommend that you turn on the “cryptomars 3.0” and “cryptomars 1.0” indicators. No matter who signs the trade first, you can trade, which can help you get more profit.
9. Remember, I hope this indicator will be your powerful assistant, but please don't rely on it completely. Learning more trading knowledge and skills is even more important. Therefore, when we consider the profitable position, you can use your trading skills, MACD , KDJ, etc. to assist and profit in a more suitable position.

cryptomars alarm 3.0
Description:
1. In the indicator, there is an orange signal that fluctuates linearly. It is a buy signal when it goes from bottom to top. When the signal line remains in the upper position, it indicates a multi-party trend.
2. When it goes from top to bottom, it indicates a sell signal. When the signal line remains below, it indicates a sales trend.
3. Depending on the time level, when the position of the signal line changes, determine whether the current candle is completed or not according to the time level of the chart you selected to determine the signal. For example, if you select a chart level of 5 meters, then when the signal line changes, for example, it will send a sell signal from top to bottom. At this time, please do not rush to sell. You should wait for this 5 meter candlestick to complete. When the candle is over and the next candle is started, if the signal line remains in the top-down form, the sell signal is normal and you can sell it.
Because the position of the signal appears, it is the location of the sale. During the completion of the candlestick , the signal may disappear after disappearing. We only have to wait for a while to get a more stable deal.
4. The alarm setting is very simple. There are two lines in the indicator. One is the orange signal line that fluctuates up and down, and the other is the fixed zero line of “zero”.
We set it in the alarm. When the signal line passes "zero" from the top, the short signal is sent only when the candle map is completed. When the signal line passes "zero" from "up" below, the signal is sent for a long time when the candlestick is completed.
One trick, the appearance of the signal, is that the price runs in one direction for a while, so it appears at or near the bottom. Because, when we have already made a profit in the transaction, we can make a profit in advance, and we do not need to wait for the opposite signal to stop the profit and reduce the risk of profit retracement.
Because in this market, the fluctuations are very large, and the people who compete are also very fierce. What we need to do is to make every transaction as possible, and we are all profitable. If we sell and find that the price is still rising, please don't feel sorry, don't consider eating all the profits.
6. When the signal appears, in most cases, even in the impact trend, it will still run a distance in the direction of the signal, that is, you will profit, so please close the position and make a profit in time. Otherwise, when the price volatility is too small, you miss the profit point, the price starts to run in the opposite direction, and you may change from profit to loss.
BITMEX's trailing stop loss is a great feature, please use it flexibly.
7, if it is a shock trend, please try not to trade.
8. We recommend that you turn on the “cryptomars 2.0” and “cryptomars 1.0” indicators. No matter who signs the trade first, you can trade, which can help you get more profit.
9. Remember, I hope this indicator will be your powerful assistant, but please don't rely on it completely. Learning more trading knowledge and skills is even more important. Therefore, when we consider the profitable position, you can use your trading skills, MACD , KDJ, etc. to assist and profit in a more suitable position.

Complete Trend Trading System [Fhenry0331]This system was designed for the beginner trader to make money swing trading. Your losses will be small and your gains will be mostly large. You will show consistent profit. Period.
The system works on any security you like to trade. I used GBPUSD as an example because of the up swing and down swing it had recently. I tried to put as much information of how the system works in the chart. Hope it helps and is not to cluttered.
I will reiterate how the system works here: Everything is based off of closed price.
Legend
Uptrend: Buy
Green bar: initial start of an uptrend or uptrend continuing. Place order above that bar. If the initial bar does not stray too far from the MVWAP , I will place orders above subsequent bars if no filled occurred.
If initial start of the trend is missed, I will wait for the pullback. A pullback is a close below the MVWAP, and a close above the EMA (Low), RSI is above 50. Orders are placed above the pullback bars with plotted char "B" and also plotted green triangle up. Again orders are placed above those bars. the bars do not notate automatic buys. Don't chase anything. You will miss the initial bar on something because of news or earnings and it rocket up. Just wait, it will pullback. If it doesn't, to hell with it, on to the next.
Take profits: In the indicator you will see "T." That notates to take some profits. It is a suggestion. I was always told to take profits into spikes, as well as you can never lose money if you take profits. Up to you if you want to scale out and take the suggested profits or not.
Exit Completely: In an uptrend, close your entire position on bars colored yellow or red. (Again, closed bars)
In uptrend bars colored orange and black, do nothing, they are just pullback bars. Look for the buy pullback signal, then follow pullback buy rules for an uptrend.
Downtrend: Short
Red bar: initial start of a downtrend or downtrend continuing. Place order below the bar. If the initial bar does not stray too far fro the MVWAP, place orders below subsequent bars.
If initial start on the downtrend is missed, wait for the pullback. A pullback is a close above the MVWAP, and close below the EMA(Low). RSI is below 50. Orders are placed below the pullback bars with the plotted char "S" and also plotted red triangle. Again those bars are not automatic shorts, orders are placed below them. Don't chase anything. Wait for price to come into your plan. The idea FOMO is the stupidest thing ever, how can you miss out on something when it is always there. The market is always there and something will come into your zone. Chill.
"T": same as in uptrend, suggestion to take some profits.
Exit Completely: In a downtrend, close your entire position on bars colored orange or green.
In downtrend you will see bars colored yellow and black, do nothing, they are pullback bars. Look for the pullback short signal and follow pullback short rules.
If you have any questions get at me. Take a look at it on what you trade. Flip it through different securities.
Best of luck in all you do.
P.S. You should not take a trade right before earnings. You should also exit a trade right before earnings.

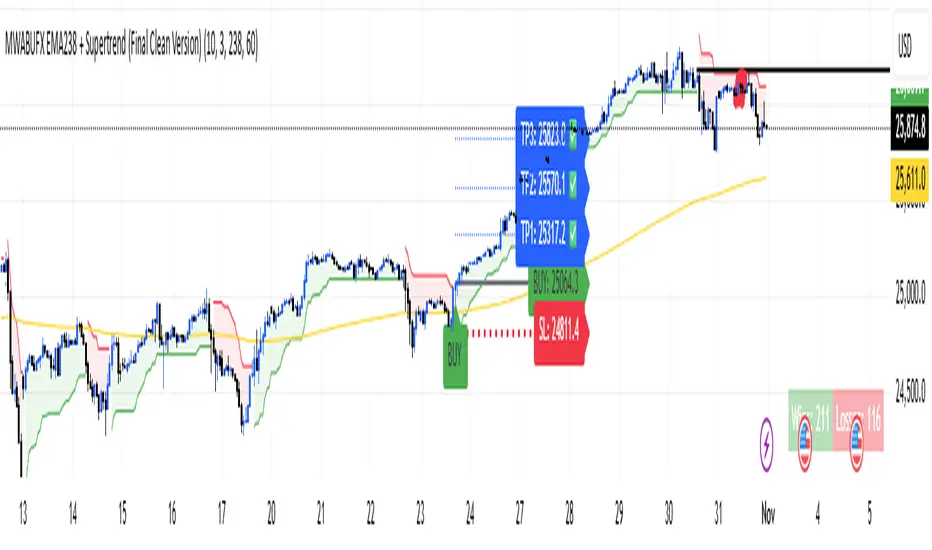
BMM V2.1 FINAL VERSION ⚙️ Optimized Trading Guide — MWABUFX 15-Minute Intraday Setup
🕒 Recommended Timeframe
✅ 15-Minute Chart (M15) — the most balanced and accurate for MWABUFX.
Why M15 Works Best:
Filters out small, noisy market movements found on 1m–5m charts.
Responds faster than 1H or 4H, perfect for daily profits.
Aligns well with market session volatility (London & New York).
Gives 2–5 high-probability trades per day depending on the pair.
Ideal for traders using PineConnector automation or manual execution.
🧭 How to Trade on 15-Minute
🟢 Buy Setup
EMA 238 is sloping upward and price is above it.
Supertrend flips green — wait for candle to close above the line.
Confirm trend direction on 1H timeframe (optional filter).
Enter trade at the close of the signal candle.
Stop-Loss: below recent swing low.
Take Profits:
TP1 → 1:1
TP2 → 1:2
TP3 → 1:3
Move SL to breakeven after TP1 is hit.
🔴 Sell Setup
EMA 238 is sloping downward and price is below it.
Supertrend flips red — wait for candle to close below the line.
Confirm 1H trend also bearish (optional).
Enter trade at the candle close.
Stop-Loss: above recent swing high.
Take Profits: TP1, TP2, TP3 as above.
🕐 Best Trading Hours (Kenya Time / GMT+3)
Session Time Ideal Pairs Notes
London Session 10:00 AM – 2:00 PM GBPUSD, EURUSD, Gold Cleanest 15-min trends
New York Session 3:30 PM – 7:00 PM US30, NAS100, XAUUSD, GBPUSD Strong volatility, high RR trades
Avoid After 8:30 PM — Market slows down, spreads widen
📌 If you must choose one — trade 15-minute charts during London–New York overlap (3:30 PM – 6:30 PM).
⚖️ Risk & Profit Strategy
Risk only 1–2% of balance per trade.
Focus on 1–3 solid setups per session — no overtrading.
Aim for minimum 1:2 reward-to-risk ratio.
Avoid entries when EMA 238 is flat (ranging market).
💡 Pro Tips
Use “Close of Candle” confirmation — avoid jumping in mid-bar.
Combine with session bias (e.g. buy Gold during bullish NY momentum).
Use alerts through PineConnector to catch trades instantly.
Don’t trade during major red news (NFP, CPI, FOMC).
Journal every trade — review TP/SL behavior to improve timing.
🏦 Institutional Smart Money Tracker_NEIL_BILLIONAIRE✅ INSTITUTIONAL SMART MONEY TRACKER V6 - COMPLETE
Here's what makes this institutional-grade and prevents wrong-direction trades:
🎯 CRITICAL ANTI-WRONG-DIRECTION FEATURES:
🏦 MASTER INSTITUTIONAL BIAS - Dashboard shows:
Strong Bullish (3-4 HTFs bullish) = ⚠️ ONLY TAKE LONG TRADES
Strong Bearish (3-4 HTFs bearish) = ⚠️ ONLY TAKE SHORT TRADES
Neutral = ⚠️ WAIT FOR CLEAR DIRECTION
🚨 BACKGROUND COLOR ALERTS:
Green tint = Strong bullish environment (safe to long)
Red tint = Strong bearish environment (safe to short)
Orange tint = DANGER ZONE - mixed signals, DON'T TRADE!
📊 MULTI-TIMEFRAME CONFIRMATION:
Analyzes 4 higher timeframes (15m, 1H, 4H, Daily by default)
Only generates signals when aligned with HTF trends
Shows trend strength for each timeframe
🎨 VISUAL ELEMENTS:
Green boxes = IDM bullish order blocks (demand zones)
Red boxes = IDM bearish order blocks (supply zones)
Blue/Orange boxes = EXT HTF order blocks
Aqua/Fuchsia boxes = Fair Value Gaps
Yellow boxes = Accumulation zones
Orange boxes = Distribution zones
⚠️ labels = Manipulation detected
💥 bubbles = High volume institutional activity
BOS/CHOCH labels = Market structure changes
🟢 LONG / 🔴 SHORT = Trade signals with full TP/SL levels
📋 DASHBOARD SHOWS:
Master institutional bias (color-coded)
Current timeframe trend + strength
4 HTF trends + strength levels
Market structure status
Volume analysis
Active trade with entry/SL/TP1/TP2/TP3
⚙️ EVERYTHING IS CUSTOMIZABLE:
Individual on/off toggles for all features
Colors, sizes, periods, thresholds
Dashboard position
HTF selections
Risk/reward ratios
🔔 8 BUILT-IN ALERTS:
Long signal
Short signal
Break of Structure
Change of Character
Manipulation detected
High volume spikes
Even when drunk/stoned, the massive dashboard + colored backgrounds make it IMPOSSIBLE to trade the wrong direction! 🎯
This is New Year's 2026 gift to fellow ♥ newbie traders, who are still learning to decode the market moves(♥just like me♥).
🏦 INSTITUTIONAL SMART MONEY TRACKER - COMPLETE TUTORIAL
📋 TABLE OF CONTENTS
Installation
Understanding the Dashboard
Visual Elements Guide
How to Read Signals
Trading Strategy
Settings Customization
Real Trading Examples
🚀 1. INSTALLATION {#installation}
Step 1: Copy the Code
Click on the artifact above and copy ALL the Pine Script code
Step 2: Open TradingView
Go to TradingView.com
Open any chart (BTC, ETH, stocks, forex, etc.)
Step 3: Open Pine Editor
Click "Pine Editor" at the bottom of the screen
Click "Open" → "New blank indicator"
Step 4: Paste & Save
Delete all existing code
Paste the copied indicator code
Click "Save" (give it a name like "Institutional SMT")
Click "Add to Chart"
Step 5: Initial Setup
The indicator will load with default settings
You'll see a dashboard in the top-right corner
Order blocks, FVGs, and zones will appear on the chart
📊 2. UNDERSTANDING THE DASHBOARD {#dashboard}
🏦 INSTITUTIONAL BIAS (TOP SECTION)
****** This is the MOST IMPORTANT section - it prevents wrong-direction trades!******
🟢 STRONG BULLISH = 3-4 higher timeframes bullish
→ ONLY TAKE LONG TRADES
🟡 BULLISH = 2 higher timeframes bullish
→ Prefer long trades, be cautious
🔴 STRONG BEARISH = 3-4 higher timeframes bearish
→ ONLY TAKE SHORT TRADES
🟠 BEARISH = 2 higher timeframes bearish
→ Prefer short trades, be cautious
⚪ NEUTRAL = Mixed signals
→ STAY OUT! Don't trade!
```
### **⚠️ WARNING MESSAGE**
- **"ONLY TAKE LONG TRADES"** = All HTFs aligned bullish
- **"ONLY TAKE SHORT TRADES"** = All HTFs aligned bearish
- **"WAIT FOR CLEAR DIRECTION"** = Don't trade yet!
### **CURRENT TIMEFRAME**
Shows your current chart's trend:
- **UP** = Bullish structure
- **DOWN** = Bearish structure
- **SIDE** = Sideways/choppy
**STRENGTH:**
- **STRONG** = ADX > 25 (trending market)
- **MEDIUM** = ADX 20-25 (moderate trend)
- **WEAK** = ADX < 20 (choppy/ranging)
### **HIGHER TIMEFRAMES (HTF)**
Displays 4 higher timeframes (default: 15m, 1H, 4H, Daily):
- **15m** = Short-term trend
- **1H** = Intraday trend
- **4H** = Swing trend
- **D** = Major trend
Each shows:
- Direction (UP/DOWN/SIDE)
- Strength (STRONG/MEDIUM/WEAK)
### **MARKET STRUCTURE**
- **BULLISH** = Higher highs and higher lows
- **BEARISH** = Lower highs and lower lows
- Shows last structure event (BOS/CHOCH)
### **VOLUME**
- **HIGH 💥** = Institutional activity detected
- **NORMAL** = Average volume
- Shows volume multiplier (e.g., "2.5x" = 2.5 times average)
### **ACTIVE SIGNAL**
- **🟢 LONG** = Active long trade with entry/SL/TP levels
- **🔴 SHORT** = Active short trade with entry/SL/TP levels
- **NO ACTIVE TRADE** = Waiting for setup
---
## 🎨 **3. VISUAL ELEMENTS GUIDE** {#visual-elements}
### **📦 ORDER BLOCKS**
**🟢 GREEN BOXES (Bullish IDM Order Blocks)**
- Last bearish candle before strong bullish move
- Demand zone where institutions bought
- Price often bounces here
- **Thicker border** = Unmitigated (not tested yet) → High probability zone
**🔴 RED BOXES (Bearish IDM Order Blocks)**
- Last bullish candle before strong bearish move
- Supply zone where institutions sold
- Price often rejects here
- **Thicker border** = Unmitigated (not tested yet) → High probability zone
**🔷 BLUE BOXES (EXT Bullish Order Blocks)**
- Higher timeframe demand zones
- Stronger support levels
- Dashed border = HTF zone
**🟠 ORANGE BOXES (EXT Bearish Order Blocks)**
- Higher timeframe supply zones
- Stronger resistance levels
- Dashed border = HTF zone
### **📊 FAIR VALUE GAPS (FVGs)**
**💠 AQUA BOXES (Bullish FVG)**
- Gap between price movement (inefficiency)
- Price tends to fill these gaps
- Buy zone when price returns
**💜 FUCHSIA BOXES (Bearish FVG)**
- Gap between price movement (inefficiency)
- Price tends to fill these gaps
- Sell zone when price returns
**🟡 YELLOW BOXES (Inverted FVG)**
- FVG that got filled and now acts as support/resistance
- Becomes a key level for future trades
### **⚡ BREAKER BLOCKS**
**BB Labels (Green/Red dotted lines)**
- Failed order blocks that flipped
- Was support, became resistance (or vice versa)
- Strong reversal zones
### **🎯 SMART MONEY ZONES**
**🟡 ACCUMULATION BOXES**
- Consolidation + increasing volume + bullish structure
- Institutions accumulating positions
- Expect bullish breakout
**🟠 DISTRIBUTION BOXES**
- Consolidation + increasing volume + bearish structure
- Institutions distributing/selling
- Expect bearish breakdown
**⚠️ MANIPULATION Labels**
- Large wicks + high volume
- Stop hunt detected
- Watch for reversal
### **💥 VOLUME BUBBLES**
- **Green bubble** = High volume bullish candle (institutional buying)
- **Red bubble** = High volume bearish candle (institutional selling)
- Shows volume multiplier (e.g., "3.2x")
### **📈 MARKET STRUCTURE**
**Small triangles:**
- 🔺 Green triangle below = Swing low
- 🔻 Red triangle above = Swing high
**BOS Labels (Green/Red)**
- Break of Structure
- Trend continuation signal
- **Green BOS** = Bullish continuation
- **Red BOS** = Bearish continuation
**CHOCH Labels (Blue/Orange)**
- Change of Character
- Potential trend reversal
- **Blue CHOCH** = Shift to bullish
- **Orange CHOCH** = Shift to bearish
### **⚠️ DIVERGENCE SIGNALS**
**🔼 BULL DIV (Green label below)**
- Price makes lower low, RSI makes higher low
- Bullish reversal signal
- Strong at oversold levels (RSI < 35)
**🔽 BEAR DIV (Red label above)**
- Price makes higher high, RSI makes lower high
- Bearish reversal signal
- Strong at overbought levels (RSI > 65)
### **🚨 BACKGROUND COLORS**
**Light Green Background**
- 3-4 HTFs bullish + strong trend
- Safe to take long trades
- High confidence environment
**Light Red Background**
- 3-4 HTFs bearish + strong trend
- Safe to take short trades
- High confidence environment
**Light Orange Background**
- Mixed signals across timeframes
- **DANGER ZONE - STAY OUT!**
- Wait for clarity
---
## 🎯 **4. HOW TO READ SIGNALS** {#signals}
### **🟢 LONG SIGNAL GENERATION**
Signal appears when ALL conditions met:
1. ✅ Market structure is bullish (uptrend)
2. ✅ Bullish order block formed
3. ✅ Price above last swing low
4. ✅ RSI < 65 (not overbought)
5. ✅ Volume > 1.2x average
**What You'll See:**
- **🟢 LONG** label at entry point
- Blue line = Entry price
- Red line = Stop loss
- Green dashed lines = TP1, TP2
- Green solid line = TP3 (final target)
**Dashboard Shows:**
- Entry price
- Stop loss level
- TP1 (40% target by default)
- TP2 (70% target by default)
- TP3 (100% target = 2:1 R:R by default)
### **🔴 SHORT SIGNAL GENERATION**
Signal appears when ALL conditions met:
1. ✅ Market structure is bearish (downtrend)
2. ✅ Bearish order block formed
3. ✅ Price below last swing high
4. ✅ RSI > 35 (not oversold)
5. ✅ Volume > 1.2x average
**What You'll See:**
- **🔴 SHORT** label at entry point
- Blue line = Entry price
- Red line = Stop loss
- Green dashed lines = TP1, TP2
- Green solid line = TP3 (final target)
---
## 📈 **5. TRADING STRATEGY** {#strategy}
### **🎓 THE GOLDEN RULES (FOLLOW THESE!)**
#### **Rule #1: MASTER BIAS IS LAW**
```
IF Dashboard shows "🟢 STRONG BULLISH":
✅ Take LONG trades ONLY
❌ Ignore all short signals
IF Dashboard shows "🔴 STRONG BEARISH":
✅ Take SHORT trades ONLY
❌ Ignore all long signals
IF Dashboard shows "⚪ NEUTRAL":
❌ DON'T TRADE
⏰ Wait for alignment
```
#### **Rule #2: Trade WITH Higher Timeframes**
- Check all 4 HTFs in dashboard
- Need at least 2-3 HTFs aligned
- More alignment = higher probability
#### **Rule #3: Use Order Blocks for Entry**
- Wait for price to return to unmitigated OB
- Enter when price touches thick-border box
- Best entries = HTF order block + Current TF order block overlap
#### **Rule #4: Confirm with Volume**
- Wait for 💥 volume bubble at entry
- High volume = institutional participation
- No volume = wait for confirmation
#### **Rule #5: Respect Market Structure**
- Don't fight BOS (continuation)
- Be cautious near CHOCH (reversal)
- Wait for structure to stabilize
### **📝 STEP-BY-STEP TRADING PROCESS**
#### **STEP 1: Check Dashboard**
```
1. Look at INSTITUTIONAL BIAS
- Green = Go long only
- Red = Go short only
- Orange/Gray = Stay out
2. Check HTF alignment
- Count how many HTFs aligned
- Need 2+ for good trades
- Need 3+ for best trades
3. Check current trend strength
- STRONG = good trending moves
- WEAK = choppy, reduce size
```
#### **STEP 2: Identify Key Zones**
```
1. Mark unmitigated order blocks (thick borders)
2. Note FVG zones (aqua/fuchsia boxes)
3. Watch for accumulation/distribution zones
4. Mark breaker blocks (dotted lines)
```
#### **STEP 3: Wait for Signal**
```
IF Bullish Bias:
✅ Wait for price to pull back to:
- Bullish order block (green box)
- Bullish FVG (aqua box)
- Support structure
✅ Wait for 🟢 LONG signal label
✅ Confirm with:
- Volume bubble (💥)
- BOS label (continuation)
- No bearish divergence
IF Bearish Bias:
✅ Wait for price to rally to:
- Bearish order block (red box)
- Bearish FVG (fuchsia box)
- Resistance structure
✅ Wait for 🔴 SHORT signal label
✅ Confirm with:
- Volume bubble (💥)
- BOS label (continuation)
- No bullish divergence
```
#### **STEP 4: Execute Trade**
```
1. Enter at signal (🟢 LONG or 🔴 SHORT label)
2. Set stop loss at red line
3. Set take profits:
- TP1 at first dashed green line (40%)
- TP2 at second dashed green line (70%)
- TP3 at solid green line (100%)
4. Trail stop loss after TP1 hit
```
#### **STEP 5: Manage Trade**
```
1. Move SL to breakeven after TP1 hit
2. Take partial profits at each TP level
3. Let remaining position run to TP3
4. Exit immediately if:
- Dashboard bias changes
- CHOCH appears (trend reversal)
- Manipulation label appears
```
### **💎 ADVANCED STRATEGIES**
#### **Strategy 1: Order Block Retest**
```
1. Wait for strong move (BOS)
2. Wait for pullback to unmitigated OB
3. Enter when price touches OB + signal appears
4. SL below OB (longs) or above OB (shorts)
5. Target next OB or swing point
```
#### **Strategy 2: FVG Fill**
```
1. Identify large FVG (aqua/fuchsia box)
2. Wait for price to return to FVG
3. Enter when price enters FVG + signal appears
4. SL beyond FVG
5. Target 50-100% FVG fill
```
#### **Strategy 3: Accumulation Breakout**
```
1. Wait for ACCUMULATION box to form
2. Wait for price to break out with volume
3. Enter on retest of breakout level
4. SL inside accumulation zone
5. Target measured move (height of box)
```
#### **Strategy 4: Manipulation Fade**
```
1. Wait for ⚠️ MANIPULATION label
2. Wait for price to reverse (wick rejection)
3. Enter opposite direction with signal
4. SL beyond manipulation wick
5. Target previous swing point
```
#### **Strategy 5: Divergence Reversal**
```
1. Wait for 🔼 BULL DIV or 🔽 BEAR DIV
2. Confirm with CHOCH (structure break)
3. Enter on OB retest after divergence
4. SL beyond divergence low/high
5. Target opposite side structure
```
---
## ⚙️ **6. SETTINGS CUSTOMIZATION** {#settings}
### **📦 ORDER BLOCKS**
```
🟢 Show IDM Order Blocks: ON/OFF
- Toggle immediate timeframe order blocks
- Customize colors (default: green/red 85% transparency)
🔷 Show EXT Order Blocks: ON/OFF
- Toggle higher timeframe order blocks
- Customize colors (default: blue/orange 90% transparency)
⚡ Show Breaker Blocks: ON/OFF
- Toggle failed order blocks
🎯 Highlight Unmitigated OBs: ON/OFF
- Makes untested blocks thicker (RECOMMENDED: ON)
→ Extend Order Blocks: ON/OFF
- Extends boxes to the right
Max OBs to Display: 1-50
- How many order blocks to show (default: 10)
```
### **📊 FAIR VALUE GAPS**
```
Show Fair Value Gaps: ON/OFF
Show Inverted FVGs: ON/OFF
Bullish FVG Color: Customize (default: aqua)
Bearish FVG Color: Customize (default: fuchsia)
Min FVG Size %: 0.01+
- Minimum gap size to display (default: 0.1%)
```
### **📈 MARKET STRUCTURE**
```
Show Market Structure: ON/OFF
- Swing highs/lows triangles
Mark BOS: ON/OFF
- Break of Structure labels
Mark CHOCH: ON/OFF
- Change of Character labels
Swing Detection Length: 3-50
- Sensitivity (default: 10)
- Lower = more swings
- Higher = major swings only
Label Size: tiny/small/normal
- Size of structure labels
```
### **🎯 SMART MONEY ZONES**
```
Show Accumulation Zones: ON/OFF
Show Distribution Zones: ON/OFF
Show Manipulation Zones: ON/OFF
Accumulation Detection Period: 10+
- Lookback period (default: 20)
Manipulation Wick Threshold: 1.0+
- Wick size multiplier (default: 1.5)
```
### **📊 VOLUME ANALYSIS**
```
Show Volume Analysis: ON/OFF
Show High Volume Bubbles: ON/OFF
Volume Threshold: 1.0+
- Multiplier for high volume (default: 2.0)
- 2.0 = 2x average volume
Volume MA Period: 5+
- Moving average length (default: 20)
```
### **⚠️ DIVERGENCES**
```
Show Divergences: ON/OFF
RSI Length: 5+
- RSI calculation period (default: 14)
Divergence Lookback: 3-20
- How far back to check (default: 5)
```
### **📋 DASHBOARD**
```
Show Main Dashboard: ON/OFF
- Toggle entire dashboard
Dashboard Position: 9 options
- top_left, top_center, top_right
- middle_left, middle_center, middle_right
- bottom_left, bottom_center, bottom_right
Show HTF Analysis: ON/OFF
- Toggle higher timeframe section
HTF 1: Any timeframe (default: 15)
HTF 2: Any timeframe (default: 60)
HTF 3: Any timeframe (default: 240)
HTF 4: Any timeframe (default: D)
```
### **🎯 TRADE SIGNALS**
```
Show Trade Signals: ON/OFF
- Toggle 🟢 LONG / 🔴 SHORT labels
Show Entry/SL/TP Levels: ON/OFF
- Toggle horizontal lines
Risk:Reward Ratio: 1.0+
- TP3 distance (default: 2.0 = 2:1 R:R)
TP1 % of Total Target: 10-100%
- First target (default: 40%)
TP2 % of Total Target: 10-100%
- Second target (default: 70%)
```
---
## 💡 **7. REAL TRADING EXAMPLES** {#examples}
### **📊 EXAMPLE 1: Perfect Long Setup**
```
SCENARIO: Bitcoin 5-minute chart
Dashboard shows:
✅ 🟢 STRONG BULLISH
✅ HTF1 (15m): UP - STRONG
✅ HTF2 (1H): UP - STRONG
✅ HTF3 (4H): UP - MEDIUM
✅ HTF4 (D): UP - STRONG
✅ Current TF: UP - STRONG
✅ Market Structure: BULLISH
✅ Volume: HIGH 💥
What happened:
1. Price pulled back to green order block (unmitigated)
2. 🟢 LONG signal appeared at $67,500
3. Volume bubble (💥 2.8x) confirmed entry
4. BOS label appeared (continuation)
Entry: $67,500
SL: $67,200 (below OB)
TP1: $67,800 (40%) ✅ Hit
TP2: $68,000 (70%) ✅ Hit
TP3: $68,300 (100%) ✅ Hit
Result: +1.2% profit, 2:1 R:R
```
### **📊 EXAMPLE 2: Perfect Short Setup**
```
SCENARIO: Ethereum 15-minute chart
Dashboard shows:
✅ 🔴 STRONG BEARISH
✅ HTF1 (15m): DOWN - STRONG
✅ HTF2 (1H): DOWN - MEDIUM
✅ HTF3 (4H): DOWN - STRONG
✅ HTF4 (D): DOWN - STRONG
✅ Current TF: DOWN - STRONG
✅ Market Structure: BEARISH
✅ Volume: HIGH 💥
What happened:
1. Price rallied to red order block (unmitigated)
2. 🔴 SHORT signal appeared at $3,520
3. Volume bubble (💥 3.1x) confirmed entry
4. BOS label appeared (bearish continuation)
5. 🔽 BEAR DIV appeared (extra confirmation)
Entry: $3,520
SL: $3,560 (above OB)
TP1: $3,496 (40%) ✅ Hit
TP2: $3,476 (70%) ✅ Hit
TP3: $3,440 (100%) ✅ Hit
Result: +2.3% profit, 2:1 R:R
```
### **📊 EXAMPLE 3: Avoided Bad Trade**
```
SCENARIO: SPY stock 1-hour chart
Dashboard shows:
❌ ⚪ NEUTRAL
❌ HTF1 (15m): UP
❌ HTF2 (1H): DOWN
❌ HTF3 (4H): SIDE
❌ HTF4 (D): UP
❌ Background: Light orange (danger)
What happened:
1. 🟢 LONG signal appeared at $450
2. BUT dashboard showed NEUTRAL
3. Warning: "⚠️ WAIT FOR CLEAR DIRECTION"
4. Ignored signal (followed rules)
5. Price dropped -1.5% shortly after
Result: Avoided -1.5% loss
Key lesson: Trust the dashboard over individual signals!
```
### **📊 EXAMPLE 4: FVG Retest Trade**
```
SCENARIO: Gold futures 30-minute chart
Dashboard shows:
✅ 🟢 BULLISH (2 HTFs aligned)
✅ Current TF: UP - MEDIUM
✅ Large aqua FVG box below price
What happened:
1. Price created large FVG gap
2. Price pulled back into FVG zone
3. 🟢 LONG signal at FVG midpoint $2,045
4. Volume bubble (💥 2.3x) at entry
5. FVG turned yellow (inverted = filled)
Entry: $2,045
SL: $2,040 (below FVG)
TP1: $2,053 (40%) ✅ Hit
TP2: $2,058 (70%) ✅ Hit
TP3: $2,065 (100%) ✅ Hit
Result: +1.0% profit
```
### **📊 EXAMPLE 5: Manipulation Fade**
```
SCENARIO: EUR/USD forex 5-minute chart
Dashboard shows:
✅ 🔴 BEARISH
✅ Current TF: DOWN - STRONG
What happened:
1. Price had large bullish wick
2. ⚠️ MANIPULATION label appeared
3. High volume at wick (stop hunt)
4. Price reversed quickly
5. 🔴 SHORT signal at 1.0895
Entry: 1.0895
SL: 1.0910 (above manipulation wick)
TP1: 1.0880 (40%) ✅ Hit
TP2: 1.0872 (70%) ✅ Hit
TP3: 1.0865 (100%) ✅ Hit
Result: +0.28% profit (30 pips)
```
---
## ⚠️ **8. COMMON MISTAKES TO AVOID**
### **❌ Mistake #1: Trading Against Dashboard**
```
WRONG: Dashboard shows 🔴 BEARISH, but you take a long
CORRECT: Only take shorts when bearish, only longs when bullish
```
### **❌ Mistake #2: Ignoring Higher Timeframes**
```
WRONG: Current 5m looks good, ignored that 1H/4H/D are opposite
CORRECT: Check all HTFs before entry, need 2+ aligned
```
### **❌ Mistake #3: Trading in Neutral Zones**
```
WRONG: Taking trades when dashboard shows ⚪ NEUTRAL
CORRECT: Wait for clear bias (green or red), skip mixed signals
```
### **❌ Mistake #4: No Volume Confirmation**
```
WRONG: Entering without 💥 volume bubble
CORRECT: Wait for high volume institutional participation
```
### **❌ Mistake #5: Ignoring Market Structure**
```
WRONG: Longing into strong bearish structure
CORRECT: Wait for CHOCH (structure change) before reversing
```
### **❌ Mistake #6: Over-Trading**
```
WRONG: Taking every signal that appears
CORRECT: Wait for best setups with all confirmations aligned
```
### **❌ Mistake #7: Moving Stop Loss**
```
WRONG: Moving SL farther away when trade goes against you
CORRECT: Respect original SL, let it hit if wrong
```
### **❌ Mistake #8: Not Taking Partial Profits**
```
WRONG: Holding full position hoping for TP3
CORRECT: Scale out at TP1 (40%), TP2 (70%), let TP3 run
```
---
## 🎯 **9. QUICK REFERENCE CHECKLIST**
### **✅ BEFORE TAKING ANY TRADE:**
```
□ Dashboard shows clear bias (🟢 or 🔴, NOT ⚪)
□ At least 2-3 HTFs aligned with trade direction
□ Current timeframe trend matches trade direction
□ Trend strength is MEDIUM or STRONG (not WEAK)
□ Signal label appeared (🟢 LONG or 🔴 SHORT)
□ Price at key level (OB, FVG, or structure)
□ Volume bubble (💥) confirms entry
□ No opposing divergence signal
□ No opposing CHOCH (reversal warning)
□ Clear entry, SL, and TP levels visible
□ Risk:Reward is favorable (2:1 minimum)
□ Position size calculated (risk max 1-2% account)
```
### **✅ DURING THE TRADE:**
```
□ Monitor dashboard for bias change
□ Watch for CHOCH (could signal reversal)
□ Look for manipulation labels (⚠️)
□ Take partial profits at each TP level
□ Move SL to breakeven after TP1 hit
□ Trail stop using order blocks
□ Exit if dashboard bias changes color
```
### **✅ AFTER THE TRADE:**
```
□ Journal the trade (setup, result, lessons)
□ Review what worked and what didn't
□ Check if you followed all rules
□ Adjust settings if needed
□ Wait for next quality setup
```
---
## 🎓 **10. PRO TIPS**
1. **Best Timeframes**:
- Scalping: 1m, 5m
- Day trading: 5m, 15m
- Swing trading: 1H, 4H
- Position trading: D, W
2. **Best Markets**:
- Crypto (BTC, ETH) = Very responsive
- Forex majors = Clean structure
- Stock indices (SPY, NQ) = Good volume
- Individual stocks = Works best on liquid names
3. **Best Times to Trade**:
- Crypto: 24/7 (best during US/EU hours)
- Forex: London/NY overlap (8am-12pm EST)
- Stocks: First 2 hours + last hour of session
4. **Risk Management**:
- Never risk more than 1-2% per trade
- Use proper position sizing
- Always set stop loss BEFORE entry
- Take profits at planned levels
5. **Optimization**:
- Start with default settings
- Adjust HTFs based on your trading style
- Experiment with swing length for your market
- Tune volume threshold for your asset
---
## 🆘 **11. TROUBLESHOOTING**
### **Problem: No signals appearing**
**Solution:**
- Check if "Show Trade Signals" is enabled
- Verify market has sufficient volatility
- Try lower timeframe (5m instead of 1H)
- Check if conditions are met (volume, structure, RSI)
### **Problem: Too many order blocks**
**Solution:**
- Reduce "Max OBs to Display" (try 5-8)
- Disable "Show EXT Order Blocks"
- Increase swing length to filter minor ones
### **Problem: Dashboard not showing**
**Solution:**
- Enable "Show Main Dashboard"
- Change dashboard position
- Refresh chart
- Check chart has enough data loaded
### **Problem: Signals opposite to dashboard**
**Solution:**
- **Always trust the dashboard over individual signals!**
- This is working as intended - ignore conflicting signals
- Dashboard prevents wrong-direction trades
### **Problem: Too much clutter on chart**
**Solution:**
- Disable FVGs if not using them
- Disable breaker blocks
- Reduce max order blocks
- Hide volume bubbles
- Disable divergences
- Keep only what you actively trade
---
## 🎯 **12. FINAL WORDS**
This indicator is designed to keep you on the RIGHT SIDE of institutional money. The #1 rule is:
> **"When in doubt, follow the dashboard. It's designed to prevent you from trading drunk, stoned, or just plain wrong!"**
### **Your Trading Mantra:**
```
🟢 GREEN DASHBOARD = ONLY LONGS
🔴 RED DASHBOARD = ONLY SHORTS
⚪ NEUTRAL/ORANGE = NO TRADES
Follow this, and you'll stay aligned with smart money!
Remember:
Quality > Quantity
Patience is profitable
The best trade is often no trade
Protect your capital first
Let winners run, cut losers fast
📞 NEED HELP?
If you have questions:
Review this tutorial section by section
Practice on demo account first
Start with larger timeframes (easier to read)
Paper trade until consistently profitable
Start small when going live
Good luck, and trade smart! 🚀📈

MACD Trading System - Professional V2# MACD Trading System - Professional V2
## Executive Summary
**MACD Pro V2** is an institutional-grade trading indicator combining classical MACD analysis with advanced risk management, multi-timeframe confirmation, and comprehensive performance metrics. Designed for both manual traders and algorithmic systems, this indicator provides actionable signals with built-in stop loss calculation, take profit targets, position sizing, and trailing stop logic.
This indicator is NOT just a signal generator—it's a complete trading system with risk/reward management, performance tracking, and market regime detection.
---
## Core Features
### 1. Advanced MACD Calculation
- **Customizable EMAs**: Fast (default 8), Slow (default 21), Signal (default 5)
- **Confirmed Signals**: Uses barstate.isconfirmed to prevent repainting
- **Zero-Line Position**: Shows MACD above/below zero for momentum context
### 2. Multi-Timeframe Analysis
- **4 Simultaneous Timeframes**: 4H, 1H, 15M, 5M analyzed in parallel
- **MTF Alignment Score**: 0-100% showing consensus across timeframes
- **Smart Requests**: Uses lookahead=barmerge.lookahead_off for accuracy
### 3. Market Regime Detection
Automatically identifies current market conditions:
- **TRENDING** - ADX > 25, strong directional movement
- **RANGING** - ADX < 20, choppy sideways movement
- **VOLATILE** - ATR > 1.5x average, high uncertainty
- **NORMAL** - Default market state
### 4. Integrated Risk Management
Complete position management system:
- **Stop Loss Calculation**: Automatic SL placement based on ATR × multiplier
- **Take Profit Targets**: Calculated using Risk:Reward ratio (default 2:1)
- **Position Sizing**: Scales position size based on account risk percentage
- **Trailing Stop**: Dynamically adjusts SL as price moves in your favor
- **Drawdown Monitoring**: Tracks maximum drawdown vs account
### 5. Advanced Signal Scoring
0-100 point system weighing:
- **MTF Alignment (35%)**: Multi-timeframe confirmation strength
- **Momentum (25%)**: RSI conditions + Divergence detection
- **Volume (20%)**: Volume profile and confirmation
- **Volatility (20%)**: Market regime adjustment
**Signal Classifications:**
- **STRONG (70+)**: High confidence, tight stops, optimal entry
- **MEDIUM (50-69)**: Valid signals, confirm with price action
- **WEAK (<50)**: Low conviction, skip or use tight risk management
### 6. Professional Performance Metrics
Real-time trading statistics:
- **Win Rate**: Percentage of winning trades
- **Max Drawdown**: Largest peak-to-trough decline
- **Sharpe Ratio**: Risk-adjusted returns (anualized)
- **Profit Factor**: Gross profit / Gross loss ratio
- **Consecutive Losses**: Psychological stress indicator
### 7. Advanced Filtering System
- **Divergence Detection**: Automatic bullish/bearish divergence identification
- **Support/Resistance**: Pivot-based dynamic S/R levels
- **Volume Confirmation**: Only takes signals with volume > 1.0x average
- **Session Filter**: Optional trading hours restriction
- **Volatility Adjustment**: Reduces entries in extremely high volatility
---
## How It Works
### Signal Generation Process
**Step 1: MACD Crossover**
- Crossover of MACD above/below signal line triggers base signal
- Uses confirmed values to prevent false signals
**Step 2: Multi-Timeframe Confirmation**
- Checks trend alignment on 4H, 1H, 15M, 5M
- Calculates MTF alignment percentage
- Higher alignment = higher confidence
**Step 3: Advanced Scoring**
Signal is scored on 100-point scale:
- MTF alignment contribution (35 pts max)
- RSI + Divergence (25 pts max)
- Volume profile (20 pts max)
- Volatility regime adjustment (20 pts max)
**Step 4: Filter Application**
- Session filter (if enabled)
- Support/Resistance proximity bonus
- Volume confirmation requirement
- Drawdown check (if risk mgmt enabled)
**Step 5: Risk Calculation**
- Stop Loss placed 2 ATR below entry (customizable)
- Take Profit calculated using 2:1 risk/reward ratio
- Position size scaled to risk 1% per trade
- Trailing stop activated after 1R profit
**Step 6: Signal Output**
- Buy Signal: Green triangle (Strong) or circle (Medium)
- Sell Signal: Red triangle (Strong) or circle (Medium)
- Dashboard shows complete trade details
---
## Trading Scenarios
### Scenario 1: Strong Buy Setup
```
Requirements met:
✓ MACD crosses above signal line
✓ 3/4 timeframes bullish (4H, 1H, 15M)
✓ RSI oversold (< 30)
✓ Volume spike confirmed
✓ Score: 78/100 → STRONG BUY
System provides:
- Entry: Current price
- Stop Loss: 2 ATR below entry
- Take Profit: 2× risk distance above
- Position Size: Adjusted to 1% account risk
- Trailing Stop: Activates at 1R profit
```
### Scenario 2: Medium Buy with Divergence
```
Requirements met:
✓ MACD crosses above signal line
✓ 2/4 timeframes bullish (4H, 1H)
✓ Bullish divergence detected
✓ Price near support level
✓ Score: 62/100 → MEDIUM BUY
Considerations:
- Lower confidence → tighter risk management
- Use smaller position size
- Require additional confirmation
- Better as counter-trend entry
```
### Scenario 3: Ranging Market Filter
```
Market condition detected: RANGING
ADX < 20, sideways movement
System response:
- Reduces signal score by volatility adjustment
- May skip signals entirely
- Prioritizes higher confluence
- Warns of low trend probability
Best action: Wait for trending market
```
---
## Risk Management Deep Dive
### Stop Loss Calculation
```
Stop Loss Distance = ATR × ATR Multiplier (default 2.0)
Example:
- Current price: 1.0850
- ATR(14): 0.0045
- SL Distance: 0.0045 × 2.0 = 0.009
- BUY SL: 1.0850 - 0.009 = 1.0760
```
### Position Sizing
```
Position Size = (Account Risk % / Price Risk %)
Example:
- Risk per trade: 1% of account
- Stop distance: 0.009 on price of 1.0850
- Price risk: 0.009 / 1.0850 = 0.83%
- Position size: 1.0% / 0.83% = 1.2x (capped at 1.0x max)
```
### Trailing Stop Logic
```
Normal SL: 2 ATR below entry
Trigger Level: Entry + (Entry - SL) × Trail Activation (1.0R)
Trailing Mechanism:
- If price hits trigger, trailing SL activates
- SL moves up to: Close - 2 ATR
- SL never moves down, only up (for longs)
- Protects profits while allowing upside
```
### Drawdown Protection
```
Tracks:
- Peak equity reached
- Current drawdown from peak
- Maximum drawdown recorded
- Stops trading if max DD exceeded
Example:
- Peak: $10,000
- Current: $9,200
- Drawdown: 8%
- Max allowed: 10%
- Status: CONTINUE TRADING
```
---
## Dashboard Metrics Explained
### Market Section
- **Market Regime**: Current state (Trending/Ranging/Volatile/Normal)
- **ADX Value**: Trend strength indicator (0-100)
### Position Section
- **Current Position**: LONG, SHORT, or NONE
- **P&L**: Unrealized profit/loss percentage if in position
### Timeframe Section
- Individual 4H/1H/15M trend status
- **Alignment**: Percentage of bullish timeframes
### Risk Management Section
- **Stop Loss %**: Distance from current price
- **Take Profit %**: Target profit distance
- **Position Size**: Capital allocation multiplier
- **Risk %**: Per-trade risk percentage
### Performance Section
- **Win Rate**: % of winning trades (>60% is excellent)
- **Max DD**: Maximum drawdown experienced
- **Sharpe Ratio**: Risk-adjusted return metric
- **Profit Factor**: Ratio of profits to losses
### Indicators Section
- **RSI**: Momentum and overbought/oversold levels
- **Volume**: Current vs. average volume ratio
- **Divergence**: Active divergence detection
---
## Advanced Features
### Divergence Detection
```
Bullish Divergence:
- Price makes lower low
- MACD makes higher high
- Signals potential reversal UP
Bearish Divergence:
- Price makes higher high
- MACD makes lower low
- Signals potential reversal DOWN
Lookback: 20 bars (customizable)
```
### Support & Resistance
```
Method: Pivot High/Low detection
- Pivot Left/Right: 10 bars
- Dynamic S/R levels update as new pivots form
- Bonus score if entry near identified levels
```
### Performance Tracking
Real-time statistics calculated from:
- Win/loss signals
- Profit/loss per trade
- Consecutive losing trades
- Cumulative returns
- Standard deviation (Sharpe calculation)
Stores last 100 trades in memory for statistics.
---
## Input Parameters Explained
### MACD Settings
- **Fast EMA** (5-13): Lower = more responsive, more false signals
- **Slow EMA** (20-26): Higher = smoother, misses faster moves
- **Signal EMA** (5-9): Crossover sensitivity
### Risk Management
- **ATR Period** (default 14): Volatility measurement period
- **SL ATR Multiplier** (1.5-3.0): Stop loss tightness
- **Risk:Reward Ratio** (1-5): Profit target calculation
- **Trail Activation** (0.5-2.0): When to start trailing stop
- **Risk Per Trade** (0.1-5.0): Account risk percentage
- **Max Drawdown** (5-30%): Trading pause threshold
### Scoring Weights
Customize signal emphasis:
- **MTF Alignment** (35%): How important is multi-timeframe
- **Momentum** (25%): RSI and divergence weight
- **Volume** (20%): Volume confirmation priority
- **Volatility** (20%): Regime adjustment strength
### Advanced Filters
- **Check Divergence**: Enable/disable divergence scoring
- **Session Filter**: Restrict to specific hours
- **Min Volume Ratio**: Minimum volume for signal
### Display
- **Show Dashboard**: Main metrics table
- **Show Performance**: Trading statistics
- **Show S/R Levels**: Support/resistance visualization
---
## Best Practices
1. **Backtest Before Trading**: Test parameters on your preferred pairs
2. **Start with Strong Signals**: Use only 70+ scored signals initially
3. **Position Size**: Never risk more than 1-2% per trade
4. **Market Regime Awareness**: Skip ranging market entries
5. **Volume Confirmation**: Always check volume spikes
6. **Profit Taking**: Lock in profits at TP, don't let winners die
7. **Loss Management**: Honor stop losses, don't move them
8. **Performance Review**: Check metrics weekly, adjust if needed
---
## Trading Strategy Examples
### Conservative Strategy (Win-Rate Focus)
```
Settings:
- Signal Score Minimum: 70+ (Strong only)
- Risk Per Trade: 0.5%
- Risk:Reward: 3:1
- Position Size: 0.5x (smaller)
Targets:
- Win Rate > 65%
- Max DD < 5%
- Profit Factor > 2.0
```
### Aggressive Strategy (Profit Focus)
```
Settings:
- Signal Score Minimum: 50+ (Medium+)
- Risk Per Trade: 2%
- Risk:Reward: 1.5:1
- Position Size: 1.0x (maximum)
Targets:
- Win Rate > 55%
- Max DD < 10%
- Profit Factor > 1.5
```
### Trend Trading Strategy
```
Settings:
- Only trade when ADX > 25 (Trending)
- MTF Alignment: 3+ timeframes
- Use Trailing Stop: Yes
- Risk:Reward: 2.5:1
Focus on: Riding large moves
Best on: 4H timeframe
Pairs: Trending majors (EURUSD, GBPUSD)
```
### Divergence Trading Strategy
```
Settings:
- Signal Score Minimum: 60+
- Enable Divergence: Yes
- Volume Confirmation: Required
- Position Size: 0.75x
Focus on: Reversal entries
Best setup: Divergence at resistance/support
Risk management: Tight stops (1.5 ATR)
```
---
## Advantages
✓ Complete trading system, not just signals
✓ Built-in risk management and position sizing
✓ Real-time performance tracking
✓ Multi-timeframe confirmation reduces false signals
✓ Advanced filtering and divergence detection
✓ Market regime awareness
✓ Customizable scoring weights
✓ Professional dashboard display
✓ Support/resistance integration
✓ Trailing stop logic for profit protection
---
## Limitations
- Lagging indicator (uses confirmed bars)
- Works best on trending markets
- Not optimized for news/event trading
- Requires parameter optimization per pair
- Performance varies by timeframe
- Past performance doesn't guarantee future results
- Can produce whipsaw signals in ranging markets
---
## System Requirements
- TradingView Premium or higher (for advanced charting)
- Recommended: 4H or 1H timeframe
- Historical data: Minimum 100 bars
- Currency pairs: Works on all FX pairs, stocks, commodities
---
## Disclaimer
This indicator is provided for educational and informational purposes only. It is not financial advice and does not guarantee profits. Past performance does not predict future results.
**Important Notices:**
- Always use proper risk management
- Trade only with capital you can afford to lose
- Backtest thoroughly before live trading
- Combine with your own analysis
- Consider external market factors and news
- Monitor positions actively
- Keep emotional discipline
---
## Support & Optimization
For best results:
1. Test on your preferred instrument (6-12 months history)
2. Adjust MACD parameters to your timeframe
3. Optimize scoring weights to your style
4. Set risk management per your account size
5. Document your trade results and review weekly
6. Adapt parameters if performance degrades
This is a powerful system when used correctly. Respect the rules and let statistics work in your favor.

Luxy Momentum, Trend, Bias and Breakout Indicators V7
TABLE OF CONTENTS
This is Version 7 (V7) - the latest and most optimized release. If you are using any older versions (V6, V5, V4, V3, etc.), it is highly recommended to replace them with V7.
Why This Indicator is Different
Who Should Use This
Core Components Overview
The UT Bot Trading System
Understanding the Market Bias Table
Candlestick Pattern Recognition
Visual Tools and Features
How to Use the Indicator
Performance and Optimization
FAQ
---
### CREDITS & ATTRIBUTION
This indicator implements proven trading concepts using entirely original code developed specifically for this project.
### CONCEPTUAL FOUNDATIONS
• UT Bot ATR Trailing System
- Original concept by @QuantNomad: (search "UT-Bot-Strategy"
- Our version is a complete reimplementation with significant enhancements:
- Volume-weighted momentum adjustment
- Composite stop loss from multiple S/R layers
- Multi-filter confirmation system (swing, %, 2-bar, ZLSMA)
- Full integration with multi-timeframe bias table
- Visual audit trail with freeze-on-touch
- NOTE: No code was copied - this is a complete reimplementation with enhancements.
• Standard Technical Indicators (Public Domain Formulas):
- Supertrend: ATR-based trend calculation with custom gradient fills
- MACD: Gerald Appel's formula with separation filters
- RSI: J. Welles Wilder's formula with pullback zone logic
- ADX/DMI: Custom trend strength formula inspired by Wilder's directional movement concept, reimplemented with volume weighting and efficiency metrics
- ZLSMA: Zero-lag formula enhanced with Hull MA and momentum prediction
### Custom Implementations
- Trend Strength: Inspired by Wilder's ADX concept but using volume-weighted pressure calculation and efficiency metrics (not traditional +DI/-DI smoothing)
- All code implementations are original
### ORIGINAL FEATURES (70%+ of codebase)
- Multi-Timeframe Bias Table with live updates
- Risk Management System (R-multiple TPs, freeze-on-touch)
- Opening Range Breakout tracker with session management
- Composite Stop Loss calculator using 6+ S/R layers
- Performance optimization system (caching, conditional calcs)
- VIX Fear Index integration
- Previous Day High/Low auto-detection
- Candlestick pattern recognition with interactive tooltips
- Smart label and visual management
- All UI/UX design and table architecture
### DEVELOPMENT PROCESS
**AI Assistance:** This indicator was developed over 2+ months with AI assistance (ChatGPT/Claude) used for:
- Writing Pine Script code based on design specifications
- Optimizing performance and fixing bugs
- Ensuring Pine Script v6 compliance
- Generating documentation
**Author's Role:** All trading concepts, system design, feature selection, integration logic, and strategic decisions are original work by the author. The AI was a coding tool, not the system designer.
**Transparency:** We believe in full disclosure - this project demonstrates how AI can be used as a powerful development tool while maintaining creative and strategic ownership.
---
1. WHY THIS INDICATOR IS DIFFERENT
Most traders use multiple separate indicators on their charts, leading to cluttered screens, conflicting signals, and analysis paralysis. The Suite solves this by integrating proven technical tools into a single, cohesive system.
Key Advantages:
All-in-One Design: Instead of loading 5-10 separate indicators, you get everything in one optimized script. This reduces chart clutter and improves TradingView performance.
Multi-Timeframe Bias Table: Unlike standard indicators that only show the current timeframe, the Bias Table aggregates trend signals across multiple timeframes simultaneously. See at a glance whether 1m, 5m, 15m, 1h are aligned bullish or bearish - no more switching between charts.
Smart Confirmations: The indicator doesn't just give signals - it shows you WHY. Every entry has multiple layers of confirmation (MA cross, MACD momentum, ADX strength, RSI pullback, volume, etc.) that you can toggle on/off.
Dynamic Stop Loss System: Instead of static ATR stops, the SL is calculated from multiple support/resistance layers: UT trailing line, Supertrend, VWAP, swing structure, and MA levels. This creates more intelligent, price-action-aware stops.
R-Multiple Take Profits: Built-in TP system calculates targets based on your initial risk (1R, 1.5R, 2R, 3R). Lines freeze when touched with visual checkmarks, giving you a clean audit trail of partial exits.
Educational Tooltips Everywhere: Every single input has detailed tooltips explaining what it does, typical values, and how it impacts trading. You're not guessing - you're learning as you configure.
Performance Optimized: Smart caching, conditional calculations, and modular design mean the indicator runs fast despite having 15+ features. Turn off what you don't use for even better performance.
No Repainting: All signals respect bar close. Alerts fire correctly. What you see in history is what you would have gotten in real-time.
What Makes It Unique:
Integrated UT Bot + Bias Table: No other indicator combines UT Bot's ATR trailing system with a live multi-timeframe dashboard. You get precision entries with macro trend context.
Candlestick Pattern Recognition with Interactive Tooltips: Patterns aren't just marked - hover over any emoji for a full explanation of what the pattern means and how to trade it.
Opening Range Breakout Tracker: Built-in ORB system for intraday traders with customizable session times and real-time status updates in the Bias Table.
Previous Day High/Low Auto-Detection: Automatically plots PDH/PDL on intraday charts with theme-aware colors. Updates daily without manual input.
Dynamic Row Labels in Bias Table: The table shows your actual settings (e.g., "EMA 10 > SMA 20") not generic labels. You know exactly what's being evaluated.
Modular Filter System: Instead of forcing a fixed methodology, the indicator lets you build your own strategy. Start with just UT Bot, add filters one at a time, test what works for your style.
---
2. WHO WHOULD USE THIS
Designed For:
Intermediate to Advanced Traders: You understand basic technical analysis (MAs, RSI, MACD) and want to combine multiple confirmations efficiently. This isn't a "one-click profit" system - it's a professional toolkit.
Multi-Timeframe Traders: If you trade one asset but check multiple timeframes for confirmation (e.g., enter on 5m after checking 15m and 1h alignment), the Bias Table will save you hours every week.
Trend Followers: The indicator excels at identifying and following trends using UT Bot, Supertrend, and MA systems. If you trade breakouts and pullbacks in trending markets, this is built for you.
Intraday and Swing Traders: Works equally well on 5m-1h charts (day trading) and 4h-D charts (swing trading). Scalpers can use it too with appropriate settings adjustments.
Discretionary Traders: This isn't a black-box system. You see all the components, understand the logic, and make final decisions. Perfect for traders who want tools, not automation.
Works Across All Markets:
Stocks (US, international)
Cryptocurrency (24/7 markets supported)
Forex pairs
Indices (SPY, QQQ, etc.)
Commodities
NOT Ideal For :
Complete Beginners: If you don't know what a moving average or RSI is, start with basics first. This indicator assumes foundational knowledge.
Algo Traders Seeking Black Box: This is discretionary. Signals require context and confirmation. Not suitable for blind automated execution.
Mean-Reversion Only Traders: The indicator is trend-following at its core. While VWAP bands support mean-reversion, the primary methodology is trend continuation.
---
3. CORE COMPONENTS OVERVIEW
The indicator combines these proven systems:
Trend Analysis:
Moving Averages: Four customizable MAs (Fast, Medium, Medium-Long, Long) with six types to choose from (EMA, SMA, WMA, VWMA, RMA, HMA). Mix and match for your style.
Supertrend: ATR-based trend indicator with unique gradient fill showing trend strength. One-sided ribbon visualization makes it easier to see momentum building or fading.
ZLSMA : Zero-lag linear-regression smoothed moving average. Reduces lag compared to traditional MAs while maintaining smooth curves.
Momentum & Filters:
MACD: Standard MACD with separation filter to avoid weak crossovers.
RSI: Pullback zone detection - only enter longs when RSI is in your defined "buy zone" and shorts in "sell zone".
ADX/DMI: Trend strength measurement with directional filter. Ensures you only trade when there's actual momentum.
Volume Filter: Relative volume confirmation - require above-average volume for entries.
Donchian Breakout: Optional channel breakout requirement.
Signal Systems:
UT Bot: The primary signal generator. ATR trailing stop that adapts to volatility and gives clear entry/exit points.
Base Signals: MA cross system with all the above filters applied. More conservative than UT Bot alone.
Market Bias Table: Multi-timeframe dashboard showing trend alignment across 7 timeframes plus macro bias (3-day, weekly, monthly, quarterly, VIX).
Candlestick Patterns: Six major reversal patterns auto-detected with interactive tooltips.
ORB Tracker: Opening range high/low with breakout status (intraday only).
PDH/PDL: Previous day levels plotted automatically on intraday charts.
VWAP + Bands : Session-anchored VWAP with up to three standard deviation band pairs.
---
4. THE UT BOT TRADING SYSTEM
The UT Bot is the heart of the indicator's signal generation. It's an advanced ATR trailing stop that adapts to market volatility.
Why UT Bot is Superior to Fixed Stops:
Traditional ATR stops use a fixed multiplier (e.g., "stop = entry - 2×ATR"). UT Bot is smarter:
It TRAILS the stop as price moves in your favor
It WIDENS during high volatility to avoid premature stops
It TIGHTENS during consolidation to lock in profits
It FLIPS when price breaks the trailing line, signaling reversals
Visual Elements You'll See:
Orange Trailing Line: The actual UT stop level that adapts bar-by-bar
Buy/Sell Labels: Aqua triangle (long) or orange triangle (short) when the line flips
ENTRY Line: Horizontal line at your entry price (optional, can be turned off)
Suggested Stop Loss: A composite SL calculated from multiple support/resistance layers:
- UT trailing line
- Supertrend level
- VWAP
- Swing structure (recent lows/highs)
- Long-term MA (200)
- ATR-based floor
Take Profit Lines: TP1, TP1.5, TP2, TP3 based on R-multiples. When price touches a TP, it's marked with a checkmark and the line freezes for audit trail purposes.
Status Messages: "SL Touched ❌" or "SL Frozen" when the trade leg completes.
How UT Bot Differs from Other ATR Systems:
Multiple Filters Available: You can require 2-bar confirmation, minimum % price change, swing structure alignment, or ZLSMA directional filter. Most UT implementations have none of these.
Smart SL Calculation: Instead of just using the UT line as your stop, the indicator suggests a better SL based on actual support/resistance. This prevents getting stopped out by wicks while keeping risk controlled.
Visual Audit Trail: All SL/TP lines freeze when touched with clear markers. You can review your trades weeks later and see exactly where entries, stops, and targets were.
Performance Options: "Draw UT visuals only on bar close" lets you reduce rendering load without affecting logic or alerts - critical for slower machines or 1m charts.
Trading Logic:
UT Bot flips direction (Buy or Sell signal appears)
Check Bias Table for multi-timeframe confirmation
Optional: Wait for Base signal or candlestick pattern
Enter at signal bar close or next bar open
Place stop at "Suggested Stop Loss" line
Scale out at TP levels (TP1, TP2, TP3)
Exit remaining position on opposite UT signal or stop hit
---
5. UNDERSTANDING THE MARKET BIAS TABLE
This is the indicator's unique multi-timeframe intelligence layer. Instead of looking at one chart at a time, the table aggregates signals across seven timeframes plus macro trend bias.
Why Multi-Timeframe Analysis Matters:
Professional traders check higher and lower timeframes for context:
Is the 1h uptrend aligning with my 5m entry?
Are all short-term timeframes bullish or just one?
Is the daily trend supportive or fighting me?
Doing this manually means opening multiple charts, checking each indicator, and making mental notes. The Bias Table does it automatically in one glance.
Table Structure:
Header Row:
On intraday charts: 1m, 5m, 15m, 30m, 1h, 2h, 4h (toggle which ones you want)
On daily+ charts: D, W, M (automatic)
Green dot next to title = live updating
Headline Rows - Macro Bias:
These show broad market direction over longer periods:
3 Day Bias: Trend over last 3 trading sessions (uses 1h data)
Weekly Bias: Trend over last 5 trading sessions (uses 4h data)
Monthly Bias: Trend over last 30 daily bars
Quarterly Bias: Trend over last 13 weekly bars
VIX Fear Index: Market regime based on VIX level - bullish when low, bearish when high
Opening Range Breakout: Status of price vs. session open range (intraday only)
These rows show text: "BULLISH", "BEARISH", or "NEUTRAL"
Indicator Rows - Technical Signals:
These evaluate your configured indicators across all active timeframes:
Fast MA > Medium MA (shows your actual MA settings, e.g., "EMA 10 > SMA 20")
Price > Long MA (e.g., "Price > SMA 200")
Price > VWAP
MACD > Signal
Supertrend (up/down/neutral)
ZLSMA Rising
RSI In Zone
ADX ≥ Minimum
These rows show emojis: GREEB (bullish), RED (bearish), GRAY/YELLOW (neutral/NA)
AVG Column:
Shows percentage of active timeframes that are bullish for that row. This is the KEY metric:
AVG > 70% = strong multi-timeframe bullish alignment
AVG 40-60% = mixed/choppy, no clear trend
AVG < 30% = strong multi-timeframe bearish alignment
How to Use the Table:
For a long trade:
Check AVG column - want to see > 60% ideally
Check headline bias rows - want to see BULLISH, not BEARISH
Check VIX row - bullish market regime preferred
Check ORB row (intraday) - want ABOVE for longs
Scan indicator rows - more green = better confirmation
For a short trade:
Check AVG column - want to see < 40% ideally
Check headline bias rows - want to see BEARISH, not BULLISH
Check VIX row - bearish market regime preferred
Check ORB row (intraday) - want BELOW for shorts
Scan indicator rows - more red = better confirmation
When AVG is 40-60%:
Market is choppy, mixed signals. Either stay out or reduce position size significantly. These are low-probability environments.
Unique Features:
Dynamic Labels: Row names show your actual settings (e.g., "EMA 10 > SMA 20" not generic "Fast > Slow"). You know exactly what's being evaluated.
Customizable Rows: Turn off rows you don't care about. Only show what matters to your strategy.
Customizable Timeframes: On intraday charts, disable 1m or 4h if you don't trade them. Reduces calculation load by 20-40%.
Automatic HTF Handling: On Daily/Weekly/Monthly charts, the table automatically switches to D/W/M columns. No configuration needed.
Performance Smart: "Hide BIAS table on 1D or above" option completely skips all table calculations on higher timeframes if you only trade intraday.
---
6. CANDLESTICK PATTERN RECOGNITION
The indicator automatically detects six major reversal patterns and marks them with emojis at the relevant bars.
Why These Six Patterns:
These are the most statistically significant reversal patterns according to trading literature:
High win rate when appearing at support/resistance
Clear visual structure (not subjective)
Work across all timeframes and assets
Studied extensively by institutions
The Patterns:
Bullish Patterns (appear at bottoms):
Bullish Engulfing: Green candle completely engulfs prior red candle's body. Strong reversal signal.
Hammer: Small body with long lower wick (at least 2× body size). Shows rejection of lower prices by buyers.
Morning Star: Three-candle pattern (large red → small indecision → large green). Very strong bottom reversal.
Bearish Patterns (appear at tops):
Bearish Engulfing: Red candle completely engulfs prior green candle's body. Strong reversal signal.
Shooting Star: Small body with long upper wick (at least 2× body size). Shows rejection of higher prices by sellers.
Evening Star: Three-candle pattern (large green → small indecision → large red). Very strong top reversal.
Interactive Tooltips:
Unlike most pattern indicators that just draw shapes, this one is educational:
Hover your mouse over any pattern emoji
A tooltip appears explaining: what the pattern is, what it means, when it's most reliable, and how to trade it
No need to memorize - learn as you trade
Noise Filter:
"Min candle body % to filter noise" setting prevents false signals:
Patterns require minimum body size relative to price
Filters out tiny candles that don't represent real buying/selling pressure
Adjust based on asset volatility (higher % for crypto, lower for low-volatility stocks)
How to Trade Patterns:
Patterns are NOT standalone entry signals. Use them as:
Confirmation: UT Bot gives signal + pattern appears = stronger entry
Reversal Warning: In a trade, opposite pattern appears = consider tightening stop or taking profit
Support/Resistance Validation: Pattern at key level (PDH, VWAP, MA 200) = level is being respected
Best combined with:
UT Bot or Base signal in same direction
Bias Table alignment (AVG > 60% or < 40%)
Appearance at obvious support/resistance
---
7. VISUAL TOOLS AND FEATURES
VWAP (Volume Weighted Average Price):
Session-anchored VWAP with standard deviation bands. Shows institutional "fair value" for the trading session.
Anchor Options: Session, Day, Week, Month, Quarter, Year. Choose based on your trading timeframe.
Bands: Up to three pairs (X1, X2, X3) showing statistical deviation. Price at outer bands often reverses.
Auto-Hide on HTF: VWAP hides on Daily/Weekly/Monthly charts automatically unless you enable anchored mode.
Use VWAP as:
Directional bias (above = bullish, below = bearish)
Mean reversion levels (outer bands)
Support/resistance (the VWAP line itself)
Previous Day High/Low:
Automatically plots yesterday's high and low on intraday charts:
Updates at start of each new trading day
Theme-aware colors (dark text for light charts, light text for dark charts)
Hidden automatically on Daily/Weekly/Monthly charts
These levels are critical for intraday traders - institutions watch them closely as support/resistance.
Opening Range Breakout (ORB):
Tracks the high/low of the first 5, 15, 30, or 60 minutes of the trading session:
Customizable session times (preset for NYSE, LSE, TSE, or custom)
Shows current breakout status in Bias Table row (ABOVE, BELOW, INSIDE, BUILDING)
Intraday only - auto-disabled on Daily+ charts
ORB is a classic day trading strategy - breakout above opening range often leads to continuation.
Extra Labels:
Change from Open %: Shows how far price has moved from session open (intraday) or daily open (HTF). Green if positive, red if negative.
ADX Badge: Small label at bottom of last bar showing current ADX value. Green when above your minimum threshold, red when below.
RSI Badge: Small label at top of last bar showing current RSI value with zone status (buy zone, sell zone, or neutral).
These labels provide quick at-a-glance confirmation without needing separate indicator windows.
---
8. HOW TO USE THE INDICATOR
Step 1: Add to Chart
Load the indicator on your chosen asset and timeframe
First time: Everything is enabled by default - the chart will look busy
Don't panic - you'll turn off what you don't need
Step 2: Start Simple
Turn OFF everything except:
UT Bot labels (keep these ON)
Bias Table (keep this ON)
Moving Averages (Fast and Medium only)
Suggested Stop Loss and Take Profits
Hide everything else initially. Get comfortable with the basic UT Bot + Bias Table workflow first.
Step 3: Learn the Core Workflow
UT Bot gives a Buy or Sell signal
Check Bias Table AVG column - do you have multi-timeframe alignment?
If yes, enter the trade
Place stop at Suggested Stop Loss line
Scale out at TP levels
Exit on opposite UT signal
Trade this simple system for a week. Get a feel for signal frequency and win rate with your settings.
Step 4: Add Filters Gradually
If you're getting too many losing signals (whipsaws in choppy markets), add filters one at a time:
Try: "Require 2-Bar Trend Confirmation" - wait for 2 bars to confirm direction
Try: ADX filter with minimum threshold - only trade when trend strength is sufficient
Try: RSI pullback filter - only enter on pullbacks, not chasing
Try: Volume filter - require above-average volume
Add one filter, test for a week, evaluate. Repeat.
Step 5: Enable Advanced Features (Optional)
Once you're profitable with the core system, add:
Supertrend for additional trend confirmation
Candlestick patterns for reversal warnings
VWAP for institutional anchor reference
ORB for intraday breakout context
ZLSMA for low-lag trend following
Step 6: Optimize Settings
Every setting has a detailed tooltip explaining what it does and typical values. Hover over any input to read:
What the parameter controls
How it impacts trading
Suggested ranges for scalping, day trading, and swing trading
Start with defaults, then adjust based on your results and style.
Step 7: Set Up Alerts
Right-click chart → Add Alert → Condition: "Luxy Momentum v6" → Choose:
"UT Bot — Buy" for long entries
"UT Bot — Sell" for short entries
"Base Long/Short" for filtered MA cross signals
Optionally enable "Send real-time alert() on UT flip" in settings for immediate notifications.
Common Workflow Variations:
Conservative Trader:
UT signal + Base signal + Candlestick pattern + Bias AVG > 70%
Enter only at major support/resistance
Wider UT sensitivity, multiple filters
Aggressive Trader:
UT signal + Bias AVG > 60%
Enter immediately, no waiting
Tighter UT sensitivity, minimal filters
Swing Trader:
Focus on Daily/Weekly Bias alignment
Ignore intraday noise
Use ORB and PDH/PDL less (or not at all)
Wider stops, patient approach
---
9. PERFORMANCE AND OPTIMIZATION
The indicator is optimized for speed, but with 15+ features running simultaneously, chart load time can add up. Here's how to keep it fast:
Biggest Performance Gains:
Disable Unused Timeframes: In "Time Frames" settings, turn OFF any timeframe you don't actively trade. Each disabled TF saves 10-15% calculation time. If you only day trade 5m, 15m, 1h, disable 1m, 2h, 4h.
Hide Bias Table on Daily+: If you only trade intraday, enable "Hide BIAS table on 1D or above". This skips ALL table calculations on higher timeframes.
Draw UT Visuals Only on Bar Close: Reduces intrabar rendering of SL/TP/Entry lines. Has ZERO impact on logic or alerts - purely visual optimization.
Additional Optimizations:
Turn off VWAP bands if you don't use them
Disable candlestick patterns if you don't trade them
Turn off Supertrend fill if you find it distracting (keep the line)
Reduce "Limit to 10 bars" for SL/TP lines to minimize line objects
Performance Features Built-In:
Smart Caching: Higher timeframe data (3-day bias, weekly bias, etc.) updates once per day, not every bar
Conditional Calculations: Volume filter only calculates when enabled. Swing filter only runs when enabled. Nothing computes if turned off.
Modular Design: Every component is independent. Turn off what you don't need without breaking other features.
Typical Load Times:
5m chart, all features ON, 7 timeframes: ~2-3 seconds
5m chart, core features only, 3 timeframes: ~1 second
1m chart, all features: ~4-5 seconds (many bars to calculate)
If loading takes longer, you likely have too many indicators on the chart total (not just this one).
---
10. FAQ
Q: How is this different from standard UT Bot indicators?
A: Standard UT Bot (originally by @QuantNomad) is just the ATR trailing line and flip signals. This implementation adds:
- Volume weighting and momentum adjustment to the trailing calculation
- Multiple confirmation filters (swing, %, 2-bar, ZLSMA)
- Smart composite stop loss system from multiple S/R layers
- R-multiple take profit system with freeze-on-touch
- Integration with multi-timeframe Bias Table
- Visual audit trail with checkmarks
Q: Can I use this for automated trading?
A: The indicator is designed for discretionary trading. While it has clear signals and alerts, it's not a mechanical system. Context and judgment are required.
Q: Does it repaint?
A: No. All signals respect bar close. UT Bot logic runs intrabar but signals only trigger on confirmed bars. Alerts fire correctly with no lookahead.
Q: Do I need to use all the features?
A: Absolutely not. The indicator is modular. Many profitable traders use just UT Bot + Bias Table + Moving Averages. Start simple, add complexity only if needed.
Q: How do I know which settings to use?
A: Every single input has a detailed tooltip. Hover over any setting to see:
What it does
How it affects trading
Typical values for scalping, day trading, swing trading
Start with defaults, adjust gradually based on results.
Q: Can I use this on crypto 24/7 markets?
A: Yes. ORB will not work (no defined session), but everything else functions normally. Use "Day" anchor for VWAP instead of "Session".
Q: The Bias Table is blank or not showing.
A: Check:
"Show Table" is ON
Table position isn't overlapping another indicator's table (change position)
At least one row is enabled
"Hide BIAS table on 1D or above" is OFF (if on Daily+ chart)
Q: Why are candlestick patterns not appearing?
A: Patterns are relatively rare by design - they only appear at genuine reversal points. Check:
Pattern toggles are ON
"Min candle body %" isn't too high (try 0.05-0.10)
You're looking at a chart with actual reversals (not strong trending market)
Q: UT Bot is too sensitive/not sensitive enough.
A: Adjust "Sensitivity (Key×ATR)". Lower number = tighter stop, more signals. Higher number = wider stop, fewer signals. Read the tooltip for guidance.
Q: Can I get alerts for the Bias Table?
A: The Bias Table is a dashboard for visual analysis, not a signal generator. Set alerts on UT Bot or Base signals, then manually check Bias Table for confirmation.
Q: Does this work on stocks with low volume?
A: Yes, but turn OFF the volume filter. Low volume stocks will never meet relative volume requirements.
Q: How often should I check the Bias Table?
A: Before every entry. It takes 2 seconds to glance at the AVG column and headline rows. This one check can save you from fighting the trend.
Q: What if UT signal and Base signal disagree?
A: UT Bot is more aggressive (ATR trailing). Base signals are more conservative (MA cross + filters). If they disagree, either:
Wait for both to align (safest)
Take the UT signal but with smaller size (aggressive)
Skip the trade (conservative)
There's no "right" answer - depends on your risk tolerance.
---
FINAL NOTES
The indicator gives you an edge. How you use that edge determines results.
For questions, feedback, or support, comment on the indicator page or message the author.
Happy Trading!

Institutional Activity DetectorInstitutional Activity Detector - Complete Tutorial
Table of Contents
Installation
Understanding the Indicator
Signal Interpretation
Settings Configuration
Trading Strategies
Best Practices
Common Mistakes to Avoid
1. Installation {#installation}
Step-by-Step Setup:
Step 1: Access TradingView
Go to TradingView.com
Log in to your account (free account works fine)
Step 2: Open Pine Editor
Click on "Pine Editor" at the bottom of the chart
If you don't see it, go to the top menu and select "Pine Editor"
Step 3: Add the Script
Click "New" to create a new indicator
Delete any default code
Copy the entire Institutional Activity Detector code
Paste it into the editor
Step 4: Save and Apply
Click "Save" (give it a name like "Inst Detector")
Click "Add to Chart"
The indicator will now appear on your chart
2. Understanding the Indicator {#understanding}
What It Detects:
This indicator identifies institutional traders (banks, hedge funds, market makers) by analyzing:
Volume Analysis
Detects unusual volume spikes that indicate large players entering
Compares current volume to 20-period average
Institutional trades create volume 2-5x normal levels
Order Flow
Delta: Difference between buying and selling volume
Positive delta = More buying pressure
Negative delta = More selling pressure
Institutions leave "footprints" in order flow
Price Action Patterns
Bullish Rejection Wicks:
| <- Small upper wick
|
███ <- Small body
███
|
|
| <- Large lower wick (rejection)
Indicates institutions bought aggressively at lower prices
Bearish Rejection Wicks:
|
|
| <- Large upper wick (rejection)
|
███ <- Small body
███
| <- Small lower wick
Indicates institutions sold aggressively at higher prices
Liquidity Grabs
Institutions often:
Push price above resistance or below support
Trigger stop losses (grab liquidity)
Reverse direction and trade the other way
Dark Pool Activity
Large block trades executed off-exchange:
High volume with minimal price movement
Indicates institutional accumulation/distribution without moving price
3. Signal Interpretation {#signals}
Signal Types:
🟢 INSTITUTIONAL BUY Signal
Appears as green triangle below candle with strength number (2-5)
What it means:
Institutions are actively accumulating (buying)
Higher strength = More confirmation factors
Strength Levels:
2-3: Moderate confidence - Wait for confirmation
4: High confidence - Strong institutional interest
5: Maximum confidence - Multiple factors aligned
🔴 INSTITUTIONAL SELL Signal
Appears as red triangle above candle with strength number (2-5)
What it means:
Institutions are actively distributing (selling)
Higher strength = More confirmation factors
🟠 Dark Pool (DP) Marker
Small orange diamond
What it means:
Large block trade executed
Accumulation/distribution happening quietly
Often precedes significant moves
Liquidity Zones
Red boxes above price = Resistance/sell liquidity
Green boxes below price = Support/buy liquidity
Institutions target these zones to trigger stops
4. Settings Configuration {#settings}
Recommended Settings by Asset Type:
For Stocks (SPY, AAPL, TSLA):
Volume Spike Multiplier: 2.0
Volume Average Period: 20
Delta Threshold: 70%
Minimum Signal Strength: 3
Timeframe: 5m, 15m, 1H
For Forex (EUR/USD, GBP/USD):
Volume Spike Multiplier: 1.5
Volume Average Period: 30
Delta Threshold: 65%
Minimum Signal Strength: 3
Timeframe: 15m, 1H, 4H
For Crypto (BTC, ETH):
Volume Spike Multiplier: 2.5
Volume Average Period: 20
Delta Threshold: 70%
Minimum Signal Strength: 4
Timeframe: 15m, 1H, 4H
For Futures (ES, NQ):
Volume Spike Multiplier: 2.0
Volume Average Period: 20
Delta Threshold: 75%
Minimum Signal Strength: 3
Timeframe: 5m, 15m, 30m
Parameter Explanations:
Volume Spike Multiplier (1.0 - 10.0)
Lower = More sensitive (more signals, some false)
Higher = Less sensitive (fewer signals, more reliable)
Start with 2.0 and adjust based on your asset's volatility
Delta Threshold % (50 - 100)
Measures buying vs selling pressure
70% = Strong institutional bias required
Lower for ranging markets, higher for trending
Minimum Signal Strength (2 - 5)
Number of factors that must align for a signal
2 = Very sensitive (many signals)
5 = Very conservative (rare signals)
Recommended: 3-4 for balance
5. Trading Strategies {#strategies}
Strategy 1: Liquidity Grab Reversal
Setup:
Price approaches a liquidity zone (green/red box)
Price penetrates the zone briefly
Institutional BUY/SELL signal appears
Price reverses away from the zone
Entry:
Enter on the signal candle close
Or wait for next candle confirmation
Stop Loss:
Below the liquidity grab low (for buys)
Above the liquidity grab high (for sells)
Take Profit:
2:1 or 3:1 risk/reward ratio
Or next opposing liquidity zone
Example:
Price drops below support → Triggers stops →
Institutional BUY signal (4-5 strength) →
Enter LONG → Price rallies
Strategy 2: Trend Continuation
Setup:
Identify the trend (higher highs/higher lows for uptrend)
Wait for pullback to support in uptrend
Institutional BUY signal appears during pullback
Confirms institutions are adding to positions
Entry:
Enter on signal with strength ≥ 4
Or next candle after signal
Stop Loss:
Below the pullback low + small buffer
Take Profit:
Previous swing high
Or trailing stop using ATR
Strategy 3: Dark Pool Accumulation
Setup:
Dark Pool (DP) markers appear multiple times
Price consolidates in tight range
Institutional BUY signal with high strength appears
Breakout occurs
Entry:
Enter on breakout candle after signal
Or on retest of breakout level
Stop Loss:
Below consolidation range
Take Profit:
Measured move (height of consolidation projected)
Strategy 4: Divergence Play
Setup:
Price makes lower low
MFI/RSI makes higher low (bullish divergence)
Institutional BUY signal appears
Volume confirms with spike
Entry:
Enter on signal candle or next
Stop Loss:
Below the divergence low
Take Profit:
Previous swing high or resistance
6. Best Practices {#best-practices}
✅ DO's:
1. Use Multiple Timeframes
Check higher timeframe for trend direction
Trade signals that align with higher timeframe
Example: 15m signals in direction of 1H trend
2. Combine with Key Levels
Support/resistance
Supply/demand zones
Previous day high/low
Round numbers (psychological levels)
3. Wait for Confirmation
Don't rush into trades
Let the signal candle close
Watch next candle for follow-through
4. Check the Metrics Table
Look at Relative Volume (should be >2.0)
Check Delta % (should be strong positive/negative)
Verify Order Flow aligns with signal
5. Consider Market Context
News events can override signals
Low liquidity times (lunch, overnight) less reliable
Major economic releases need caution
6. Paper Trade First
Test the indicator for 2-4 weeks
Learn how it behaves on your chosen assets
Develop confidence before using real money
Best Times to Trade:
Stock Market Hours:
9:30-11:30 AM EST (high volume, strong moves)
2:00-4:00 PM EST (institutional positioning)
Avoid: 11:30 AM-2:00 PM (lunch, low volume)
Forex:
London Open: 3:00-6:00 AM EST
New York Open: 8:00-11:00 AM EST
London/NY Overlap: 8:00 AM-12:00 PM EST
Crypto:
24/7 market, but highest volume during US/European hours
Watch for weekend low liquidity
7. Common Mistakes to Avoid {#mistakes}
❌ DON'T:
1. Trade Every Signal
Not all signals are equal
Focus on strength 4-5 signals
Wait for optimal setups
2. Ignore Market Structure
Don't buy into strong downtrends (catch falling knife)
Don't sell into strong uptrends (fight the tape)
Respect major support/resistance
3. Use Too Small Timeframes
1m and 2m charts are too noisy
Minimum recommended: 5m for scalping
Better: 15m, 30m, 1H for reliability
4. Overtrade
Quality over quantity
2-5 good trades per day is excellent
Forcing trades leads to losses
5. Ignore Risk Management
Always use stop losses
Risk only 1-2% per trade
Don't revenge trade after losses
6. Trade During Low Volume
Signals less reliable with low volume
Check Relative Volume metric (should be >1.5)
Avoid pre-market/after-hours for stocks
7. Misread Liquidity Grabs
Not every wick is a liquidity grab
Need volume confirmation
Must have institutional signal
Advanced Tips:
Filtering False Signals:
Use Signal Strength Filter:
Minimum strength 3 = Balanced
Minimum strength 4 = Conservative (recommended)
Minimum strength 5 = Ultra conservative
Confluence Checklist:
Signal strength ≥ 4
Relative volume > 2.0
At key support/resistance
Aligns with higher timeframe trend
Delta % strongly positive/negative
Clean price action setup
If 4+ boxes checked = High probability trade
Setting Up Alerts:
Click the three dots on the indicator
Select "Create Alert"
Choose condition:
"Institutional Buy Signal"
"Institutional Sell Signal"
"Dark Pool Activity"
Set up notification (email, SMS, app)
Save alert
Alert Strategy:
Set minimum strength to 4 for fewer, better alerts
Use for assets you can't watch constantly
Don't rely solely on alerts - check chart context
Practice Exercise:
Week 1-2: Observation
Add indicator to your favorite assets
Watch how signals develop
Note which ones lead to profitable moves
Don't trade yet - just observe
Week 3-4: Paper Trading
Use TradingView's paper trading
Trade only strength 4-5 signals
Record results in a journal
Note: entry, exit, profit/loss, what worked/didn't
Week 5+: Small Live Positions
Start with smallest position size
Trade only your best setups
Gradually increase size as you gain confidence
Keep detailed journal
Quick Reference Card:
Signal Quality Ranking:
🔥 Best Setups (Take These):
Strength 5 + Liquidity grab + Key level
Strength 4-5 + Volume >3.0 + Trend alignment
Dark Pool markers + Strength 4+ signal
✅ Good Setups:
Strength 4 at support/resistance
Strength 3-4 with strong delta
Liquidity grab + Strength 3+
⚠️ Caution (Wait for More):
Strength 2-3 in middle of nowhere
Against higher timeframe trend
Low volume (Rel Vol <1.5)
❌ Avoid:
Strength 2 only
During major news
Low liquidity hours
Against strong trend
Troubleshooting:
"Too many signals"
→ Increase Minimum Signal Strength to 4
→ Increase Volume Spike Multiplier to 2.5-3.0
"Too few signals"
→ Decrease Minimum Signal Strength to 2-3
→ Decrease Volume Spike Multiplier to 1.5
"Signals not working"
→ Check if you're trading during low volume hours
→ Verify you're using recommended timeframes
→ Make sure signals align with market structure
"Can't see liquidity zones"
→ Enable "Show Liquidity Zones" in settings
→ Adjust Swing Detection Length (try 7-15)
Resources for Further Learning:
Concepts to Study:
Order Flow Trading
Market Profile / Volume Profile
Smart Money Concepts (SMC)
Liquidity Sweeps and Stop Hunts
Institutional Order Flow
Wyckoff Method
Volume Spread Analysis (VSA)
Recommended Practice:
Study past signals on chart
Replay market using TradingView's bar replay feature
Join trading communities to share setups
Keep a detailed trading journal
Final Thoughts:
This indicator is a tool, not a crystal ball. It identifies high-probability setups where institutions are active, but still requires:
Proper risk management
Market context understanding
Patience and discipline
Continuous learning
Success Formula:
Right Tool + Proper Training + Risk Management + Discipline = Consistent Profits
Start slow, master the basics, and gradually increase complexity as you gain experience.
Good luck and trade smart! 📊📈
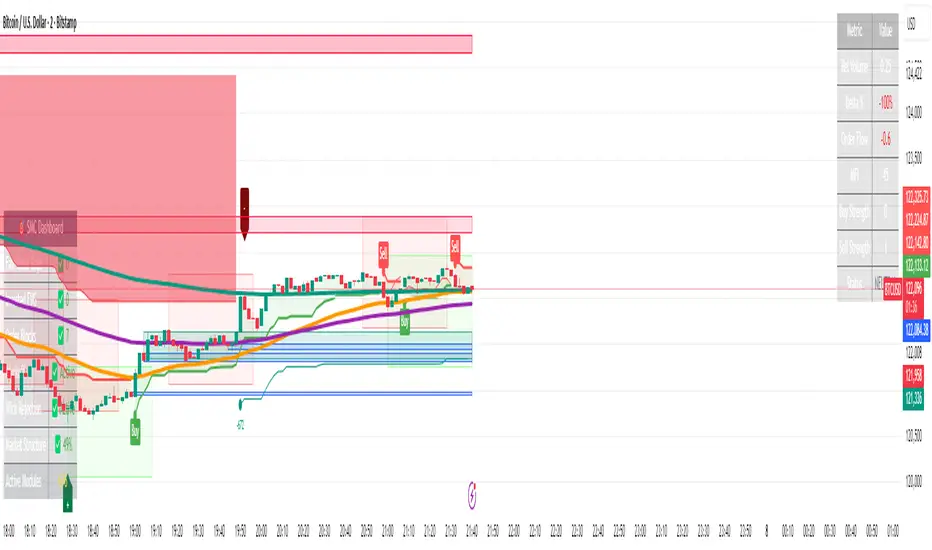
Crypto Scanner
🚀 Crypto Scanner: Intelligent TradingView Indicator & Screener for Crypto Trading
Description: Discover the Crypto indicator & screener, an Intelligent TradingView indicator for spotting reversals in the top 50 cryptos. Spot Bitcoin & altcoin reversals with real-time buy/sell signals, alerts & strategies for day trading, scalping & swing trading.
________________________________________
🔥 Catch Crypto Reversals with the Crypto Scanner
Looking for the perfect crypto trade setup? The Crypto Scanner, a leading TradingView indicator and screener, helps traders catch bullish and bearish reversals across the top 50 cryptocurrencies (Bitcoin, Ethereum, Solana, XRP, Binance Coin, and more). Unlike lagging tools such as moving averages, this crypto trading strategy delivers real-time buy/sell signals for early entries and bigger profits.
It’s more than just an indicator – it’s a crypto market scanner that works 24/7, detecting reversal candlestick patterns, support/resistance zones, and momentum shifts before the crowd.
________________________________________
📊 What is the Crypto Scanner & screener?
The Crypto Scanner is a powerful TradingView crypto tool built for scalpers, day traders, and swing traders. It scans the top 50 altcoins by market cap, spotting high-probability reversal setups across all timeframes – from 1-minute scalping charts to long-term swing trades.
This tool saves time by automating crypto market analysis, helping you trade smarter, whether you’re focusing on Bitcoin, Ethereum, or fast-moving altcoins.
________________________________________
⚙️ How the Crypto Scanner Works
1. Group 1 & Group 2 Coins: Scans two predefined groups :
Group 1: Top 25 coins by market cap.
Group 2: Next 25 coins by market cap.
Displays Group 1 signals by default in a table, with green (1) for buying pressure and red (2) for selling pressure.
2. Next Steps: When a coin shows a green or red signal, open its chart via TradingView’s symbol search. Look for:
Green X below a candle for bullish signals.
Red X above a candle for bearish signals.
Enter trades when price moves above the Green X candle’s close (buy) or below the Red X candle’s close (sell), with a stop loss at the previous candle’s close.
3. Profit Targets: Aim for 2%–7% gains. If price exits the cloud area, hold until it re-enters or an opposite signal appears. Exit if stop loss is hit.
4. Signal Significance: Detects 50+ candlestick patterns (e.g., hammer, doji) after prolonged trends, confirming reversals with price action near support/resistance levels—earlier than moving average crossovers for higher profits.
5. Color-Coded Table: Shows real-time signals:
✅ Green (1): Bullish reversal (buy).
❌ Red (2): Bearish reversal (sell).
6. Support/Resistance Validation: Automatically plots key levels to confirm signals.
________________________________________
🚨 Important Disclaimer
The Crypto Scanner is not designed to catch every market move.
If price moves slowly or the specific candlestick patterns do not form during extreme downtrends or extreme uptrends, the scanner may miss the reversal.
Missing a move does not make you poorer — instead, focus on the trades that the scanner does catch.
Ride those profitable waves and let the missed opportunities go. The goal is consistency, not chasing every candle.
________________________________________
🎯 Crypto Trading Strategies: Scalping, Day Trading & Swing Trading
The Crypto Scanner isn’t just an indicator – it supports multiple strategies:
Scalping: Quick in-and-out trades with small stop losses.
Day Trading: Catch intraday reversals on Bitcoin & altcoins.
Swing Trading: Identify longer-term reversal points for higher profits.
Whether you scalp 1-minute charts or swing trade daily setups, the scanner adapts to your style.
________________________________________
🎯 Trading Rules for Success
Stop Loss :
Bullish reversal: Set at the close of the candle before the Green X.
Bearish reversal: Set at the close of the candle before the Red X.
Profit Targets:
Exit at the next support/resistance level.
Hold if price exits the cloud and continues strongly until it re-enters or an opposite signal appears.
________________________________________
📈 Maximize Profits with Smart Risk Management
Big wins trump high accuracy. The Crypto Scanner’s early signals let you enter trades before the crowd, boosting profit potential. Even with a 35% win rate, one winning trade can offset multiple small losses due to high-reward setups. Failed reversals may hit stop losses, but the scanner’s design ensures winners outweigh losers.
________________________________________
🚀 Why Traders Choose Our TradingView Crypto Indicator
• 🔎 Scans Top 50 Cryptos: Bitcoin, Ethereum, Solana, Binance Coin, XRP, Dogecoin & more.
• ⚡ Instant Buy/Sell Signals: No more chart-hopping.
• 🕯 50+ Candlestick Patterns: Advanced reversal recognition.
• 📋 Real-Time Screener Table: See all crypto signals at a glance.
• 🔔 Automated Alerts: Get notifications for 50 coins with a single setup.
• 🛡 Auto Support/Resistance Levels: Validates reversals with key price zones.
• ⏱ All Timeframes Supported: Works on scalping (1m/5m) and higher (daily/weekly) charts.
________________________________________
🌍 Why Trade Crypto?
One of the biggest advantages of trading cryptocurrencies is that the crypto market never sleeps. Unlike stocks and forex, crypto runs 24 hours a day, 7 days a week — even on weekends and public holidays. This means you can trade Bitcoin, Ethereum, and altcoins anytime, anywhere without being restricted by exchange opening hours. The continuous market gives more opportunities for scalping, day trading, and swing trading, making crypto one of the most flexible and exciting markets for active traders.
✅ Benefits for Bitcoin & Altcoin Traders
• Saves time by automating crypto analysis
• Works for Bitcoin signals, Ethereum signals, and altcoin signals
• Provides early entries for maximum profit potential
• Ideal for day trading crypto, swing trading, and scalping strategies
• Seamlessly integrates into TradingView
________________________________________
📌 Key Notes
• Pre-Coded Coin List: Includes the top 50 coins, updated periodically.
• Customizable: Contact us for versions with 50, 100, or custom watchlists.
• TradingView Integration: Seamlessly works within TradingView.
________________________________________
🔍 Perfect for Crypto Traders
• Spot traders seeking fast crypto reversal signals.
• Scalpers, intraday, and swing traders.
• TradingView users wanting advanced crypto trading tools.
________________________________________
🚀 Trade Smarter with the Crypto Scanner
Dominate the crypto market with the Crypto Scanner on TradingView. Catch reversals in the top 50 coins and boost your profits. Don’t miss out!
👉 Start trading smarter – activate the Crypto Scanner on TradingView today!
Breakouts with Trailing Stops V6 + AlertsBreakouts with Trailing Stops in Trading
Breakout trading is a strategy where traders aim to profit from an asset's price moving outside a defined support or resistance level, signaling a potential new trend. Trailing stops are a key risk management tool often used with breakouts to protect profits and limit potential losses.
What is a breakout?
A breakout occurs when an asset's price moves decisively above a resistance level (for a bullish breakout) or below a support level (for a bearish breakdown). This often signals increased momentum and potential for a significant price movement in the direction of the breakout.
Why use trailing stops with breakouts?
Trailing stops are particularly useful in breakout trading because they allow traders to capture potential profits as the price moves in their favor, while automatically adjusting to protect against sudden reversals.
How do trailing stops work with breakouts?
Initial Stop-Loss: When entering a breakout trade, a traditional stop-loss order is placed at a predetermined level to limit potential losses if the price reverses. For example, in a long position after a resistance breakout, the initial stop-loss might be placed below the former resistance level (which can now act as support).
Trailing Stop Activation: Once the price moves a favorable distance beyond the entry point, the trailing stop loss is activated. As highlighted by StoneX, it is a dynamic order that follows the price as it continues to move in the desired direction, maintaining a set distance below (for a long position) or above (for a short position) the current market price.
Profit Locking: If the price continues to rise (or fall for a short position), the trailing stop will move with it, "locking in" profits by raising the stop-loss level.
Exit Strategy: If the price reverses and hits the trailing stop, the position is automatically closed, ensuring that the trader retains a portion of the gains made while in the trade.
Advantages of using trailing stops with breakouts:
Locks in profits: Trailing stops help protect profits generated from successful breakout trades.
Automates exits: They automate the exit process, helping traders avoid emotional decision-making when the price reverses.
Allows for potential gains: They allow traders to stay in profitable trades as long as the trend continues.
Disadvantages of using trailing stops with breakouts:
Whipsaw risk: In volatile markets, the trailing stop may be triggered prematurely by minor price fluctuations.
Potential for missed gains: If the trailing stop is set too tightly, it may prevent the trader from capturing the maximum potential gains if the price experiences a minor pullback before continuing in the desired direction.
Tips for using trailing stops with breakouts:
Consider the asset's volatility: Adjust the trailing stop distance based on the asset's volatility to minimize the risk of premature stops.
Test different trailing stop methods: Experiment with different trailing stop methods to find what works best for your trading style and the specific asset you are trading.
Backtest your strategy: Before applying a trailing stop strategy to live trading, backtest it on historical data to evaluate its performance under different market conditions.
Combine with other indicators: Use other technical indicators, such as volume or momentum oscillators, to confirm the validity of breakouts and improve the effectiveness of your trailing stop strategy.
By carefully considering the market dynamics, using appropriate indicators, and implementing proper risk management techniques, traders can effectively utilize trailing stops with breakouts to capture potential profits while minimizing risk.
Have a good trade.

BTC Mining Income Oscillator Z-ScoreBTC Mining Income Oscillator (Z-Score)
Overview
The BTC Mining Income Oscillator (Z-Score) is a custom technical indicator that analyzes Bitcoin mining income to help traders identify overbought and oversold conditions. The indicator uses a Z-Score to track deviations in mining income, highlighting periods of high or low mining profitability.
This indicator is made up of:
Z-Score Line (Blue): Measures how far the current mining income deviates from its historical mean.
Mining Income Oscillator (Orange): A scaled value of mining income that oscillates within a specific range to indicate overbought and oversold conditions.
How the Indicator Works
1. Mining Income Calculation
The BTC Mining Income is determined using two main factors:
Block Reward: The number of BTC miners earn for each block mined (currently 3.125 BTC, adjustable in settings).
Transaction Fees: The average transaction fees per block (default is 0.3 BTC).
Blocks per Day: The number of blocks mined per day (default is 144).
The daily mining income in BTC is calculated as:
Mining Income
=
(
Block Reward
+
Transaction Fees
)
×
Blocks per Day
Mining Income=(Block Reward+Transaction Fees)×Blocks per Day
This value is then converted to USD by multiplying it by the current Bitcoin price.
2. Z-Score Calculation
The Z-Score measures how far the current mining income deviates from its mean over a set period (default is 90 days). The Z-Score helps identify when mining income is unusually high or low:
A high Z-Score indicates that the mining income is significantly above the historical mean, signaling overbought conditions.
A low Z-Score indicates that the mining income is significantly below the historical mean, signaling oversold conditions.
The Z-Score is calculated as follows:
Z-Score
=
(
Current Mining Income
−
Mean Income
)
Standard Deviation
Z-Score=
Standard Deviation
(Current Mining Income−Mean Income)
The result is then smoothed over a period (default is 5) to reduce noise and provide a more stable value.
3. Mining Income Oscillator
The mining income is scaled to oscillate between +20 and +90. This oscillation makes it easy to track overbought and oversold conditions in the market:
Values between 85 and 90 indicate overbought conditions (high mining profitability).
Values between 20 and 22 indicate oversold conditions (low mining profitability).
Values between 22 and 85 indicate neutral conditions, where mining profitability is normal.
The mining income oscillator helps traders spot extreme conditions (overbought or oversold) in mining profitability.
How to Read the Indicator
1. Z-Score Line (Blue)
The Z-Score represents how far current mining income is from the historical average.
Above +2: The mining income is unusually high, indicating an overbought market.
Below -2: The mining income is unusually low, indicating an oversold market.
Between -2 and +2: This range is neutral, where the mining income is within the average historical range.
2. Mining Income Oscillator (Orange)
The Mining Income Oscillator is scaled between 20 and 90.
85–90: Overbought conditions, indicating high mining profitability.
20–22: Oversold conditions, indicating low mining profitability.
22–85: Neutral conditions, indicating moderate mining profitability.
3. Background Shading
Red Shading (85–90): Indicates overbought conditions (mining income is unusually high).
Green Shading (20–22): Indicates oversold conditions (mining income is unusually low).
The shaded regions provide a visual guide to spot periods when the market is overbought or oversold.
4. Key Horizontal Lines
0 Line: Represents the neutral level for the Z-Score, where the mining income is at the historical mean.
+2 and -2 Lines: Indicate overbought and oversold conditions for the Z-Score.
90 and 20 Lines: Indicate the upper and lower bounds for the mining income oscillator.
Where the Data Comes From
Bitcoin Price: The current Bitcoin price is pulled directly from the chart.
Block Reward and Transaction Fees: These values are set manually by the user or can be updated dynamically.
Mining Income: Calculated based on the block reward, transaction fees, and current Bitcoin price.
Z-Score and Oscillator Calculations: Both are calculated based on mining income in USD over a defined look-back period.
Best Timeframe for This Indicator
This indicator is designed to work best on the 2-day chart (2D) timeframe. On the 2-day chart, the mining income data, Z-Score, and the oscillator are less sensitive to noise and short-term volatility, providing more reliable signals. While it can be used on other timeframes, the 2-day chart offers the clearest and most stable analysis.

Trend Zone Moving Averages📈 Trend Zone Moving Averages
The Trend Zone Moving Averages indicator helps traders quickly identify market trends using the 50SMA, 100SMA, and 200SMA. With dynamic background colors, customizable settings, and real-time alerts, this tool provides a clear view of bullish, bearish, and extreme trend conditions.
🔹 Features:
Trend Zones with Dynamic Background Colors
Green → Bullish Trend (50SMA > 100SMA > 200SMA, price above 50SMA)
Red → Bearish Trend (50SMA < 100SMA < 200SMA, price below 50SMA)
Yellow → Neutral Trend (Mixed signals)
Dark Green → Extreme Bullish (Price above all three SMAs)
Dark Red → Extreme Bearish (Price below all three SMAs)
Customizable Moving Averages
Toggle 50SMA, 100SMA, and 200SMA on/off from the settings.
Perfect for traders who prefer a cleaner chart.
Real-Time Trend Alerts
Get instant notifications when the trend changes:
🟢 Bullish Zone Alert – When price enters a bullish trend.
🔴 Bearish Zone Alert – When price enters a bearish trend.
🟡 Neutral Zone Alert – When trend shifts to neutral.
🌟 Extreme Bullish Alert – When price moves above all SMAs.
⚠️ Extreme Bearish Alert – When price drops below all SMAs.
✅ Perfect for Any Market
Works on stocks, forex, crypto, and commodities.
Adaptable for day traders, swing traders, and investors.
⚙️ How to Use: Trend Zone Moving Averages Strategy
This strategy helps traders identify and trade with the trend using the Trend Zone Moving Averages indicator. It works across stocks, forex, crypto, and commodities.
🟢 Bullish Trend Strategy (Green Background)
Objective: Look for buying opportunities when the market is in an uptrend.
Entry Conditions:
✅ Background is Green (Bullish Zone).
✅ Price is above the 50SMA (confirming strength).
✅ Price pulls back to the 50SMA and bounces OR breaks above a key resistance level.
Stop Loss:
🔹 Place below the most recent swing low or just under the 50SMA.
Take Profit:
🔹 First target at the next resistance level or recent swing high.
🔹 Second target if price continues higher—trail stops to lock in profits.
🔴 Bearish Trend Strategy (Red Background)
Objective: Look for shorting opportunities when the market is in a downtrend.
Entry Conditions:
✅ Background is Red (Bearish Zone).
✅ Price is below the 50SMA (confirming weakness).
✅ Price pulls back to the 50SMA and rejects OR breaks below a key support level.
Stop Loss:
🔹 Place above the most recent swing high or just above the 50SMA.
Take Profit:
🔹 First target at the next support level or recent swing low.
🔹 Second target if price keeps falling—trail stops to secure profits.
🌟 Extreme Trend Strategy (Dark Green / Dark Red Background)
Objective: Trade with momentum when the market is in a strong trend.
Entry Conditions:
✅ Dark Green Background → Extreme Bullish: Price is above all three SMAs (strong uptrend).
✅ Dark Red Background → Extreme Bearish: Price is below all three SMAs (strong downtrend).
Trade Execution:
🔹 For longs (Dark Green): Look for breakout entries above resistance or pullbacks to the 50SMA.
🔹 For shorts (Dark Red): Look for breakdown entries below support or rejections at the 50SMA.
Risk Management:
🔹 Use tighter stop losses and trail profits aggressively to maximize gains.
🟡 Neutral Trend Strategy (Yellow Background)
Objective: Avoid trading or wait for a breakout.
What to Do:
🔹 Avoid trading in this zone—price is indecisive.
🔹 Wait for confirmation (background turns green/red) before taking a trade.
🔹 Use alerts to notify you when the trend resumes.
📌 Final Tips
Use this strategy with price action for extra confirmation.
Combine with support/resistance levels to improve accuracy.
Set alerts for trend changes so you never miss an opportunity.
Enjoy!

EPS Line Indicator - cristianhkrOverview
The EPS Line Indicator displays the Earnings Per Share (EPS) of a publicly traded company directly on a TradingView chart. It provides a historical trend of EPS over time, allowing investors to track a company's profitability per share.
Key Features
📊 Plots actual EPS data for the selected stock.
📅 Updates quarterly as new EPS reports are released.
🔄 Smooths missing values by holding the last reported EPS.
🔍 Helps track long-term profitability trends.
How It Works
The script retrieves quarterly EPS using request.financial(syminfo.tickerid, "EARNINGS_PER_SHARE", "Q", barmerge.gaps_off).
If EPS data is missing for a given period, the last available EPS value is retained to maintain continuity.
The EPS values are plotted as a continuous green line on the chart.
A baseline at EPS = 0 is included to easily identify profitable vs. loss-making periods.
How to Use This Indicator
If the EPS line is trending upwards 📈 → The company is growing earnings per share, a strong sign of profitability.
If the EPS line is declining 📉 → The company’s EPS is shrinking, which may indicate financial weakness.
If EPS is negative (below zero) ❌ → The company is reporting losses per share, which can be a warning sign.
Limitations
Only works with stocks that report EPS data (not applicable to cryptocurrencies or commodities).
Does not adjust for stock splits or other corporate actions.
Best used on daily, weekly, or monthly charts for clear earnings trends.
Conclusion
This indicator is a powerful tool for investors who want to visualize earnings per share trends directly on a price chart. By showing how EPS evolves over time, it helps assess a company's profitability trajectory, making it useful for both fundamental analysis and long-term investing.
🚀 Use this indicator to track EPS growth and make smarter investment decisions!

Uptrick: Arbitrage OpportunityINTRODUCTION
This script, titled Uptrick: Arbitrage Monitor, is a Pine Script™ indicator that aims to help traders quickly visualize potential arbitrage scenarios across multiple cryptocurrency exchanges. Arbitrage, in general, involves taking advantage of price differences for the same asset across different trading platforms. By comparing market prices of the same symbol on two user-selected exchanges, as well as scanning a broader list of exchanges, this script attempts to signal areas where you might want to buy on one exchange and sell on another. It includes various graphical tools, calculations, and an optional Automated Detection signal feature, allowing users to incorporate more advanced data scanning into their trading decisions. Keep in mind that transaction fees must also be considered in real-world scenarios. These fees can negate potential profits and, in some cases, result in a net loss.
PURPOSE
The primary purpose of this indicator is to show potential percentage differences between the same cryptocurrency trading pairs on two different exchanges. This difference is displayed numerically, visually as a line chart, and it is also tested against user-defined thresholds. With the threshold in place, buy and sell signals can be generated. The script allows you to quickly gauge how significant a spread is between two exchanges and whether that spread surpasses a specified threshold. This is particularly useful for arbitrage trading, where an asset is bought at a lower price on one exchange and sold at a higher price on another, capitalizing on price discrepancies. By identifying these opportunities, traders can potentially secure profits across different markets.
WHY IT WAS MADE
This script was developed to help traders who frequently look for arbitrage opportunities in the fast-paced cryptocurrency market. Cryptocurrencies sometimes experience quick price divergences across different exchanges. By having an automated approach that compares and displays prices, traders can spend less time manually tracking price discrepancies and more time focusing on actual trading strategies. The script was also made with user customization in mind, allowing you to toggle an optional Automated-based approach and choose different moving average methods to smooth out the displayed price difference.
WHAT ARBITRAGE IS
Arbitrage is the practice of buying an asset on one market (or exchange) at a lower price and simultaneously selling it on another market where the price is higher, thus profiting from the price difference. In cryptocurrency markets, these price differentials can occur across multiple exchanges due to varying liquidity, trading volume, geographic factors, or market inefficiencies. Though sometimes small, these differences can be exploited for profit when approached methodically.
EXPLANATION OF INPUTS
The script includes a variety of user inputs that help tailor the indicator to your specific needs:
1. Compared Symbol 1: This is the primary symbol you want to track (for example, BTCUSDT). Make sure it's written in all capital and make sure that it's price from that exchange is available on Tradingview.
2. Compare Exchange 1: The first exchange on which the script will request pricing data for the chosen symbol.
3. Compared to Exchange: The second exchange, used for the comparison.
4. Opportunity Threshold (%): A percentage threshold that, when exceeded by the price difference, can trigger buy or sell signals.
5. Plot Style?: Allows you to choose between plotting the raw difference line or a moving average of that difference.
6. MA Type: Select among SMA, EMA, WMA, RMA, or HMA for your moving average calculation.
7. MA Length: The lookback period for the selected moving average.
8. Plot Buy/Sell Signals?: Enables or disables the plotting of arrows signaling potential buy or sell zones based on threshold crossovers.
9. Automated Detection?: Toggles an additional multi-exchange data scan feature that calculates the highest and lowest prices for the specified symbol across a predefined list of exchanges.
CALCULATIONS
At its core, the script calculates price1 and price2 using the request.security function to fetch close prices from two selected exchanges. The difference is measured as (price1 - price2) / price2 * 100. This results in a percentage that indicates how much higher or lower price1 is relative to price2. Additionally, the script calculates a slope for this difference, which helps color the line depending on whether it is trending up or down. If you choose the moving average option, the script will replace the raw difference data with one of several moving average calculations (SMA, EMA, WMA, RMA, or HMA).
The script also includes an iterative scan of up to 15 different exchanges for Automated detection, collecting the highest and lowest price across all those exchanges. If the Automated option is enabled, it compiles a potential recommendation: buy at the cheapest exchange price and sell at the most expensive one. The difference across all exchanges (allExDiffPercent) is calculated using (highestPriceAll - lowestPriceAll) / lowestPriceAll * 100.
WHAT AUTOMATED DETECTION SIGNAL DOES
If enabled, the Automated detection feature scans all 15 supported exchanges for the specified symbol. It then identifies the exchange with the highest price and the exchange with the lowest price. The script displays a recommended action: buy on the lowest-exchange price and sell on the highest-exchange price. While called “Automated,” it is essentially a multi-exchange data query that automates a portion of research by consolidating different price points. It does not replace thorough analysis or guaranteed execution; it simply provides an overview of potential extremes.
WHAT ALL-EX-DIFF IS
The variable allExDiffPercent is used to show the overall difference between the highest price and the lowest price found among the 15 pre-chosen exchanges. This figure can be useful for anyone wanting a big-picture view of how large the arbitrage spread might be across the broader market.
SIGNALS AND HOW THEY ARE GENERATED
The script provides two main modes of signal generation:
1. Raw Difference Mode: If the user chooses “Use Normal Line,” the script compares the percentage difference of the two selected exchanges (price1 and price2) to the user-defined threshold. When the difference crosses under the positive threshold, a sell signal is displayed (red arrow). Conversely, when the difference crosses above the negative threshold, a buy signal is displayed (green arrow).
2. Moving Average Mode: If the user selects “Use Moving Average,” the script instead references the moving average values (maValue). The signals fire under similar conditions but use the average line to gauge whether the threshold has been crossed.
HOW TO USE THE INDICATOR
1. Add the script to your chart in TradingView.
2. In the script’s settings panel, configure the symbol you wish to compare (for example, BTCUSDT), choose the two exchanges you want to evaluate, and set your desired threshold.
3. Optionally, pick a moving average type and length if you prefer a smoother representation of the difference.
4. Enable or disable buy/sell signals according to your preference.
5. If you’d like to see potential extremes among a broader list of exchanges, enable Automated Detection. Keep in mind that this feature runs additional security requests, so it might slow down performance on weaker devices or if you already have many scripts running.
EXCHANGES TO USE
The script currently supports up to 15 exchanges: BYBIT, BINANCE, MEXC, BLOFIN, BITGET, OKX, KUCOIN, COINBASE, COINEX, PHEMEX, POLONIEX, GATEIO, BITSTAMP, and KRAKEN. You can choose any two of these for direct comparison, and if you enable the Automated detection, it will attempt to query them all to find extremes in real time.
VISUALS
The exchanges and current prices & differences are all plotted in the table while the colored line represents the difference in the price. The two thresholds colored red are where signals are generated. A cross below the upper threshold is a sell signal and a cross above the lower threshold is a buy signal. In the line at the bottom, purple is a negative slope and aqua is a positive slope.
LIMITATIONS AND POTENTIAL PROBLEMS
If you enable too many visual elements such as signals, additional lines, and the Automated-based scanning table, you may find that your chart becomes cluttered, or text might overlap. One workaround is to remove and reapply the indicator to refresh its display. You may also want to reduce the number of displayed table rows by disabling some features if your chart becomes too crowded. Sometimes there might be an error that the price of an asset is not available on an exchange, to fix this, go and select another exchange to compare it to, or if it happens in Automated detection, choose a different asset, ideally more widely spread.
UNIQUENESS
This indicator stands out due to its multifaceted approach: it doesn’t just look at two exchanges but optionally scans up to 15 exchanges in real time, presenting users with a much broader view of the market. The dual-mode system (raw difference vs. moving average) allows for both immediate, unfiltered signals and smoother, noise-reduced signals depending on user preference. By default, it introduces dynamic visual cues through color changes when the slope of the difference transitions upward or downward. The optional Automated detection, while not a deep learning system, adds a functional intelligence layer by collating extreme price points from multiple exchanges in one place, thereby streamlining the manual research process. This combination of features gives the script a unique edge in the TradingView ecosystem, catering equally to novices wanting a straightforward approach and to advanced users looking for an aggregated multi-exchange analysis.
CONCLUSION
Uptrick: Arbitrage Monitor is a versatile and customizable Pine Script™ indicator that highlights price differences for a specified symbol between two user-selected exchanges. Through signals, threshold-based alerts, and optional Automated detection across multiple exchanges, it aims to support traders in identifying potential arbitrage opportunities quickly and efficiently. This script makes no guarantees of profitability but can serve as a valuable tool to add to your trading toolkit. Always use caution when implementing arbitrage strategies, and be mindful of market risks, exchange fees, and latency.
ADDITIONAL DISCLOSURES
This script is provided for educational and informational purposes only. It does not constitute financial advice or a guarantee of performance. Users are encouraged to conduct thorough research and consider the inherent risks of arbitrage trading. Market conditions can change rapidly, and orders may fail to execute at desired prices, especially when large price discrepancies attract competition from other traders.

Fundamental AnalysisThis indicator compiles a wide range of essential financial metrics directly onto your chart, providing a quick and easy reference to the financial condition of any listed company. Instead of diving into lengthy financial reports, you get an at-a-glance overview of the most critical financial ratios and figures.
Key Metrics Included:
Interest Coverage Ratio: Helps assess a company’s ability to pay interest on its debt. Higher values suggest greater financial stability and lower default risk.
Gross Profit Margin: Shows how much profit a company makes after covering its production costs. A higher margin indicates better efficiency and profitability in managing costs.
Dividend Yield: Reflects the annual dividend payout as a percentage of the current stock price. A moderate dividend yield may indicate a balance between income generation and growth potential.
Enterprise Value (EV): A comprehensive measure of a company's total value, including debt. Useful for comparing companies with different capital structures.
Free Cash Flow to Equity (FCFE): Reveals how much cash is available to shareholders after accounting for capital expenditures and debt repayments, indicating the company’s ability to reward investors.
Price-to-Book Ratio (P/B): Compares a company's market value to its book value. Lower values might indicate undervaluation, while higher values can suggest overvaluation.
Price-to-Cash Flow Ratio (P/CF): Helps identify companies that generate a significant amount of cash relative to their price, a key metric for assessing liquidity and sustainability.
Price-to-Free Cash Flow Ratio: Shows how much investors are paying for the company's free cash flow, which is crucial for assessing value, especially in capital-intensive sectors.
Price Earnings Ratio (P/E): The classic metric for valuing a company based on its earnings. Useful for comparing valuations across companies and industries.
Debt-to-Equity Ratio: Indicates the proportion of company financing that comes from debt and equity. A lower ratio typically signifies a less risky investment.
Return on Equity (ROE): Measures how effectively a company uses equity capital to generate profit. A higher ROE can indicate a profitable, well-managed company.
Quick Ratio: Assesses a company’s short-term liquidity by comparing its liquid assets to its current liabilities. Higher values indicate better liquidity.
Operating Margin: Reflects the percentage of revenue left after covering operating expenses. Higher margins suggest greater operational efficiency.
How to Use This Indicator:
Use this indicator as part of your due diligence when analyzing potential investments. Each metric is color-coded to quickly highlight whether the value is within a favorable range, making it easy to identify strong or weak aspects of a company’s financial position.
Green indicates favorable metrics, suggesting financial strength or value.
Red highlights areas of concern, pointing to potential risks or weaknesses.
This tool can help you compare different companies, spot trends over time, and make more informed decisions based on solid financial analysis. Whether you’re a value investor looking for undervalued stocks, a dividend seeker searching for sustainable payouts, or a growth investor focused on profitability and efficiency, this indicator can be tailored to your strategy.

Uptrick: RSI Histogram
1. **Introduction to the RSI and Moving Averages**
2. **Detailed Breakdown of the Uptrick: RSI Histogram**
3. **Calculation and Formula**
4. **Visual Representation**
5. **Customization and User Settings**
6. **Trading Strategies and Applications**
7. **Risk Management**
8. **Case Studies and Examples**
9. **Comparison with Other Indicators**
10. **Advanced Usage and Tips**
---
## 1. Introduction to the RSI and Moving Averages
### **1.1 Relative Strength Index (RSI)**
The Relative Strength Index (RSI) is a momentum oscillator developed by J. Welles Wilder and introduced in his 1978 book "New Concepts in Technical Trading Systems." It is widely used in technical analysis to measure the speed and change of price movements.
**Purpose of RSI:**
- **Identify Overbought/Oversold Conditions:** RSI values range from 0 to 100. Traditionally, values above 70 are considered overbought, while values below 30 are considered oversold. These thresholds help traders identify potential reversal points in the market.
- **Trend Strength Measurement:** RSI also indicates the strength of a trend. High RSI values suggest strong bullish momentum, while low values indicate bearish momentum.
**Calculation of RSI:**
1. **Calculate the Average Gain and Loss:** Over a specified period (e.g., 14 days), calculate the average gain and loss.
2. **Compute the Relative Strength (RS):** RS is the ratio of average gain to average loss.
3. **RSI Formula:** RSI = 100 - (100 / (1 + RS))
### **1.2 Moving Averages (MA)**
Moving Averages are used to smooth out price data and identify trends by filtering out short-term fluctuations. Two common types are:
**Simple Moving Average (SMA):** The average of prices over a specified number of periods.
**Exponential Moving Average (EMA):** A type of moving average that gives more weight to recent prices, making it more responsive to recent price changes.
**Smoothed Moving Average (SMA):** Used to reduce the impact of volatility and provide a clearer view of the underlying trend. The RMA, or Running Moving Average, used in the USH script is similar to an EMA but based on the average of RSI values.
## 2. Detailed Breakdown of the Uptrick: RSI Histogram
### **2.1 Indicator Overview**
The Uptrick: RSI Histogram (USH) is a technical analysis tool that combines the RSI with a moving average to create a histogram that reflects momentum and trend strength.
**Key Components:**
- **RSI Calculation:** Determines the relative strength of price movements.
- **Moving Average Application:** Smooths the RSI values to provide a clearer trend indication.
- **Histogram Plotting:** Visualizes the deviation of the smoothed RSI from a neutral level.
### **2.2 Indicator Purpose**
The primary purpose of the USH is to provide a clear visual representation of the market's momentum and trend strength. It helps traders identify:
- **Bullish and Bearish Trends:** By showing how far the smoothed RSI is from the neutral 50 level.
- **Potential Reversal Points:** By highlighting changes in momentum.
### **2.3 Indicator Design**
**RSI Moving Average (RSI MA):** The RSI MA is a smoothed version of the RSI, calculated using a running moving average. This smooths out short-term fluctuations and provides a clearer indication of the underlying trend.
**Histogram Calculation:**
- **Neutral Level:** The histogram is plotted relative to the neutral level of 50. This level represents a balanced market where neither bulls nor bears have dominance.
- **Histogram Values:** The histogram bars show the difference between the RSI MA and the neutral level. Positive values indicate bullish momentum, while negative values indicate bearish momentum.
## 3. Calculation and Formula
### **3.1 RSI Calculation**
The RSI calculation involves:
1. **Average Gain and Loss:** Calculated over the specified length (e.g., 14 periods).
2. **Relative Strength (RS):** RS = Average Gain / Average Loss.
3. **RSI Formula:** RSI = 100 - (100 / (1 + RS)).
### **3.2 Moving Average Calculation**
For the USH indicator, the RSI is smoothed using a running moving average (RMA). The RMA formula is similar to that of the EMA but is based on averaging RSI values over the specified length.
### **3.3 Histogram Calculation**
The histogram value is calculated as:
- **Histogram Value = RSI MA - 50**
**Plotting the Histogram:**
- **Positive Histogram Values:** Indicate that the RSI MA is above the neutral level, suggesting bullish momentum.
- **Negative Histogram Values:** Indicate that the RSI MA is below the neutral level, suggesting bearish momentum.
## 4. Visual Representation
### **4.1 Histogram Bars**
The histogram is plotted as bars on the chart:
- **Bullish Bars:** Colored green when the RSI MA is above 50.
- **Bearish Bars:** Colored red when the RSI MA is below 50.
### **4.2 Customization Options**
Traders can customize:
- **RSI Length:** Adjust the length of the RSI calculation to match their trading style.
- **Bull and Bear Colors:** Choose colors for histogram bars to enhance visual clarity.
### **4.3 Interpretation**
**Bullish Signal:** A histogram bar that moves from red to green indicates a potential shift to a bullish trend.
**Bearish Signal:** A histogram bar that moves from green to red indicates a potential shift to a bearish trend.
## 5. Customization and User Settings
### **5.1 Adjusting RSI Length**
The length parameter determines the number of periods over which the RSI is calculated and smoothed. Shorter lengths make the RSI more sensitive to price changes, while longer lengths provide a smoother view of trends.
### **5.2 Color Settings**
Traders can adjust:
- **Bull Color:** Color of histogram bars indicating bullish momentum.
- **Bear Color:** Color of histogram bars indicating bearish momentum.
**Customization Benefits:**
- **Visual Clarity:** Traders can choose colors that stand out against their chart’s background.
- **Personal Preference:** Adjust settings to match individual trading styles and preferences.
## 6. Trading Strategies and Applications
### **6.1 Trend Following**
**Identifying Entry Points:**
- **Bullish Entry:** When the histogram changes from red to green, it signals a potential entry point for long positions.
- **Bearish Entry:** When the histogram changes from green to red, it signals a potential entry point for short positions.
**Trend Confirmation:** The histogram helps confirm the strength of a trend. Strong, consistent green bars indicate robust bullish momentum, while strong, consistent red bars indicate robust bearish momentum.
### **6.2 Swing Trading**
**Momentum Analysis:**
- **Entry Signals:** Look for significant shifts in the histogram to time entries. A shift from bearish to bullish (red to green) indicates potential for upward movement.
- **Exit Signals:** A shift from bullish to bearish (green to red) suggests a potential weakening of the trend, signaling an exit or reversal point.
### **6.3 Range Trading**
**Market Conditions:**
- **Consolidation:** The histogram close to zero suggests a range-bound market. Traders can use this information to identify support and resistance levels.
- **Breakout Potential:** A significant move away from the neutral level may indicate a potential breakout from the range.
### **6.4 Risk Management**
**Stop-Loss Placement:**
- **Bullish Positions:** Place stop-loss orders below recent support levels when the histogram is green.
- **Bearish Positions:** Place stop-loss orders above recent resistance levels when the histogram is red.
**Position Sizing:** Adjust position sizes based on the strength of the histogram signals. Strong trends (indicated by larger histogram bars) may warrant larger positions, while weaker signals suggest smaller positions.
## 7. Risk Management
### **7.1 Importance of Risk Management**
Effective risk management is crucial for long-term trading success. It involves protecting capital, managing losses, and optimizing trade setups.
### **7.2 Using USH for Risk Management**
**Stop-Loss and Take-Profit Levels:**
- **Stop-Loss Orders:** Use the histogram to set stop-loss levels based on trend strength. For instance, place stops below support levels in bullish trends and above resistance levels in bearish trends.
- **Take-Profit Targets:** Adjust take-profit levels based on histogram changes. For example, lock in profits as the histogram starts to shift from green to red.
**Position Sizing:**
- **Trend Strength:** Scale position sizes based on the strength of histogram signals. Larger histogram bars indicate stronger trends, which may justify larger positions.
- **Volatility:** Consider market volatility and adjust position sizes to mitigate risk.
## 8. Case Studies and Examples
### **8.1 Example 1: Bullish Trend**
**Scenario:** A trader notices a transition from red to green histogram bars.
**Analysis:**
- **Entry Point:** The transition indicates a potential bullish trend. The trader decides to enter a long position.
- **Stop-Loss:** Set stop-loss below recent support levels.
- **Take-Profit:** Consider taking profits as the histogram moves back towards zero or turns red.
**Outcome:** The bullish trend continues, and the histogram remains green, providing a profitable trade setup.
### **8.2 Example 2: Bearish Trend**
**Scenario:** A trader observes a transition from green to red histogram bars.
**Analysis:**
- **Entry Point:** The transition suggests a potential
bearish trend. The trader decides to enter a short position.
- **Stop-Loss:** Set stop-loss above recent resistance levels.
- **Take-Profit:** Consider taking profits as the histogram approaches zero or shifts to green.
**Outcome:** The bearish trend continues, and the histogram remains red, resulting in a successful trade.
## 9. Comparison with Other Indicators
### **9.1 RSI vs. USH**
**RSI:** Measures momentum and identifies overbought/oversold conditions.
**USH:** Builds on RSI by incorporating a moving average and histogram to provide a clearer view of trend strength and momentum.
### **9.2 RSI vs. MACD**
**MACD (Moving Average Convergence Divergence):** A trend-following momentum indicator that uses moving averages to identify changes in trend direction.
**Comparison:**
- **USH:** Provides a smoothed RSI perspective and visual histogram for trend strength.
- **MACD:** Offers signals based on the convergence and divergence of moving averages.
### **9.3 RSI vs. Stochastic Oscillator**
**Stochastic Oscillator:** Measures the level of the closing price relative to the high-low range over a specified period.
**Comparison:**
- **USH:** Focuses on smoothed RSI values and histogram representation.
- **Stochastic Oscillator:** Provides overbought/oversold signals and potential reversals based on price levels.
## 10. Advanced Usage and Tips
### **10.1 Combining Indicators**
**Multi-Indicator Strategies:** Combine the USH with other technical indicators (e.g., Moving Averages, Bollinger Bands) for a comprehensive trading strategy.
**Confirmation Signals:** Use the USH to confirm signals from other indicators. For instance, a bullish histogram combined with a moving average crossover may provide a stronger buy signal.
### **10.2 Customization Tips**
**Adjust RSI Length:** Experiment with different RSI lengths to match various market conditions and trading styles.
**Color Preferences:** Choose histogram colors that enhance visibility and align with personal preferences.
### **10.3 Continuous Learning**
**Backtesting:** Regularly backtest the USH with historical data to refine strategies and improve accuracy.
**Education:** Stay updated with trading education and adapt strategies based on market changes and personal experiences.

Supertrend (Buy/Sell) With TP & SLSupertrend (Buy/Sell) with TP & SL: An Enhanced Trading Tool
This Pine Script indicator combines the popular Supertrend indicator with multiple take-profit (TP) and stop-loss (SL) levels, providing traders with a comprehensive visual aid for potential entries, exits, and risk management.
Originality
Buffer Zones for Precision: Instead of relying solely on the Supertrend line, this script incorporates buffer zones around it. This helps filter out false signals, especially in volatile markets, leading to more accurate buy/sell signals.
Flexible Stop-Loss: Offers the choice between a fixed or trailing stop-loss, allowing traders to tailor their risk management approach based on their preferences and market conditions.
Multiple Take-Profit Levels: Provides three potential take-profit levels, giving traders the flexibility to secure profits at different stages of a trend.
Heikin Ashi Candles & VWAP: Incorporates Heikin Ashi candles for smoother trend visualization and adds a VWAP line for potential support/resistance levels.
Clear Table Display: Presents key information like Stop Loss and Take Profit levels in a user-friendly table, making it easier to track trade targets.
How It Works
Supertrend Calculation: The Supertrend is calculated using ATR (Average True Range) to gauge market volatility. The script then creates buffer zones around the Supertrend line for refined signal generation.
Buy/Sell Signals:
Buy: When the close price crosses above the upper buffer zone, indicating a potential uptrend.
Sell: When the close price crosses below the lower buffer zone, suggesting a potential downtrend.
Take Profit & Stop Loss:
Take Profits: Three TP levels are calculated based on ATR and a customizable profit factor.
Stop Loss: The stop-loss can be set as either a fixed value based on ATR or as a trailing stop-loss that dynamically adjusts to lock in profits.
How To Use
Add the Indicator: Search for "Supertrend (Buy/Sell) With TP & SL" in the TradingView indicators list and add it to your chart.
Customize Inputs: Adjust parameters like ATR Period, Factor, Take Profit Factor, Stop Loss Factor, Stop Loss Type, etc., based on your trading style and preferences.
Interpret Signals: Look for buy signals when the price crosses above the upper buffer and sell signals when it crosses below the lower buffer.
Manage Risk: Use the plotted Take Profit and Stop Loss levels to manage your risk and potential rewards.
Concepts
Supertrend: A trend-following indicator that helps identify the direction of the prevailing trend.
ATR (Average True Range): A measure of market volatility.
Buffer Zones: Used to filter out false signals by creating a zone around the Supertrend line.
Trailing Stop Loss: A dynamic stop-loss that moves with the price to protect profits.
Heikin Ashi: A type of candlestick chart designed to filter out market noise and make trends easier to identify.
VWAP (Volume Weighted Average Price): An indicator that shows the average price at which a security has traded throughout the day, based on both volume and price.
Important Note: This script is for educational and informational purposes only. Backtest thoroughly and use with caution in live trading. Always manage your risk appropriately.

Buffett Quality Score [Financials]Evaluating Financial Companies with the Buffett Quality Score 'Financials'
The financial sector, with its unique regulatory environment and market dynamics, requires a tailored approach to financial evaluation. The Buffett Quality Score is meticulously designed to assess the financial robustness and quality of companies within this sector. By focusing on industry-specific financial metrics, this scoring system provides valuable insights for investors and analysts navigating the complexities of the financial industry.
Scoring Methodology
Each selected financial metric contributes a point to the overall score if the specified condition is met. The combined score is a summation of points across all criteria, providing a comprehensive assessment of financial health and quality.
Selected Financial Metrics and Criteria
1. Altman Z-Score > 2.0
Relevance: The Altman Z-Score evaluates bankruptcy risk based on profitability, leverage, liquidity, solvency, and activity. In the financial sector, where market stability and solvency are critical, a score above 2.0 signifies a lower risk of financial distress.
2. Debt to Equity Ratio < 2.0
Relevance: A lower Debt to Equity Ratio signifies prudent financial management and reduced reliance on debt financing. This is particularly important for financial companies, which need to manage leverage carefully to avoid excessive risk.
3. Interest Coverage > 3.0
Relevance: The Interest Coverage Ratio measures a company's ability to meet its interest obligations from operating earnings. A ratio above 3.0 indicates that the company can comfortably cover its interest expenses, reducing the risk of default.
4. Return on Equity (ROE) > 10.0%
Relevance: ROE indicates the company's ability to generate profits from shareholder equity. An ROE above 10.0% suggests efficient use of capital and strong returns for investors, which is a key performance indicator for financial companies.
5. Return on Assets (ROA) > 1.0%
Relevance: ROA measures the company's ability to generate earnings from its assets. In the financial sector, where asset management is crucial, an ROA above 1.0% indicates effective use of assets to generate profits.
6. Net Margin > 10.0%
Relevance: Net Margin measures overall profitability after all expenses. A margin above 10.0% demonstrates strong financial performance and the ability to convert revenue into profit effectively.
7. Revenue One-Year Growth > 5.0%
Relevance: Revenue growth reflects market demand and company expansion. In the financial sector, where growth can be driven by new products and services, revenue exceeding 5.0% indicates successful market penetration and business expansion.
8. EPS One-Year Growth > 5.0%
Relevance: EPS growth reflects the company's ability to increase earnings per share over the past year. For financial companies, growth exceeding 5.0% signals positive earnings momentum and potential market strength.
9. Price/Earnings Ratio (Forward) < 20.0
Relevance: The Forward P/E Ratio reflects investor sentiment and earnings expectations. A ratio below 20.0 suggests reasonable valuation relative to earnings projections, which is important for investors seeking value and growth opportunities in the financial sector.
10. Piotroski F-Score > 6.0
Relevance: The Piotroski F-Score assesses fundamental strength, emphasizing profitability, leverage, liquidity, and operating efficiency. For financial companies, a score above 6.0 indicates strong financial health and operational efficiency.
Interpreting the Buffett Quality Score
0-4 Points: Indicates potential weaknesses across multiple financial areas, warranting careful consideration and risk assessment.
5 Points: Suggests average performance based on sector-specific criteria, requiring further analysis to determine investment viability.
6-10 Points: Signifies strong financial health and quality, positioning the company favorably within the competitive financial industry.
Conclusion
The Buffett Quality Score offers a strategic framework for evaluating financial companies, emphasizing critical financial indicators tailored to industry dynamics. By leveraging these insights, stakeholders can make informed decisions and identify companies poised for sustainable growth and performance in the evolving financial landscape.
Disclaimer: The Buffett Quality Score serves as a tool for financial analysis and should not replace professional advice or comprehensive due diligence. Investors should conduct thorough research and consult with financial experts based on individual investment objectives.
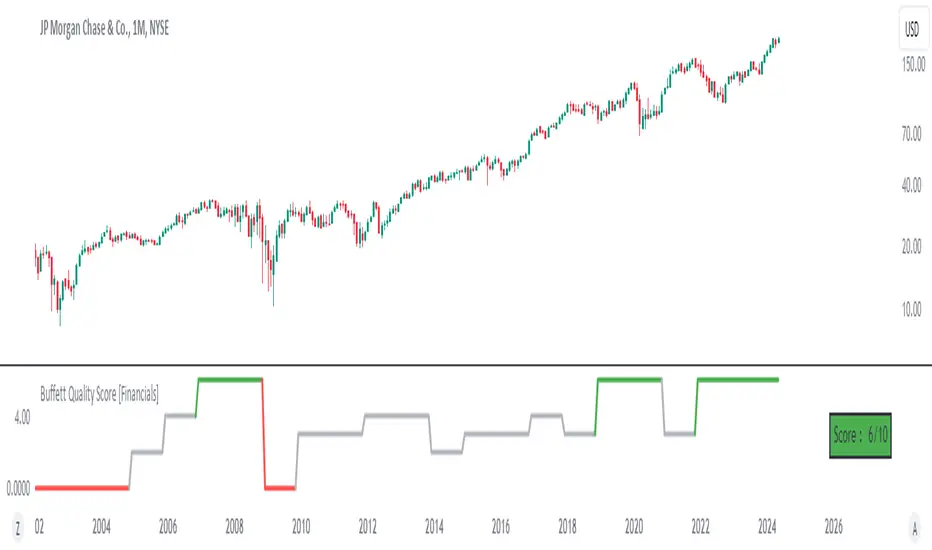
Day/Week/Month Metrics (Zeiierman)█ Overview
The Day/Week/Month Metrics (Zeiierman) indicator is a powerful tool for traders looking to incorporate historical performance into their trading strategy. It computes statistical metrics related to the performance of a trading instrument on different time scales: daily, weekly, and monthly. Breaking down the performance into daily, weekly, and monthly metrics provides a granular view of the instrument's behavior.
The indicator requires the chart to be set on a daily timeframe.
█ Key Statistics
⚪ Day in month
The performance of financial markets can show variability across different days within a month. This phenomenon, often referred to as the "monthly effect" or "turn-of-the-month effect," suggests that certain days of the month, especially the first and last days, tend to exhibit higher than average returns in many stock markets around the world. This effect is attributed to various factors including payroll contributions, investment of monthly dividends, and psychological factors among traders and investors.
⚪ Edge
The Edge calculation identifies days within a month that consistently outperform the average monthly trading performance. It provides a statistical advantage by quantifying how often trading on these specific days yields better returns than the overall monthly average. This insight helps traders understand not just when returns might be higher, but also how reliable these patterns are over time. By focusing on days with a higher "Edge," traders can potentially increase their chances of success by aligning their strategies with historically more profitable days.
⚪ Month
Historically, the stock market has exhibited seasonal trends, with certain months showing distinct patterns of performance. One of the most well-documented patterns is the "Sell in May and go away" phenomenon, suggesting that the period from November to April has historically brought significantly stronger gains in many major stock indices compared to the period from May to October. This pattern highlights the potential impact of seasonal investor sentiment and activities on market performance.
⚪ Day in week
Various studies have identified the "day-of-the-week effect," where certain days of the week, particularly Monday and Friday, show different average returns compared to other weekdays. Historically, Mondays have been associated with lower or negative average returns in many markets, a phenomenon often linked to the settlement of trades from the previous week and negative news accumulation over the weekend. Fridays, on the other hand, might exhibit positive bias as investors adjust positions ahead of the weekend.
⚪ Week in month
The performance of markets can also vary within different weeks of the month, with some studies suggesting a "week of the month effect." Typically, the first and the last week of the month may show stronger performance compared to the middle weeks. This pattern can be influenced by factors such as the timing of economic reports, monthly investment flows, and options and futures expiration dates which tend to cluster around these periods, affecting investor behavior and market liquidity.
█ How It Works
⚪ Day in Month
For each day of the month (1-31), the script calculates the average percentage change between the opening and closing prices of a trading instrument. This metric helps identify which days have historically been more volatile or profitable.
It uses arrays to store the sum of percentage changes for each day and the total occurrences of each day to calculate the average percentage change.
⚪ Month
The script calculates the overall gain for each month (January-December) by comparing the closing price at the start of a month to the closing price at the end, expressed as a percentage. This metric offers insights into which months might offer better trading opportunities based on historical performance.
Monthly gains are tracked using arrays that store the sum of these gains for each month and the count of occurrences to calculate the average monthly gain.
⚪ Day in Week
Similar to the day in the month analysis, the script evaluates the average percentage change between the opening and closing prices for each day of the week (Monday-Sunday). This information can be used to assess which days of the week are typically more favorable for trading.
The script uses arrays to accumulate percentage changes and occurrences for each weekday, allowing for the calculation of average changes per day of the week.
⚪ Week in Month
The script assesses the performance of each week within a month, identifying the gain from the start to the end of each week, expressed as a percentage. This can help traders understand which weeks within a month may have historically presented better trading conditions.
It employs arrays to track the weekly gains and the number of weeks, using a counter to identify which week of the month it is (1-4), allowing for the calculation of average weekly gains.
█ How to Use
Traders can use this indicator to identify patterns or trends in the instrument's performance. For example, if a particular day of the week consistently shows a higher percentage of bullish closes, a trader might consider this in their strategy. Similarly, if certain months show stronger performance historically, this information could influence trading decisions.
Identifying High-Performance Days and Periods
Day in Month & Day in Week Analysis: By examining the average percentage change for each day of the month and week, traders can identify specific days that historically have shown higher volatility or profitability. This allows for targeted trading strategies, focusing on these high-performance days to maximize potential gains.
Month Analysis: Understanding which months have historically provided better returns enables traders to adjust their trading intensity or capital allocation in anticipation of seasonally stronger or weaker periods.
Week in Month Analysis: Identifying which weeks within a month have historically been more profitable can help traders plan their trades around these periods, potentially increasing their chances of success.
█ Settings
Enable or disable the types of statistics you want to display in the table.
Table Size: Users can select the size of the table displayed on the chart, ranging from "Tiny" to "Auto," which adjusts based on screen size.
Table Position: Users can choose the location of the table on the chart
-----------------
Disclaimer
The information contained in my Scripts/Indicators/Ideas/Algos/Systems does not constitute financial advice or a solicitation to buy or sell any securities of any type. I will not accept liability for any loss or damage, including without limitation any loss of profit, which may arise directly or indirectly from the use of or reliance on such information.
All investments involve risk, and the past performance of a security, industry, sector, market, financial product, trading strategy, backtest, or individual's trading does not guarantee future results or returns. Investors are fully responsible for any investment decisions they make. Such decisions should be based solely on an evaluation of their financial circumstances, investment objectives, risk tolerance, and liquidity needs.
My Scripts/Indicators/Ideas/Algos/Systems are only for educational purposes!
