ETH Signal 15m
This strategy uses the Supertrend indicator combined with RSI to generate buy and sell signals, with stop loss (SL) and take profit (TP) conditions based on ATR (Average True Range). Below is a detailed explanation of each part:
1. General Information BINANCE:ETHUSDT.P
Strategy Name: "ETH Signal 15m"
Designed for use on the 15-minute time frame for the ETH pair.
Default capital allocation is 15% of total equity for each trade.
2. Backtest Period
start_time and end_time: Define the start and end time of the backtest period.
start_time = 2024-08-01: Start date of the backtest.
end_time = 2054-01-01: End date of the backtest.
The strategy will only run when the current time falls within this specified range.
3. Supertrend Indicator
Supertrend is a trend-following indicator that provides buy or sell signals based on the direction of price changes.
factor = 2.76: The multiplier used in the Supertrend calculation (increasing this value makes the Supertrend less sensitive to price movements).
atrPeriod = 12: Number of periods used to calculate ATR.
Output:
direction: Determines the buy/sell direction based on Supertrend.
If direction decreases, it signals a buy (Long).
If direction increases, it signals a sell (Short).
4. RSI Indicator
RSI (Relative Strength Index) is a momentum indicator, often used to identify overbought or oversold conditions.
rsiLength = 12: Number of periods used to calculate RSI.
rsiOverbought = 70: RSI level considered overbought.
rsiOversold = 30: RSI level considered oversold.
5. Entry Conditions
Long Entry:
Supertrend gives a buy signal (ta.change(direction) < 0).
RSI must be below the overbought level (rsi < rsiOverbought).
Short Entry:
Supertrend gives a sell signal (ta.change(direction) > 0).
RSI must be above the oversold level (rsi > rsiOversold).
The strategy will only execute trades if the current time is within the backtest period (in_date_range).
6. Stop Loss (SL) and Take Profit (TP) Conditions
ATR (Average True Range) is used to calculate the distance for Stop Loss and Take Profit based on price volatility.
atr = ta.atr(atrPeriod): ATR is calculated using 12 periods.
Stop Loss and Take Profit are calculated as follows:
Long Trade:
Stop Loss: Set at close - 4 * atr (current price minus 4 times the ATR).
Take Profit: Set at close + 2 * atr (current price plus 2 times the ATR).
Short Trade:
Stop Loss: Set at close + 4 * atr (current price plus 4 times the ATR).
Take Profit: Set at close - 2.237 * atr (current price minus 2.237 times the ATR).
Summary:
This strategy enters a Long trade when the Supertrend indicates an upward trend and RSI is not in the overbought region. Conversely, a Short trade is entered when Supertrend signals a downtrend, and RSI is not oversold.
The trade is exited when the price reaches the Stop Loss or Take Profit levels, which are determined based on price volatility (ATR).
Disclaimer:
The content provided in this strategy is for informational and educational purposes only. It is not intended as financial, investment, or trading advice. Trading in cryptocurrency, stocks, or any financial markets involves significant risk, and you may lose more than your initial investment. Past performance is not indicative of future results, and no guarantee of profit can be made. You should consult with a professional financial advisor before making any investment decisions. The creator of this strategy is not responsible for any financial losses or damages incurred as a result of following this strategy. All trades are executed at your own risk.
"range"に関するスクリプトを検索

Bollinger Bands Enhanced StrategyOverview
The common practice of using Bollinger bands is to use it for building mean reversion or squeeze momentum strategies. In the current script Bollinger Bands Enhanced Strategy we are trying to combine the strengths of both strategies types. It utilizes Bollinger Bands indicator to buy the local dip and activates trailing profit system after reaching the user given number of Average True Ranges (ATR). Also it uses 200 period EMA to filter trades only in the direction of a trend. Strategy can execute only long trades.
Unique Features
Trailing Profit System: Strategy uses user given number of ATR to activate trailing take profit. If price has already reached the trailing profit activation level, scrip will close long trade if price closes below Bollinger Bands middle line.
Configurable Trading Periods: Users can tailor the strategy to specific market windows, adapting to different market conditions.
Major Trend Filter: Strategy utilizes 100 period EMA to take trades only in the direction of a trend.
Flexible Risk Management: Users can choose number of ATR as a stop loss (by default = 1.75) for trades. This is flexible approach because ATR is recalculated on every candle, therefore stop-loss readjusted to the current volatility.
Methodology
First of all, script checks if currently price is above the 200-period exponential moving average EMA. EMA is used to establish the current trend. Script will take long trades on if this filtering system showing us the uptrend. Then the strategy executes the long trade if candle’s low below the lower Bollinger band. To calculate the middle Bollinger line, we use the standard 20-period simple moving average (SMA), lower band is calculated by the substruction from middle line the standard deviation multiplied by user given value (by default = 2).
When long trade executed, script places stop-loss at the price level below the entry price by user defined number of ATR (by default = 1.75). This stop-loss level recalculates at every candle while trade is open according to the current candle ATR value. Also strategy set the trailing profit activation level at the price above the position average price by user given number of ATR (by default = 2.25). It is also recalculated every candle according to ATR value. When price hit this level script plotted the triangle with the label “Strong Uptrend” and start trail the price at the middle Bollinger line. It also started to be plotted as a green line.
When price close below this trailing level script closes the long trade and search for the next trade opportunity.
Risk Management
The strategy employs a combined and flexible approach to risk management:
It allows positions to ride the trend as long as the price continues to move favorably, aiming to capture significant price movements. It features a user-defined ATR stop loss parameter to mitigate risks based on individual risk tolerance. By default, this stop-loss is set to a 1.75*ATR drop from the entry point, but it can be adjusted according to the trader's preferences.
There is no fixed take profit, but strategy allows user to define user the ATR trailing profit activation parameter. By default, this stop-loss is set to a 2.25*ATR growth from the entry point, but it can be adjusted according to the trader's preferences.
Justification of Methodology
This strategy leverages Bollinger bangs indicator to open long trades in the local dips. If price reached the lower band there is a high probability of bounce. Here is an issue: during the strong downtrend price can constantly goes down without any significant correction. That’s why we decided to use 200-period EMA as a trend filter to increase the probability of opening long trades during major uptrend only.
Usually, Bollinger Bands indicator is using for mean reversion or breakout strategies. Both of them have the disadvantages. The mean reversion buys the dip, but closes on the return to some mean value. Therefore, it usually misses the major trend moves. The breakout strategies usually have the issue with too high buy price because to have the breakout confirmation price shall break some price level. Therefore, in such strategies traders need to set the large stop-loss, which decreases potential reward to risk ratio.
In this strategy we are trying to combine the best features of both types of strategies. Script utilizes ate ATR to setup the stop-loss and trailing profit activation levels. ATR takes into account the current volatility. Therefore, when we setup stop-loss with the user-given number of ATR we increase the probability to decrease the number of false stop outs. The trailing profit concept is trying to add the beat feature from breakout strategies and increase probability to stay in trade while uptrend is developing. When price hit the trailing profit activation level, script started to trail the price with middle line if Bollinger bands indicator. Only when candle closes below the middle line script closes the long trade.
Backtest Results
Operating window: Date range of backtests is 2020.10.01 - 2024.07.01. It is chosen to let the strategy to close all opened positions.
Commission and Slippage: Includes a standard Binance commission of 0.1% and accounts for possible slippage over 5 ticks.
Initial capital: 10000 USDT
Percent of capital used in every trade: 30%
Maximum Single Position Loss: -9.78%
Maximum Single Profit: +25.62%
Net Profit: +6778.11 USDT (+67.78%)
Total Trades: 111 (48.65% win rate)
Profit Factor: 2.065
Maximum Accumulated Loss: 853.56 USDT (-6.60%)
Average Profit per Trade: 61.06 USDT (+1.62%)
Average Trade Duration: 76 hours
These results are obtained with realistic parameters representing trading conditions observed at major exchanges such as Binance and with realistic trading portfolio usage parameters.
How to Use
Add the script to favorites for easy access.
Apply to the desired timeframe and chart (optimal performance observed on 4h BTC/USDT).
Configure settings using the dropdown choice list in the built-in menu.
Set up alerts to automate strategy positions through web hook with the text: {{strategy.order.alert_message}}
Disclaimer:
Educational and informational tool reflecting Skyrex commitment to informed trading. Past performance does not guarantee future results. Test strategies in a simulated environment before live implementation

Advanced Trend Strategy [BITsPIP]The BITsPIP team is super excited to share our latest trading gem with you all. We're all about diving deep and ensuring our strategies can stand the test of time. So, we invite you to join us in exploring the awesome potential of this new strategy and really put it through its pace with some deep backtesting. This isn't just another strategy; it boasts a profit factor hovering around 1.5 across over 1000 trades, which is quite an achievement. Consider integrating it with your trading bots to further enhance your trading efficiency and profit generation. Curious? Ask for trial access or drop by our website for more details.
I. Deep Backtesting
We're all in on transparency and solid results, which is why we didn't stop at 100... or even 500 trades. We went over 1000, making sure this strategy is as robust as they come. No flimsy forecasts or sneaky repainting here. Just good, solid strategy that's ready for the real deal. Curious about the details? Check out our detailed backtesting screenshot for the BINANCE:BTCUSDT in a 5-minute timeframe. It's all about giving you the clear picture.
#No Overfitting
#No Repainting
Backtesting Screenshot
II. Algorithmic Trading
Thinking of trading as a manual game? Think again! Manual trading is a bit like rolling the dice - fun, but kind of risky if you're aiming for consistent wins. Instead, why not lean into the future with algorithmic trading? It's all about trusting the market's rhythm over the long term. By integrating your strategy with a trading bot, you can enjoy peace of mind, rest easy, and keep those emotional trades at bay.
III) Applications
Dive into the Advanced Trend Strategy, your versatile tool for navigating the market's waters. This strategy shines in under an hour timeframes, offering adaptability across stocks, commodities, forex, and cryptocurrencies. Initially fine-tuned for low-volatility cryptos like BINANCE:BTCUSDT , its default settings are a solid starting point.
But here's where your expertise comes into play. Each market beats to its own drum, necessitating nuanced adjustments to stop loss and take profit settings. This customization is key to maximizing the strategy's effectiveness in your chosen arena.
IV) Strategy's Logic
The Advanced Trend Strategy is a powerhouse, blending the precision of Hull Suite, RSI, and our unique trend detector technique. At its core, it’s designed for savvy risk management, aiming to lock in substantial profits while steering clear of minor market ripples. It utilizes stop-loss and take-profit thresholds to form a profit channel, providing a safety net for each trade. This is a trend-following strategy at heart, where these profit channels play a critical role in maximizing returns by securing positions within these "warranty channels."
1. Trend-Following
The market's complexity, influenced by countless factors, makes small movements seem almost chaotic. Yet, the principle of #Trend-Following shines in less volatile markets in long term. The strategy excels by pinpointing the ideal moments to enter the market, coupled with refined risk management to secure profits. It’s tailored for you, the individual trader, enabling you to ride the waves of market trends upwards or downwards.
2. Risk Management
A key facet of the strategy is its emphasis on pragmatic risk management. Traders are empowered to establish practical stop-loss and take-profit levels, tailoring these crucial parameters to the specific market they are engaging in. This customization is instrumental in optimizing long-term profitability, ensuring that the strategy adapts fluidly to the unique characteristics and volatility patterns of different trading environments.
V) Strategy's Input Settings and Default Values
1. Alerts
The strategy comes equipped with a flexible alert system designed to keep you informed and ready to act. Within the settings, you’ll find options to configure order/exit and comment/alert messages to your preference. This feature is particularly useful for staying on top of the strategy’s activities without constant manual oversight.
2. Hull Suite
i. Hull Suite Length: Designed for capturing long-term trends, the Hull Suite Length is configured at 1000. Functioning comparably to moving averages, the Hull Suite features upper and lower bands. Currently, it is set to 1000.
ii. Length Multiplier: It's advisable to maintain a minimal value for the Length Multiplier, prioritizing the optimization of the Hull Suite Length. Presently, it is set to 1.
3. RSI Indicator
i. The RSI is a widely recognized tool in trading. Adapt the oversold and overbought thresholds to better match the specifics of your market for optimal results.
4. StopLoss and TakeProfit
i. StopLoss and TakeProfit Settings: Two distinct approaches are available. Semi-Automatic StopLoss/TakeProfit Setting and Manual StopLoss/TakeProfit Setting. The Semi-Automatic mode streamlines the process by allowing you to input values for a 5-minute timeframe, subsequently auto-adjusting these values across various timeframes, both lower and higher. Conversely, the Manual mode offers full control, enabling you to meticulously define TakeProfit values for each individual timeframe.
ii. TakeProfit Threshold # and TakeProfit Value #: Imagine this mechanism as an ascending staircase. Each step represents a range, with the lower boundary (TakeProfit Value) designed to close the trade upon being reached, and the upper boundary (TakeProfit Threshold) upon being hit, propelling the trade to the next level, and forming a new range. This stair-stepping approach enhances risk management and increases profitability. The pre-set configurations are tailored for $BINANCE:BTCUSDT. It's advisable to devote time to tailoring these settings to your specific market, aiming to achieve optimal results based on backtesting.
iii. StopLoss Value: In line with its name, this value marks the limit of loss you're prepared to accept should the market trend go against your expectations. It's crucial to note that once your asset reaches the first TakeProfit range, the initial StopLoss value becomes obsolete, supplanted by the first TakeProfit Value. The default StopLoss value is pegged at 1.6(%), a figure worth considering in your trading strategy.
VI) Entry Conditions
The primary signal for entry is generated by our custom trend detection mechanism and hull suite values (ascending/descending). This is supported by additional indicators acting as confirmation.
VII) Exit Conditions
The strategy stipulates exit conditions primarily governed by stop loss and take profit parameters. On infrequent occasions, if the trend lacks confirmation post-entry, the strategy mandates an exit upon the issuance of a reverse signal (whether confirmed or unconfirmed) by the strategy itself.
BITsPIP

Octopus Nest Strategy Hello Fellas,
Hereby, I come up with a popular strategy from YouTube called Octopus Nest Strategy. It is a no repaint, lower timeframe scalping strategy utilizing PSAR, EMA and TTM Squeeze.
The strategy considers these market factors:
PSAR -> Trend
EMA -> Trend
TTM Squeeze -> Momentum and Volatility by incorporating Bollinger Bands and Keltner Channels
Note: As you can see there is a potential improvement by incorporating volume.
What's Different Compared To The Original Strategy?
I added an option which allows users to use the Adaptive PSAR of @loxx, which will hopefully improve results sometimes.
Signals
Enter Long -> source above EMA 100, source crosses above PSAR and TTM Squeeze crosses above 0
Enter Short -> source below EMA 100, source crosses below PSAR and TTM Squeeze crosses below 0
Exit Long and Exit Short are triggered from the risk management. Thus, it will just exit on SL or TP.
Risk Management
"High Low Stop Loss" and "Automatic High Low Take Profit" are used here.
High Low Stop Loss: Utilizes the last high for short and the last low for long to calculate the stop loss level. The last high or low gets multiplied by the user-defined multiplicator and if no recent high or low was found it uses the backup multiplier.
Automatic High Low Take Profit: Utilizes the current stop loss level of "High Low Stop Loss" and gets calculated by the user-defined risk ratio.
Now, follows the bunch of knowledge for the more inexperienced readers.
PSAR: Parabolic Stop And Reverse; Developed by J. Welles Wilders and a classic trend reversal indicator.
The indicator works most effectively in trending markets where large price moves allow traders to capture significant gains. When a security’s price is range-bound, the indicator will constantly be reversing, resulting in multiple low-profit or losing trades.
TTM Squeeze: TTM Squeeze is a volatility and momentum indicator introduced by John Carter of Trade the Markets (now Simpler Trading), which capitalizes on the tendency for price to break out strongly after consolidating in a tight trading range.
The volatility component of the TTM Squeeze indicator measures price compression using Bollinger Bands and Keltner Channels. If the Bollinger Bands are completely enclosed within the Keltner Channels, that indicates a period of very low volatility. This state is known as the squeeze. When the Bollinger Bands expand and move back outside of the Keltner Channel, the squeeze is said to have “fired”: volatility increases and prices are likely to break out of that tight trading range in one direction or the other. The on/off state of the squeeze is shown with small dots on the zero line of the indicator: red dots indicate the squeeze is on, and green dots indicate the squeeze is off.
EMA: Exponential Moving Average; Like a simple moving average, but with exponential weighting of the input data.
Don't forget to check out the settings and keep it up.
Best regards,
simwai
---
Credits to:
@loxx
@Bjorgum
@Greeny

Session Breakout Scalper Trading BotHi Traders !
Introduction:
I have recently been exploring the world of automated algorithmic trading (as I prefer more objective trading strategies over subjective technical analysis (TA)) and would like to share one of my automation compatible (PineConnecter compatible) scripts “Session Breakout Scalper”.
The strategy is really simple and is based on time conditional breakouts although has more ”relatively” advanced optional features such as the regime indicators (Regime Filters) that attempt to filter out noise by adding more confluence states and the ATR multiple SL that takes into account volatility to mitigate the down side risk of the trade.
What is Algorthmic Trading:
Firstly what is algorithmic trading? Algorithmic trading also known as algo-trading, is a method of using computer programs (in this case pine script) to execute trades based on predetermined rules and instructions (this trading strategy). It's like having a robot trader who follows a strict set of commands to buy and sell assets automatically, without any human intervention.
Important Note:
For Algorithmic trading the strategy will require you having an essential TV subscription at the minimum (so that you can set alerts) plus a PineConnecter subscription (scroll down to the .”How does the strategy send signals” headings to read more)
The Strategy Explained:
Is the Time input true ? (this can be changed by toggling times under the “TRADE MEDIAN TIMES” group for user inputs).
Given the above is true the strategy waits x bars after the session and then calculates the highest high (HH) to lowest low (LL) range. For this box to form, the user defined amount of bars must print after the session. The box is symmetrical meaning the HH and LL are calculated over a lookback that is equal to the sum of user defined bars before and after the session (+ 1).
The Strategy then simultaneously defines the HH as the buy level (green line) and the LL as the sell level (red line). note the strategy will set stop orders at these levels respectively.
Enter a buy if price action crosses above the HH, and then cancel the sell order type (The opposite is true for a stop order).
If the momentum based regime filters are true the strategy will check for the regime / regimes to be true, if the regime if false the strategy will exit the current trade, as the regime filter has predicted a slowing / reversal of momentum.
The image below shows the strategy executing these trading rules ( Regime filters, "Trades on chart", "Signal & Label" and "Quantity" have been omitted. "Strategy label plots" has been switched to true)
Other Strategy Rules:
If a new session (time session which is user defined) is true (blue vertical line) and the strategy is currently still in a trade it will exit that trade immediately.
It is possible to also set a range of percentage gain per day that the strategy will try to acquire, if at any point the strategy’s profit is within the percentage range then the position / trade will be exited immediately (This can be changed in the “PERCENT DAY GAIN” group for user inputs)
Stops and Targets:
The strategy has either static (fixed) or variable SL options. TP however is only static. The “STRAT TP & TP” group of user inputs is responsible for the SL and TP values (quoted in pips). Note once the ATR stop is set to true the SL values in the above group no longer have any affect on the SL as expected.
What are the Regime Filters:
The Larry Williams Large Trade Index (LWLTI): The Larry Williams Large Trade Index (LWTI) is a momentum-based technical indicator developed by iconic trader Larry Williams. It identifies potential entries and exits for trades by gauging market sentiment, particularly the buying and selling pressure from large market players. Here's a breakdown of the LWTI:
LWLTI components and their interpretation:
Oscillator: It oscillates between 0 and 100, with 50 acting as the neutral line.
Sentiment Meter: Values above 75 suggest a bearish market dominated by large selling, while readings below 25 indicate a bullish market with strong buying from large players.
Trend Confirmation: Crossing above 75 during an uptrend and below 25 during a downtrend confirms the trend's continuation.
The Andean Oscillator (AO) : The Andean Oscillator is a trend and momentum based indicator designed to measure the degree of variations within individual uptrends and downtrends in the prices.
Regime Filter States:
In trading, a regime filter is a tool used to identify the current state or "regime" of the market.
These Regime filters are integrated within the trading strategy to attempt to lower risk (equity volatility and/or draw down). The regime filters have different states for each market order type (buy and sell). When the regime filters are set to true, if these regime states fail to be true the trade is exited immediately.
For Buy Trades:
LWLTI positive momentum state: Quotient of the lagged trailing difference and the ATR > 50
AO positive momentum state: Bull line > Bear line (signal line is omitted)
For Sell Trades:
LWLTI negative momentum stat: Quotient of the lagged trailing difference and the ATR < 50
AO negative momentum state: Bull line < Bear line (signal line is omitted)
How does the Strategy Send Signals:
The strategy triggers a TV alert (you will neet to set a alert first), TV then sends a HTTP request to the automation software (PineConnecter) which receives the request and then communicates to an MT4/5 EA to automate the trading strategy.
For the strategy to send signals you must have the following
At least a TV essential subscription
This Script added to your chart
A PineConnecter account, which is paid and not free. This will provide you with the expert advisor that executes trades based on these strategies signals.
For more detailed information on the automation process I would recommend you read the PineConnecter documentation and FAQ page.
Dashboard:
This Dashboard (top right by defualt) lists some simple trading statistics and also shows when a trade is live.
Important Notice:
- USE THIS STRATEGY AT YOUR OWN RISK AND ALWAYS DO YOUR OWN RESEARCH & MANUAL BACKTESTING !
- THE STRATEGY WILL NOT EXHIBIT THE BACKTEST PERFORMANCE SEEN BELOW IN ALL MARKETS !

London BreakOut ClassicHey there, this is my first time publishing a strategy. The strategy is based on the London Breakout Idea, an incredibly popular concept with abundant information available online.
Let me summarize the London Breakout Strategy in a nutshell: It involves identifying key price levels based on the Tokyo Session before the London Session starts. Typically, these key levels are the high and low of the previous Tokyo session. If a breakout occurs during the London session, you simply follow the trend.
The purpose of this code
After conducting my research, I came across numerous posts, videos, and articles discussing the London Breakout Strategy. I aimed to automatically test it myself to verify whether the claims made by these so-called trading gurus are accurate or not. Consequently, I wrote this script to gain an understanding of how this strategy would perform if I were to follow its basic settings blindly.
Explanation of drawings on the chart:
Red or Green Box: A box is drawn on our chart displaying the exact range of the Tokyo trading session. This box is colored red if the trend during the session was downward and green if it was upward. The box is always drawn between the high and the low between 0:00 AM and 7:00 AM UTC. You can change the settings via the Inputs "Session time Tokyo" & "Session time zone".
Green Background: The green background represents the London trading session. My code allows us to make entries only during this time. If we haven't entered a trade, any pending orders are canceled. I've also programmed a timeout at 11 pm to ensure every trade is closed before the new Tokyo session begins.
Red Line: The red line is automatically placed in the middle of our previous Tokyo range. This line acts as our stop loss. If we cross this line after entering a trade but before reaching our take profit, we'll be stopped out.
When do we enter a trade?
We wait for a candle body to close outside of the previous Tokyo range to enter a trade with the opening of the next candle. We only enter one trade per day.
Where do we put our Take Profit?
The code calculates the exact distance between our entry point and the stop loss. We are trading a risk-reward ratio of 1:1 by default, meaning our take profit is always the same number of pips away from our entry as the stop loss. The Stop Loss is always defined by the red line on the chart. You can change the risk-reward ratio via the inputs setting "CRV", to see how the result changes.
What is the purpose of this script?
I wanted to backtest the London breakout strategy to see how it actually works. Therefore, I wrote this code so that everybody can test it for themselves. You can change the settings and see how the result changes. Typically, you should test this strategy on forex markets and on either 1Min, 5 Min, or 15 Min timeframe.
What are the results?
Over the last 3-6 months (over 100 trades), trading the strategy with my default settings hasn't proven to be very successful. Consequently, I do not recommend trading this strategy blindly. The purpose of this code is to provide you with a foundation for the London Breakout Strategy, allowing you to modify and enhance it according to your preferences. If you're contemplating whether to give it a try, you can assess the results from the past months by using this code as a starting point.

Captain Backtest Model [TFO]Created by @imjesstwoone and @mickey1984, this trade model attempts to capture the expansion from the 10:00-14:00 EST 4h candle using just 3 simple steps. All of the information presented in this description has been outlined by its creators, all I did was translate it to Pine Script. All core settings of the trade model may be edited so that users can test several variations, however this description will cover its default, intended behavior using NQ 5m as an example.
Step 1 is to identify our Price Range. In this case, we are concerned with the highest high and the lowest low created from 6:00-10:00 EST.
Step 2 is to wait for either the high or low of said range to be taken out. Whichever side gets taken first determines the long/short bias for the remainder of the Trade Window (i.e. if price takes the range high, bias is long, and vice versa). Bias must be determined by 11:15 EST, otherwise no trades will be taken. This filter is intended to weed out "choppy" trading days.
Step 3 is to wait for a retracement and enter with a close through the previous candle's high (if long biased) or low (if short biased). There are a couple toggleable criteria that we use to define a retracement; one is checking for opposite close candles that indicate a pullback; another is checking if price took the previous candle's low (if long biased) or high (if short biased).
This trade model was initially tested for index futures, particularly ES and NQ, using a 5m chart, however this indicator allows us to backtest any symbol on any timeframe. Creators @imjesstwoone and @mickey1984 specified a 5 point stop loss on ES and a 25 point stop loss on NQ with their testing.
I've personally found some success in backtesting NQ 5m using a 25 point stop loss and 75 point profit target (3:1 R). Enabling the Use Fixed R:R parameter will ensure that these stops and targets are utilized, otherwise it will enter and hold the position until the close of the Trade Window.

Volatility Compression Breakout - LeafAlgo Pro StrategyThe Volatility Compression Breakout strategy is designed to identify periods of low volatility followed by potential breakout opportunities in the market. It aims to capture moments when the price consolidates within a narrow range, indicating a decrease in volatility, and anticipates a subsequent expansion in price movement. This strategy is based on our indicator of the same name (), but differs by offering many more options for the band/channel type and trend filters in addition to implementing the ability to use this strategy with algorithmic plug-ins (see details at the bottom).
This strategy features six types of bands/channels and five types of trend filters, for a total of 30 combinations. The six band/channel types are the Adaptive Gaussian MA channel (based on the Adaptive Gaussian MA that we previously published ()), standard Bollinger Bands, smoothed Bollinger Bands (basis is an EMA of the typical Bollinger Basis), Keltner Channels, a Quadratic Regression Channel (based on the channel that we previously published in the LeafAlgo Pro indicator ()), and Volatility-Based Mean Reversion Bands (). The five trend filters include an EMA, SMA, Weighted MA, McGinley Dynamic, and the Adaptive Gaussian MA itself.
Examples of the different band/channel types (all with EMA as the trend filter):
Adaptive Gaussian MA Channel:
Bollinger Bands:
Smoothed Bollinger Bands:
Keltner Channels:
Quadratic Regression Channel:
Volatility-Based Mean Reversion Bands:
Examples of the different trend filters (all with Keltner Channels):
EMA:
SMA:
WMA:
McGinley Dynamic:
Adaptive Gaussian MA:
How the Long/Short Entry Signals are Calculated:
A breakout signal upwards, accompanied by a long entry, is created when the high is greater than the secondary upper band (the upper band plus a standard deviation or with a multiplier, depending on which band/channel type is selected), the latest close is above the trend filter line, and the previous close was below the trend filter line. A break downwards, accompanied by a short entry, is created when the low is below the secondary lower band, the close is below the trend filter line, and the previous close was above the trend filter line. These conditions, along with a confirmed barstate, make up the strategy entry signals.
Coloration:
When the close price is above both the middle/basis and the trend filter, the bars are colored lime green, indicating a potential bullish market sentiment. When the close price is positioned above the basis but below the trend filter, or below the basis but above the trend filter, the bars are colored yellow, signifying a neutral or indecisive market condition. Conversely, when the close price falls below both the basis and the trend filter, the bars are colored fuchsia, suggesting a potential bearish market sentiment. Additionally, the coloration of the middle/basis line and the trend filter provides further visual cues for assessing the trend. When the close price is above the basis, the line is colored lime green, indicating a bullish trend. Conversely, when the close price is below the basis, the line is colored fuchsia, highlighting a bearish trend. Similarly, the trend line is colored lime green when the close price is above it, representing a bullish trend, and fuchsia when the close price is below it, indicating a bearish trend. The fill between the primary and secondary upper bands is colored lime and the fill between the primary and secondary lower bands is colored fuchsia. These colorations can be toggled on/off in the strategy settings menu.
How Changing Parameters Can Be Beneficial:
Modifying the parameters allows you to adapt the indicator to different market conditions and trading styles. For example, with Keltner Channels, increasing the compression period can help identify broader volatility patterns and major market shifts. On the other hand, decreasing the compression period provides more precise and timely signals for short-term traders. Adjusting the compression multiplier affects the width of the Keltner Channels. Higher multipliers increase the breakout threshold, filtering out smaller price movements and providing more reliable signals during significant market shifts. Lower multipliers make the indicator more sensitive to smaller price ranges, generating more frequent but potentially less reliable signals.
Changing the type of trend filter can drastically change your results. Test out each trend filter type and determine which one will work best for your purposes. Further, the MA periods in the trend filter settings can help you align your trades with the prevailing market direction. Increasing the period smoothes out the trend, filtering out shorter-term fluctuations and focusing on more sustained moves. Decreasing the period allows for quicker responses to changes in trend, capturing shorter-term price swings.
By adjusting the parameters and incorporating additional analysis techniques, you can customize the strategy to suit your trading style and preferences. However, it is crucial to exercise caution, conduct thorough analysis, and practice proper risk management to increase the likelihood of successful trades. Remember that no strategy can guarantee profits, and continuous learning and adaptation are key to long-term trading success.
Take Profit/Stop Loss Settings:
Take profit, stop loss, and trailing percentages are also included, found at the bottom of the Input tab under “TT and TTP” as well as “Stop Loss”. The take profit and stop loss levels will be reflected as green and red lines respectively on the chart as they occur. Make sure to understand the TP/SL ratio that you desire before use, as the desired hit rate/profitability percentage will be affected accordingly. The option for adding in a trailing stop has also been included, with options to choose between an ATR-based trail or a percentage-based trail. This strategy does NOT guarantee future returns. Apply caution in trading regardless of discretionary or algorithmic. Understand the concepts of risk/reward and the intricacies of each strategy choice before utilizing them in your personal trading.
Profitview/Pineconnector Settings:
If you wish to utilize Profitview’s automation system, find the included “Profitview Settings” under the Input tab of the strategy settings menu. If not, skip this section entirely as it can be left blank. Options will be “OPEN LONG TITLE”, “OPEN SHORT TITLE”, “CLOSE LONG TITLE”, and “CLOSE SHORT TITLE”. If you wished to trade SOL, for example, you would put “SOL LONG”, “SOL SHORT”, “SOL CLOSE LONG”, and “SOL CLOSE SHORT” in these areas. Within your Profitview extension, ensure that your Alerts all match these titles. To set an alert for use with Profitview, go to the “Alerts” tab in TradingView, then create an alert. Make sure that your desired asset and timeframe are currently displayed on your screen when creating the alert. Under the “Condition” option of the alert, select the strategy, then select the expiration time. If using TradingView Premium, this can be open-ended. Otherwise, select your desired expiration time and date. This can be updated whenever desired to ensure the strategy does not expire. Under “Alert actions”, nothing necessarily needs to be selected unless so desired. Leave the “Alert name” option empty. For the “Message”, delete the generated message and replace it with {{strategy.order.alert_message}} and nothing else. If using Pineconnector, follow the same directions for setting up an alert, but use the ",buy,,risk=" syntax as noted in the tooltips.
Additional Sample Settings (for ETHUSDT-Binance 45M):
Band/Channel Type - Keltner Channels (Compression Period of 20, Multiplier of 1.8x)
Trend Filter - WMA (50 length, no offset, close as the source)
TP/SL - 3.0% TP / 2.0% SL, 0.005 trailed TP, no trailed SL

Wunder Volatility botWunder Volatility bot
We have used the Average True Range (ATR) in many of its trading versions.
1. ATR with MA. This indicator includes the ATR as well as the simple moving average, which helps to restore the expected market.
2. We apply percentage based ATR to determine how volatile the market is and whether to buy or sell at that time. For trading, we will filter the market and make trades only within the specified range. This range will adjust depending on the asset, so you will need to change the settings if you are trading multiple assets.
3. A function for calculating risk on the portfolio (your deposit) has been added to the Wunder Volatility bot script. When this option is enabled, you get a calculation of the entry amount in dollars relative to your Stop Loss. In the settings, you can select the risk percentage on your portfolio. The loss will be calculated from the amount that will be displayed on the chart.
For example, if your deposit is $1000 and you set the risk to 1%, with a Stop Loss of 5%, the entry volume will be $200. The loss at SL will be $10.10, which is your 1% risk or 1% of the deposit.
**Important!** The risk per trade must be less than the Stop Loss value. If the risk is greater than SL, then you should use leverage.
The amount of funds entering the trade is calculated in dollars. This option was created if you want to send the dollar amount from Tradingview to the exchange. However, putting your volume in dollars you get the incorrect net profit and drawdown indication in the backtest results, as TradingView calculates the backtest volume in contracts.
To display the correct net profit and drawdown values in Tradingview Backtest results, use the ”Volume in contract” option.

Rocket Grid Algorithm - The Quant ScienceThe Rocket Grid Algorithm is a trading strategy that enables traders to engage in both long and short selling strategies. The script allows traders to backtest their strategies with a date range of their choice, in addition to selecting the desired strategy - either SMA Based Crossunder or SMA Based Crossover.
The script is a combination of trend following and short-term mean reversing strategies. Trend following involves identifying the current market trend and riding it for as long as possible until it changes direction. This type of strategy can be used over a medium- to long-term time horizon, typically several months to a few years.
Short-term mean reversing, on the other hand, involves taking advantage of short-term price movements that deviate from the average price. This type of strategy is usually applied over a much shorter time horizon, such as a few days to a few weeks. By rapidly entering and exiting positions, the strategy seeks to capture small, quick gains in volatile market conditions.
Overall, the script blends the best of both worlds by combining the long-term stability of trend following with the quick gains of short-term mean reversing, allowing traders to potentially benefit from both short-term and long-term market trends.
Traders can configure the start and end dates, months, and years, and choose the length of the data they want to work with. Additionally, they can set the percentage grid and the upper and lower destroyers to manage their trades effectively. The script also calculates the Simple Moving Average of the chosen data length and plots it on the chart.
The trigger for entering a trade is defined as a crossunder or crossover of the close price with the Simple Moving Average. Once the trigger is activated, the script calculates the total percentage of the side and creates a grid range. The grid range is then divided into ten equal parts, with each part representing a unique grid level. The script keeps track of each grid level, and once the close price reaches the grid level, it opens a trade in the specified direction.
The equity management strategy in the script involves a dynamic allocation of equity to each trade. The first order placed uses 10% of the available equity, while each subsequent order uses 1% less of the available equity. This results in the allocation of 9% for the second order, 8% for the third order, and so on, until a maximum of 10 open trades. This approach allows for risk management and can help to limit potential losses.
Overall, the Rocket Grid Algorithm is a flexible and powerful trading strategy that can be customized to meet the specific needs of individual traders. Its user-friendly interface and robust backtesting capabilities make it an excellent tool for traders looking to enhance their trading experience.

Kioseff Trading - AI-Powered Strategy Optimizer Introducing the Kioseff Trading AI-Powered Strategy Optimizer
Optimize and build your trading strategy with ease, no matter your experience level. The Kioseff Trading AI-Powered Strategy Optimizer allows traders to efficiently test and refine strategies with thousands of different profit targets and stop loss settings. Integrated with TradingView's backtester, this tool simplifies strategy optimization, strategy testing, and alert setting, enabling you to enhance your strategy with AI-driven insights.
Key Features:
Comprehensive Testing : Simultaneously test thousands of profit targets and stop losses to fine-tune your strategy.
Dual Strategy Optimization : Adjust and optimize both long and short strategies for balanced performance.
AI Integration : Elevate your strategy with heuristic-based adaptive learning, turning it into a smart, AI-assisted system.
Detailed Analysis : View critical metrics like profit factor, win rate, max drawdown, and equity curve, presented in a strategy script format.
Customizable Alerts : Set alerts for the best version of your strategy.
Flexible Risk Management : Optimize various stop loss types, including profit targets, limit orders, OCO orders, trailing stops, and fixed stops.
Targeted Goals : Choose optimization goals like highest win rate, maximum net profit, or most efficient profit.
Indicator Compatibility : Integrate any strategy/indicator, whether it’s your creation, a favorite author’s, or any public TradingView indicator.
Accessible Design : Navigate a user-friendly interface suitable for traders of all skill levels. No code required.
Precision Lock-In : “Lock” your optimal profit target or stop loss to drill down into precision testing of other variables.
How it works
It's important to remember that merely having the AI-Powered Strategy Optimizer on your chart doesn't automatically provide you with the best strategy. You need to follow the AI's guidance through an iterative process to discover the optimal settings for your strategy.
The Trading Strategy Optimizer is a versatile tool tailored for both non-coding traders and seasoned algorithmic trading professionals. Let's start with no-code-required instructions on how to use the optimizer.
Instructions: How To Optimize Your Strategy Without Code
1. Build your strategy in the settings
The image above shows explanations for each key setting.
Note: This example uses the RSI indicator to initiate a long trade whenever it dips below the 30 mark.
Ensure that the indicator you wish to optimize is already applied to your chart . This enables the Trading Strategy Optimizer to interact with the indicator and finetune profit targets and stop losses effectively.
Because the indicator is plotted on the chart I can access the indicator with the Trading Strategy Optimizer and optimize profit targets and stop losses for it.
2. Leverage AI Recommendations
Optimization Prompt: After you load your strategy, the tool advises you on new TP and SL levels that could be more profitable.
When your strategy is set, the tool gives you tips for where to set your profit goal (TP) and your stop loss to help you optimize your strategy. It'll tell you if there's a better range for these settings based on past results.
Follow Suggestions: Keep updating your TP and SL according to the tool's suggestions until it says "Best Found".
Final Result: The last image shows the best settings found by the indicator.
(Optional Step 3)
3. Lock the profit target or stop loss to further fine tune your strategy
Continue following the AI’s suggestion until “Best Found” is displayed.
Note: you can select lock either your stop loss or profit target for fine tuning. For this demonstration we will lock our profit target.
Code-Required Instructions (Optional)
You can backtest more code-intensive strategies, such as harmonic patterns, traditional chart patterns, candlestick patterns, Elliot wave, etc., by coding the entry condition in your own script and loading it into the Trading Strategy Optimizer. Let's dial in on how to achieve this!
1. You must create an integer variable in your script with an initial value of "0".
2. Define your entry condition in the code. Once complete, assign the value "1" to the variable you created if the entry condition is fulfilled.
3. Plot your variable.
4. Select the plotted variable in the settings for the Trading Strategy Optimizer
The image above shows a coded entry condition for the linear regression channel (which can be any indicator). When price crosses under and closes below the lower line our variable "strategyEntryVariable" is assigned the value "1".
The Trading Strategy Optimizer will treat this change in value from "0" to "1" as an entry signal and enter long/short up to 1000 times at the price where the entry condition was fulfilled.
5. Test Your Strategy
The image above shows the completion of the process! Keep applying the steps we described. Stick with the AI's recommendations until you see “Best Found” show up.
By following these instructions, you can build, test, and optimize almost any trading indicator or strategy!
So, just note that the Trading Strategy Optimizer considers a change in value of a plotted variable from "0" to "1" as an entry signal! So long as you follow this rule you should be able to test and optimize any conceivable, Pine Script compatible strategy!
AI Mode
AI Mode incorporates Heuristic-Based Adaptive Learning to fine-tune trading strategies in a continuous manner. This feature consists of two main components:
Heuristic-Based Decision Making: The algorithm evaluates multiple versions of your strategy using specific metrics such as Profit and Loss (PNL), Win Rate, and Most Efficient Profit. These metrics act as heuristics to assist the algorithm in identifying suitable profit targets and stop losses for trade execution.
Online Learning: The algorithm updates the performance evaluations of each strategy based on incoming market data. This enables the system to adapt to current market conditions.
Incorporating both heuristic-based decision-making and online learning, this feature aims to provide a framework for trading strategy optimization.
Settings
AI Mode Aggressiveness:
Description: The "AI Mode Aggressiveness" setting allows you to fine-tune the AI's trading behavior. This setting ranges from "Low" To "High, with higher aggressiveness indicating a more assertive trading approach.
Functionality: This feature filters trading strategies based on a proprietary evaluation method. A higher setting narrows down the strategies that the AI will consider, leaning towards more aggressive trading. Conversely, a lower setting allows for a more conservative approach by broadening the pool of potential strategies.
Adaptive Learning Aggressiveness:
Description: When Adaptive Learning is enabled, the "Adaptive Learning Aggressiveness" setting controls how dynamically the AI adapts to market conditions using selected performance metrics.
Functionality: This setting impacts the AI's responsiveness to shifts in strategy performance. By adjusting this setting, you can control how quickly the AI moves away from strategies that may have been historically successful but are currently underperforming, towards strategies that are showing current promise.
Additional Settings
Optimization
Trading system optimization is immensely advantageous when executed with prudence.
Technical-oriented, mechanical trading systems work when a valid correlation is methodical to the extent that an objective, precisely-defined ruleset can consistently exploit it. If no such correlation exists, or a technical-oriented system is erroneously designed to exploit an illusory correlation (absent predictive utility), the trading system will fail.
Evaluate results practically and test parameters rigorously after discovery. Simply mining the best-performing parameters and immediately trading them is unlikely a winning strategy. Put as much effort into testing strong-performing parameters and building an accompanying system as you would any other trading strategy. Automated optimization involves curve fitting - it's the responsibility of the trader to validate a replicable sequence or correlation and the trading system that exploits it.
有料スクリプト

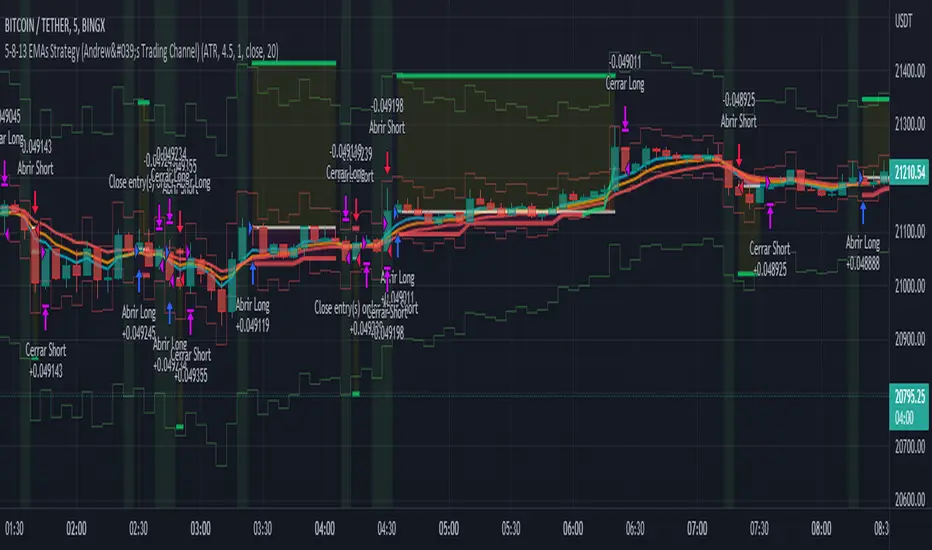
5-8-13 EMAs Strategy (Andrew's Trading Channel)============
ENGLISH
============
- Description:
This strategy was designed by "Andrew's Trading Channel" (credits to him for the base strategy).
A lot of improvements have been added to the strategy, more conditions, trailing stop, custom stop loss and take profit, everything explained below.
- CONDITIONS FOR ENTERING A LONG:
EMA 5 crossovers EMA 8.
- EXIT LONG:
EMA 8 crossovers EMA 8 and closing price goes below EMA 13.
- CONDITIONS FOR ENTERING SHORT:
EMA 8 crossovers EMA 5.
- EXIT SHORT:
EMA 5 crossovers EMA 8 and closing price goes above EMA 13.
- Visual:
All EMAs are visible (5, 8 and 13 periods) with different and customizable colors/width.
Position start price, take profit, stop loss and trailing stop (if present) are shown automatically.
Background color shows green when LONG conditions are met (and of course, position is opened on the next candle), same for SHORT but red.
- Usage and recommendations:
As this is a coded strategy, you don't even have to check for indicators, just open and close trades as the strategy shows.
There're various customizable settings like optional take profit/stop loss, trailing stop (both based on ATR or any of the EMAs), open only LONGs/SHORTs or both, date range...
Take profit and stop loss ATR default values have been tested for scalping on 5 min charts, however feel free to check strategy results and increase the winning rate/profit for your favorite asset.
- Customization:
As usual I like to make as many aspects of my indicators/strategies customizable, indicators, colors etc., feel free to ask if you feel that something that should be configurable is missing or if you have any ideas to optimize the strategy.
============
ESPAÑOL
============
- Descripción:
Esta estrategia fue diseñada por "Andrew's Trading Channel" (créditos a él por la estrategia base).
Se han añadido muchas mejoras a la estrategia, más condiciones, trailing stop, stop loss y take profit personalizados, todo explicado a continuación.
- CONDICIONES PARA ENTRAR EN LONG:
Cruce de EMA 5 con EMA 8 ascendente.
- SALIR DE LONG:
Cruce de EMA 8 con EMA 5 ascendente y el precio de cierre se sitúa por debajo de la EMA 13.
- CONDICIONES PARA ENTRAR EN SHORT:
Cruce de EMA 8 con EMA 5 ascendente.
- SALIR DE SHORT:
Cruce de EMA 5 con EMA 8 ascendente y el precio de cierre se sitúa por encima de la EMA 13.
- Visual:
Todas las EMAs son visibles (5, 8 y 13 períodos) con colores/anchos y personalizables.
El precio de inicio de la posición, el take profit, el stop loss y el trailing stop (si están presentes) se muestran automáticamente.
El color de fondo es verde cuando se cumplen las condiciones de LONG (y por supuesto, la posición se abre en la siguiente vela), lo mismo para SHORT pero en rojo.
- Uso y recomendaciones:
Como esta es una estrategia programada, ni siquiera tienes que comprobar los indicadores, sólo abrir y cerrar las operaciones como te muestra la estrategia.
Hay varios ajustes personalizables como el take profit/stop loss opcional, el trailing stop (ambos basados en el ATR o en cualquiera de las EMAs), abrir sólo LONGs/SHORTs o ambos, rango de fechas...
Los valores por defecto del take profit y el stop loss ATR han sido probados para scalping en gráficos de 5 minutos, sin embargo, siéntase libre de comprobar los resultados de la estrategia y aumentar la tasa de ganancia / beneficio para su activo favorito.
- Personalización:
Como siempre me gusta hacer personalizables todos los aspectos de mis indicadores/estrategias, indicadores, colores, etc., siéntase libre de preguntar si cree que falta algo que debería ser configurable o si tiene alguna idea para optimizar la estrategia.
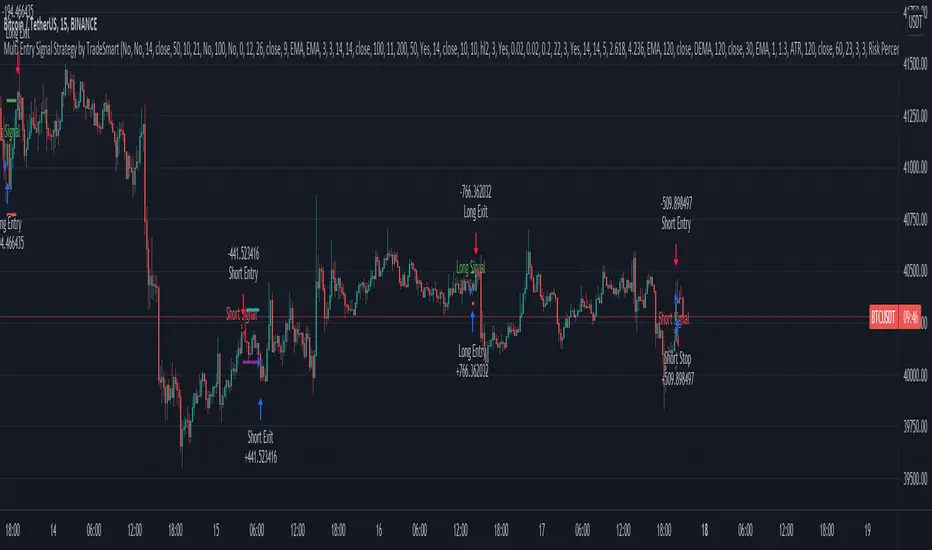
Multi Entry Signal Strategy by TradeSmartThis strategy is intended to test different entry signals. You can use 13 different entry signals in the strategy.
Available signals with all their settings:
Heikin Ashi
RSI + EMA
Wavetrend
MACD
Stochastic RSI
Squeeze Momentum
Kairi Relative Index
SSL
Supertrend
Parabolic SAR
Chandelier Exit
Directional Movement Index
Quantitative Qualitative Estimation
For exact rules of entries please relate to the tooltips of each entry signal. All the signals can be used together or separately in the strategy.
Additional settings that can be used:
Trend Filter (limit long or short entries based on a moving average of your choice)
Exit Strategy settings (ATR is used to determine stop loss and take profit levels)
Trailing Loss Setups (you can use 3 different types of trailing losses)
Setups (you can set Long and Short entries as well as the order size based on either Capital % or Risk %)
Date Range (you can limit trades to specific date ranges)
Trading Time (you can limit on which days to trade)
DayTradingFutures Cross-StrategyOVERVIEW
This indicator was designed to help beginners use a cross over strategy that can be used for entries, exits and to for trend direction.
█ COMPONENTS
Here is a brief overview of the indicator:
Weighted Moving Averages
I find that by using a weighted moving average ( WMA ) to show a crossover, is very close to using a MACD signal line cross or using a RSI signal crossing over the 50/Mid Line. In my main strategy, I use the 5period (fast) and with the crossing of the 20period (slow) WMA for entries and the 50period WMA to show the short term trend. Please note, that I use the 50 period for day trading, if you are using a swing trade or plan on holding positions long term, a higher period may be preferred . All of the moving averages are customizable by color, length, and timeframe. **I feel comfortable trading this strategy at the 5min,10min, and 15min charts.
1 — 5 WMA- this is the white moving average closest to price and is the first part of our small cloud.
2 — 20 WMA - this is the yellow moving average and is the second part of or small cloud.
3 — 50 WMA - this is the directional trend.
Moving Average Clouds
The cloud (which is optional) appears when the trader should be looking to go Long or Sell Short. The dividing line is when both the 5 and 20 periods are over the 50 period.
Trade Management
This is a tool to help with setting your stop loss, break even, and target levels. Currently you can set these based on the current ATR ( Average True Range ).
The “Buy” and “Sell” signals are the ATR indicator based on your risk tolerance (fully customizable). Different ticker symbols will require different ATR values, please back test! When applying your stop loss, drag the stop line to small arrow of the signal callout.
Trading Session
The indicator was designed for beginners to trade during the New York Session (08:30 – 16:00 CST). However, the indicator will ONLY show signals AFTER opening and BEFORE close (09:00 – 14:30 CST). The reason for this is that there is greater volatility during the open and I do not recommend to be in a trade at the end of the session.
Buy and Sell Alerts
Alerts can also be set, when an entry can be made. This prevents a person from having to watch the charts for an extended period of time.
Faults of this strategy:
Time of RANGES/CONSOLIDATION periods and EXTREME VOLITITY KILLs this strategy!! Do not trade this strategy during these periods!!
Disclaimer:
NO strategy is 100% effective! I am not responsible for any loss trades or malfunctions of this code. I recommend to paper trade any new strategy before trading with real money! I am not a financial advisor, trading can be very risky!

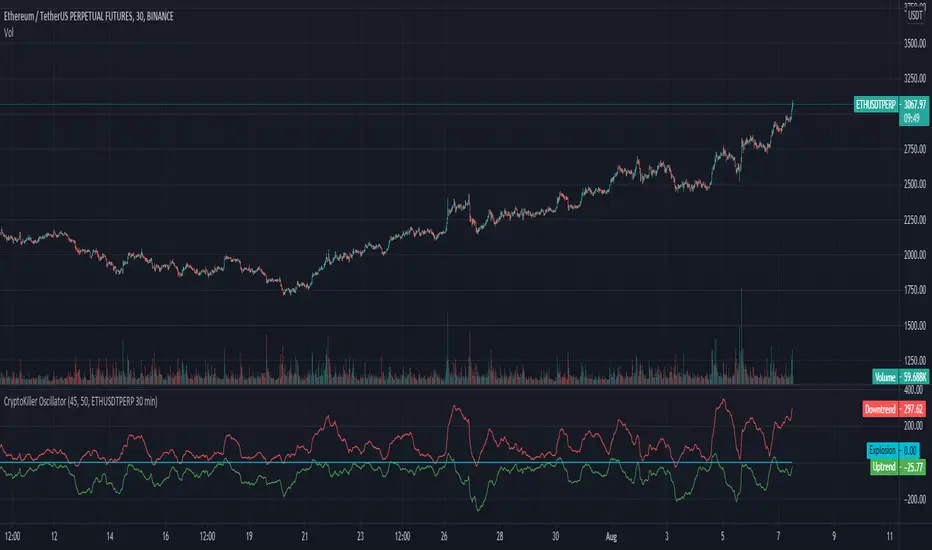
CryptoKiller OscillatorCryptoKiller Oscillator provides entry points to the CryptoKiller trading system.
The oscillator consists of 3 lines: "explosion" set to 0; "Uptrend" at the bottom and "Downtrend" at the top.
When one of the two lines identifying the uptrend or downtrend crosses the Explosion line (it affects only the crossing, not the permanence that occurs after the crossing of the trend line on the other side) there is a large probability that the price range is changing in the direction given by the oscillator.
The oscillator does not detect trend changes, but rather reveals the presence of tail events in a given direction, usually in trendfollowing (short term trend).
You can see how when Uptrend or Downtrend are away from Explosion, they have larger movements, and then reduce these movements the closer they get to the Explosion line set to 0.
If the trend is really strong, such that there is a great chance of breaking the price ranges that have been trading up to a certain point, there will be a crossing of one of the two lines indicating the trend on the Explosion line.
The tails events that are detected by the oscillator constitute the entry points of the CryptoKiller strategy.
The CryptoKiller strategy to provide the entry and exit points incorporates this oscillator in its script for obvious reasons, but we believe that by using this strategy, it is necessary to provide the oscillator to the user, so that the user can know in advance when he will have to pay a little more attention to the chart.
Access to CryptoKiller Oscillator is granted together with access to CryptoKiller (see among other published scripts).
TradeChartist Donchian Channels Breakout Strategy™TradeChartist Donchian Channels Breakout Strategy is the strategy backtester version of ™TradeChartist Donchian Channels Breakout Filter .
===================================================================================================================
Features of ™TradeChartist Donchian Channels Breakout Strategy
========================================================
Option to plot Donchian Channels of user preferred length, based on the Source price in addition to High/Low Donchian Channels.
Generates trade entries based on user preferred Breakout Price. For example, if the user prefers HL2 as breakout price, irrespective of the Donchian Channels type, trade entries are generated only when hl2 price (average of high/low) breaks out of the upper or lower band.
Option to plot background colour based on Breakout trend. The bull zones are filled with green background, the Bear zones are filled with red background and the bar that broke out is filled with orange background.
Option to colour price bars using Donchian Channels price trend. The Donchian Channels basis line is plotted using the same colours as coloured bars as default.
Note: This script does not repaint. To use the script for trade entries, wait for the bar close without Backtester or Strategy entries (with Backtester) and use a second confirmator (includes fundamentals) based on asset type as some markets require users to have good pulse on the fundamentals as trading by Technicals/price action dynamic alone may not be safe.
Note: Trend Based Stochastic of the same DC Length can be used from ™TradeChartist Risk Meter for Trade Confirmations too.
===================================================================================================================
Best Practice: Test with different settings first using Paper Trades before trading with real money
===================================================================================================================
This is not a free to use strategy. Get in touch with me (PM me directly if you would like trial access to test the strategy)
Premium Scripts - Trial access and Information
Trial access offered on all Premium scripts.
PM me directly to request trial access to the scripts or for more information.
===================================================================================================================

HFT Divergence Hunter BacktesterDefault Settings are meant to be used in BTC /USDT chart on 5 min time frame on Binance Futures . If you want to use for another asset on another time frame YOU MUST CHANGE THE SETTINGS
This is a divergence finding strategy developed by HFT Research. It is a highly customizable strategy and provides endless opportunities to find profitable trades in the market.
Default Settings are meant to be used in BTC /USDT chart on 5 min time frame on Binance Futures . If you want to use for another asset on another time frame YOU MUST CHANGE THE SETTINGS
This is a divergence finding indicator developed by HFT Research. It is a highly customizable indicator and provides endless opportunities to find profitable trades in the market.
Use Envelope , this is the main decision maker in this strategy. The idea behind is that you choose the length of the moving average and set an offset % to create an upper and lower band. If you click on “display envelope” you will be able to visually see the band you have created. This way, you get to scalp the market as the price is diverging and moving away from the moving average. As the famous saying goes, moving averages act like magnets and prices always visits them back. Using this ideology, we aim to capitilize on the price swings that move away from the chosen moving average by x%.
STARC Bands ;
These are two bands that are applied above and below a simple moving average of an asset’s price. The upper band is created by adding the value of the average true range (ATR) or a multiple of i. The lower band is created by subtracting the value of the ATR from the SMA . The channel can provide traders with ideas on when to buy or sell. During an overall uptrend, buying near the lower band and selling near the top band is favorable. However, from our testing results it does fairly poorly in crypto markets while it does pretty well in traditional markets.
Use RSI ;
One of the most commonly used indicators in the trading world. The idea is simple, buy when its oversold and sell when its overbought. You can use RSI as a secondary confirmation of the dips. It can be turned on and off.
Use MFI
MFI stands for Money Flow Index and it is an oscillator like RSI . However, it does track the price in a different fashion than RSI providing a reliable option. It uses the price and volume data for identifying overbought and oversold signals in an asset.
Use Fisher Transform
Even though, it has a funny name, Fisher is actually a very decent and reliable indicator. It converts the prices into a Gaussian normal distribution channel. Therefore, the indicator detects when the prices have moved to an extreme, based on recent price action.
Use VWAP
VWAP stands for volume weighted average price . It is an extremely useful indicator when trading intra-day. It does reset every trading session which is at 00:00 UTC . Instead of looking at x number of candles and providing an average price, it will take into consideration the volume that’s traded at a certain price and weigh it accordingly. It will NOT give entry signals but act as a filter. If the price is above VWAP will filter out the shorts and other way around for longs.
Use ADX
Average directional index is a powerful indicator when one is assessing the strength of a trend as well as measuring the volatility in the market. Unfortunately, the worst market condition for this strategy is sideways market. ADX becomes a useful tool since it can detect trend. If the volatility is low and there is no real price movement, ADX will pick that up and will not let you get in trades during a sideways market. It will allow you to enter trades only when the market is trending.
Use Super trend Filter
The indicator works well in a trending market but can give false signals when a market is trading in a range.
It uses the ATR ( average true range ) as part of its calculation which takes into account the volatility of the market. The ATR is adjusted using the multiplier setting which determines how sensitive the indicator is.
Use MA Filter
Lookback: It is an option to look back x number of candles to validate the price crossing. If the market is choppy and the price keeps crossing up and down the moving average you have chosen, it will generate a lot of “noisy” signals. This option allows you to confirm the cross by selecting how many candles the price needs to stay above or below the moving average. Setting it 0 will turn it off.
MA Filter Type: There is a selection of moving averages that is available on TradingView currently. You can choose from 14 different moving average types to detect the trend as accurate as possible.
Filter Length: You can select the length of your moving average. Most commonly used length being 50,100 and 200.
Filter Type: This is our propriety smoothing method in order to make the moving averages lag less and influence the way they are calculated slightly. Type 1 being the normal calculation and type 2 being the secret sauce .
Reverse MA Filter: This option allows you to use the moving average in reverse. For example, the strategy will go long when the price is above the moving average. However, if you use the reserve MA Filter, you will go short when the price is above the moving average. This method works best in sideways market where price usually retraces back to the moving average. So, in an anticipation of price reverting back to the moving average, it is a useful piece of option to use during sideway markets.
Use MACD Filter
MACD here will act as a filter rather than an entry signal generator. There are a few different ways to use this MACD filter. You can click on the Use MACD filter and it will use filter out the shorts generated in a bullish territory and longs generated in the bearish territory. It will greatly reduce the number of trades the strategy will trade because MACD is a lagging indicator. By the time MACD turns bullish or bearish , most of the other indicators will have already generated the signals. Therefore, resulting in less trades. You can use MACD filter as MA oscillator meaning that it will only look at the MA lines in MACD to filter out trades. Alternatively, you can use it with the histogram (Signal lines) meaning that it will only look at the histogram whether its below or above the zero line in order to filter out the trades.
TP (%)
Place your desired take profit percentage here. Default is 1.5%
Move SL At Entry x% Profit
This is when the strategy will move your SL to the entry point if the position reaches x% profit. It can also generate a signal which can be automated to adjust the SL on the exchange.
SL (%)
Place your desired stop loss percentage here. Default is 1%
The backtester assumes the following;
- 1000$ capital
- 0.06% commission based on binance
- 1% risk meaning 100% equity on cross leverage
- Backtest results are starting from 2020
If you want to get access to this indicator please DM me or visit our website.

OHO Trading Nifty50 15 Min 07.05.2020 IndicatorStudies Used:
We have used different type of moving averages, average true ranges, pivot points and relative strength indicator in this indicator.
Usage:
It can be used for scalping and intra-day trading. It works best on Nifty 15 Minutes time frame.
It provides easy to visualize multiple information:
1) It gives the correct Entry on Time.
2) Fake trends are shown on purple color of trend line.
3) Target levels.
4) It gives proper Exit on time. or Exit at the time of closing.
5) Trailing as per trend line.
How to read OHO Indicator?
Trend line color:
Red = Sell side trailing
Green = Buy side trailing
Purple = No trade zone or Trend Changing Time
Recommendations:
Trade is recommended to be closed when price is below UpTrend line (in case of buy side trade) or it is above DownTrend line (in case of sell side trade)
What time frame should I use?
15 Minutes is best time-frame, But you can check different time-frames in Strategy Testing section or as per your requirements.
Disclaimer:
Past performance is not the guarantee of future performance.
Best Indicator for range bound and volatile sessions.
For any type of queries kindly send us personal message.

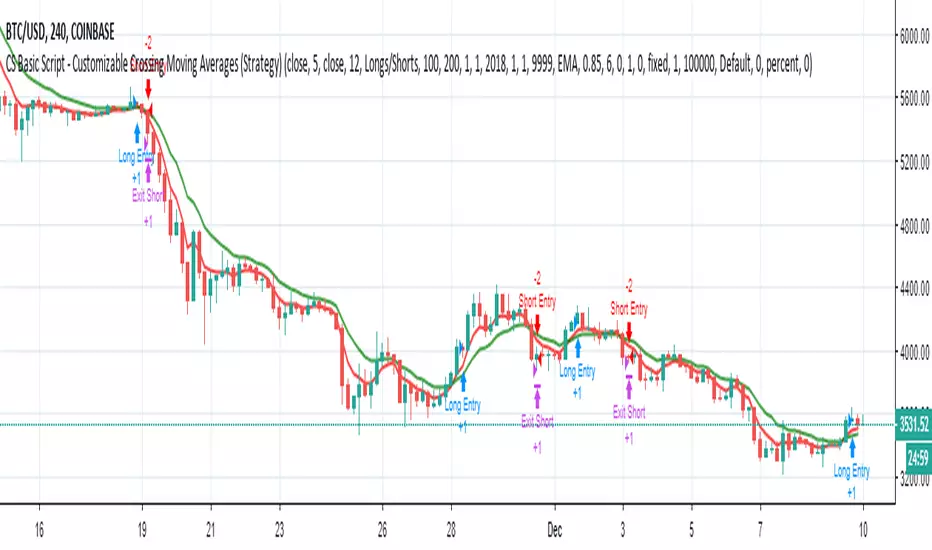
CS Basic Script - Customizable Crossing Moving AveragesThis Crossing MA Script features inputs for:
- Custom Date Range for Backtesting
- Optional Trailing Stop Loss
- Buy/Sell and Long/Short Selections
- Customizable MA Types and Ranges
- Includes EMA, SMA, WMA, ALMA, VMA, HMA, and LSMA Moving Average Types
- Ability to Enable Automated Trading with the Autoview Trading Bot Chrome Extension
For access to the Strategy Script for backtesting, simply favorite the script and add it to any TradingView chart.
For access to the Study Script for Custom Alerts and the Ability to Automize Trades through Autoview, please visit our website at www.cryptoscores.org .
Stochastic Momentum multi. strategyThe Stochastic Momentum Index (Stoch MTM, SMI) is based on the Stochastic Oscillator. The difference is that the Stochastic Oscillator calculates where the close is relative to the high/low range, while the SMI calculates where the close is relative to the midpoint of the high/low range. The values of the SMI range from +100 to -100. When the close is greater than the midpoint, the SMI is above zero, when the close is less than than the midpoint, the SMI is below zero.
The SMI is interpreted the same way as the Stochastic Oscillator. Extreme high/low SMI values indicate overbought/oversold conditions. A buy signal is generated when the SMI rises above -50, or when it crosses above the signal line. A sell signal is generated when the SMI falls below +50, or when it crosses below the signal line. Also look for divergence with the price to signal the end of a trend or indicate a false trend.
The Stochastic Momentum Index was developed by William Blau and was introduced in his article in the January, 1993 issue of Technical Analysis of Stocks & Commodities magazine.
WY Tame the Crypto MarketStrategy utilizes a combination of EMAs, RSIs, EMA of RSIs with adjustable ranges for a wide range of crypto trading flexibility.

WY Tame the Crypto MarketStrategy utilizes a combination of EMAs, RSIs, EMA of RSIs with adjustable ranges for a wide range of crypto trading flexibility.

Simple Grid Trading v1.0 [PUCHON]Simple Grid Trading v1.0
Overview
This is a Long-Only Grid Trading Strategy developed in Pine Script v6 for TradingView. It is designed to profit from market volatility by placing a series of Buy Limit orders at predefined price levels. As the price drops, the strategy accumulates positions. As the price rises, it sells these positions at a profit.
Features
Grid Types : Supports both Arithmetic (equal price spacing) and Geometric (equal percentage spacing) grids.
Flexible Order Management : Uses strategy.order for precise control and prevents duplicate orders at the same level.
Performance Dashboard : A real-time table displaying key metrics like Capital, Cashflow, and Drawdown.
Advanced Metrics : Includes Max Drawdown (MaxDD) , Avg Monthly Return , and CAGR calculations.
Customizable : Fully adjustable price range, grid lines, and lot size.
Dashboard Metrics
The dashboard (default: Bottom Right) provides a quick snapshot of the strategy's performance:
Initial Capital : The starting capital defined in the strategy settings.
Lot Size : The fixed quantity of assets purchased per grid level.
Avg. Profit per Grid : The average realized profit for each closed trade.
Cashflow : The total realized net profit (closed trades only).
MaxDD : Maximum Drawdown . The largest percentage drop in equity (realized + unrealized) from a peak.
Avg Monthly Return : The average percentage return generated per month.
CAGR : Compound Annual Growth Rate . The mean annual growth rate of the investment over the specified time period.
Strategy Settings (Inputs)
Grid Settings
Upper Price : The highest price level for the grid.
Lower Price : The lowest price level for the grid.
Number of Grid Lines : The total number of levels (lines) in the grid.
Grid Type :
Arithmetic: Distance between lines is fixed in price terms (e.g., $10, $20, $30).
Geometric: Distance between lines is fixed in percentage terms (e.g., 1%, 2%, 3%).
Lot Size : The fixed amount of the asset to buy at each level.
Dashboard Settings
Show Dashboard : Toggle to hide/show the performance table.
Position : Choose where the dashboard appears on the chart (e.g., Bottom Right, Top Left).
How It Works
Initialization : On the first bar, the script calculates the price levels based on your Upper/Lower price and Grid Type.
Entry Logic :
The strategy places Buy Limit orders at every grid level below the current price.
It checks if a position already exists at a specific level to avoid "stacking" multiple orders on the same line.
Exit Logic :
For every Buy order, a corresponding Sell Limit (Take Profit) order is placed at the next higher grid level.
MaxDD Calculation :
The script continuously tracks the highest equity peak.
It calculates the drawdown on every bar (including intra-bar movements) to ensure accuracy.
Displayed as a percentage (e.g., 5.25%).
Disclaimer
This script is for educational and backtesting purposes only. Grid trading involves significant risk, especially in strong trending markets where the price may move outside your grid range. Always use proper risk management.
