Lavender Multi-Signal Momentum StrategyOverview
The Lavender strategy is a sophisticated momentum-based trading system specifically optimized for Tesla (TSLA) on the 15-minute timeframe. It combines multiple technical signals to identify high-probability long entries during strong trending conditions.
Key Features
🎯 Multi-Signal Entry System
The strategy uses 4 distinct signal types that can be enabled/disabled individually:
Supertrend Pullback (Default: ON)
Identifies pullbacks in uptrends using Supertrend (ATR: 9, Factor: 0.5)
Enters when price retests EMA9-20 zone during bullish Supertrend
Donchian Breakout + Z-Score Momentum (Default: ON)
53-period Donchian channel breakouts
Combined with 35-period Z-Score momentum filter
Only triggers with positive momentum confirmation
Keltner Squeeze Expansion (Default: OFF)
Detects volatility squeeze conditions
Enters on breakout above Keltner Channel after compression
Opening Range Breakout (ORB) (Default: ON)
Tracks first hour range (9:30-10:30 AM)
Triggers on breakout above opening range high
🧭 Trend Regime Filter
EMA Trend Filter: 20 EMA > 100 EMA (Default: ON)
ADX Strength Filter: ADX > 22 with 15/13 smoothing (Default: ON)
Only trades when both trend conditions align
💵 Advanced Risk Management
Risk per Trade: 2.0% of capital (Default)
ATR-Based Stop Loss: 15-period ATR × 1.6 multiplier
Risk/Reward Ratio: 4:1 (Default)
Position Sizing: Automatic based on stop distance
Capital Options: Dynamic equity or fixed capital ($200,000 default)
⚙️ Execution Control
Candle Close Entries: Prevents intrabar noise (Default: ON)
Candle Close Exits: Stop loss and take profit only at bar close (Default: ON)
Trading Session: 9:00 AM - 4:00 PM (Default)
Trading Days: Monday-Saturday (Default: 123456)
Default Settings Summary
ParameterDefault ValuePurposeRisk per Trade2.0%Capital risk percentageATR Length15Stop loss calculationATR Multiplier1.6Stop distance factorRisk/Reward4.0Take profit multiplierEMA Fast20Short-term trendEMA Slow100Long-term trendADX Threshold22Minimum trend strengthMin Signals Required1Entry trigger thresholdInitial Capital$200,000Backtesting capital
How It Works
Trend Confirmation: Checks EMA alignment and ADX strength
Signal Generation: Scans for active momentum signals
Entry Execution: Enters when minimum signal threshold is met
Risk Management: Calculates position size based on ATR stop
Exit Management: Manages trades with 4:1 risk/reward ratio
Best Use Cases
Tesla (TSLA) on 15-minute charts
Trending market conditions
Intraday momentum trading
Markets with clear directional bias
Visual Indicators
Blue Line: 100-period EMA (trend filter)
Green/Red Line: Supertrend indicator
Teal Line: Donchian channel high
Purple Triangles: Keltner breakout signals
Orange Arrows: Opening range breakouts
Green Dots: Combined entry signals
Red/Green Lines: Active stop loss and take profit levels
Risk Disclaimer
This strategy is optimized for Tesla's specific price behavior on 15-minute timeframes. Past performance does not guarantee future results. Always test thoroughly and manage risk appropriately.
Created by kevloewe - Specialized for TSLA 15M momentum trading
"range"に関するスクリプトを検索

Intraday Alpha Pro - ORB + Trend/MomentumOverview
This is a pure intraday trading strategy designed for active traders seeking to capitalize on short-term price movements using two complementary modules: Opening Range Breakout (ORB) and Trend/Momentum. The strategy operates strictly within a user-defined trading session, automatically flattening all positions at session end to avoid overnight carry. It employs a points-based exit system with a trailing stop that activates only after the target is reached, ensuring disciplined risk management. Optional Martingale position sizing is included for users who prefer aggressive scaling after losses.Key Features Pure Intraday, No Carry: Trades are confined to a user-defined session (default: 9:15 AM–3:25 PM, Monday–Sunday). All positions are closed at session end.
Non-Repainting: Entries are evaluated only on confirmed bar closes (barstate.isconfirmed), ensuring no lookahead or repainting.
Dual Signal Modules: Opening Range Breakout (ORB): Captures breakouts above/below the high/low of a user-defined opening range (default: 9:15 AM–9:30 AM).
Trend/Momentum: Combines EMA (9/21) crossovers, RSI filters, volume confirmation, and an optional 200-period MA trend filter for robust trend-following signals.
Points-Based Exits: Uses fixed stop-loss (slPoints, default 16 points) and take-profit (tpPoints, default 32 points) distances. Once the take-profit level is reached, a trailing stop (trailDistPts, default 10 points) activates, ratcheting monotonically to lock in gains.
Martingale Sizing (Optional): Allows position size increases after losses (up to maxQtyInput) with a reset option after wins.
Cooldown Period: Prevents immediate re-entries after exits using a configurable cooldown (cooldownBars).
Flexible Inputs: Toggle long/short entries, enable/disable ORB or Trend/Momentum modules, and customize all parameters (e.g., MA lengths, RSI thresholds, volume multiplier).
Visuals & Alerts: Plots ORB high/low lines and moving averages (9, 21, 200). Includes alerts for long/short entries and end-of-day flattening.
How It Works Session Management: Trades only within the specified tradeSes (default: 9:15 AM–3:25 PM). The ORB module uses a separate orbSes (default: 9:15 AM–9:30 AM) to calculate breakout levels. Positions are closed automatically at session end.
Entry Conditions: ORB: Long when price closes above the ORB high after the ORB session ends; short when price closes below the ORB low.
Trend/Momentum: Long on fast MA (default EMA 9) crossing above slow MA (default EMA 21), with RSI above rsiBuy (default 55), volume exceeding volMult (default 1.5x prior bar), and price above the 200-period MA (if enabled). Shorts use the inverse.
Exit Logic: Stop-loss is set at entry price ± slPoints.
Take-profit is monitored using a running high/low since entry. Once price moves tpPoints in profit, the stop trails at trailDistPts behind the current price, adjusting only in the favorable direction (never loosening).
Exits use strategy.exit with stop only (no limit orders).
Position Sizing: Default size is baseQtyInput (minimum 1 contract). With useMartingale enabled, size increases by martingaleFactor after a loss, capped at maxQtyInput. If resetOnWin is true, size resets to baseQtyInput after a winning trade.
Cooldown: After an exit, no new trades are allowed for cooldownBars to prevent overtrading.
Futures-Safe Volume: Volume filter accommodates markets with missing or zero volume data (e.g., futures), ensuring signals aren’t blocked unnecessarily.
Inputs Trading Session: tradeSes (e.g., "0915-1525:1234567") and orbSes (e.g., "0915-0930:1234567").
Toggles: enableLong, enableShort, useORB, useTrendMom, useTrendFilter (200-MA).
Trend/Momentum: maType (EMA/SMA), fastLen (9), slowLen (21), trendLen (200), rsiLen (14), rsiBuy (55), rsiSell (45), volMult (1.5).
Exits: slPoints (16), tpPoints (32), trailDistPts (10).
Martingale: useMartingale, baseQtyInput, maxQtyInput, martingaleFactor, resetOnWin.
Cooldown: cooldownBars (1).
Legacy (Ignored): tp1RR, tp2RR, tp3RR, tp1Pct, tp2Pct, tp3Pct, stepTrail for backward compatibility.
Usage Notes Best suited for liquid, intraday markets (e.g., futures like ES, NQ, or forex pairs).
Adjust slPoints, tpPoints, and trailDistPts to match instrument volatility.
Use useMartingale cautiously, as it increases risk after losses.
Ensure tradeSes and orbSes align with your market’s trading hours.
Alerts can be set for long/short entries and EOD flattening.
The strategy avoids lookahead and repainting, ensuring reliability in live trading.
Risk Warning
Trading involves significant risk. Backtest thoroughly and use appropriate risk management. The Martingale option can amplify losses if not carefully monitored. Past performance is not indicative of future results.

Dubic EMA StrategyThe Dubic EMA Strategy is a trend-following and volatility-aware strategy that combines dual EMA filters with intelligent range and noise detection to provide clean, actionable entries. It's designed to avoid choppy markets, enhance trade precision, and adapt to different market conditions.
✅ Key Features:
Dual EMA Filter: Enters long when price is above both EMA High & EMA Low, and short when below both.
Range Filter: Avoids entries during tight consolidations or sideways markets.
Volatility Filter: Prevents trading in low-ATR conditions.
Dynamic Risk Management:
ATR-based or fixed % Stop Loss and Take Profit.
Optional Parabolic SAR trailing stop.
One Trade per Trend: Prevents re-entry until trend direction changes.
Unbroken Range Visualization: Detects and displays consolidation zones that can lead to breakouts.
Alerts & Labels: Clean BUY/SELL signals with alerts and chart labels.
🧩 Customization Options:
Adjustable EMA length
Toggle between ATR or % based SL/TP
Volatility threshold
Range detection sensitivity
Enable/disable SAR trailing stop
This strategy works best on trending assets and timeframes with volatility (e.g., crypto, forex, indices). Suitable for both manual trading and automation.
🛠️ Built for clarity, control, and precision.
📈 Backtest, optimize, and deploy with confidence.

Options Strategy V1.3📈 Options Strategy V1.3 — EMA Crossover + RSI + ATR + Opening Range
Overview:
This strategy is designed for short-term directional trades on large-cap stocks or ETFs, especially when trading options. It combines classic trend-following signals with momentum confirmation, volatility-based risk management, and session timing filters to help identify high-probability entries with predefined stop-loss and profit targets.
🔍 Strategy Components:
EMA Crossover (Fast/Slow)
Entry signals are triggered by the crossover of a short EMA above or below a long EMA — a traditional trend-following method to detect shifts in momentum.
RSI Filter
RSI confirms the signal by avoiding entries in overbought/oversold zones unless certain momentum conditions are met.
Long entry requires RSI ≥ Long Threshold
Short entry requires RSI ≤ Short Threshold
ATR-Based SL & TP
Stop-loss is set dynamically as a multiple of ATR below (long) or above (short) the entry price.
Take-profit is placed as a ratio (TP/SL) of the stop distance, ensuring consistent reward/risk structure.
Opening Range Filter (Optional)
If enabled, the strategy only triggers trades after price breaks out of the 09:30–09:45 EST range, ensuring participation in directional moves.
Session Filters
No trades from 04:00 to 09:30 and from 16:00 to 20:00 EST, avoiding low-liquidity periods.
All open trades are closed at 15:55 EST, to avoid overnight risk or expiration issues for options.
⚙️ Built-in Presets:
You can choose one of the built-in ticker-specific presets for optimal conditions:
Ticker EMAs RSI (Long/Short) ATR SL×ATR TP/SL
SPY 8/28 56 / 26 14 1.4× 4.0×
TSLA 23/27 56 / 33 13 1.4× 3.6×
AAPL 6/13 61 / 26 23 1.4× 2.1×
MSFT 25/32 54 / 26 14 1.2× 2.2×
META 25/32 53 / 26 17 1.8× 2.3×
AMZN 28/32 55 / 25 16 1.8× 2.3×
You can also choose "Custom" to fully configure all parameters to your own market and strategy preferences.
📌 Best Use Case:
This strategy is especially suited for intraday options trading, where timing and risk control are critical. It works best on liquid tickers with strong trends or clear breakout behavior.

Operator Levels by Trade InsiderOperator Levels by Trade Insider
Overview
Operator Levels by Trade Insider is a breakout trading strategy designed for intraday trading on the Nifty 50 index using a 5-minute timeframe. It identifies high-probability trade setups based on the first 5-minute candle’s price range of the day, generating target levels for long and short positions. The strategy uses a customizable Simple Moving Average (SMA) for trend filtering and a strict 1:1.5 risk-to-reward validation, making it ideal for intraday traders in the Indian equity market.
Key Features
Dynamic Target Levels: Plots two sets of target levels above and below the first 5-minute candle’s range, calculated using a proprietary volatility-based multiplier to project realistic price objectives.
Trend Filtering: Uses a user-adjustable SMA (default: 24 periods) to ensure entries align with the prevailing market trend, reducing false breakouts.
Risk-to-Reward Validation: Only executes trades with a minimum 1:1.5 risk-to-reward ratio, promoting disciplined risk management.
Clean Visualization: Displays target levels as dashed lines with color-coded labels for easy identification of trade exits (Target 1, Target 2, Stop-Loss).
Customizable Settings: Allows adjustment of SMA period, position size, and risk parameters to suit different trading styles and market conditions.
What Makes It Unique?
Unlike standard breakout strategies, Operator Levels employs a proprietary multiplier derived from volatility analysis to optimize target levels for the Nifty 50’s intraday movements. The adjustable SMA period and strict 1:1.5 risk-to-reward filter enhance entry precision, reducing noise compared to traditional range breakout systems. The strategy’s minimalist design ensures actionable signals without overwhelming the chart, tailored specifically for the fast-paced 5-minute timeframe.
How to Use
Setup: Apply on a 5-minute chart for the Nifty 50 index (e.g., NSE:NIFTY). Recommended for intraday trading.
Default Settings:
Position Size: 5% of equity per trade (adjustable via default_qty_value).
SMA Period: 24 (adjustable; e.g., set to 12 for faster signals or 50 for smoother trends).
Risk-to-Reward: 1:1.5 minimum for all trades.
Trading Process:
Long Entry: Triggered when price breaks above the first 5-minute candle’s high, is above the SMA, and meets the 1:1.5 risk-to-reward ratio.
Short Entry: Triggered when price breaks below the first 5-minute candle’s low, is below the SMA, and meets the 1:1.5 risk-to-reward ratio.
Exits: Close positions at Target 1, Target 2, or Stop-Loss, with alerts set via TradingView for real-time notifications.
Integration: Combine with volume analysis or support/resistance indicators (e.g., RSI, pivot points) for confirmation of breakouts.
Example: On a Nifty 50 5-minute chart, enter a long trade when price breaks above the first candle’s high and is above the 24-period SMA, targeting the first dashed blue line (Target 1) with a stop-loss at the first candle’s low.
Backtesting Results
Test Parameters:
Symbol: NSE:NIFTY, 5-minute timeframe
Period: 6 months (January 2025–June 2025)
Initial Capital: $10,000
Commission: 0.1% per trade
Slippage: 5 ticks
Risk per Trade: 5% of equity
Results:
Total Trades: 150
Win Rate: 62%
Average Risk-to-Reward: 1.5:1
Notes: Results are based on standard candles to ensure realistic performance. Backtest on your preferred timeframe and symbol to validate suitability.
Limitations
Trade Frequency: The 5-minute timeframe generates more trades than daily charts but may still require active market sessions (e.g., 9:15 AM–3:30 PM IST) for optimal results.
Market Conditions: Breakouts may underperform in low-volatility or ranging markets; use additional confirmation (e.g., volume spikes or Nifty 50 futures data) to filter signals.
Risk Management: While the 1:1.5 risk-to-reward ratio is conservative, traders should back test and adjust position sizing and SMA period to match their risk tolerance.

Long-Leg Doji Breakout StrategyThe Long-Leg Doji Breakout Strategy is a sophisticated technical analysis approach that capitalizes on market psychology and price action patterns.
Core Concept: The strategy identifies Long-Leg Doji candlestick patterns, which represent periods of extreme market indecision where buyers and sellers are in equilibrium. These patterns often precede significant price movements as the market resolves this indecision.
Pattern Recognition: The algorithm uses strict mathematical criteria to identify authentic Long-Leg Doji patterns. It requires the candle body to be extremely small (≤0.1% of the total range) while having long wicks on both sides (at least 2x the body size). An ATR filter ensures the pattern is significant relative to recent volatility.
Trading Logic: Once a Long-Leg Doji is identified, the strategy enters a "waiting mode," monitoring for a breakout above the doji's high (long signal) or below its low (short signal). This confirmation approach reduces false signals by ensuring the market has chosen a direction.
Risk Management: The strategy allocates 10% of equity per trade and uses a simple moving average crossover for exits. Visual indicators help traders understand the pattern identification and trade execution process.
Psychological Foundation: The strategy exploits the natural market cycle where uncertainty (represented by the doji) gives way to conviction (the breakout), creating high-probability trading opportunities.
The strength of this approach lies in its ability to identify moments when market sentiment shifts from confusion to clarity, providing traders with well-defined entry and exit points while maintaining proper risk management protocols.
How It Works
The strategy operates on a simple yet powerful principle: identify periods of market indecision, then trade the subsequent breakout when the market chooses direction.
Step 1: Pattern Detection
The algorithm scans for Long-Leg Doji candles, which have three key characteristics:
Tiny body (open and close prices nearly equal)
Long upper wick (significant rejection of higher prices)
Long lower wick (significant rejection of lower prices)
Step 2: Confirmation Wait
Once a doji is detected, the strategy doesn't immediately trade. Instead, it marks the high and low of that candle and waits for a definitive breakout.
Step 3: Trade Execution
Long Entry: When price closes above the doji's high
Short Entry: When price closes below the doji's low
Step 4: Exit Strategy
Positions are closed when price crosses back through a 20-period moving average, indicating potential trend reversal.
Market Psychology Behind It
A Long-Leg Doji represents a battlefield between bulls and bears that ends in a stalemate. The long wicks show that both sides tried to push price in their favor but failed. This creates a coiled spring effect - when one side finally gains control, the move can be explosive as trapped traders rush to exit and momentum traders jump aboard.
Key Parameters
Doji Body Threshold (0.1%): Ensures the body is truly small relative to the candle's range
Wick Ratio (2.0): Both wicks must be at least twice the body size
ATR Filter: Uses Average True Range to ensure the pattern is significant in current market conditions
Position Size: 10% of equity per trade for balanced risk management
Pros:
High Probability Setups: Doji patterns at key levels often lead to significant moves as they represent genuine shifts in market sentiment.
Clear Rules: Objective criteria for entry and exit eliminate emotional decision-making and provide consistent execution.
Risk Management: Built-in position sizing and exit rules help protect capital during losing trades.
Market Neutral: Works equally well for long and short positions, adapting to market direction rather than fighting it.
Visual Confirmation: The strategy provides clear visual cues, making it easy to understand when patterns are forming and trades are triggered.
Cons:
False Breakouts: In choppy or ranging markets, price may break the doji levels only to quickly reverse, creating whipsaws.
Patience Required: Traders must wait for both pattern formation and breakout confirmation, which can test discipline during active market periods.
Simple Exit Logic: The moving average exit may be too simplistic, potentially cutting profits short during strong trends or holding losers too long during reversals.
Volatility Dependent: The strategy relies on sufficient volatility to create meaningful doji patterns - it may underperform in extremely quiet markets.
Lagging Entries: Waiting for breakout confirmation means missing the very beginning of moves, reducing potential profit margins.
Best Market Conditions
The strategy performs optimally during periods of moderate volatility when markets are making genuine directional decisions rather than just random noise. It works particularly well around key support/resistance levels where the market's indecision is most meaningful.
Optimization Considerations
Consider combining with additional confluence factors like volume analysis, support/resistance levels, or other technical indicators to improve signal quality. The exit strategy could also be enhanced with trailing stops or multiple profit targets to better capture extended moves while protecting gains.
Best for Index option,
Enjoy !!

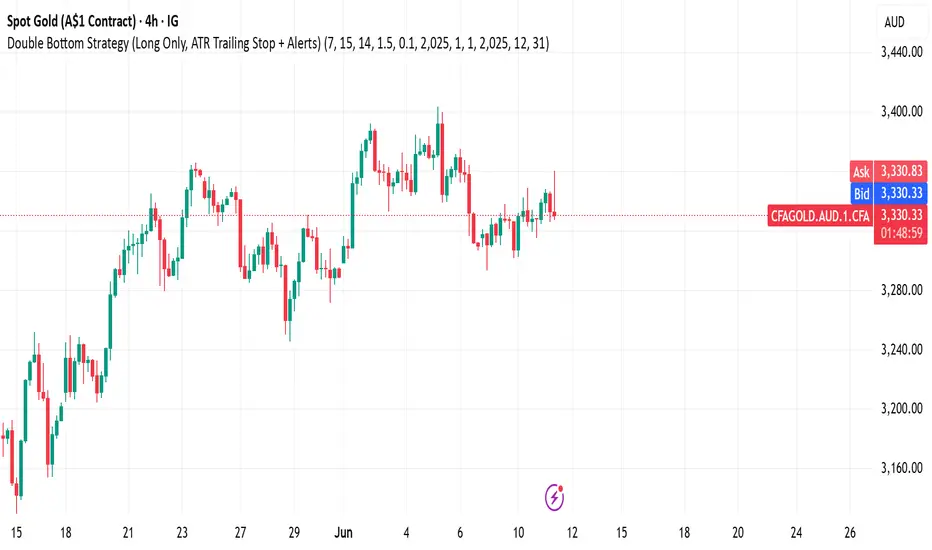
Double Bottom Strategy (Long Only, ATR Trailing Stop + Alerts)This script implements a long-only breakout strategy based on the recognition of a Double Bottom price pattern, enhanced with a 50 EMA trend filter and a dynamic ATR-based trailing stop. It is suitable for traders looking to capture reversals in trending markets using a structured pattern-based entry system.
🧠 Key Features:
Double Bottom Detection: Identifies double bottom structures using pivot lows with configurable tolerance.
ATR-Based Trailing Stop: Manages exits using a trailing stop calculated from Average True Range (ATR), dynamically adjusting to market volatility.
EMA Filter (Optional): Filters trades to only go long when price is above the 50 EMA (trend confirmation).
Alerts: Real-time alerts on entry and exit, formatted in JSON for webhook compatibility.
Backtest Range Controls: Customize historical testing period with start and end dates.
✅ Recommended Markets:
Gold (XAUUSD)
S&P 500 (SPX, ES)
Nasdaq (NDX, NQ)
Stocks (Equities)
⚠️ Not recommended for Forex due to differing behavior and noise levels in currency markets.
🛠️ User Guidance:
Tune the pivot period, tolerance, and ATR settings for best performance on your chosen asset.
Backtest thoroughly over your selected date range to assess historical effectiveness.
Use small position sizes initially to test viability in live or simulated environments.
Supertrend - SSL Strategy with Toggle [AlPashaTrader]📈 Overview of the Supertrend - SSL Strategy with Toggle Indicator
This strategy combines two powerful technical tools—Supertrend and SSL Channel—to deliver precise and reliable trading signals, designed for traders who value confirmation and risk management. 🎯
⚙️ How This Indicator Was Created
The strategy was meticulously crafted to harness the complementary strengths of:
Supertrend Indicator: A trend-following tool based on Average True Range (ATR) and a multiplier factor, it detects bullish or bearish trends by calculating dynamic support and resistance levels. 📊
SSL Channel: A channel indicator built using two Simple Moving Averages (SMA) of the highs and lows over a set period. It cleverly determines trend direction by comparing price action relative to these moving averages. 🔄
These two indicators are merged into one cohesive strategy with an optional toggle feature allowing the trader to choose whether to require confirmation from both indicators before taking a position or to act on signals from either. 🎚️
The script includes user-friendly controls for:
Defining a custom trading date range 📅, useful for backtesting or restricting trading to specific market conditions.
Setting the ATR length and multiplier for Supertrend sensitivity ⚙️.
Adjusting the SSL channel period for responsiveness to price changes ⏱️.
Choosing whether to require dual confirmation (both Supertrend and SSL signals) for more conservative trading or a single indicator trigger for a more aggressive approach 🛡️ vs ⚔️.
🔍 How This Indicator Works
Signal Generation:
Supertrend analyzes market volatility and trend direction, signaling a potential buy when the trend turns bullish 📈 and a sell when bearish 📉.
SSL Channel tracks price relative to its high and low moving averages to identify uptrends and downtrends. A crossover of the SSL Up and SSL Down lines generates buy or sell signals 🔔.
Confirmation Logic:
When confirmation is enabled, the strategy waits for agreement between both indicators before entering a trade ✅, reducing false signals.
When confirmation is disabled, it trades based on signals from either indicator ⚡, allowing more frequent entries but potentially higher risk.
Entry and Exit Rules:
Entry occurs when the indicator(s) signal a new trend direction 🚀 for long, or decline for short.
Exit happens when opposing signals appear 🛑, closing existing positions to lock in profits or cut losses.
Visual Aids:
The SSL Channel lines are plotted directly on the chart with distinct colors to intuitively show trend shifts 🎨.
The system respects the specified date range ⏳, ensuring trades only occur within user-defined periods.
🎯 How to Use This Strategy Effectively
Set Your Preferences: Adjust ATR length, factor, and SSL period to your style. More sensitive? Decrease lengths. Smoother? Increase them ⚙️.
Choose Confirmation Mode: Use the toggle depending on your risk appetite:
Confirmation ON ✅: For conservative traders wanting high-probability setups.
Confirmation OFF ⚡: For aggressive traders who want more signals.
Apply Date Filters: Focus your trading or backtesting on specific periods 📅.
Monitor Entry/Exit Signals: Watch crossovers and Supertrend changes closely 👀.
Risk Management: The strategy uses position sizing as a percentage of equity (default 15%) 💰. Adjust accordingly.
Combine with Other Tools: Enhance results by combining this with volume, price action, or fundamentals 🔧.
📝 Summary
This Supertrend - SSL Strategy with Toggle is a dynamic and flexible trading tool blending volatility-based trend detection with moving-average channel insights. It empowers traders to customize confirmation strictness, control trading periods, and efficiently capture trending opportunities while managing risk smartly.
By integrating proven indicators in a user-friendly, visually intuitive package, this strategy stands as a sophisticated tool suitable for various markets and trading styles. 🚀📊

EMA 12/26 With ATR Volatility StoplossThe EMA 12/26 With ATR Volatility Stoploss
The EMA 12/26 With ATR Volatility Stoploss strategy is a meticulously designed systematic trading approach tailored for navigating financial markets through technical analysis. By integrating the Exponential Moving Average (EMA) and Average True Range (ATR) indicators, the strategy aims to identify optimal entry and exit points for trades while prioritizing disciplined risk management. At its core, it is a trend-following system that seeks to capitalize on price momentum, employing volatility-adjusted stop-loss mechanisms and dynamic position sizing to align with predefined risk parameters. Additionally, it offers traders the flexibility to manage profits either by compounding returns or preserving initial capital, making it adaptable to diverse trading philosophies. This essay provides a comprehensive exploration of the strategy’s underlying concepts, key components, strengths, limitations, and practical applications, without delving into its technical code.
=====
Core Philosophy and Objectives
The EMA 12/26 With ATR Volatility Stoploss strategy is built on the premise of capturing short- to medium-term price trends with a high degree of automation and consistency. It leverages the crossover of two EMAs—a fast EMA (12-period) and a slow EMA (26-period)—to generate buy and sell signals, which indicate potential trend reversals or continuations. To mitigate the inherent risks of trading, the strategy incorporates the ATR indicator to set stop-loss levels that adapt to market volatility, ensuring that losses remain within acceptable bounds. Furthermore, it calculates position sizes based on a user-defined risk percentage, safeguarding capital while optimizing trade exposure.
A distinctive feature of the strategy is its dual profit management modes:
SnowBall (Compound Profit): Profits from successful trades are reinvested into the capital base, allowing for progressively larger position sizes and potential exponential portfolio growth.
ZeroRisk (Fixed Equity): Profits are withdrawn, and trades are executed using only the initial capital, prioritizing capital preservation and minimizing exposure to market downturns.
This duality caters to both aggressive traders seeking growth and conservative traders focused on stability, positioning the strategy as a versatile tool for various market environments.
=====
Key Components of the Strategy
1. EMA-Based Signal Generation
The strategy’s trend-following mechanism hinges on the interaction between the Fast EMA (12-period) and Slow EMA (26-period). EMAs are preferred over simple moving averages because they assign greater weight to recent price data, enabling quicker responses to market shifts. The key signals are:
Buy Signal: Triggered when the Fast EMA crosses above the Slow EMA, suggesting the onset of an uptrend or bullish momentum.
Sell Signal: Occurs when the Fast EMA crosses below the Slow EMA, indicating a potential downtrend or the end of a bullish phase.
To enhance signal reliability, the strategy employs an Anchor Point EMA (AP EMA), a short-period EMA (e.g., 2 days) that smooths the input price data before calculating the primary EMAs. This preprocessing reduces noise from short-term price fluctuations, improving the accuracy of trend detection. Additionally, users can opt for a Consolidated EMA (e.g., 18-period) to display a single trend line instead of both EMAs, simplifying chart analysis while retaining trend insights.
=====
2. Volatility-Adjusted Risk Management with ATR
Risk management is a cornerstone of the strategy, achieved through the use of the Average True Range (ATR), which quantifies market volatility by measuring the average price range over a specified period (e.g., 10 days). The ATR informs the placement of stop-loss levels, which are set at a multiple of the ATR (e.g., 2x ATR) below the entry price for long positions. This approach ensures that stop losses are proportionate to current market conditions—wider during high volatility to avoid premature exits, and narrower during low volatility to protect profits.
For example, if a stock’s ATR is $1 and the multiplier is 2, the stop loss for a buy at $100 would be set at $98. This dynamic adjustment enhances the strategy’s adaptability, preventing stop-outs from normal market noise while capping potential losses.
=====
3. Dynamic Position Sizing
The strategy calculates position sizes to align with a user-defined Risk Per Trade, typically expressed as a percentage of capital (e.g., 2%). The position size is determined by:
The available capital, which varies depending on whether SnowBall or ZeroRisk mode is selected.
The distance between the entry price and the ATR-based stop-loss level, which represents the per-unit risk.
The desired risk percentage, ensuring that the maximum loss per trade does not exceed the specified threshold.
For instance, with a $1,000 capital, a 2% risk per trade ($20), and a stop-loss distance equivalent to 5% of the entry price, the strategy computes the number of units (shares or contracts) to ensure the total loss, if the stop loss is hit, equals $20. To prevent over-leveraging, the strategy includes checks to ensure that the position’s dollar value does not exceed available capital. If it does, the position size is scaled down to fit within the capital constraints, maintaining financial discipline.
=====
4. Flexible Capital Management
The strategy’s dual profit management modes—SnowBall and ZeroRisk—offer traders strategic flexibility:
SnowBall Mode: By compounding profits, traders can increase their capital base, leading to larger position sizes over time. This is ideal for those with a long-term growth mindset, as it harnesses the power of exponential returns.
ZeroRisk Mode: By withdrawing profits and trading solely with the initial capital, traders protect their gains and limit exposure to market volatility. This conservative approach suits those prioritizing stability over aggressive growth.
These options allow traders to tailor the strategy to their risk tolerance, financial goals, and market outlook, enhancing its applicability across different trading styles.
=====
5. Time-Based Trade Filtering
To optimize performance and relevance, the strategy includes an option to restrict trading to a specific time range (e.g., from 2018 onward). This feature enables traders to focus on periods with favorable market conditions, avoid historically volatile or unreliable data, or align the strategy with their backtesting objectives. By confining trades to a defined timeframe, the strategy ensures that performance metrics reflect the intended market context.
=====
Strengths of the Strategy
The EMA 12/26 With ATR Volatility Stoploss strategy offers several compelling advantages:
Systematic and Objective: By adhering to predefined rules, the strategy eliminates emotional biases, ensuring consistent execution across market conditions.
Robust Risk Controls: The combination of ATR-based stop losses and risk-based position sizing caps losses at user-defined levels, fostering capital preservation.
Customizability: Traders can adjust parameters such as EMA periods, ATR multipliers, and risk percentages, tailoring the strategy to specific markets or preferences.
Volatility Adaptation: Stop losses that scale with market volatility enhance the strategy’s resilience, accommodating both calm and turbulent market phases.
Enhanced Visualization: The use of color-coded EMAs (green for bullish, red for bearish) and background shading provides intuitive visual cues, simplifying trend and trade status identification.
=====
Limitations and Considerations
Despite its strengths, the strategy has inherent limitations that traders must address:
False Signals in Range-Bound Markets: EMA crossovers may generate misleading signals in sideways or choppy markets, leading to whipsaws and unprofitable trades.
Signal Lag: As lagging indicators, EMAs may delay entry or exit signals, causing traders to miss rapid trend shifts or enter trades late.
Overfitting Risk: Excessive optimization of parameters to fit historical data can impair the strategy’s performance in live markets, as past patterns may not persist.
Impact of High Volatility: In extremely volatile markets, wider stop losses may result in larger losses than anticipated, challenging risk management assumptions.
Data Reliability: The strategy’s effectiveness depends on accurate, continuous price data, and discrepancies or gaps can undermine signal accuracy.
=====
Practical Applications
The EMA 12/26 With ATR Volatility Stoploss strategy is versatile, applicable to diverse markets such as stocks, forex, commodities, and cryptocurrencies, particularly in trending environments. To maximize its potential, traders should adopt a rigorous implementation process:
Backtesting: Evaluate the strategy’s historical performance across various market conditions to assess its robustness and identify optimal parameter settings.
Forward Testing: Deploy the strategy in a demo account to validate its real-time performance, ensuring it aligns with live market dynamics before risking capital.
Ongoing Monitoring: Continuously track trade outcomes, analyze performance metrics, and refine parameters to adapt to evolving market conditions.
Additionally, traders should consider market-specific factors, such as liquidity and volatility, when applying the strategy. For instance, highly liquid markets like forex may require tighter ATR multipliers, while less liquid markets like small-cap stocks may benefit from wider stop losses.
=====
Conclusion
The EMA 12/26 With ATR Volatility Stoploss strategy is a sophisticated, systematic trading framework that blends trend-following precision with disciplined risk management. By leveraging EMA crossovers for signal generation, ATR-based stop losses for volatility adjustment, and dynamic position sizing for risk control, it offers a balanced approach to capturing market trends while safeguarding capital. Its flexibility—evident in customizable parameters and dual profit management modes—makes it suitable for traders with varying risk appetites and objectives. However, its limitations, such as susceptibility to false signals and signal lag, necessitate thorough testing and prudent application. Through rigorous backtesting, forward testing, and continuous refinement, traders can harness this strategy to achieve consistent, risk-adjusted returns in trending markets, establishing it as a valuable tool in the arsenal of systematic trading.

Bober XM v2.0# ₿ober XM v2.0 Trading Bot Documentation
**Developer's Note**: While our previous Bot 1.3.1 was removed due to guideline violations, this setback only fueled our determination to create something even better. Rising from this challenge, Bober XM 2.0 emerges not just as an update, but as a complete reimagining with multi-timeframe analysis, enhanced filters, and superior adaptability. This adversity pushed us to innovate further and deliver a strategy that's smarter, more agile, and more powerful than ever before. Challenges create opportunity - welcome to Cryptobeat's finest work yet.
## !!!!You need to tune it for your own pair and timeframe and retune it periodicaly!!!!!
## Overview
The ₿ober XM v2.0 is an advanced dual-channel trading bot with multi-timeframe analysis capabilities. It integrates multiple technical indicators, customizable risk management, and advanced order execution via webhook for automated trading. The bot's distinctive feature is its separate channel systems for long and short positions, allowing for asymmetric trade strategies that adapt to different market conditions across multiple timeframes.
### Key Features
- **Multi-Timeframe Analysis**: Analyze price data across multiple timeframes simultaneously
- **Dual Channel System**: Separate parameter sets for long and short positions
- **Advanced Entry Filters**: RSI, Volatility, Volume, Bollinger Bands, and KEMAD filters
- **Machine Learning Moving Average**: Adaptive prediction-based channels
- **Multiple Entry Strategies**: Breakout, Pullback, and Mean Reversion modes
- **Risk Management**: Customizable stop-loss, take-profit, and trailing stop settings
- **Webhook Integration**: Compatible with external trading bots and platforms
### Strategy Components
| Component | Description |
|---------|-------------|
| **Dual Channel Trading** | Uses either Keltner Channels or Machine Learning Moving Average (MLMA) with separate settings for long and short positions |
| **MLMA Implementation** | Machine learning algorithm that predicts future price movements and creates adaptive bands |
| **Pivot Point SuperTrend** | Trend identification and confirmation system based on pivot points |
| **Three Entry Strategies** | Choose between Breakout, Pullback, or Mean Reversion approaches |
| **Advanced Filter System** | Multiple customizable filters with multi-timeframe support to avoid false signals |
| **Custom Exit Logic** | Exits based on OBV crossover of its moving average combined with pivot trend changes |
### Note for Novice Users
This is a fully featured real trading bot and can be tweaked for any ticker — SOL is just an example. It follows this structure:
1. **Indicator** – gives the initial signal
2. **Entry strategy** – decides when to open a trade
3. **Exit strategy** – defines when to close it
4. **Trend confirmation** – ensures the trade follows the market direction
5. **Filters** – cuts out noise and avoids weak setups
6. **Risk management** – controls losses and protects your capital
To tune it for a different pair, you'll need to start from scratch:
1. Select the timeframe (candle size)
2. Turn off all filters and trend entry/exit confirmations
3. Choose a channel type, channel source and entry strategy
4. Adjust risk parameters
5. Tune long and short settings for the channel
6. Fine-tune the Pivot Point Supertrend and Main Exit condition OBV
This will generate a lot of signals and activity on the chart. Your next task is to find the right combination of filters and settings to reduce noise and tune it for profitability.
### Default Strategy values
Default values are tuned for: Symbol BITGET:SOLUSDT.P 5min candle
Filters are off by default: Try to play with it to understand how it works
## Configuration Guide
### General Settings
| Setting | Description | Default Value |
|---------|-------------|---------------|
| **Long Positions** | Enable or disable long trades | Enabled |
| **Short Positions** | Enable or disable short trades | Enabled |
| **Risk/Reward Area** | Visual display of stop-loss and take-profit zones | Enabled |
| **Long Entry Source** | Price data used for long entry signals | hl2 (High+Low/2) |
| **Short Entry Source** | Price data used for short entry signals | hl2 (High+Low/2) |
The bot allows you to trade long positions, short positions, or both simultaneously. Each direction has its own set of parameters, allowing for fine-tuned strategies that recognize the asymmetric nature of market movements.
### Multi-Timeframe Settings
1. **Enable Multi-Timeframe Analysis**: Toggle 'Enable Multi-Timeframe Analysis' in the Multi-Timeframe Settings section
2. **Configure Timeframes**: Set appropriate higher timeframes based on your trading style:
- Timeframe 1: Default is now 15 minutes (intraday confirmation)
- Timeframe 2: Default is 4 hours (trend direction)
3. **Select Sources per Indicator**: For each indicator (RSI, KEMAD, Volume, etc.), choose:
- The desired timeframe (current, mtf1, or mtf2)
- The appropriate price type (open, high, low, close, hl2, hlc3, ohlc4)
### Entry Strategies
- **Breakout**: Enter when price breaks above/below the channel
- **Pullback**: Enter when price pulls back to the channel
- **Mean Reversion**: Enter when price is extended from the channel
You can enable different strategies for long and short positions.
### Core Components
### Risk Management
- **Position Size**: Control risk with percentage-based position sizing
- **Stop Loss Options**:
- Fixed: Set a specific price or percentage from entry
- ATR-based: Dynamic stop-loss based on market volatility
- Swing: Uses recent swing high/low points
- **Take Profit**: Multiple targets with percentage allocation
- **Trailing Stop**: Dynamic stop that follows price movement
## Advanced Usage Strategies
### Moving Average Type Selection Guide
- **SMA**: More stable in choppy markets, good for higher timeframes
- **EMA/WMA**: More responsive to recent price changes, better for entry signals
- **VWMA**: Adds volume weighting for stronger trends, use with Volume filter
- **HMA**: Balance between responsiveness and noise reduction, good for volatile markets
### Multi-Timeframe Strategy Approaches
- **Trend Confirmation**: Use higher timeframe RSI (mtf2) for overall trend, current timeframe for entries
- **Entry Precision**: Use KEMAD on current timeframe with volume filter on mtf1
- **False Signal Reduction**: Apply RSI filter on mtf1 with strict KEMAD settings
### Market Condition Optimization
| Market Condition | Recommended Settings |
|------------------|----------------------|
| **Trending** | Use Breakout strategy with KEMAD filter on higher timeframe |
| **Ranging** | Use Mean Reversion with strict RSI filter (mtf1) |
| **Volatile** | Increase ATR multipliers, use HMA for moving averages |
| **Low Volatility** | Decrease noise parameters, use pullback strategy |
## Webhook Integration
The strategy features a professional webhook system that allows direct connectivity to your exchange or trading platform of choice through third-party services like 3commas, Alertatron, or Autoview.
The webhook payload includes all necessary parameters for automated execution:
- Entry price and direction
- Stop loss and take profit levels
- Position size
- Custom identifier for webhook routing
## Performance Optimization Tips
1. **Start with Defaults**: Begin with the default settings for your timeframe before customizing
2. **Adjust One Component at a Time**: Make incremental changes and test the impact
3. **Match MA Types to Market Conditions**: Use appropriate moving average types based on the Market Condition Optimization table
4. **Timeframe Synergy**: Create logical relationships between timeframes (e.g., 5min chart with 15min and 4h higher timeframes)
5. **Periodic Retuning**: Markets evolve - regularly review and adjust parameters
## Common Setups
### Crypto Trend-Following
- MLMA with EMA or HMA
- Higher RSI thresholds (75/25)
- KEMAD filter on mtf1
- Breakout entry strategy
### Stock Swing Trading
- MLMA with SMA for stability
- Volume filter with higher threshold
- KEMAD with increased filter order
- Pullback entry strategy
### Forex Scalping
- MLMA with WMA and lower noise parameter
- RSI filter on current timeframe
- Use highest timeframe for trend direction only
- Mean Reversion strategy
## Webhook Configuration
- **Benefits**:
- Automated trade execution without manual intervention
- Immediate response to market conditions
- Consistent execution of your strategy
- **Implementation Notes**:
- Requires proper webhook configuration on your exchange or platform
- Test thoroughly with small position sizes before full deployment
- Consider latency between signal generation and execution
### Backtesting Period
Define a specific historical period to evaluate the bot's performance:
| Setting | Description | Default Value |
|---------|-------------|---------------|
| **Start Date** | Beginning of backtest period | January 1, 2025 |
| **End Date** | End of backtest period | December 31, 2026 |
- **Best Practice**: Test across different market conditions (bull markets, bear markets, sideways markets)
- **Limitation**: Past performance doesn't guarantee future results
## Entry and Exit Strategies
### Dual-Channel System
A key innovation of the Bober XM is its dual-channel approach:
- **Independent Parameters**: Each trade direction has its own channel settings
- **Asymmetric Trading**: Recognizes that markets often behave differently in uptrends versus downtrends
- **Optimized Performance**: Fine-tune settings for both bullish and bearish conditions
This approach allows the bot to adapt to the natural asymmetry of markets, where uptrends often develop gradually while downtrends can be sharp and sudden.
### Channel Types
#### 1. Keltner Channels
Traditional volatility-based channels using EMA and ATR:
| Setting | Long Default | Short Default |
|---------|--------------|---------------|
| **EMA Length** | 37 | 20 |
| **ATR Length** | 13 | 17 |
| **Multiplier** | 1.4 | 1.9 |
| **Source** | low | high |
- **Strengths**:
- Reliable in trending markets
- Less prone to whipsaws than Bollinger Bands
- Clear visual representation of volatility
- **Weaknesses**:
- Can lag during rapid market changes
- Less effective in choppy, non-trending markets
#### 2. Machine Learning Moving Average (MLMA)
Advanced predictive model using kernel regression (RBF kernel):
| Setting | Description | Options |
|---------|-------------|--------|
| **Source MA** | Price data used for MA calculations | Any price source (low/high/close/etc.) |
| **Moving Average Type** | Type of MA algorithm for calculations | SMA, EMA, WMA, VWMA, RMA, HMA |
| **Trend Source** | Price data used for trend determination | Any price source (close default) |
| **Window Size** | Historical window for MLMA calculations | 5+ (default: 16) |
| **Forecast Length** | Number of bars to forecast ahead | 1+ (default: 3) |
| **Noise Parameter** | Controls smoothness of prediction | 0.01+ (default: ~0.43) |
| **Band Multiplier** | Multiplier for channel width | 0.1+ (default: 0.5-0.6) |
- **Strengths**:
- Predictive rather than reactive
- Adapts quickly to changing market conditions
- Better at identifying trend reversals early
- **Weaknesses**:
- More computationally intensive
- Requires careful parameter tuning
- Can be sensitive to input data quality
### Entry Strategies
| Strategy | Description | Ideal Market Conditions |
|----------|-------------|-------------------------|
| **Breakout** | Enters when price breaks through channel bands, indicating strong momentum | High volatility, emerging trends |
| **Pullback** | Enters when price retraces to the middle band after testing extremes | Established trends with regular pullbacks |
| **Mean Reversion** | Enters at channel extremes, betting on a return to the mean | Range-bound or oscillating markets |
#### Breakout Strategy (Default)
- **Implementation**: Enters long when price crosses above the upper band, short when price crosses below the lower band
- **Strengths**: Captures strong momentum moves, performs well in trending markets
- **Weaknesses**: Can lead to late entries, higher risk of false breakouts
- **Optimization Tips**:
- Increase channel multiplier for fewer but more reliable signals
- Combine with volume confirmation for better accuracy
#### Pullback Strategy
- **Implementation**: Enters long when price pulls back to middle band during uptrend, short during downtrend pullbacks
- **Strengths**: Better entry prices, lower risk, higher probability setups
- **Weaknesses**: Misses some strong moves, requires clear trend identification
- **Optimization Tips**:
- Use with trend filters to confirm overall direction
- Adjust middle band calculation for market volatility
#### Mean Reversion Strategy
- **Implementation**: Enters long at lower band, short at upper band, expecting price to revert to the mean
- **Strengths**: Excellent entry prices, works well in ranging markets
- **Weaknesses**: Dangerous in strong trends, can lead to fighting the trend
- **Optimization Tips**:
- Implement strong trend filters to avoid counter-trend trades
- Use smaller position sizes due to higher risk nature
### Confirmation Indicators
#### Pivot Point SuperTrend
Combines pivot points with ATR-based SuperTrend for trend confirmation:
| Setting | Default Value |
|---------|---------------|
| **Pivot Period** | 25 |
| **ATR Factor** | 2.2 |
| **ATR Period** | 41 |
- **Function**: Identifies significant market turning points and confirms trend direction
- **Implementation**: Requires price to respect the SuperTrend line for trade confirmation
#### Weighted Moving Average (WMA)
Provides additional confirmation layer for entries:
| Setting | Default Value |
|---------|---------------|
| **Period** | 15 |
| **Source** | ohlc4 (average of Open, High, Low, Close) |
- **Function**: Confirms trend direction and filters out low-quality signals
- **Implementation**: Price must be above WMA for longs, below for shorts
### Exit Strategies
#### On-Balance Volume (OBV) Based Exits
Uses volume flow to identify potential reversals:
| Setting | Default Value |
|---------|---------------|
| **Source** | ohlc4 |
| **MA Type** | HMA (Options: SMA, EMA, WMA, RMA, VWMA, HMA) |
| **Period** | 22 |
- **Function**: Identifies divergences between price and volume to exit before reversals
- **Implementation**: Exits when OBV crosses its moving average in the opposite direction
- **Customizable MA Type**: Different MA types provide varying sensitivity to OBV changes:
- **SMA**: Traditional simple average, equal weight to all periods
- **EMA**: More weight to recent data, responds faster to price changes
- **WMA**: Weighted by recency, smoother than EMA
- **RMA**: Similar to EMA but smoother, reduces noise
- **VWMA**: Factors in volume, helpful for OBV confirmation
- **HMA**: Reduces lag while maintaining smoothness (default)
#### ADX Exit Confirmation
Uses Average Directional Index to confirm trend exhaustion:
| Setting | Default Value |
|---------|---------------|
| **ADX Threshold** | 35 |
| **ADX Smoothing** | 60 |
| **DI Length** | 60 |
- **Function**: Confirms trend weakness before exiting positions
- **Implementation**: Requires ADX to drop below threshold or DI lines to cross
## Filter System
### RSI Filter
- **Function**: Controls entries based on momentum conditions
- **Parameters**:
- Period: 15 (default)
- Overbought level: 71
- Oversold level: 23
- Multi-timeframe support: Current, MTF1 (15min), or MTF2 (4h)
- Customizable price source (open, high, low, close, hl2, hlc3, ohlc4)
- **Implementation**: Blocks long entries when RSI > overbought, short entries when RSI < oversold
### Volatility Filter
- **Function**: Prevents trading during excessive market volatility
- **Parameters**:
- Measure: ATR (Average True Range)
- Period: Customizable (default varies by timeframe)
- Threshold: Adjustable multiplier
- Multi-timeframe support
- Customizable price source
- **Implementation**: Blocks trades when current volatility exceeds threshold × average volatility
### Volume Filter
- **Function**: Ensures adequate market liquidity for trades
- **Parameters**:
- Threshold: 0.4× average (default)
- Measurement period: 5 (default)
- Moving average type: Customizable (HMA default)
- Multi-timeframe support
- Customizable price source
- **Implementation**: Requires current volume to exceed threshold × average volume
### Bollinger Bands Filter
- **Function**: Controls entries based on price relative to statistical boundaries
- **Parameters**:
- Period: Customizable
- Standard deviation multiplier: Adjustable
- Moving average type: Customizable
- Multi-timeframe support
- Customizable price source
- **Implementation**: Can require price to be within bands or breaking out of bands depending on strategy
### KEMAD Filter (Kalman EMA Distance)
- **Function**: Advanced trend confirmation using Kalman filter algorithm
- **Parameters**:
- Process Noise: 0.35 (controls smoothness)
- Measurement Noise: 24 (controls reactivity)
- Filter Order: 6 (higher = more smoothing)
- ATR Length: 8 (for bandwidth calculation)
- Upper Multiplier: 2.0 (for long signals)
- Lower Multiplier: 2.7 (for short signals)
- Multi-timeframe support
- Customizable visual indicators
- **Implementation**: Generates signals based on price position relative to Kalman-filtered EMA bands
## Risk Management System
### Position Sizing
Automatically calculates position size based on account equity and risk parameters:
| Setting | Default Value |
|---------|---------------|
| **Risk % of Equity** | 50% |
- **Implementation**:
- Position size = (Account equity × Risk %) ÷ (Entry price × Stop loss distance)
- Adjusts automatically based on volatility and stop placement
- **Best Practices**:
- Start with lower risk percentages (1-2%) until strategy is proven
- Consider reducing risk during high volatility periods
### Stop-Loss Methods
Multiple stop-loss calculation methods with separate configurations for long and short positions:
| Method | Description | Configuration |
|--------|-------------|---------------|
| **ATR-Based** | Dynamic stops based on volatility | ATR Period: 14, Multiplier: 2.0 |
| **Percentage** | Fixed percentage from entry | Long: 1.5%, Short: 1.5% |
| **PIP-Based** | Fixed currency unit distance | 10.0 pips |
- **Implementation Notes**:
- ATR-based stops adapt to changing market volatility
- Percentage stops maintain consistent risk exposure
- PIP-based stops provide precise control in stable markets
### Trailing Stops
Locks in profits by adjusting stop-loss levels as price moves favorably:
| Setting | Default Value |
|---------|---------------|
| **Stop-Loss %** | 1.5% |
| **Activation Threshold** | 2.1% |
| **Trailing Distance** | 1.4% |
- **Implementation**:
- Initial stop remains fixed until profit reaches activation threshold
- Once activated, stop follows price at specified distance
- Locks in profit while allowing room for normal price fluctuations
### Risk-Reward Parameters
Defines the relationship between risk and potential reward:
| Setting | Default Value |
|---------|---------------|
| **Risk-Reward Ratio** | 1.4 |
| **Take Profit %** | 2.4% |
| **Stop-Loss %** | 1.5% |
- **Implementation**:
- Take profit distance = Stop loss distance × Risk-reward ratio
- Higher ratios require fewer winning trades for profitability
- Lower ratios increase win rate but reduce average profit
### Filter Combinations
The strategy allows for simultaneous application of multiple filters:
- **Recommended Combinations**:
- Trending markets: RSI + KEMAD filters
- Ranging markets: Bollinger Bands + Volatility filters
- All markets: Volume filter as minimum requirement
- **Performance Impact**:
- Each additional filter reduces the number of trades
- Quality of remaining trades typically improves
- Optimal combination depends on market conditions and timeframe
### Multi-Timeframe Filter Applications
| Filter Type | Current Timeframe | MTF1 (15min) | MTF2 (4h) |
|-------------|-------------------|-------------|------------|
| RSI | Quick entries/exits | Intraday trend | Overall trend |
| Volume | Immediate liquidity | Sustained support | Market participation |
| Volatility | Entry timing | Short-term risk | Regime changes |
| KEMAD | Precise signals | Trend confirmation | Major reversals |
## Visual Indicators and Chart Analysis
The bot provides comprehensive visual feedback on the chart:
- **Channel Bands**: Keltner or MLMA bands showing potential support/resistance
- **Pivot SuperTrend**: Colored line showing trend direction and potential reversal points
- **Entry/Exit Markers**: Annotations showing actual trade entries and exits
- **Risk/Reward Zones**: Visual representation of stop-loss and take-profit levels
These visual elements allow for:
- Real-time strategy assessment
- Post-trade analysis and optimization
- Educational understanding of the strategy logic
## Implementation Guide
### TradingView Setup
1. Load the script in TradingView Pine Editor
2. Apply to your preferred chart and timeframe
3. Adjust parameters based on your trading preferences
4. Enable alerts for webhook integration
### Webhook Integration
1. Configure webhook URL in TradingView alerts
2. Set up receiving endpoint on your trading platform
3. Define message format matching the bot's output
4. Test with small position sizes before full deployment
### Optimization Process
1. Backtest across different market conditions
2. Identify parameter sensitivity through multiple tests
3. Focus on risk management parameters first
4. Fine-tune entry/exit conditions based on performance metrics
5. Validate with out-of-sample testing
## Performance Considerations
### Strengths
- Adaptability to different market conditions through dual channels
- Multiple layers of confirmation reducing false signals
- Comprehensive risk management protecting capital
- Machine learning integration for predictive edge
### Limitations
- Complex parameter set requiring careful optimization
- Potential over-optimization risk with so many variables
- Computational intensity of MLMA calculations
- Dependency on proper webhook configuration for execution
### Best Practices
- Start with conservative risk settings (1-2% of equity)
- Test thoroughly in demo environment before live trading
- Monitor performance regularly and adjust parameters
- Consider market regime changes when evaluating results
## Conclusion
The ₿ober XM v2.0 represents a significant evolution in trading strategy design, combining traditional technical analysis with machine learning elements and multi-timeframe analysis. The core strength of this system lies in its adaptability and recognition of market asymmetry.
### Market Asymmetry and Adaptive Approach
The strategy acknowledges a fundamental truth about markets: bullish and bearish phases behave differently and should be treated as distinct environments. The dual-channel system with separate parameters for long and short positions directly addresses this asymmetry, allowing for optimized performance regardless of market direction.
### Targeted Backtesting Philosophy
It's counterproductive to run backtests over excessively long periods. Markets evolve continuously, and strategies that worked in previous market regimes may be ineffective in current conditions. Instead:
- Test specific market phases separately (bull markets, bear markets, range-bound periods)
- Regularly re-optimize parameters as market conditions change
- Focus on recent performance with higher weight than historical results
- Test across multiple timeframes to ensure robustness
### Multi-Timeframe Analysis as a Game-Changer
The integration of multi-timeframe analysis fundamentally transforms the strategy's effectiveness:
- **Increased Safety**: Higher timeframe confirmations reduce false signals and improve trade quality
- **Context Awareness**: Decisions made with awareness of larger trends reduce adverse entries
- **Adaptable Precision**: Apply strict filters on lower timeframes while maintaining awareness of broader conditions
- **Reduced Noise**: Higher timeframe data naturally filters market noise that can trigger poor entries
The ₿ober XM v2.0 provides traders with a framework that acknowledges market complexity while offering practical tools to navigate it. With proper setup, realistic expectations, and attention to changing market conditions, it delivers a sophisticated approach to systematic trading that can be continuously refined and optimized.

Fusion Sniper X [ Crypto Strategy]📌 Fusion Sniper X — Description for TradingView
Overview:
Fusion Sniper X is a purpose-built algorithmic trading strategy designed for cryptocurrency markets, especially effective on the 1-hour chart. It combines advanced trend analysis, momentum filtering, volatility confirmation, and dynamic trade management to deliver a fast-reacting, high-precision trading system. This script is not a basic mashup of indicators, but a fully integrated strategy with logical synergy between components, internal equity management, and visual trade analytics via a customizable dashboard.
🔍 How It Works
🔸 Trend Detection – McGinley Dynamic + Gradient Slope
McGinley Dynamic is used as the baseline to reflect adaptive price action more responsively than standard moving averages.
A custom gradient filter, calculated using the slope of the McGinley line normalized by ATR, determines if the market is trending up or down.
trendUp when slope > 0
trendDown when slope < 0
🔸 Momentum Confirmation – ZLEMA-Smoothed CCI
CCI (Commodity Channel Index) is used to detect momentum strength and direction.
It is further smoothed with ZLEMA (Zero Lag EMA) to reduce noise while keeping lag minimal.
Entry is confirmed when:
CCI > 0 (Bullish momentum)
CCI < 0 (Bearish momentum)
🔸 Volume Confirmation – Relative Volume Spike Filter
Uses a 20-period EMA of volume to calculate the expected average.
Trades are only triggered if real-time volume exceeds this average by a user-defined multiplier (default: 1.5x), filtering out low-conviction signals.
🔸 Trap Detection – Wick-to-Body Reversal Filter
Filters out potential trap candles using wick-to-body ratio and body size compared to ATR.
Avoids entering on manipulative price spikes where:
Long traps show large lower wicks.
Short traps show large upper wicks.
🔸 Entry Conditions
A trade is only allowed when:
Within selected date range
Cooldown between trades is respected
Daily drawdown guard is not triggered
All of the following align:
Trend direction (McGinley slope)
Momentum confirmation (CCI ZLEMA)
Volume spike active
No trap candle detected
🎯 Trade Management Logic
✅ Take Profit (TP1/TP2 System)
TP1: 50% of the position is closed at a predefined % gain (default 2%).
TP2: Remaining 100% is closed at a higher profit level (default 4%).
🛑 Stop Loss
A fixed 2% stop loss is enforced per position using strategy.exit(..., stop=...) logic.
Stop loss is active for both TP2 and primary entries and updates the dashboard if triggered.
❄️ Cooldown & Equity Protection
A user-defined cooldown period (in bars) prevents overtrading.
A daily equity loss guard blocks new trades if portfolio drawdown exceeds a % threshold (default: 2.5%).
📊 Real-Time Dashboard (On-Chart Table)
Fusion Sniper X features a futuristic, color-coded dashboard with theme controls, showing:
Current position and entry price
Real-time profit/loss (%)
TP1, TP2, and SL status
Trend and momentum direction
Volume spike state and trap candle alerts
Trade statistics: total, win/loss, drawdown
Symbol and timeframe display
Themes include: Neon, Cyber, Monochrome, and Dark Techno.
📈 Visuals
McGinley baseline is plotted in orange for trend bias.
Bar colors reflect active positions (green for long, red for short).
Stop loss line plotted in red when active.
Background shading highlights active volume spikes.
✅ Why It’s Not Just a Mashup
Fusion Sniper X is an original system architecture built on:
Custom logic (gradient-based trend slope, wick trap rejection)
Synergistic indicator stacking (ZLEMA-smoothed momentum, ATR-based slope)
Position and equity tracking (not just signal-based plotting)
Intelligent risk control with take-profits, stop losses, cooldown, and max loss rules
An interactive dashboard that enhances usability and transparency
Every component has a distinct role in the system, and none are used as-is from public sources without modification or integration logic. The design follows a cohesive and rule-based structure for algorithmic execution.
⚠️ Disclaimer
This strategy is for educational and informational purposes only. It does not constitute financial advice. Trading cryptocurrencies involves substantial risk, and past performance is not indicative of future results. Always backtest and forward-test before using on a live account. Use at your own risk.
📅 Backtest Range & Market Conditions Note
The performance results displayed for Fusion Sniper X are based on a focused backtest period from December 1, 2024 to May 10, 2025. This range was chosen intentionally due to the dynamic and volatile nature of cryptocurrency markets, where structural and behavioral shifts can occur rapidly. By evaluating over a shorter, recent time window, the strategy is tuned to current market mechanics and avoids misleading results that could come from outdated market regimes. This ensures more realistic, forward-aligned performance — particularly important for high-frequency systems operating on the 1-hour timeframe.

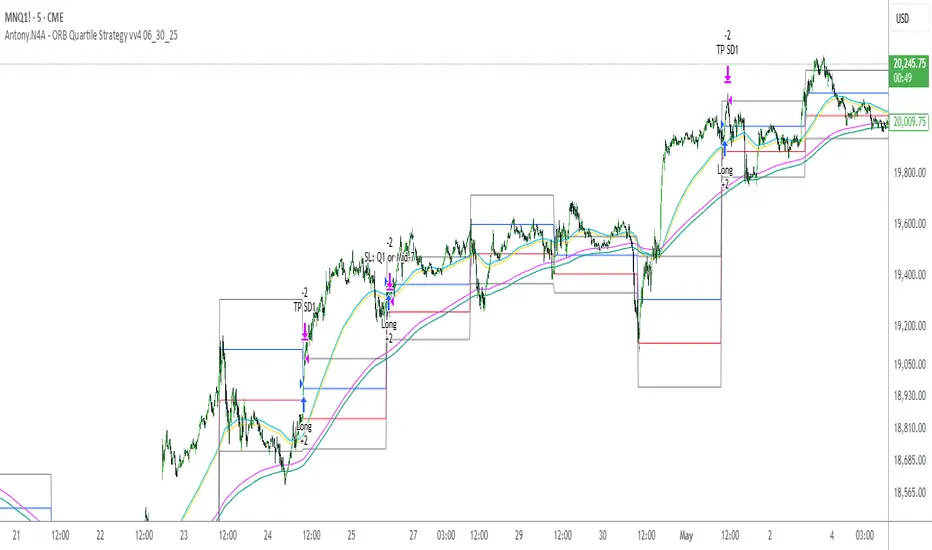
Antony.N4A - ORB Quartile Strategy vv4 06_30_25📌 Antony.N4A - ORB Quartile Strategy vv4
This script implements a fully automated Opening Range Breakout (ORB) trading strategy, engineered for precision execution within predefined market windows. It is compatible with both New York and London sessions, and integrates advanced internal logic including trend validation, breakout confirmation, position scaling, and risk-defined stop/target management.
🧠 Core Logic Overview:
ORB Range Calculation: Based on configurable session time (default: 09:30–09:45 EST)
Entry Window: Trade initiations are permitted only within a defined intraday range
Trend Validation Filters: Proprietary EMA-based mechanisms to confirm directional bias
Contract Sizing Engine: Dynamically adjusts trade size to respect a per-trade risk ceiling
Risk Parameters: Designed to cap maximum loss per trade at approximately $300–400
🎯 Trade Management Rules:
Entry:
Triggered at the close of a 5-minute candle that confirms a directional breakout of the ORB
Stop Loss:
Enforced via structural breakout invalidation levels (Quartile boundaries and mid-range buffer)
Profit Targeting:
- 75% of position is closed at the first standard deviation (SD1) level
- Remaining 25% is trailed to extended targets, with stop-loss adjusted to breakeven post-partial
No pyramiding, re-entries are limited by cooldown logic and session controls
📊 Backtest Performance (Oct 2024 – Apr 2025):
Total Trades: 36
Win Rate: 64%
Worst Losing Streak: 4 consecutive trades
Worst Month: January 2025 (-1.49R)
Net Performance: +21.5R
Strategy tested on NQ futures with NY session breakout configuration
This strategy is intended for disciplined intraday traders seeking a structured, semi-mechanical approach to volatility expansion. It is best used in high-liquidity markets and news-driven sessions.
Dskyz (DAFE) AI Adaptive Regime - Beginners VersionDskyz (DAFE) AI Adaptive Regime - Pro: Revolutionizing Trading for All
Introduction
In the fast-paced world of financial markets, traders need tools that can keep up with ever-changing conditions while remaining accessible. The Dskyz (DAFE) AI Adaptive Regime - Pro is a groundbreaking TradingView strategy that delivers advanced, AI-driven trading capabilities to everyday traders. Available on TradingView (TradingView Scripts), this Pine Script strategy combines sophisticated market analysis with user-friendly features, making it a standout choice for both novice and experienced traders.
Core Functionality
The strategy is built to adapt to different market regimes—trending, ranging, volatile, or quiet—using a robust set of technical indicators, including:
Moving Averages (MA): Fast and slow EMAs to detect trend direction.
Average True Range (ATR): For dynamic stop-loss and volatility assessment.
Relative Strength Index (RSI) and MACD: Multi-timeframe confirmation of momentum and trend.
Average Directional Index (ADX): To identify trending markets.
Bollinger Bands: For assessing volatility and range conditions.
Candlestick Patterns: Recognizes patterns like bullish engulfing, hammer, and double bottoms, confirmed by volume spikes.
It generates buy and sell signals based on a scoring system that weighs these indicators, ensuring trades align with the current market environment. The strategy also includes dynamic risk management with ATR-based stops and trailing stops, as well as performance tracking to optimize future trades.
What Sets It Apart
The Dskyz (DAFE) AI Adaptive Regime - Pro distinguishes itself from other TradingView strategies through several unique features, which we compare to common alternatives below:
| Feature | Dskyz (DAFE) | Typical TradingView Strategies|
|---------|-------------|------------------------------------------------------------|
| Regime Detection | Automatically identifies and adapts to **four** market regimes | Often static or limited to trend/range detection |
| Multi‑Timeframe Analysis | Uses higher‑timeframe RSI/MACD for confirmation | Rarely incorporates multi‑timeframe data |
| Pattern Recognition | Detects candlestick patterns **with volume confirmation** | Limited or no pattern recognition |
| Dynamic Risk Management | ATR‑based stops and trailing stops | Often uses fixed stops or basic risk rules |
| Performance Tracking | Adjusts thresholds based on past performance | Typically static parameters |
| Beginner‑Friendly Presets | Aggressive, Conservative, Optimized profiles | Requires manual parameter tuning |
| Visual Cues | Color‑coded backgrounds for regimes | Basic or no visual aids |
The Dskyz strategy’s ability to integrate regime detection, multi-timeframe analysis, and user-friendly presets makes it uniquely versatile and accessible, addressing the needs of everyday traders who want professional-grade tools without the complexity.
-Key Features and Benefits
[Why It’s Ideal for Everyday Traders
⚡The Dskyz (DAFE) AI Adaptive Regime - Pro democratizes advanced trading by offering professional-grade tools in an accessible package. Unlike many TradingView strategies that require deep technical knowledge or fail in changing market conditions, this strategy simplifies complex analysis while maintaining robustness. Its presets and visual aids make it easy for beginners to start, while its adaptive features and performance tracking appeal to advanced traders seeking an edge.
🔄Limitations and Considerations
Market Dependency: Performance varies by market and timeframe. Backtesting is essential to ensure compatibility with your trading style.
Learning Curve: While presets simplify use, understanding regimes and indicators enhances effectiveness.
No Guaranteed Profits: Like all strategies, success depends on market conditions and proper execution. The Reddit discussion highlights skepticism about TradingView strategies’ universal success (Reddit Discussion).
Instrument Specificity: Optimized for futures (e.g., ES, NQ) due to fixed tick values. Test on other instruments like stocks or forex to verify compatibility.
📌Conclusion
The Dskyz (DAFE) AI Adaptive Regime - Pro is a revolutionary TradingView strategy that empowers everyday traders with advanced, AI-driven tools. Its ability to adapt to market regimes, confirm signals across timeframes, and manage risk dynamically. sets it apart from typical strategies. By offering beginner-friendly presets and visual cues, it makes sophisticated trading accessible without sacrificing power. Whether you’re a novice looking to trade smarter or a pro seeking a competitive edge, this strategy is your ticket to mastering the markets. Add it to your chart, backtest it, and join the elite traders leveraging AI to dominate. Trade like a boss today! 🚀
Use it with discipline. Use it with clarity. Trade smarter.
**I will continue to release incredible strategies and indicators until I turn this into a brand or until someone offers me a contract.
-Dskyz

Dskyz Adaptive Futures Edge (DAFE)imgur.com/a/igj9lFj
Dskyz Adaptive Futures Edge (DAFE) is a futures trading strategy designed to adapt dynamically to market volatility and price action using a blend of technical indicators. The strategy combines adaptive moving averages, optional RSI filtering, candlestick pattern recognition, and multi-timeframe trend analysis to generate long and short trade signals. It incorporates robust risk management techniques including ATR-based stop-losses and trailing stops, ensuring trades are sized and managed within sustainable risk limits.
Key Components and Logic
-Adaptive Moving Averages
Dynamic Calculation: Fast and slow Simple Moving Averages (SMAs) adapt to changing volatility, making them sensitive to high-momentum shifts and smoothing during quieter price action.
Signal Generation: Entry signals are triggered when the fast SMA crosses the slow SMA in conjunction with price direction confirmation (e.g., price above both for long positions).
-RSI Filtering (Optional)
Momentum Confirmation: The RSI filter provides momentum confirmation to avoid overextended entries. It can be toggled on or off for both long and short conditions.
User Control: Adjustable parameters such as lookback period, oversold/overbought thresholds, and enable/disable switches give full control over its influence.
-Candlestick Pattern Recognition
Engulfing Logic: Recognizes strong bullish or bearish engulfing patterns with configurable strength criteria like range and volume. Patterns are filtered by trend direction and strength for confirmation.
Signal Conflict Handling: When both bullish and bearish engulfing patterns occur within the lookback window, the strategy avoids entry to reduce whipsaws in indecisive markets.
-Multi-Timeframe Trend Filter
Higher Timeframe Filtering: Incorporates 15-minute trend direction as a macro-level filter to align intrabar trades with larger trend momentum.
Smoothed Entry Logic: Prevents entering trades that go against the broader market structure, reducing false signals in choppy or low-conviction moves.
-Trade Execution and Risk Management
imgur.com
Entry Logic
Priority System: Users can define whether moving average signals or candlestick patterns should take priority when both are present.
Volume & Volatility Checks: Ensures sufficient market participation and action before entering a position, improving the odds of reliable follow-through.
Stop-Loss and Trailing Exit
ATR-Based Initial Stops: Dynamically adjusts stop-loss distance based on market volatility using a multiple of ATR (Average True Range), keeping risk proportional to price swings.
Trailing Stop: Protects open profits and enables winners to run by following price action at a set distance (also ATR-based).
-Cooldown Period & Minimum Bar Hold (Trade Discipline Logic)
Cooldown Bars: After an exit, the strategy imposes a mandatory pause before opening a new position.
Why: This avoids rapid-fire re-entries triggered by minor fluctuations that could lead to overtrading and degradation of profitability.
Minimum Bar Hold: A trade must be held for a minimum number of bars before it can be exited.
Why: This prevents the strategy from immediately exiting trades due to fleeting volatility spikes, which previously caused premature exits that often reversed back in favor of the original signal. This ensures trades have adequate time to develop, filtering out noise from true reversals.
-Visual Elements and Transparency Tools
Chart Overlays: Moving averages, RSI values, and trade entry/exit points are shown directly on the chart for complete visibility.
Dashboard UI: Displays critical live metrics—current position, PnL, time held, ATR values, etc.
Debug Logs: Optional toggles allow verbose condition tracking for deep inspection into why a trade occurred (or didn't), useful for both live optimization and debugging.
-Input Parameter Reference Guide
Input Name Function & Suggested Use
Use RSI Filter - Enables or disables RSI-based entry confirmation. Disable if price action alone is desired for entry decisions.
RSI Length - RSI lookback period. Lower values (e.g., 7–14) are more responsive; higher values reduce false signals.
Overbought / Oversold Levels - Used to detect exhaustion zones. E.g., avoid long entries above 70 or short entries below 30.
Use Candlestick Patterns - Enable detection of bullish/bearish engulfing patterns as trade signals. Disable to rely only on trend/MA.
Pattern Strength Thresholds (Range, Volume) - Filters out weak engulfing signals. Higher values require stronger patterns to trigger.
Use 15min Trend Filter - Adds multi-timeframe trend confirmation. Recommended for filtering entries against larger trend direction.
Fast MA - Base Length for fast adaptive moving average. Suggested: 10–25.
Slow MA - Base length for slow adaptive moving average. Suggested: 30–60.
Volatility Sensitivity Multiplier - Multiplies volatility adjustments for adaptive MA length. Higher = more reactive to volatility.
Entry Volume Filter - Filters out trades during low volume. Recommended to prevent entries in illiquid conditions.
ATR Length - Lookback period for ATR calculation. Suggested: 14.
Trailing Stop ATR Offset - Defines how far the stop-loss is from entry. 1.5–2.5 is typical for medium-volatility environments.
Trailing Stop ATR Multiplier - Determines trailing stop distance. 1.5 is tight; 3+ gives more room for trending trades.
Cooldown Bars After Exit - Prevents immediate re-entries. Suggested: 3–10 bars depending on timeframe.
Minimum Bars to Hold Trade - Ensures trades are held long enough to avoid knee-jerk exits. Suggested: 5–10 for intraday strategies.
Trading Hours (Start / End) - Sets the window of allowed trading. Prevents entries outside key session times (e.g., avoid pre-market).
Enable Logging / Debugging - Shows internal trade decision data for tuning and understanding the logic.
Compliance with TradingView Regulations
Realistic Backtesting: The strategy uses proper initial capital, fixed trade quantities, and risk parameters to reflect realistic scenarios.
Transparent Trade Logic: Every condition used for signal generation is documented and controllable by the user. Users can view each signal's rationale.
Risk Mitigation: Cooldown bars, ATR stops, and minimum trade duration ensure the strategy behaves predictably and prevents reckless trade behavior.
Customization: Full control over each module (MA, RSI, Candlestick, Trend, etc.) gives users the ability to tailor the strategy to suit various futures contracts or timeframes.
imgur.com
imgur.com
imgur.com
imgur.com
imgur.com
Summary
DAFE was built for high-stakes micro futures trading environments such as the MNQ, where milliseconds of volatility matter. This strategy's modular architecture, adaptive logic, and advanced risk controls make it an ideal framework for scalpers and swing traders alike.
BTCUSDT.P
Backtesting: www.dropbox.com
Deep Backtesting:
www.dropbox.com
****Currently testing on a prop account.
Caution Statement
This strategy is designed for educational and experimental purposes and should not be considered financial advice or a guaranteed method of profitability. While the DAFE (Dskyz Adaptive Futures Edge) strategy incorporates advanced filters, adaptive logic, and volatility-based risk management, its performance is subject to market conditions, data accuracy, and user configuration.
Futures trading involves substantial risk, and the leverage inherent in futures contracts can amplify both gains and losses. This strategy may execute trades rapidly and frequently under certain conditions—particularly when filters are disabled or thresholds are set too tightly—potentially leading to increased slippage, commissions, or unanticipated losses.
Users are strongly advised to:
Backtest thoroughly across various market regimes.
Adjust parameters responsibly and understand the implication of each input.
Paper trade in a simulated environment before going live.
Monitor trades actively and use discretion when market volatility increases.
-By using this strategy, you accept all risks and responsibility for any trading decisions made based on its output.

DrNon Action Zone📈 Strategy Title:
DrNon Action Zone — EMA Cross with ATR Stop, % Take-Profit, Alerts & Date Range
⸻
🧠 Strategy Concept:
DrNon Action Zone is a long-only trend-following strategy that enters trades when momentum aligns with long-term trend confirmation. It uses:
• EMA Cross (Fast vs. Slow) to identify momentum shift
• Optional EMA Filter based on days to confirm that price is in a “trend zone”
• ATR-based trailing stop for adaptive risk management
• Percentage Take-Profit for reward targeting
• Date Range Filter for focused backtesting or event-based execution
It also includes alerts, visual signals, and full customization via inputs.
⸻
⚙️ Strategy Inputs Explained:
Input Name Description
Fast EMA Length Period of the short-term EMA used for crossover signals (default: 5)
Slow EMA Length Period of the long-term EMA used for crossover signals (default: 200)
ATR Period Period used to calculate the Average True Range (ATR)
ATR Multiplier Multiplies ATR value to calculate the trailing stop distance
Take-Profit % Percentage above entry price to exit the trade for profit
Use EMA Filter? If enabled, long entries require price to be above a customizable EMA filter
EMA Filter Days Number of days used for EMA filter (converted to bars based on chart timeframe)
Use Date Range? Enable or disable the date filter
Start Date / End Date Specify a custom range to apply the strategy
⸻
✅ Long Entry Conditions (The Action Zone):
A long trade is entered when:
1. EMA(Fast) crosses above EMA(Slow)
2. If EMA Filter is enabled, Close > EMA(Filter Days)
3. If Date Filter is enabled, current candle is within specified start and end dates
⸻
❌ Exit Conditions:
The strategy will close the position when either:
• Price drops to ATR-based trailing stop, OR
• Price reaches the Take-Profit % target
⸻
🛎️ Alerts:
Alert Name Trigger Condition
Long Entry Alert EMA cross and all filters passed (entry signal triggered)
Exit Alert Price hit ATR Stop or Take-Profit (exit signal triggered)
⸻
📊 Visual Elements:
• Yellow Line — Fast EMA
• Blue Line — Slow EMA
• Purple Line — EMA Filter (based on user-defined days)
• Red Line — ATR-based Trailing Stop
• Lime Line — Take-Profit Level
• Green Triangle — Long Entry Signal (on crossover)
⸻
🧪 Backtesting Tips:
• Adjust EMA Filter Days to simulate different trend conditions (e.g., 100d, 150d, 200d).
• Use ATR Multiplier to adapt the stop-loss to market volatility.
• Combine date filtering with known events (e.g., earnings, FOMC meetings).
• Test in multiple timeframes — 1H, 4H, or Daily for stronger signals.
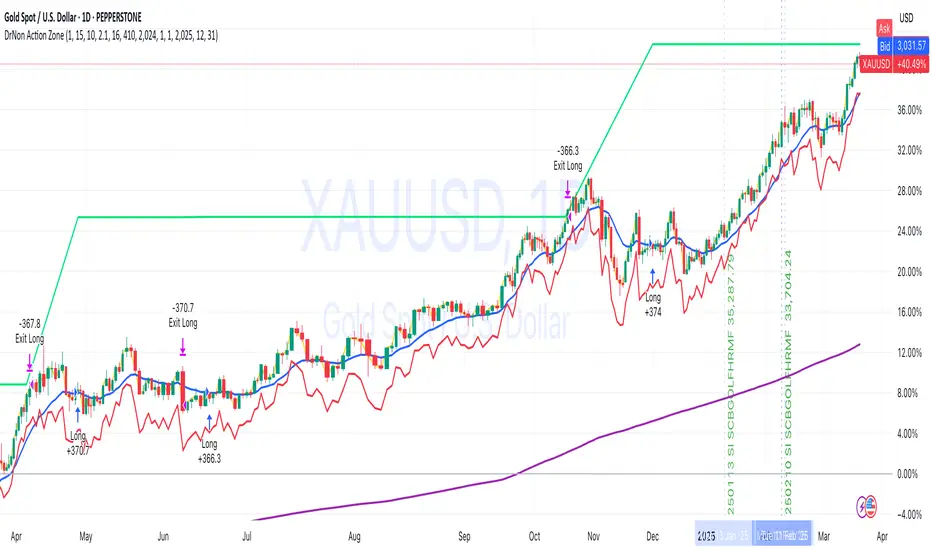
The RetrieverThis Pine Script strategy, named "The Retriever" aims to capitalize on price dips based on the size of the candlestick body. It uses a moving average of the body size to identify potential long entry points. Here's a breakdown:
Body Size Calculation: It calculates the absolute difference between the close and open prices (body) to determine the candlestick body size.
Entry Signals:
long: A long entry signal is generated when the close price is significantly higher than the moving average of the body size (ta.sma(body, 100)) multiplied by a factor (mult). Thanks to this principle we are entering just bigger dips but just in case it is sudden movement, typically dip during bulish trend.
longExtra: A second, more aggressive long entry signal is generated when the close price is even further above the moving average (multiplied by mult * 2). This signal is very rare and it is helping to decrease entry point in case huge market dips which can occor just few times per year.
Quantity Calculation: The order quantity (qty) is dynamically calculated based on the current equity and the price range between minRange and maxRange. It aims to adjust the quantity inversely to the price range, possibly increasing the quantity when the price range is smaller. It is actually very smart in several ways:
it is making bigger trades when market price is low (closer to manually defined minRange) and vice versa making smaller trades when market is close to maxRange
trade size is calculated based on current equity so it allows to use compound interest effect
as there is no SL in this strategy trade size is calculated to be max around 50-60% drawdown based on backtested results so it can survive 80-90% market drawdowns (entry point is after huge dip)
Exit Conditions: All open positions are closed when either of these conditions is met:
The last candle is green (close is lower than open). There is also minProfit param defined which is set to 0 so it means that our position has to be in profit. So we are never closing in loss. We have to differentiate here between order and position. Order can be in loss but overal position has to be always in profit.
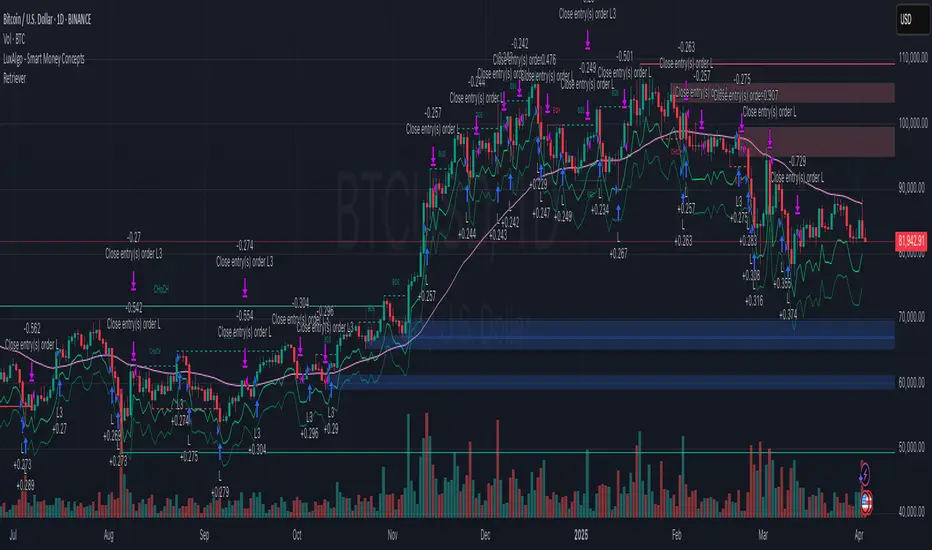
Briss Thorn XtremeStrategy Description: Briss Thorn Xtreme
The Briss Thorn Xtreme is an innovative trading strategy designed to identify and capitalize on opportunities in the forex market through advanced technical analysis and dynamic risk management. This strategy combines calculations based on RSI and ATR with time and day filters, providing customized signals and real-time alerts via Discord. Ideal for traders seeking a structured and highly customizable methodology, Briss Thorn Xtreme integrates enhanced visual tools for efficient trade management.
Key Features:
RSI and ATR-Based Signals: Utilizes smoothed RSI and ATR calculations to identify trends and measure volatility, allowing for more precise detection of buy and sell opportunities.
Dynamic Stop-Loss (SL) and Take-Profit (TP) Levels: Automatically calculates SL and TP levels based on market volatility, dynamically adjusting to optimize risk management.
Advanced Discord Integration: Sends detailed alerts to your Discord channel, including information such as the asset, signal time, entry price, and SL/TP levels, facilitating real-time decision-making.
Complete Customization: Allows users to adjust key parameters such as RSI periods, smoothing factors, liquidity thresholds, trading schedules, and operation days, adapting to different trading styles and market conditions.
Enhanced Chart Visualization: Includes visual elements like candle color changes based on trend, colored boxes for SL and TP, and a summary table of recent trades, enabling quick market interpretation.
Day and Time Operation Filters: Enables selection of specific days of the week and time slots during which signals are generated, optimizing market exposure and avoiding periods of low liquidity or unwanted high volatility.
Trade Summary: Displays a summary of the last three trades directly on the chart, indicating whether TP or SL was reached, aiding in strategy performance evaluation.
Customizable Alert Messages: Allows customization of messages sent to Discord for buy and sell signals, tailoring them to your specific preferences and requirements.
Additional Visual Tools: Highlights the operational range on the chart during permitted trading hours and colors candles based on the current trend (bullish, bearish, or neutral), enhancing visibility and decision-making.
How the Strategy Works:
Technical Indicators Calculation:
- RSI (Relative Strength Index) : Calculates RSI with a defined period and smooths it using an Exponential Moving Average (EMA) to obtain a more stable and reliable signal.
- ATR (Average True Range) : Calculates ATR adjusted by a rapid liquidity factor to measure the current market volatility, thereby determining the strength of the trend.
Generating Buy and Sell Signals:
- Buy Signal: A buy signal is generated when the liquidity index surpasses the short liquidity level, indicating potential accumulation and an upward trend.
- Sell Signal: A sell signal is generated when the liquidity index falls below the long liquidity level, indicating potential distribution and a downward trend.
- Operation Conditions: Signals are only generated on selected days and times, avoiding periods of low liquidity or unwanted high volatility.
Dynamic SL and TP Levels Calculation:
- Stop-Loss (SL) and Take-Profit (TP): SL and TP levels are calculated based on the entry price and a defined number of ticks, automatically adjusting to market volatility to optimize risk management.
- SL and TP Visualization: Colored boxes are drawn on the chart for a clear visual reference of SL and TP levels, facilitating trade management.
Automatic Execution and Alerts:
- Order Execution: Upon signal generation, the strategy automatically executes a market order (buy or sell).
- Discord Alerts: Detailed alerts are sent to the configured Discord channel, providing essential information for swift decision-making, including asset, signal time, entry price, current volatility (ATR), and trend direction.
Trade Management and Monitoring:
- Trade Summary: A table on the chart displays a summary of the last three trades (Today, Yesterday, Day Before Yesterday), indicating whether TP or SL was reached, allowing real-time performance evaluation.
- Automatic Trade Closure: The strategy automatically closes trades upon reaching the established SL or TP levels, ensuring efficient risk management and preventing excessive losses.
Additional Visualization:
- Candle Coloring by Trend: Candles are colored based on the current trend (bullish, bearish, or neutral), facilitating quick identification of market direction.
- Operational Range Highlighting: The chart background is colored during permitted trading hours, highlighting active periods of the strategy and enhancing trade visibility.
---
Strategy Properties (Important)
This backtest is conducted on M17 EURUSD using the following backtesting properties:
Initial Capital: $1000
Order Size: 1% of capital
Commission: $0.20 per order
Slippage: 1 tick
Pyramiding: 1 order
Price Verification for Limit Orders: 0 ticks
Recalculate on Order Execution: Enabled
Recalculate on Every Tick: Enabled
Recalculate After Order Execution: Enabled
Bar Magnifier for Backtesting Precision: Enabled
These properties ensure a realistic preview of the backtesting system. Note that default properties may vary for different reasons:
Order Size: It is essential to calculate the contract size according to the traded asset and desired risk level.
Commission and Slippage: These costs may vary depending on the market and instrument; there is no default value that guarantees realistic results.
All users are strongly recommended to adjust the properties within the script settings to align them with their trading accounts and platforms, ensuring that strategy results are realistic.
---
Backtesting Results:
- Net Profit: $327.90 (32.79%)
- Total Closed Trades: 162
- Profit Percentage: 35.80%
- Profit Factor: 1.298
- Maximum Drawdown: $146.70 (10.27%)
- Average per Trade: $2.02 (0.02%)
- Average Bars per Trade: 22
These results were obtained under the mentioned conditions and properties, providing an overview of the strategy's historical performance.
---
Interpretation of Results:
- The strategy has demonstrated profitability over the analyzed period, albeit with a success rate of 32.79%, indicating that success depends on a favorable risk-reward ratio.
- The profit factor of 1.298 suggests that total gains exceed total losses by this proportion.
- It is crucial to consider the maximum drawdown of 10.27% when evaluating the strategy's suitability to your risk tolerance.
---
Risk Warning:
Trading with leveraged financial instruments involves a high level of risk and may not be suitable for all investors. Before deciding to trade, you should carefully consider your investment objectives, level of experience, and risk tolerance. Past performance does not guarantee future results. It is essential to perform additional testing and adjust the strategy according to your needs.
---
What Makes This Strategy Original?
Unique RSI and Liquidity Focus: Unlike conventional strategies, Briss Thorn Xtreme focuses on combining RSI analysis with liquidity parameters to reflect institutional activity and macroeconomic events that may influence the market.
Advanced Technological Integration: The combination of automatic execution and customized alerts via Discord provides an efficient and modern tool for active traders.
Customization and Adaptability: The wide range of adjustable parameters allows the strategy to adapt to different assets, time zones, and trading styles, offering flexibility and complete user control.
Enhanced Visual Tools: Integrated visual elements, such as candle coloring, SL/TP boxes, and summary tables, facilitate quick market interpretation and informed decision-making.
---
Additional Considerations
Continuous Testing and Optimization: Users are advised to perform additional backtests and optimize parameters based on their own observations and requirements.
Complementary Analysis: Use this strategy in conjunction with other indicators and fundamental analysis tools to reinforce decision-making and confirm generated signals.
Rigorous Risk Management: Ensure that SL and TP levels, as well as position sizes, are aligned with your risk management plan to avoid excessive losses.
Updates and Support: I am committed to providing updates and improvements based on community feedback. For inquiries or suggestions, feel free to contact me.
---
Example Configuration
Assuming you want to use the strategy with the following parameters:
Discord Webhook: Your unique Discord Webhook
RSI Period: 6
RSI Smoothing Factor: 5
Rapid Liquidity Factor: 5
Liquidity Threshold: 5
SL Ticks: 100
TP Ticks: 250
SL/TP Box Width: 25 bars
Trading Days: Monday, Tuesday, Wednesday, Thursday, Friday
Trading Hours: Start at 8:00, End at 11:00
Simulated Initial Capital: $1000
Risk per Trade in Simulation: 1% of capital
Slippage and Commissions in Simulation: 1 tick slippage and $0.20 commission per trade
---
Conclusion
The Briss Thorn Xtreme strategy offers an innovative approach by combining advanced technical analysis with dynamic risk management and modern technological tools. Its original and adaptable design makes it a valuable tool for traders looking to diversify their methods and capitalize on opportunities based on less conventional patterns. Ready for immediate implementation in TradingView, this strategy can enhance your trading arsenal and contribute to a more informed and structured approach in your operations.
---
Final Disclaimer:
Financial markets are volatile and can present significant risks. This strategy should be used as part of a comprehensive trading approach and does not guarantee positive results. It is always advisable to consult with a professional financial advisor before making investment decisions.

Mean Reversion Pro Strategy [tradeviZion]Mean Reversion Pro Strategy : User Guide
A mean reversion trading strategy for daily timeframe trading.
Introduction
Mean Reversion Pro Strategy is a technical trading system that operates on the daily timeframe. The strategy uses a dual Simple Moving Average (SMA) system combined with price range analysis to identify potential trading opportunities. It can be used on major indices and other markets with sufficient liquidity.
The strategy includes:
Trading System
Fast SMA for entry/exit points (5, 10, 15, 20 periods)
Slow SMA for trend reference (100, 200 periods)
Price range analysis (20% threshold)
Position management rules
Visual Elements
Gradient color indicators
Three themes (Dark/Light/Custom)
ATR-based visuals
Signal zones
Status Table
Current position information
Basic performance metrics
Strategy parameters
Optional messages
📊 Strategy Settings
Main Settings
Trading Mode
Options: Long Only, Short Only, Both
Default: Long Only
Position Size: 10% of equity
Starting Capital: $20,000
Moving Averages
Fast SMA: 5, 10, 15, or 20 periods
Slow SMA: 100 or 200 periods
Default: Fast=5, Slow=100
🎯 Entry and Exit Rules
Long Entry Conditions
All conditions must be met:
Price below Fast SMA
Price below 20% of current bar's range
Price above Slow SMA
No existing position
Short Entry Conditions
All conditions must be met:
Price above Fast SMA
Price above 80% of current bar's range
Price below Slow SMA
No existing position
Exit Rules
Long Positions
Exit when price crosses above Fast SMA
No fixed take-profit levels
No stop-loss (mean reversion approach)
Short Positions
Exit when price crosses below Fast SMA
No fixed take-profit levels
No stop-loss (mean reversion approach)
💼 Risk Management
Position Sizing
Default: 10% of equity per trade
Initial capital: $20,000
Commission: 0.01%
Slippage: 2 points
Maximum one position at a time
Risk Control
Use daily timeframe only
Avoid trading during major news events
Consider market conditions
Monitor overall exposure
📊 Performance Dashboard
The strategy includes a comprehensive status table displaying:
Strategy Parameters
Current SMA settings
Trading direction
Fast/Slow SMA ratio
Current Status
Active position (Flat/Long/Short)
Current price with color coding
Position status indicators
Performance Metrics
Net Profit (USD and %)
Win Rate with color grading
Profit Factor with thresholds
Maximum Drawdown percentage
Average Trade value
📱 Alert Settings
Entry Alerts
Long Entry (Buy Signal)
Short Entry (Sell Signal)
Exit Alerts
Long Exit (Take Profit)
Short Exit (Take Profit)
Alert Message Format
Strategy name
Signal type and direction
Current price
Fast SMA value
Slow SMA value
💡 Usage Tips
Consider starting with Long Only mode
Begin with default settings
Keep track of your trades
Review results regularly
Adjust settings as needed
Follow your trading plan
⚠️ Disclaimer
This strategy is for educational and informational purposes only. It is not financial advice. Always:
Conduct your own research
Test thoroughly before live trading
Use proper risk management
Consider your trading goals
Monitor market conditions
Never risk more than you can afford to lose
📋 Release Notes
14 January 2025
Added New Fast & Slow SMA Options:
Fibonacci-based periods: 8, 13, 21, 144, 233, 377
Additional period: 50
Complete Fast SMA options now: 5, 8, 10, 13, 15, 20, 21, 34, 50
Complete Slow SMA options now: 100, 144, 200, 233, 377
Bug Fixes:
Fixed Maximum Drawdown calculation in the performance table
Now using strategy.max_drawdown_percent for accurate DD reporting
Previous version showed incorrect DD values
Performance metrics now accurately reflect trading results
Performance Note:
Strategy tested with Fast/Slow SMA 13/377
Test conducted with 10% equity risk allocation
Daily Timeframe
For Beginners - How to Modify SMA Levels:
Find this line in the code:
fastLength = input.int(title="Fast SMA Length", defval=5, options= )
To add a new Fast SMA period: Add the number to the options list, e.g.,
To remove a Fast SMA period: Remove the number from the options list
For Slow SMA, find:
slowLength = input.int(title="Slow SMA Length", defval=100, options= )
Modify the options list the same way
⚠️ Note: Keep the periods that make sense for your trading timeframe
💡 Tip: Test any new combinations thoroughly before live trading
"Trade with Discipline, Manage Risk, Stay Consistent" - tradeviZion

Bullish Reversal Bar Strategy [Skyrexio]Overview
Bullish Reversal Bar Strategy leverages the combination of candlestick pattern Bullish Reversal Bar (description in Methodology and Justification of Methodology), Williams Alligator indicator and Williams Fractals to create the high probability setups. Candlestick pattern is used for the entering into trade, while the combination of Williams Alligator and Fractals is used for the trend approximation as close condition. Strategy uses only long trades.
Unique Features
No fixed stop-loss and take profit: Instead of fixed stop-loss level strategy utilizes technical condition obtained by Fractals and Alligator or the candlestick pattern invalidation to identify when current uptrend is likely to be over (more information in "Methodology" and "Justification of Methodology" paragraphs)
Configurable Trading Periods: Users can tailor the strategy to specific market windows, adapting to different market conditions.
Trend Trade Filter: strategy uses Alligator and Fractal combination as high probability trend filter.
Methodology
The strategy opens long trade when the following price met the conditions:
1.Current candle's high shall be below the Williams Alligator's lines (Jaw, Lips, Teeth)(all details in "Justification of Methodology" paragraph)
2.Price shall create the candlestick pattern "Bullish Reversal Bar". Optionally if MFI and AO filters are enabled current candle shall have the decreasing AO and at least one of three recent bars shall have the squat state on the MFI (all details in "Justification of Methodology" paragraph)
3.If price breaks through the high of the candle marked as the "Bullish Reversal Bar" the long trade is open at the price one tick above the candle's high
4.Initial stop loss is placed at the Bullish Reversal Bar's candle's low
5.If price hit the Bullish Reversal Bar's low before hitting the entry price potential trade is cancelled
6.If trade is active and initial stop loss has not been hit, trade is closed when the combination of Alligator and Williams Fractals shall consider current trend change from upward to downward.
Strategy settings
In the inputs window user can setup strategy setting:
Enable MFI (if true trades are filtered using Market Facilitation Index (MFI) condition all details in "Justification of Methodology" paragraph), by default = false)
Enable AO (if true trades are filtered using Awesome Oscillator (AO) condition all details in "Justification of Methodology" paragraph), by default = false)
Justification of Methodology
Let's explore the key concepts of this strategy and understand how they work together. The first and key concept is the Bullish Reversal Bar candlestick pattern. This is just the single bar pattern. The rules are simple:
Candle shall be closed in it's upper half
High of this candle shall be below all three Alligator's lines (Jaw, Lips, Teeth)
Next, let’s discuss the short-term trend filter, which combines the Williams Alligator and Williams Fractals. Williams Alligator
Developed by Bill Williams, the Alligator is a technical indicator that identifies trends and potential market reversals. It consists of three smoothed moving averages:
Jaw (Blue Line): The slowest of the three, based on a 13-period smoothed moving average shifted 8 bars ahead.
Teeth (Red Line): The medium-speed line, derived from an 8-period smoothed moving average shifted 5 bars forward.
Lips (Green Line): The fastest line, calculated using a 5-period smoothed moving average shifted 3 bars forward.
When the lines diverge and align in order, the "Alligator" is "awake," signaling a strong trend. When the lines overlap or intertwine, the "Alligator" is "asleep," indicating a range-bound or sideways market. This indicator helps traders determine when to enter or avoid trades.
Fractals, another tool by Bill Williams, help identify potential reversal points on a price chart. A fractal forms over at least five consecutive bars, with the middle bar showing either:
Up Fractal: Occurs when the middle bar has a higher high than the two preceding and two following bars, suggesting a potential downward reversal.
Down Fractal: Happens when the middle bar shows a lower low than the surrounding two bars, hinting at a possible upward reversal.
Traders often use fractals alongside other indicators to confirm trends or reversals, enhancing decision-making accuracy.
How do these tools work together in this strategy? Let’s consider an example of an uptrend.
When the price breaks above an up fractal, it signals a potential bullish trend. This occurs because the up fractal represents a shift in market behavior, where a temporary high was formed due to selling pressure. If the price revisits this level and breaks through, it suggests the market sentiment has turned bullish.
The breakout must occur above the Alligator’s teeth line to confirm the trend. A breakout below the teeth is considered invalid, and the downtrend might still persist. Conversely, in a downtrend, the same logic applies with down fractals.
How we can use all these indicators in this strategy? This strategy is a counter trend one. Candle's high shall be below all Alligator's lines. During this market stage the bullish reversal bar candlestick pattern shall be printed. This bar during the downtrend is a high probability setup for the potential reversal to the upside: bulls were able to close the price in the upper half of a candle. The breaking of its high is a high probability signal that trend change is confirmed and script opens long trade. If market continues going down and break down the bullish reversal bar's low potential trend change has been invalidated and strategy close long trade.
If market really reversed and started moving to the upside strategy waits for the trend change form the downtrend to the uptrend according to approximation of Alligator and Fractals combination. If this change happens strategy close the trade. This approach helps to stay in the long trade while the uptrend continuation is likely and close it if there is a high probability of the uptrend finish.
Optionally users can enable MFI and AO filters. First of all, let's briefly explain what are these two indicators. The Awesome Oscillator (AO), created by Bill Williams, is a momentum-based indicator that evaluates market momentum by comparing recent price activity to a broader historical context. It assists traders in identifying potential trend reversals and gauging trend strength.
AO = SMA5(Median Price) − SMA34(Median Price)
where:
Median Price = (High + Low) / 2
SMA5 = 5-period Simple Moving Average of the Median Price
SMA 34 = 34-period Simple Moving Average of the Median Price
This indicator is filtering signals in the following way: if current AO bar is decreasing this candle can be interpreted as a bullish reversal bar. This logic is applicable because initially this strategy is a trend reversal, it is searching for the high probability setup against the current trend. Decreasing AO is the additional high probability filter of a downtrend.
Let's briefly look what is MFI. The Market Facilitation Index (MFI) is a technical indicator that measures the price movement per unit of volume, helping traders gauge the efficiency of price movement in relation to trading volume. Here's how you can calculate it:
MFI = (High−Low)/Volume
MFI can be used in combination with volume, so we can divide 4 states. Bill Williams introduced these to help traders interpret the interaction between volume and price movement. Here’s a quick summary:
Green Window (Increased MFI & Increased Volume): Indicates strong momentum with both price and volume increasing. Often a sign of trend continuation, as both buying and selling interest are rising.
Fake Window (Increased MFI & Decreased Volume): Shows that price is moving but with lower volume, suggesting weak support for the trend. This can signal a potential end of the current trend.
Squat Window (Decreased MFI & Increased Volume): Shows high volume but little price movement, indicating a tug-of-war between buyers and sellers. This often precedes a breakout as the pressure builds.
Fade Window (Decreased MFI & Decreased Volume): Indicates a lack of interest from both buyers and sellers, leading to lower momentum. This typically happens in range-bound markets and may signal consolidation before a new move.
For our purposes we are interested in squat bars. This is the sign that volume cannot move the price easily. This type of bar increases the probability of trend reversal. In this indicator we added to enable the MFI filter of reversal bars. If potential reversal bar or two preceding bars have squat state this bar can be interpret as a reversal one.
Backtest Results
Operating window: Date range of backtests is 2023.01.01 - 2024.12.31. It is chosen to let the strategy to close all opened positions.
Commission and Slippage: Includes a standard Binance commission of 0.1% and accounts for possible slippage over 5 ticks.
Initial capital: 10000 USDT
Percent of capital used in every trade: 50%
Maximum Single Position Loss: -5.29%
Maximum Single Profit: +29.99%
Net Profit: +5472.66 USDT (+54.73%)
Total Trades: 103 (33.98% win rate)
Profit Factor: 1.634
Maximum Accumulated Loss: 1231.15 USDT (-8.32%)
Average Profit per Trade: 53.13 USDT (+0.94%)
Average Trade Duration: 76 hours
How to Use
Add the script to favorites for easy access.
Apply to the desired timeframe and chart (optimal performance observed on 4h ETH/USDT).
Configure settings using the dropdown choice list in the built-in menu.
Set up alerts to automate strategy positions through web hook with the text: {{strategy.order.alert_message}}
Disclaimer:
Educational and informational tool reflecting Skyrex commitment to informed trading. Past performance does not guarantee future results. Test strategies in a simulated environment before live implementation
These results are obtained with realistic parameters representing trading conditions observed at major exchanges such as Binance and with realistic trading portfolio usage parameters.

Fibonacci Retracement Strategy for CryptoThe Enhanced Fibonacci Retracement Strategy is designed to help traders capitalize on key Fibonacci levels for both long and short trades. This script automatically identifies significant swing highs and lows within a customizable lookback period and dynamically plots Fibonacci retracement levels (0%, 23.6%, 38.2%, 50%, 61.8%, 78.6%, and 100%) as support and resistance levels.
Key Features:
Automatic Fibonacci Levels:
The script identifies the highest high and lowest low over a user-defined lookback period to calculate Fibonacci retracement levels.
Dual-Directional Trading:
Long Trades: Triggered when the price crosses above the 61.8% retracement level, anticipating a reversal.
Short Trades: Triggered when the price crosses below the 38.2% retracement level, capturing potential downward movement.
Compact Line Option:
Users can toggle "Compact Fibonacci Lines" to reduce visual clutter on the chart, making the lines shorter and easier to interpret.
Dynamic Alerts:
Alerts are embedded directly into the strategy logic for entry and exit points.
Long Entry: Triggered when the price bounces above the 61.8% level.
Long Exit: Triggered when the price reaches the 23.6% level.
Short Entry: Triggered when the price crosses below the 38.2% level.
Short Exit: Triggered when the price reaches the 78.6% level.
Clear Visualization:
Fibonacci levels are plotted with distinct colors and dashed lines (optional compact view),
providing traders with clear and actionable levels to make decisions.
Inputs:
Lookback Period: Number of candles to calculate swing highs and lows.
Plot Fibonacci Levels: Toggle to enable/disable plotting levels.
Compact Fibonacci Lines: Reduce the length of Fibonacci lines for a cleaner chart.
How It Works:
The strategy identifies a high-low range within the lookback period.
Fibonacci levels are calculated based on the range and plotted on the chart.
Long Trade Example:
Enter when the price crosses above the 61.8% level.
Exit when the price reaches the 23.6% level.
Short Trade Example:
Enter when the price crosses below the 38.2% level.
Exit when the price reaches the 78.6% level.
Best Use Cases:
Trending Markets: Use retracements to time entries in the direction of the trend.
Range-Bound Markets: Identify and trade reversals near key Fibonacci levels.
Important Notes:
This strategy is not financial advice and should be backtested thoroughly before live trading.
Risk management is crucial! Consider using stop-loss orders for protection.
Customize inputs to suit your preferred timeframe and trading style.

three Supertrend EMA Strategy by Prasanna +DhanuThe indicator described in your Pine Script is a Supertrend EMA Strategy that combines the Supertrend and EMA (Exponential Moving Average) to create a trend-following strategy. Here’s a detailed breakdown of how this indicator works:
1. EMA (Exponential Moving Average):
The EMA is a moving average that places more weight on recent prices, making it more responsive to price changes compared to a simple moving average (SMA). In this strategy, the EMA is used to determine the overall trend direction.
Input Parameter:
ema_length: This is the period for the EMA, set to 50 periods by default. A shorter EMA will respond more quickly to price movements, while a longer EMA is smoother and less sensitive to short-term fluctuations.
How it's used:
If the price is above the EMA, it indicates an uptrend.
If the price is below the EMA, it indicates a downtrend.
2. Supertrend Indicator:
The Supertrend indicator is a trend-following tool based on the Average True Range (ATR), which is a volatility measure. It helps to identify the direction of the trend by setting a dynamic support or resistance level.
Input Parameters:
supertrend_atr_period: The period used for calculating the ATR, set to 10 periods by default.
supertrend_multiplier1: Multiplier for the first Supertrend, set to 3.0.
supertrend_multiplier2: Multiplier for the second Supertrend, set to 2.0.
supertrend_multiplier3: Multiplier for the third Supertrend, set to 1.0.
Each Supertrend line has a different multiplier, which affects its sensitivity to price changes. The ATR period defines how many periods of price data are used to calculate the ATR.
How the Supertrend works:
If the Supertrend value is below the price, the trend is considered bullish (uptrend).
If the Supertrend value is above the price, the trend is considered bearish (downtrend).
The Supertrend will switch between up and down based on price movement and ATR, providing a dynamic trend-following signal.
3. Three Supertrend Lines:
In this strategy, three Supertrend lines are calculated with different multipliers and the same ATR period (10 periods). Each line is more or less sensitive to price changes, and they are plotted on the chart in different colors based on whether the trend is bullish (green) or bearish (red).
Supertrend 1: The most sensitive Supertrend with a multiplier of 3.0.
Supertrend 2: A moderately sensitive Supertrend with a multiplier of 2.0.
Supertrend 3: The least sensitive Supertrend with a multiplier of 1.0.
Each Supertrend line signals a bullish trend when its value is below the price and a bearish trend when its value is above the price.
4. Strategy Rules:
This strategy uses the three Supertrend lines combined with the EMA to generate trade signals.
Entry Conditions:
A long entry is triggered when all three Supertrend lines are in an uptrend (i.e., all three Supertrend lines are below the price), and the price is above the EMA. This suggests a strong bullish market condition.
A short entry is triggered when all three Supertrend lines are in a downtrend (i.e., all three Supertrend lines are above the price), and the price is below the EMA. This suggests a strong bearish market condition.
Exit Conditions:
A long exit occurs when the third Supertrend (the least sensitive one) switches to a downtrend (i.e., the price falls below it).
A short exit occurs when the third Supertrend switches to an uptrend (i.e., the price rises above it).
5. Visualization:
The strategy also plots the following on the chart:
The EMA is plotted as a blue line, which helps identify the overall trend.
The three Supertrend lines are plotted with different colors:
Supertrend 1: Green (for uptrend) and Red (for downtrend).
Supertrend 2: Green (for uptrend) and Red (for downtrend).
Supertrend 3: Green (for uptrend) and Red (for downtrend).
Summary of the Strategy:
The strategy combines three Supertrend indicators (with different multipliers) and an EMA to capture both short-term and long-term trends.
Long positions are entered when all three Supertrend lines are bullish and the price is above the EMA.
Short positions are entered when all three Supertrend lines are bearish and the price is below the EMA.
Exits occur when the third Supertrend line (the least sensitive) signals a change in trend direction.
This combination of indicators allows for a robust trend-following strategy that adapts to both short-term volatility and long-term trend direction. The Supertrend lines provide quick reaction to price changes, while the EMA offers a smoother, more stable trend direction for confirmation.
The indicator described in your Pine Script is a Supertrend EMA Strategy that combines the Supertrend and EMA (Exponential Moving Average) to create a trend-following strategy. Here’s a detailed breakdown of how this indicator works:
1. EMA (Exponential Moving Average):
The EMA is a moving average that places more weight on recent prices, making it more responsive to price changes compared to a simple moving average (SMA). In this strategy, the EMA is used to determine the overall trend direction.
Input Parameter:
ema_length: This is the period for the EMA, set to 50 periods by default. A shorter EMA will respond more quickly to price movements, while a longer EMA is smoother and less sensitive to short-term fluctuations.
How it's used:
If the price is above the EMA, it indicates an uptrend.
If the price is below the EMA, it indicates a downtrend.
2. Supertrend Indicator:
The Supertrend indicator is a trend-following tool based on the Average True Range (ATR), which is a volatility measure. It helps to identify the direction of the trend by setting a dynamic support or resistance level.
Input Parameters:
supertrend_atr_period: The period used for calculating the ATR, set to 10 periods by default.
supertrend_multiplier1: Multiplier for the first Supertrend, set to 3.0.
supertrend_multiplier2: Multiplier for the second Supertrend, set to 2.0.
supertrend_multiplier3: Multiplier for the third Supertrend, set to 1.0.
Each Supertrend line has a different multiplier, which affects its sensitivity to price changes. The ATR period defines how many periods of price data are used to calculate the ATR.
How the Supertrend works:
If the Supertrend value is below the price, the trend is considered bullish (uptrend).
If the Supertrend value is above the price, the trend is considered bearish (downtrend).
The Supertrend will switch between up and down based on price movement and ATR, providing a dynamic trend-following signal.
3. Three Supertrend Lines:
In this strategy, three Supertrend lines are calculated with different multipliers and the same ATR period (10 periods). Each line is more or less sensitive to price changes, and they are plotted on the chart in different colors based on whether the trend is bullish (green) or bearish (red).
Supertrend 1: The most sensitive Supertrend with a multiplier of 3.0.
Supertrend 2: A moderately sensitive Supertrend with a multiplier of 2.0.
Supertrend 3: The least sensitive Supertrend with a multiplier of 1.0.
Each Supertrend line signals a bullish trend when its value is below the price and a bearish trend when its value is above the price.
4. Strategy Rules:
This strategy uses the three Supertrend lines combined with the EMA to generate trade signals.
Entry Conditions:
A long entry is triggered when all three Supertrend lines are in an uptrend (i.e., all three Supertrend lines are below the price), and the price is above the EMA. This suggests a strong bullish market condition.
A short entry is triggered when all three Supertrend lines are in a downtrend (i.e., all three Supertrend lines are above the price), and the price is below the EMA. This suggests a strong bearish market condition.
Exit Conditions:
A long exit occurs when the third Supertrend (the least sensitive one) switches to a downtrend (i.e., the price falls below it).
A short exit occurs when the third Supertrend switches to an uptrend (i.e., the price rises above it).
5. Visualization:
The strategy also plots the following on the chart:
The EMA is plotted as a blue line, which helps identify the overall trend.
The three Supertrend lines are plotted with different colors:
Supertrend 1: Green (for uptrend) and Red (for downtrend).
Supertrend 2: Green (for uptrend) and Red (for downtrend).
Supertrend 3: Green (for uptrend) and Red (for downtrend).
Summary of the Strategy:
The strategy combines three Supertrend indicators (with different multipliers) and an EMA to capture both short-term and long-term trends.
Long positions are entered when all three Supertrend lines are bullish and the price is above the EMA.
Short positions are entered when all three Supertrend lines are bearish and the price is below the EMA.
Exits occur when the third Supertrend line (the least sensitive) signals a change in trend direction.
This combination of indicators allows for a robust trend-following strategy that adapts to both short-term volatility and long-term trend direction. The Supertrend lines provide quick reaction to price changes, while the EMA offers a smoother, more stable trend direction for confirmation.

16. SMC Strategy with SL - low TimeframeOverview
The "SMC Strategy with SL - low Timeframe" is a comprehensive trading strategy that uses key concepts from Smart Money Theory to identify favorable areas in the market for buying or selling. This strategy takes advantage of price imbalances, support and resistance zones, and swing highs/lows to generate high-probability trade signals.
The key features of this strategy include:
Swing High/Low Analysis: Used to determine the Premium, Equilibrium, and Discount Zones.
Order Block Integration: An added layer of confluence to identify valid buy and sell signals.
Trend Direction Confirmation: Using a Simple Moving Average (SMA) to determine the overall trend.
Entry and Exit Rules: Based on price position relative to key zones and moving average, along with optional stop-loss and take-profit levels.
Detailed Description
Swing High and Swing Low Analysis
The script calculates Swing High and Swing Low based on the most recent price highs and lows over a specified look-back period (swingHighLength and swingLowLength, set to 8 by default).
It then derives the Premium, Equilibrium, and Discount Zones:
Premium Zone: Represents potential resistance, calculated based on recent swing highs.
Discount Zone: Represents potential support, calculated based on recent swing lows.
Equilibrium: The midpoint between Swing High and Swing Low, dividing the price range into Premium (above equilibrium) and Discount (below equilibrium) areas.
Zone Visualization
The strategy plots the Premium Zone (resistance) in red, the Discount Zone (support) in green, and the Equilibrium level in blue on the chart. This helps visually assess the current price relative to these important areas.
Simple Moving Average (SMA)
A 50-period Simple Moving Average (SMA) is added to help identify the trend direction.
Buy signals are valid only if the price is above the SMA, indicating an uptrend.
Sell signals are valid only if the price is below the SMA, indicating a downtrend.
Entry Rules
The script generates buy or sell signals when certain conditions are met:
A buy signal is triggered when:
Price is below the Equilibrium and within the Discount Zone.
Price is above the SMA.
The buy signal is further confirmed by the presence of an Order Block (recent lowest price area).
A sell signal is triggered when:
Price is above the Equilibrium and within the Premium Zone.
Price is below the SMA.
The sell signal is further confirmed by the presence of an Order Block (recent highest price area).
Order Block
The strategy defines Order Blocks as recent highs and lows within a look-back period (orderBlockLength set to 20 by default).
These blocks represent areas where large players (smart money) have historically been active, increasing the probability of the price reacting in these areas again.
Trade Management and Trade Direction
The user can set Trade Direction to either "Long Only," "Short Only," or "Both." This allows the strategy to adapt based on market conditions or trading preferences.
Based on the Trade Direction, the strategy either:
Closes open trades that are against new signals.
Allows only specific directional trades (either long or short).
Stop-loss levels are defined based on a fixed percentage (stop_loss_percent), which helps to manage risk and minimize losses.
Exit Rules
The strategy uses stop-loss levels for risk management.
A stop-loss price is set at a fixed percentage below the entry price for long positions or above the entry price for short positions.
When the price hits the defined stop-loss level, the trade is closed.
Liquidity Zones
The script identifies recent Swing Highs and Lows as potential liquidity zones. These are levels where price could react strongly, as they represent areas of interest for large traders.
The liquidity zones are plotted as crosses on the chart, marking areas where price may encounter significant buying or selling pressure.
Visual Feedback
The script uses visual markers (green for buy signals and red for sell signals) to indicate potential entries on the chart.
It also plots liquidity zones to help traders identify areas where stop hunts and liquidity grabs might occur.
Monthly Performance Dashboard
The script includes a performance tracking feature that displays monthly profit and loss metrics on the chart.
This dashboard allows the trader to see a visual representation of trading performance over time, providing insights into profitability and consistency.
The table shows profit or loss for each month and year, allowing the user to track the overall success of the strategy.
Key Benefits
Smart Money Concepts (SMC): This strategy incorporates SMC principles like order blocks and liquidity zones, which are used by institutional traders to determine potential market moves.
Zone Analysis: The use of Premium, Discount, and Equilibrium zones provides a solid framework for determining where to enter and exit trades based on price discounts or premiums.
Confluence: Signals are not taken in isolation. They are confirmed by factors like trend direction (SMA) and order blocks, providing greater trade accuracy.
Risk Management: By integrating stop-loss functionality, traders can manage their risks effectively.
Visual Performance Metrics: The monthly and yearly performance dashboard gives valuable feedback on how well the strategy has performed historically.
Practical Use
Buy in Discount Zone: Traders would be looking to buy when the price is discounted relative to its recent range and is above the SMA, indicating an overall uptrend.
Sell in Premium Zone: Conversely, traders would be looking to sell when the price is at a premium relative to its recent range and below the SMA, indicating an overall downtrend.
Order Block Confirmation: Ensures that buying or selling is supported by historical price behavior at significant levels, providing confidence that the market is likely to react at these areas.
This strategy is designed to help traders take advantage of price inefficiencies and areas where institutional traders are likely to be active, increasing the odds of successful trades. By leveraging Smart Money concepts and strong technical confluence, it aims to provide high-probability trade setups.

Fibonacci ATR Fusion - Strategy [presentTrading]Open-script again! This time is also an ATR-related strategy. Enjoy! :)
If you have any questions, let me know, and I'll help make this as effective as possible.
█ Introduction and How It Is Different
The Fibonacci ATR Fusion Strategy is an advanced trading approach that uniquely integrates Fibonacci-based weighted averages with the Average True Range (ATR) to identify and capitalize on significant market trends.
Unlike traditional strategies that rely on single indicators or static parameters, this method combines multiple timeframes and dynamic volatility measurements to enhance precision and adaptability. Additionally, it features a 4-step Take Profit (TP) mechanism, allowing for systematic profit-taking at various levels, which optimizes both risk management and return potential in long and short market positions.
BTCUSD 6hr Performance
█ Strategy, How It Works: Detailed Explanation
The Fibonacci ATR Fusion Strategy utilizes a combination of technical indicators and weighted averages to determine optimal entry and exit points. Below is a breakdown of its key components and operational logic.
🔶 1. Enhanced True Range Calculation
The strategy begins by calculating the True Range (TR) to measure market volatility accurately.
TR = max(High - Low, abs(High - Previous Close), abs(Low - Previous Close))
High and Low: Highest and lowest prices of the current trading period.
Previous Close: Closing price of the preceding trading period.
max: Selects the largest value among the three calculations to account for gaps and limit movements.
🔶 2. Buying Pressure (BP) Calculation
Buying Pressure (BP) quantifies the extent to which buyers are driving the price upwards within a period.
BP = Close - True Low
Close: Current period's closing price.
True Low: The lower boundary determined in the True Range calculation.
🔶 3. Ratio Calculation for Different Periods
To assess the strength of buying pressure relative to volatility, the strategy calculates a ratio over various Fibonacci-based timeframes.
Ratio = 100 * (Sum of BP over n periods) / (Sum of TR over n periods)
n: Length of the period (e.g., 8, 13, 21, 34, 55).
Sum of BP: Cumulative Buying Pressure over n periods.
Sum of TR: Cumulative True Range over n periods.
This ratio normalizes buying pressure, making it comparable across different timeframes.
🔶 4. Weighted Average Calculation
The strategy employs a weighted average of ratios from multiple Fibonacci-based periods to smooth out signals and enhance trend detection.
Weighted Avg = (w1 * Ratio_p1 + w2 * Ratio_p2 + w3 * Ratio_p3 + w4 * Ratio_p4 + Ratio_p5) / (w1 + w2 + w3 + w4 + 1)
w1, w2, w3, w4: Weights assigned to each ratio period.
Ratio_p1 to Ratio_p5: Ratios calculated for periods p1 to p5 (e.g., 8, 13, 21, 34, 55).
This weighted approach emphasizes shorter periods more heavily, capturing recent market dynamics while still considering longer-term trends.
🔶 5. Simple Moving Average (SMA) of Weighted Average
To further smooth the weighted average and reduce noise, a Simple Moving Average (SMA) is applied.
Weighted Avg SMA = SMA(Weighted Avg, m)
- m: SMA period (e.g., 3).
This smoothed line serves as the primary signal generator for trade entries and exits.
🔶 6. Trading Condition Thresholds
The strategy defines specific threshold values to determine optimal entry and exit points based on crossovers and crossunders of the SMA.
Long Condition = Crossover(Weighted Avg SMA, Long Entry Threshold)
Short Condition = Crossunder(Weighted Avg SMA, Short Entry Threshold)
Long Exit = Crossunder(Weighted Avg SMA, Long Exit Threshold)
Short Exit = Crossover(Weighted Avg SMA, Short Exit Threshold)
Long Entry Threshold (T_LE): Level at which a long position is triggered.
Short Entry Threshold (T_SE): Level at which a short position is triggered.
Long Exit Threshold (T_LX): Level at which a long position is exited.
Short Exit Threshold (T_SX): Level at which a short position is exited.
These conditions ensure that trades are only executed when clear trends are identified, enhancing the strategy's reliability.
Previous local performance
🔶 7. ATR-Based Take Profit Mechanism
When enabled, the strategy employs a 4-step Take Profit system to systematically secure profits as the trade moves in the desired direction.
TP Price_1 Long = Entry Price + (TP1ATR * ATR Value)
TP Price_2 Long = Entry Price + (TP2ATR * ATR Value)
TP Price_3 Long = Entry Price + (TP3ATR * ATR Value)
TP Price_1 Short = Entry Price - (TP1ATR * ATR Value)
TP Price_2 Short = Entry Price - (TP2ATR * ATR Value)
TP Price_3 Short = Entry Price - (TP3ATR * ATR Value)
- ATR Value: Calculated using ATR over a specified period (e.g., 14).
- TPxATR: User-defined multipliers for each take profit level.
- TPx_percent: Percentage of the position to exit at each TP level.
This multi-tiered exit strategy allows for partial position closures, optimizing profit capture while maintaining exposure to potential further gains.
█ Trade Direction
The Fibonacci ATR Fusion Strategy is designed to operate in both long and short market conditions, providing flexibility to traders in varying market environments.
Long Trades: Initiated when the SMA of the weighted average crosses above the Long Entry Threshold (T_LE), indicating strong upward momentum.
Short Trades: Initiated when the SMA of the weighted average crosses below the Short Entry Threshold (T_SE), signaling robust downward momentum.
Additionally, the strategy can be configured to trade exclusively in one direction—Long, Short, or Both—based on the trader’s preference and market analysis.
█ Usage
Implementing the Fibonacci ATR Fusion Strategy involves several steps to ensure it aligns with your trading objectives and market conditions.
1. Configure Strategy Parameters:
- Trading Direction: Choose between Long, Short, or Both based on your market outlook.
- Trading Condition Thresholds: Set the Long Entry, Short Entry, Long Exit, and Short Exit thresholds to define when to enter and exit trades.
2. Set Take Profit Levels (if enabled):
- ATR Multipliers: Define how many ATRs away from the entry price each take profit level is set.
- Take Profit Percentages: Allocate what percentage of the position to close at each TP level.
3. Apply to Desired Chart:
- Add the strategy to the chart of the asset you wish to trade.
- Observe the plotted Fibonacci ATR and SMA Fibonacci ATR indicators for visual confirmation.
4. Monitor and Adjust:
- Regularly review the strategy’s performance through backtesting.
- Adjust the input parameters based on historical performance and changing market dynamics.
5. Risk Management:
- Ensure that the sum of take profit percentages does not exceed 100% to avoid over-closing positions.
- Utilize the ATR-based TP levels to adapt to varying market volatilities, maintaining a balanced risk-reward ratio.
█ Default Settings
Understanding the default settings is crucial for optimizing the Fibonacci ATR Fusion Strategy's performance. Here's a precise and simple overview of the key parameters and their effects:
🔶 Key Parameters and Their Effects
1. Trading Direction (`tradingDirection`)
- Default: Both
- Effect: Determines whether the strategy takes both long and short positions or restricts to one direction. Selecting Both allows maximum flexibility, while Long or Short can be used for directional bias.
2. Trading Condition Thresholds
Long Entry (long_entry_threshold = 58.0): Higher values reduce false positives but may miss trades.
Short Entry (short_entry_threshold = 42.0): Lower values capture early short trends but may increase false signals.
Long Exit (long_exit_threshold = 42.0): Exits long positions early, securing profits but potentially cutting trends short.
Short Exit (short_exit_threshold = 58.0): Delays short exits to capture favorable movements, avoiding premature exits.
3. Take Profit Configuration (`useTakeProfit` = false)
- Effect: When enabled, the strategy employs a 4-step TP mechanism to secure profits at multiple levels. By default, it is disabled to allow users to opt-in based on their trading style.
4. ATR-Based Take Profit Multipliers
TP1 (tp1ATR = 3.0): Sets the first TP at 3 ATRs for initial profit capture.
TP2 (tp2ATR = 8.0): Targets larger trends, though less likely to be reached.
TP3 (tp3ATR = 14.0): Optimizes for extreme price moves, seldom triggered.
5. Take Profit Percentages
TP Level 1 (tp1_percent = 12%): Secures 12% at the first TP.
TP Level 2 (tp2_percent = 12%): Exits another 12% at the second TP.
TP Level 3 (tp3_percent = 12%): Closes an additional 12% at the third TP.
6. Weighted Average Parameters
Ratio Periods: Fibonacci-based intervals (8, 13, 21, 34, 55) balance responsiveness.
Weights: Emphasizes recent data for timely responses to market trends.
SMA Period (weighted_avg_sma_period = 3): Smoothens data with minimal lag, balancing noise reduction and responsiveness.
7. ATR Period (`atrPeriod` = 14)
Effect: Sets the ATR calculation length, impacting TP sensitivity to volatility.
🔶 Impact on Performance
- Sensitivity and Responsiveness:
- Shorter Ratio Periods and Higher Weights: Make the weighted average more responsive to recent price changes, allowing quicker trade entries and exits but increasing the likelihood of false signals.
- Longer Ratio Periods and Lower Weights: Provide smoother signals with fewer false positives but may delay trade entries, potentially missing out on significant price moves.
- Profit Taking:
- ATR Multipliers: Higher multipliers set take profit levels further away, targeting larger price movements but reducing the probability of reaching these levels.
- Fixed Percentages: Allocating equal percentages at each TP level ensures consistent profit realization and risk management, preventing overexposure.
- Trade Direction Control:
- Selecting Specific Directions: Restricting trades to Long or Short can align the strategy with market trends or personal biases, potentially enhancing performance in trending markets.
- Risk Management:
- Take Profit Percentages: Dividing the position into smaller percentages at multiple TP levels helps lock in profits progressively, reducing risk and allowing the remaining position to ride further trends.
- Market Adaptability:
- Weighted Averages and ATR: By combining multiple timeframes and adjusting to volatility, the strategy adapts to different market conditions, maintaining effectiveness across various asset classes and timeframes.
---
If you want to know more about ATR, can also check "SuperATR 7-Step Profit".
Enjoy trading.
