Multiple AVWAP [OmegaTools]The Multiple AVWAP indicator is a sophisticated trading tool designed for professional traders who require precision in volume-weighted price tracking. This indicator allows for the deployment of multiple Anchored Volume Weighted Average Price (AVWAP) calculations simultaneously, offering deep insights into price movements, dynamic support and resistance levels, and trend structures across multiple timeframes.
This indicator caters to both institutional and retail traders by integrating flexible anchoring methods, multi-timeframe adaptability, and enhanced visualization features. It also includes deviation bands for statistical analysis, making it a comprehensive volume-based trading solution.
Key Features & Functionalities
1. Multiple AVWAP Configurations
Users can configure up to four distinct AVWAP calculations to track different market conditions.
Supports various anchoring methods:
Fixed: A traditional AVWAP that starts from a defined historical point.
Perpetual: A rolling VWAP that continuously adjusts over time.
Extension: An extension-based AVWAP that projects from past calculations.
High Volume: Anchors AVWAP to the highest volume bar within a specified period.
None: Option to disable AVWAP calculation if not required.
2. Advanced Deviation Bands
Implements standard deviation bands (1st and 2nd deviation) to provide a statistical measure of price dispersion from the AVWAP.
Serves as a dynamic method for identifying overbought and oversold conditions relative to VWAP pricing.
Deviation bands are customizable in terms of visibility, color, and transparency.
3. Multi-Timeframe Support
Users can assign different timeframes to each AVWAP calculation for macro and micro analysis.
Helps in identifying long-term institutional trading levels alongside short-term intraday trends.
4. Z-Score Normalization Mode
Option to standardize oscillator values based on AVWAP deviations.
Converts price movements into a statistical Z-score, allowing traders to measure price strength in a normalized range.
Helps in detecting extreme price dislocations and mean-reversion opportunities.
5. Customizable Visual & Aesthetic Settings
Fully customizable line colors, transparency, and thickness to enhance clarity.
Users can modify AVWAP and deviation band colors to distinguish between different levels.
Configurable display options to match personal trading preferences.
6. Oscillator Mode for Trend & Momentum Analysis
The indicator converts price deviations into an oscillator format, displaying AVWAP strength and weakness dynamically.
This provides traders with a momentum-based perspective on volume-weighted price movements.
User Guide & Implementation
1. Configuring AVWAPs for Optimal Use
Choose the mode for each AVWAP instance:
Fixed (set historical point)
Perpetual (rolling, continuously updated AVWAP)
Extension (projection from past AVWAP levels)
High Volume (anchored to highest volume bar)
None (disables the AVWAP line)
Adjust the length settings to fine-tune calculation sensitivity.
2. Utilizing Deviation Bands for Market Context
Activate deviation bands to see statistical boundaries of price action.
Monitor +1 / -1 and +2 / -2 standard deviation levels for extended price movements.
Consider price action outside of deviation bands as potential mean-reversion signals.
3. Multi-Timeframe Analysis for Institutional-Level Insights
Assign different timeframes to each AVWAP to compare:
Daily VWAP (institutional trading levels)
Weekly VWAP (swing trading trends)
Intraday VWAPs (short-term momentum shifts)
Helps identify where institutional liquidity is positioned relative to price.
4. Activating the Oscillator for Momentum & Bias Confirmation
The oscillator converts AVWAP deviations into a normalized value.
Use overbought/oversold levels to determine strength and potential reversals.
Combine with other indicators (RSI, MACD) for confluence-based trading decisions.
Trading Applications & Strategies
5. Trend Confirmation & Institutional VWAP Tracking
If price consistently holds above the primary AVWAP, it signals a bullish trend.
If price remains below AVWAP, it indicates selling pressure and a bearish trend.
Monitor retests of AVWAP levels for potential trend continuation or reversal.
6. Dynamic Support & Resistance Levels
AVWAP lines act as dynamic floating support and resistance zones.
Price bouncing off AVWAP suggests continuation, whereas breakdowns indicate a shift in momentum.
Look for confluence with high-volume zones for stronger trade signals.
7. Mean Reversion & Statistical Edge Trading
Prices that deviate beyond +2 or -2 standard deviations often revert toward AVWAP.
Mean reversion traders can fade extended moves and target AVWAP re-tests.
Helps in identifying exhaustion points in trending markets.
8. Institutional Liquidity & Volume Footprints
Institutions often execute large trades near VWAP zones, causing price reactions.
Tracking multi-timeframe AVWAP levels allows traders to anticipate key liquidity areas.
Use higher timeframe AVWAPs as macro support/resistance for swing trading setups.
9. Enhancing Momentum Trading with AVWAP Oscillator
The oscillator provides a momentum-based measure of AVWAP deviations.
Helps in confirming entry and exit timing for trend-following trades.
Useful for pairing with stochastic oscillators, MACD, or RSI to validate trade decisions.
Best Practices & Trading Tips
Use in Conjunction with Volume Analysis: Combine with volume profiles, OBV, or CVD for increased accuracy.
Adjust Timeframes Based on Trading Style: Scalpers can focus on short-term AVWAP, while swing traders benefit from weekly/daily AVWAP tracking.
Backtest Different AVWAP Configurations: Experiment with different anchoring methods and lookback periods to optimize trade performance.
Monitor Institutional Order Flow: Identify key VWAP zones where institutional traders may be active.
Use with Other Technical Indicators: Enhance trading confidence by integrating with moving averages, Bollinger Bands, or Fibonacci retracements.
Final Thoughts & Disclaimer
The Multiple AVWAP indicator provides a comprehensive approach to volume-weighted price tracking, making it ideal for professional traders. While this tool enhances market clarity and trade decision-making, it should be used as part of a well-rounded trading strategy with risk management principles in place.
This indicator is provided for informational and educational purposes only. Trading involves risk, and past performance is not indicative of future results. Always conduct your own analysis and due diligence before executing trades.
OmegaTools - Enhancing Market Clarity with Precision Indicators
"retest"に関するスクリプトを検索

200 EMA AlertHow It Works:
The 200 EMA calculates the average price over the last 200 periods, giving more weight to recent price movements for a smoother and more responsive trend line.
It helps traders determine whether the market is in a bullish (above 200 EMA) or bearish (below 200 EMA) phase.
Why Traders Use the 200 EMA:
✅ Trend Confirmation – If the price is above the 200 EMA, the trend is bullish; if below, the trend is bearish.
✅ Dynamic Support & Resistance – Price often reacts around the 200 EMA, making it a key level for entries and exits.
✅ Works on All Timeframes – Whether on the 1-minute chart or the daily timeframe, the 200 EMA is effective for scalping, swing trading, and long-term investing.
✅ Easy to Combine with Other Indicators – Traders pair it with RSI, MACD, or price action for stronger confirmation.
How to Use It in Trading:
📌 Trend Trading – Buy when price pulls back to the 200 EMA in an uptrend; sell when price retests it in a downtrend.
📌 Breakout Strategy – A strong candle breaking above/below the 200 EMA signals a possible trend reversal.
📌 Filtering Trades – Many traders only take long trades above and short trades below the 200 EMA to align with the overall market trend.
Conclusion:
The 200 EMA is an essential indicator for traders of all levels, offering clear trend direction, strong support/resistance zones, and trade filtering for better decision-making. Whether you're trading forex, stocks, or crypto, mastering the 200 EMA can give you a significant edge in the markets. 🚀📈

ICT Concepts: MML, Order Blocks, FVG, OTECore ICT Trading Concepts
These strategies are designed to identify high-probability trading opportunities by analyzing institutional order flow and market psychology.
1. Market Maker Liquidity (MML) / Liquidity Pools
Idea: Institutional traders ("market makers") place orders around key price levels where retail traders’ stop losses cluster (e.g., above swing highs or below swing lows).
Application: Look for "liquidity grabs" where price briefly spikes to these levels before reversing.
Example: If price breaks a recent high but reverses sharply, it may indicate a liquidity grab to trigger retail stops before a trend reversal.
2. Order Blocks (OB)
Idea: Institutional orders are often concentrated in specific price zones ("order blocks") where large buy/sell decisions occurred.
Application: Identify bullish order blocks (strong buying zones) or bearish order blocks (strong selling zones) on higher timeframes (e.g., 1H/4H charts).
Example: A bullish order block forms after a strong rally; price often retests this zone later as support.
3. Fair Value Gap (FVG)
Idea: A price imbalance occurs when candles gap without overlapping, creating an area of "unfair" price that the market often revisits.
Application: Trade the retracement to fill the FVG. A bullish FVG acts as support, and a bearish FVG acts as resistance.
Example: Three consecutive candles create a gap; price later returns to fill this gap, offering a entry point.
4. Time-Based Analysis (NY Session, London Kill Zones)
Idea: Institutional activity peaks during specific times (e.g., 7 AM – 11 AM New York time).
Application: Focus on trades during high-liquidity periods when banks and hedge funds are active.
Example: The "London Kill Zone" (2 AM – 5 AM EST) often sees volatility due to European market openings.
5. Optimal Trade Entry (OTE)
Idea: A retracement level (similar to Fibonacci retracement) where institutions re-enter trends after a pullback.
Application: Look for 62–79% retracements in a trend to align with institutional accumulation/distribution zones.
Example: In an uptrend, price retraces 70% before resuming upward—enter long here.
6. Stop Hunts
Idea: Institutions manipulate price to trigger retail stop losses before reversing direction.
Application: Avoid placing stops at obvious levels (e.g., above/below recent swings). Instead, use wider stops or wait for confirmation.

ICT CRT Model Range with EquilibriumICT CRT Model Range with Equilibrium Indicator
This indicator calculates and displays the high, low, and equilibrium levels within a custom-defined session (9:00 am to 10:00 am New York Time and the lines will stop appearing at 16:00pm ). It draws horizontal lines to represent the session's range and marks the equilibrium point as a reference.
What is CRT (Candle Range Theory)?
Candle Range Theory (CRT) is based on the concept that every candle on any timeframe forms its own range. These ranges can either be manipulated—through strategies like Turtle Soup—or broken, resulting in price movements such as engulfing patterns, breakouts, and retests beyond the candle's high or low.
CRT is commonly visualized as a 3-candle model, but it can include more candles due to the presence of inside bars. An inside bar is a candle whose high is not higher than the previous candle's high and whose low is not lower than the previous candle's low.
The CRT model follows the A-M-D structure:
Accumulation (A): The first candle or group of candles (inside bars) represents market consolidation.
Manipulation (M): The second candle signals a false move, often a Turtle Soup setup designed to trap traders.
Distribution (D): The third candle confirms the true market move, breaking out of the range and establishing the trend.
Customizable Settings:
Line Colors: Choose your preferred colors for the high, low, and equilibrium lines.
Line Widths: Adjust the thickness of the lines for better visibility.
Line Styles: Select from solid, dotted, or dashed styles for each line.
Label Settings: Customize the text and colors of the labels for the high, low, and equilibrium points.
Traders can easily modify these settings to suit their visual preferences and trading strategies. This indicator is ideal for identifying price action within a specific range, offering clear visual cues for potential CRT Setup.

Trading TimesThis script is based on the 9 and 20 EMA Strategy and combines Fibonacci Levels for added confluence.
When the price retests after breaking the EMAs, we take the trade in the same direction. That is on breakup, we take a long and on a breakdown we take a short.
VWAP can be enabled from settings for more data. institutions use it to average out their trades for both buy and sell orders.

Enigma End Game Indicator
Enigma End Game Indicator Description
The Enigma End Game indicator is a powerful tool designed to enhance the way traders approach support and resistance, combining mainstream technical analysis with a unique, dynamic perspective. At its core, this indicator enables traders to adapt to market conditions in real time by applying a blend of classic and modern interpretations of support and resistance levels.
In traditional support and resistance analysis, we recognize the significant price points where the market has historically reversed or consolidated. However, the *Enigma End Game* indicator takes this one step further by analyzing each individual candle's high as a potential resistance level and each low as support. This allows the trader to stay more agile, as the market constantly updates and evolves. The dynamic nature of this method acknowledges that price movements are fractal in nature, meaning that these levels are not static but adjust in response to price action on multiple timeframes.
### How It Works:
When using the *Enigma End Game* indicator, it doesn't simply plot buy and sell signals automatically. Instead, the indicator highlights key levels based on the interaction between price and historical price action. Here's how it operates:
1. **Buy Logic:**
The indicator identifies bullish signals based on the *Enigma* logic, but it does not trigger an immediate buy. Instead, it plots arrows above or below the candles, indicating the key price levels where price action has shifted. Traders then focus on these areas, particularly looking for buy opportunities *below* these levels during key market sessions (such as London or New York) while aligning with both mainstream support and resistance and *Enigma* levels.
2. **Sell Logic:**
Similarly, when the indicator identifies a sell signal, it plots an arrow above the candle where price action has reversed. This does not immediately suggest selling. Traders wait for a price retracement back to the previously breached low (for a sell order) or high (for a buy order), observing price action closely on lower timeframes (such as the 1-minute chart) to refine entry points. The entry is triggered when price starts to show signs of reversing at these levels, further validated by mainstream and *Enigma* support/resistance.
### Practical Example – XAU/USD (Gold):
For instance, in the settings of the *Enigma End Game* indicator, if we select the 5-minute (5MN) timeframe as the key level, the indicator will only plot the first 3 arrows following the *Enigma* logic. The arrows will appear above or below the candle that was breached, indicating a potential trend reversal. In this scenario, the first arrow marks the point where price broke a significant support or resistance level. Afterward, the trader watches for a subsequent candle to close below (in the case of a sell) the previous candle’s low, confirming a bearish bias.
Now, the trader does not rush into a sell order. Instead, they wait for the price to pull back towards the previously breached low. At this point, the trader can use a lower timeframe (like the 1-minute chart) to identify both mainstream support and resistance levels and *Enigma* levels above the main 5-minute key level. These additional levels provide a clearer understanding of where price might reverse and give the trader a stronger edge in refining their entry point.
The trader then sets a sell order *above* the price level of the previous low, but only once signs show that price is retracing and ready to fall again. The price point where this retracement occurs, confirmed by both mainstream and *Enigma* levels, becomes the entry signal for the trade.
### Summary:
The *Enigma End Game* indicator combines time-tested principles of support and resistance with a more modern, adaptive view, empowering traders to read the market with greater precision. It guides you to wait for optimal entries, based on dynamic support and resistance levels that change with each price movement. By combining signals on higher timeframes with refined entries on lower timeframes, traders gain a unique advantage in navigating both obvious and hidden levels of support and resistance, ultimately improving their ability to time trades with higher probability of success.
This indicator allows for a more calculated, strategic approach to trading—highlighting the right moments to enter the market while providing the flexibility to adjust to different market conditions.
The *ENIGMA Signals with Retests* indicator is a versatile trading tool that combines key market sessions with dynamic support and resistance levels. It uses logic to identify potential buy and sell signals based on the behavior of recent price swings (highs and lows) and offers flexibility with the number of arrows plotted per session. The user can customize settings like arrow frequency, line styles, and session times, allowing for personalized trading strategies.
The indicator detects buy and sell signals by checking if the price breaks the previous swing high (for buy signals) or swing low (for sell signals). It then stores these levels and draws horizontal lines on the chart, representing critical price levels where traders can expect potential price reactions.
A key feature of this indicator is its ability to limit the number of arrows per session, ensuring a cleaner chart and reducing signal clutter. Horizontal lines are drawn at the identified buy or sell levels, with the option to display labels like "BUY - AT OR BELOW" and "SELL - AT OR ABOVE" to further clarify entry points.
The indicator also incorporates session filtering, allowing traders to focus on specific market sessions (Asia, London, and New York) for more relevant signals, and it ensures that no more than a user-defined number of arrows are plotted within a session.

SMC Order Block & Liquidity EntryThe SMC Order Block and Liquidity Trap Entry Strategy script uses Smart Money Concepts (SMC), which analyze institutional actions in the market, to assist traders in identifying high-probability trades. In order to help traders match their entry with institutional activity, this script highlights important regions of interest, including order blocks, liquidity zones, and indications for Break of Structure (BOS) or Change of Character (CHoCH).
The fundamental ideas of this approach, which focuses on regions where institutions frequently make sizable orders or sweep liquidity, are based on SMC principles. Order blocks, which are frequently important support or resistance zones when institutions are involved, are the final bullish or bearish candle before a significant price move in the other direction. There are liquidity zones that show where retail stop-loss orders build up (above recent highs or below recent lows), such as Buy-Side Liquidity (BSL) and Sell-Side Liquidity (SSL). Before changing the direction of the price, institutions could target these zones, giving traders possible chances.
The script depicts liquidity levels above or below recent highs and lows, automatically finds order blocks within a specified lookback time, and looks for BOS (a continuation signal) or CHoCH (a reversal signal). When liquidity retests inside an order block coincide with BOS or CHoCH circumstances, entry signals are produced. While short entries are triggered when the price breaks below the order block and SSL, long entry alerts are triggered when the price breaks above the order block and BSL.

ICT Panther (By Obicrypto) V1 ICT Panther Indicator: Full and Detailed Description
The ICT Panther Indicator, created by Obicrypto, is an advanced technical analysis tool designed specifically for traders looking to identify key price action events based on institutional trading techniques, particularly in the context of the Inner Circle Trader (ICT) methodology. This indicator helps traders spot market structure breaks, order blocks, and potential trade opportunities driven by institutional behaviors in the market. Here's a detailed breakdown of its features and how it works:
What Does the ICT Panther Indicator Do?
1. Market Structure Breaks (MSB) Identification:
The ICT Panther identifies critical points where the market changes direction, commonly referred to as a break of structure (BoS). When the price breaks above or below certain key levels (based on highs and lows or opens and closes), it signals a potential shift in market sentiment. These break-of-structure points are essential for traders to determine whether the market is likely to continue its trend or reverse.
2. Order Blocks Visualization:
The indicator plots demand (bullish) and supply (bearish) boxes, which represent areas where institutional traders might place significant buy or sell orders. These zones, known as order blocks, are areas where the price tends to pause or reverse, giving traders key insights into potential entry and exit points. The indicator shows these areas graphically as colored boxes on the chart, which can be used to plan trades based on market structure and price action.
3. Pivot Point Detection:
The ICT Panther identifies important pivot points by tracking higher highs and lower lows. These pivot points are critical in determining the strength of a trend and can help traders confirm the direction of the market. The indicator uses a unique algorithm to detect two levels of pivot points:
- First-Order Pivots: Major pivot points where the price makes notable highs and lows.
- Second-Order Pivots: Smaller pivot points, useful for detecting microtrends within the larger market structure.
4. Bullish and Bearish Break of Structure Lines:
When a significant market structure break (BoS) occurs, the indicator will automatically draw red lines (for bearish break of structure) and green lines (for bullish break of structure) at key price levels. These lines help traders quickly see where institutional moves have occurred in the past and where potential future price moves could originate from.
5. Tested and Filled Boxes:
The ICT Panther also has a built-in mechanism to dim previously tested order blocks. When the price tests an order block (returns to a previous demand or supply zone), the box's color dims to indicate that the area has already been tested, reducing its significance. If the price fully fills an order block, the box stops plotting, providing a clear and clutter-free chart.
Key Features
1. Market Structure Break (MSB) Trigger:
- The indicator allows users to select between highs/lows or opens/closes as the trigger for market structure breaks. This flexibility lets traders adjust the indicator to suit their personal trading style or the behavior of specific assets.
2. Order Block Detection and Visualization:
- The tool automatically plots bullish and bearish demand and supply boxes, representing institutional order blocks on the chart. These boxes provide visual cues for areas of potential price action, where institutional traders might be active.
3. Second-Order Pivot Highlighting:
- The ICT Panther offers an option to plot second-order pivots, highlighting smaller pivot points within the larger market structure. These pivots can be helpful for short-term traders who need to react to smaller price movements while still keeping the larger trend in mind.
4. Box Test and Fill Delays:
- Users can configure delays for box tests and box fills, meaning the indicator will only mark a box as tested or filled after a certain number of bars. This prevents false signals and helps confirm that a zone is truly significant in the market.
5. Customization and Visual Clarity:
- The indicator is highly customizable, allowing users to turn on or off various features like:
- Displaying second-order pivots.
- Highlighting candles that broke structure.
- Plotting market structure broke lines.
- Showing or hiding tested and filled demand boxes.
- Setting custom delays for box testing and filling to suit different market conditions.
6. Tested and Filled Order Block Visualization:
- The indicator visually adjusts the tested and filled order blocks, dimming tested zones and removing filled zones to avoid clutter on the chart. This ensures that traders can focus on active trading opportunities without distractions from historical data.
How Does It Work?
1. Detecting Market Structure Breaks (BoS):
- The indicator continuously tracks the market for key price action signals. When the price breaks through previous highs or lows (or opens and closes, depending on your selection), the indicator marks this as a break of structure. This is a critical signal used by institutional traders and retail traders alike to determine potential future price movements.
2. Order Block Identification:
- Whenever a bullish break of structure occurs, the indicator plots a green demand box to show the area where institutional buyers might have placed significant orders. Similarly, for a bearish break of structure, it plots a red supply box representing areas where institutional sellers are active.
3. Pivot Analysis and Tracking:
- As the market moves, the indicator continuously updates first-order and second-order pivot points based on highs and lows. These points help traders identify whether the market is trending or consolidating. Traders can use these pivot points in combination with the order blocks to make informed trading decisions.
4. Box Testing and Filling:
- When the price retests an existing order block, the box dims to show it has been tested. If the price fully fills the box, it is no longer shown, which helps traders focus on the most relevant, untested order blocks.
Benefits for Traders
- Improved Decision-Making: With clear visuals and advanced logic based on institutional trading strategies, this indicator provides a deeper understanding of market structure and price action.
- Reduced Clutter: The indicator intelligently manages the display of order blocks and pivot points, ensuring that traders focus only on the most relevant information.
- Adaptability: Whether you are a swing trader or a day trader, the ICT Panther can be adjusted to fit your trading style, offering robust and flexible tools for tracking market structure and order blocks.
- Institutional Edge: By identifying institutional-level order blocks and market structure breaks, traders using this indicator can trade in line with the strategies of large market participants.
Who Should Use the ICT Panther Indicator?
This indicator is ideal for:
- Crypto, Forex, and Stock Traders who want to incorporate institutional trading concepts into their strategies.
- Technical Analysts looking for precise tools to measure the market structure and price action.
- ICT Traders who follow the Inner Circle Trader methodology and want an advanced tool to automate and enhance their analysis.
- Price Action Traders seeking a reliable indicator to track pivot points, order blocks, and market structure breaks.
The ICT Panther Indicator is a powerful, versatile tool that brings institutional trading techniques to the fingertips of retail traders. Whether you are looking to identify key market structure breaks, order blocks, or crucial pivot points, this indicator offers detailed visualizations and customizable options to help you make more informed trading decisions. With its ability to track the activities of institutional traders, the ICT Panther Indicator equips traders with the insights needed to stay ahead of the market and trade with confidence.
With the ICT Panther Indicator, traders can follow the movements of institutional money, making it easier to predict market direction and capitalize on high-probability trading opportunities.
Enjoy it and share it with your friends!

Follow the Volumes / Path of Least ResistanceThis indicator tracks price movements following significant volume increases. It identifies volume spikes by comparing recent average volume to a longer-term average. After a spike, it monitors price changes over a specified number of bars.
In plain English, the point of this is to “let the market show it’s hand”, vs. other common and preemptive methods of execution.
You can think of it as a better version of a volume up/down indicator which only uses opening and closing prices to identify "bullish" or "bearish" behavior.
To optimize this, I used a very small range chart, hence the small values. You will need to experiment with other values, ESPECIALLY the % change. If you do not do this, the indicator will generate a lot of noise.
The indicator has three main conditions:
1. Significant price increase, bullish: A green triangle appears below the bar.
2. Significant price decrease, bearish: A red triangle appears above the bar.
3. Price change within thresholds: A fuschia triangle appears, pointing up or down based on the overall (short-term) trend. This is common behavior during trends. A spike in volume will appear, and price simply does not budge. Volume/price is essentially declaring a new found value, in which case prices tend to follow the impulse movement (see market profile theory).
The color scheme is intuitive: green for positive moves, red for negative, and fuschia for subtle changes following the existing trend. Blue circles mark volume spikes for reference, which I recommend using only for reference, and disabling to remove unneeded noise.
Because this indicator "lags" in the sense of waiting for the market to show its hand, best opportunities are typically found on retests of the volume spikes themselves. On drives, however, the market will unlikely pullback, which (in my view) is one of its best use cases.
Bottom line, you will need to adjust the parameters to the instrument. This is not a plug and play solution, but far more accurate than those which are.
Settings, and what they mean:
Volume spike average bars: length for identification of high volumes. On smaller timeframes, such as my optimization period, you’ll want several bars. But on something such as a 5 minute or higher, only 1.
Lookback period: for identification of high volumes.
Volume Increase Threshold (%): % which constitutes a jump in volume
Bars After Spike: How long to wait for ensuing price movement. Also sensitive to the timeframe you are using. 1-2 recommended for 5m+, more for smaller range-based.
Negative Price Change Threshold (%): For red arrows (Volume + Price Movement)
Positive Price Change Threshold (%): Inverse of above
WMA Period for Stability Function: When price spikes on high volumes but does not move (price is “trapped” between negative and positive price change thresholds) the indicator marks direction (in fuchsia) in the direction of the underlying trend. This short-term MA identifies that trend.
Finally, because this indicator is volume-based, I recommend using primary instruments only and discourage its use on CFDs or other firm-generated instruments. Just use the primary. I would ignore signals off the open, which is subject to erroneous behavior. Other methods are far more effective for that.
This script is purposely uncomplicated. Feel free to play with settings and change code to suit your needs.

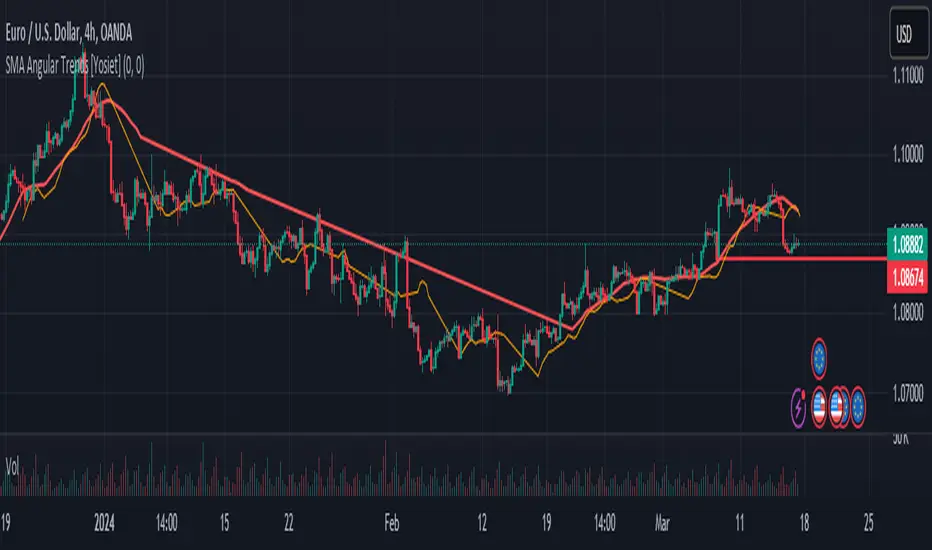
SMA Angular Trends [Yosiet]This indicator uses two specific SMA configurations conditioned by an angular slope that is always repeated in trend markets, which are usually beneficial in swing or long-term strategies.
SETTINGS
- Fast Angle Threshold: Is the value in degrees for the condition of the fast sma
- Slow Angle Threshold: Is the value in degrees for the condition of the slow sma
- Linear Mode: When is active, it shows the sma curves only when the condition is satisfied. When is inactive, it shows color of the trends
HOW TO USE
This indicator it helps to see clearly the trends and the oppotunities to entry/exit in breakouts and retests
WHY THOSE SMAs
The SMAs are sma(7, low) and sma(30, high), those setups came from analyze several others indicators with machine learning searching for convergence points in 2018.
THOUGHTS
This indicator only pretends to help traders to take decissions with extra data confirmation
IMPROVEMENTS
You can comment your ideas and sugestions to improve this indicator
ICT Killzones Toolkit [LuxAlgo]The ICT Killzones Toolkit is a comprehensive set of tools designed to assist traders in identifying key trading zones and patterns within the market.
The ICT Killzones Toolkit includes the following Price Action components:
ICT Killzones with Pivot Highs/Lows
Order Blocks
Breaker Blocks
Fair Value Gaps
Market Structure Shifts
By combining these components, the ICT Killzones Toolkit provides traders with a comprehensive framework for analyzing the market and identifying setups of interest. Leveraging these tools effectively can enhance traders' decision-making process and improve killzones interpretability.
🔶 USAGE
In forex/futures trading, timing is crucial. ICT Killzone are specific periods when there's a higher chance of finding setups of interest. Mastering these time intervals can offer significant advantages to traders who know how to use them effectively.
The image above highlights a potential setup of interest when using the ICT Killzones Toolkit.
As another example for utilizing the ICT Killzones Toolkit, we can see in the image above when price retests setups generated from killzones such as Order Blocks or Fair Value Gaps, a potential strategy could be to look for entries on those & take profits as the next killzone appears.
🔹 Order Blocks
Order Blocks are sections on a price chart where notable buying or selling activity has occured, often signaling interest zones for institutional traders. This toolkit's Order Blocks component pinpoints these areas within the Killzone, which may act as potential support or resistance levels.
🔹 Breaker Blocks
Breaker Blocks are zones built from mitigated order blocks, and highlight zones on the chart where price has previously stalled or reversed. These areas may act as significant barriers to price movement in the future, and the Breaker Blocks component helps traders identify them for potential trading opportunities.
🔹 Fair Value Gaps
Fair value gaps are especially favored by price action traders and arise from market inefficiencies or imbalances, typically when buying and selling are unequal. These gaps often attract price movement before resuming in the same direction. the Fair Value Gaps component of the toolkit helps traders identify and analyze them.
🔹 Market Structure Shifts
Market Structure Shifts refer to significant changes in the overall structure of the market, such as shifts in trend direction, volatility, or trading activity. These shifts can provide valuable insights into market sentiment and potential trading opportunities, and the Market Structure Shifts component helps traders identify and interpret them.
Overall, the ICT Killzone Toolkit combines these components to provide traders with a comprehensive framework for analyzing the markets and identifying high-probability trading setups.
🔶 SETTINGS
🔹 ICT Killzones
Asian, London Open, New York, and London Close: toggles the visibility of specific Killzones, allowing users to customize time periods and Killzone colors.
Killzone Lines : Top/Bottom, Mean and Extend Top/Bottom: toggles the visibility of the Killzone's pivot high and low lines, mean (average) line, and allows users to extend the pivot lines.
Killzone Labels: Toggles the visibility of the Killzone labels.
Display Killzones within Timeframes Up To: Toggles the visibility of the Killzones up to selected Timeframes.
Open Price, Separator, Label, and Color: toggles the visibility of the open price of the Killzones or for the day, week, or month. If the day, week, or month is selected, a separator will be displayed to highlight the beginning of each respective period. Additionally, users can customize the color and toggle the label as needed.
🔹 Order Blocks & Breaker Blocks
Order Blocks | Breaker Blocks: toggles the visibility of the order blocks & breaker blocks.
Swing Detection Length: lookback period used for the detection of the swing points used to create order blocks & breaker blocks.
Mitigation Price: allows users to select between closing price or wick of the candle.
Use Candle Body in Detection: allows users to use candle bodies as order block areas instead of the full candle range.
Remove Mitigated Order Blocks & Breaker Blocks: toggles the visibility of the mitigated order blocks & breaker blocks.
Extend Order Blocks & Breaker Blocks: enables processing of the order blocks & breaker blocks beyond the boundaries of the killzones.
Display Order Blocks & Breaker Blocks: enables the display of the first, last, or all occurrences of the order blocks & breaker blocks.
Order Blocks : Bullish, Bearish Color: color customization option for order blocks.
Breaker Blocks : Bullish, Bearish Color: color customization option for breaker blocks.
Show Order Blocks & Breaker Blocks Text: toggles the visibility of the order blocks & breaker blocks labels.
🔹 Market Structure Shifts
Market Structure Shifts: toggles the visibility of the market structure shifts.
Detection Length: market structure shift detection length.
Display Market Structure Shifts: enables the display of the first, last, or all occurrences of the market structure shifts.
Market Structure Shifts : Bullish, Bearish Color: color custumization option for market structure shifts.
Show Market Structure Shifts Text: toggles the visibility of the market structure shifts labels.
🔹 Fair Value Gaps
Fair Value Gaps: toggles the visibility of the fair value gaps.
Fair Value Gap Width Filter: filtering threshold wile detecting fair value gaps.
Remove Mitigated Fair Value Gaps: removes mitigated fair value gaps.
Extend Fair Value Gaps: enables processing of the fair value gaps beyond the boundaries of the killzones.
Display Fair Value Gaps: enables the display of the first, last, or all occurrences of the fair value gaps.
Bullish Imbalance Color: color customization option.
Bearish Imbalance Color: color customization option.
Show Fair Value Gaps Text: toggles the visibility of the fair value gaps labels.
🔶 RELATED SCRIPTS
Smart-Money-Concepts
Order-Blocks-Breaker-Blocks
Thanks to our community for recommending this script. For more conceptual scripts and related content, we welcome you to explore by visiting >>> LuxAlgo-Scripts .

[MAD] Harmonic Wave Fourier AnalysisThis script uses Fourier Analysis with additional postcalculations to draw a plot which displays the Amplitude-Change of the Fouriers
Parameter Settings:
You can set the number of data points to analyze
the period to check for extremes.
Fourier Transform: The script breaks down the time series data into its frequency components using cosine and sine calculations.
Harmonic Analysis: It calculates the strength and phase of each frequency component, producing harmonic waves.
Amplitude Change: It determines the change in amplitude between peaks and troughs for each harmonic.
Latest Value Extraction: The script selects the middle amplitude change as the latest data point.
High/Low Points: Finds the maximum and minimum amplitude changes over a specified period.
Visualization: It plots the latest amplitude change with a color that indicates its value relative to the identified extremes.
splitted by 3 Blue plots (1/3 1/2 2/3 from min to max)
How to trade?
May go for retests to the blue lines after big moves.
See this script as braindump of an idea, so its just a concept :-)

Doji TrenderDoji Trender searches multiple timeframes for candles where open and close are less than dojiPercent apart (default 0.025%), and plots the trends between them.
Experiment with dojiPercent to change the number of "dojis" detected. I will add doji sub-type indication if it appears to be meaningful.
By default, it plots the 5m (red), 15m (orange), 1h (yellow), 4h (green), and chart (cyan). If the chart timeframe is any of the configurable ones, the chart copy won't be drawn. (I might reverse that, so that cyan is always drawn.)
Since doji points are somewhat sparse, and the lookback is short (default 10), the EMA's make drastic corrections toward new indecision. (I'm not convinced the EMA's are useful and/or relevant.)
This works on any timeframe, but seems to work best on the 1D. (5m is somewhat irrelevant on the 1D, so there are tweaks to be made.)
Dojis from a timeframe are corrections to a doji trend from a higher timeframe.
Red corrects to orange, corrects to yellow, corrects to green.
If the chart timeframe is > 4h, the others will correct to cyan.
Otherwise, cyan will fit in-between the adjacent timeframes.
Multiple indecision candles within a short timespan forming sharp peaks indicate retests, backtests, rejections, and bounces off of support/resistance.
With a correct larger-timeframe channel, one would expect lower-timeframe indecision at/along typical levels.
Although the doji's have unpredictable wicks, the dots printed by this indicator do not. Matched with volume, they reveal the prices where the most violent battles between bulls and bears took place, and are likely to take place, again.
One could:
1) Put trends on the longest segments, then look for confluence along them, and/or near the intersections.
2) Use lower-timeframe doji trends to estimate the direction of the higher-timeframe doji trends, before they become detectable to Doji Trender. Confirm by looking for confluence where those trends intersect with horizontal support/resistance, this indicator, and/or others.
3) Notice that multiple legs on the same trend line are close to parallel, if not colinear.
4) Notice that many of the doji segments point toward (very-distant) future dojis.
5) Drop horizontal lines on the dots where we previously reversed, and find confluence in VRVP when we revisit them.
6) Create parallel (fib/whatever) channels that more-closely match MM's intent. The segments one uses to set the angle of the channel, and those used to align the channel, vertically, are not always the same:
a) Match the channel slope to as many doji slopes as possible, considering every trend.
b) Figure out where the channel actually belongs, re-considering every trend.

SMA mechanical swing tradeIndicator that compares the closing price of an asset vs a simple moving average as a mechanical swing trading strategy. It allows the user to set any asset and timeframe for the strategy, which can be different from those the user is currently viewing. The strategy also allows the user to set an upside and downside tolerance so that retests within a few % of the SMA get some space to breathe before flipping directional bias.
If the selected asset in the strategy is different from the one currently viewed, the indicator plots the MA for the currently viewed asset but keeps applying the directional bias colors from the strategy asset.
Some examples of recommended usage of this indicator: BTCUSD 120D, BTCUSD 120D applied on ETHUSD, AAVEUSD 365D.

ICT Silver Bullet [LuxAlgo]The ICT Silver Bullet indicator is inspired from the lectures of "The Inner Circle Trader" (ICT) and highlights the Silver Bullet (SB) window which is a specific 1-hour interval where a Fair Value Gap (FVG) pattern can be formed.
When a FVG is formed during the Silver Bullet window, Support & Resistance lines will be drawn at the end of the SB session.
There are 3 different Silver Bullet windows (New York local time):
The London Open Silver Bullet (3 AM — 4 AM ~ 03:00 — 04:00)
The AM Session Silver Bullet (10 AM — 11 AM ~ 10:00 — 11:00)
The PM Session Silver Bullet (2 PM — 3 PM ~ 14:00 — 15:00)
🔶 USAGE
The ICT Silver Bullet indicator aims to provide users a comprehensive display as similar as possible to how anyone would manually draw the concept on their charts.
It's important to use anything below the 15-minute timeframe to ensure proper setups can display. In this section, we are purely using the 3-minute timeframe.
In the image below, we can see a bullish setup whereas a FVG was successfully retested during the Silver Bullet session. This was then followed by a move upwards to liquidity as our target.
Alternatively, you can also see below a bearish setup utilizing the ICT Silver Bullet indicator outlined.
At this moment, the indicator has removed all other FVGs within the Silver Bullet session & has confirmed this FVG as the retested one.
There is also a support level marked below to be used as a liquidity target as per the ICT Silver Bullet concept suggests.
In the below chart we can see 4 separate consecutive examples of bullish & bearish setups on the 3-minute chart.
🔶 CONCEPTS
This technique can visualize potential support/resistance lines, which can be used as targets.
The script contains 2 main components:
• forming of a Fair Value Gap (FVG)
• drawing support/resistance (S/R) lines
🔹 Forming of FVG
1 basic principle: when a FVG at the end of the SB session is not retraced, it will be made invisible.
Dependable on the settings, different FVG's will be shown.
• 'All FVG': all FVG's are shown, regardless the trend
• 'Only FVG's in the same direction of trend': Only FVG's are shown that are similar to the trend at that moment (trend can be visualized by enabling ' Show ' -> ' Trend ')
-> only bearish FVG when the trend is bearish vs. bullish FVG when trend is bullish
• 'strict': Besides being similar to the trend, only FVG's are shown when the closing price at the end of the SB session is:
– below the top of the FVG box (bearish FVG)
– above bottom of the FVG box (bullish FVG)
• 'super-strict': Besides being similar to the trend, only FVG's are shown when the FVG box is NOT broken
in the opposite direction AND the closing price at the end of the SB session is:
– below bottom of the FVG box (bearish FVG)
– above the top of the FVG box (bullish FVG)
' Super-Strict ' mode resembles ICT lectures the most.
🔹 Drawing support/resistance lines
When the SB session has ended, the script draws potential support/resistance lines, again, dependable on the settings.
• Previous session (any): S/R lines are fetched between current and previous session.
For example, when current session is ' AM SB Session (10 AM — 11 AM) ', then previous session is
' London Open SB (3 AM — 4 AM) ', S/R lines between these 2 sessions alone will be included.
• Previous session (similar): S/R lines are fetched between current and previous - similar - session.
For example, when current session is ' London Open SB (3 AM — 4 AM)' , only S/R lines between
current session and previous ' London Open SB (3 AM — 4 AM) ' session are included.
When a new session starts, S/R lines will be removed, except when enabling ' Keep lines (only in strict mode) '
This is not possible in ' All FVG ' or ' Only FVG's in the same direction of trend ' mode, since the chart would be cluttered.
Note that in ' All FVG ' or ' Only FVG's in the same direction of trend ' mode, both, Support/Resistance lines will be shown,
while in Strict/Super-Strict mode:
• only Support lines will be shown if a bearish FVG appears
• only Resistance lines if a bullish FVG is shown
The lines will still be drawn the the end of the SB session, when a valid FVG appears,
but the S/R lines will remain visible and keep being updated until price reaches that line.
This publication contains a "Minimum Trade Framework (mTFW)", which represents the best-case expected price delivery, this is not your actual trade entry - exit range.
• 40 ticks for index futures or indices
• 15 pips for Forex pairs.
When on ' Strict/Super-Strict ' mode, only S/R lines will be shown which are:
• higher than the lowest FVG bottom + mTFW, in a bullish scenario
• lower than the highest FVG bottom - mTFW, in a bearish scenario
When on ' All FVG/Only FVG's in the same direction of trend ' mode, or on non-Forex/Futures/Indices symbols, S/R needs to be higher/lower than SB session high/low.
🔶 SETTINGS
(Check CONCEPTS for deeper insights and explanation)
🔹 Swing settings (left): Sets the length, which will set the lookback period/sensitivity of the Zigzag patterns (which directs the trend)
🔹 Silver Bullet Session; Show SB session: show lines and labels of SB session
Labels can be disabled separately in the ' Style ' section, color is set at the ' Inputs ' section.
🔹 FVG
– Mode
• All FVG
• Only FVG's in the same direction of trend
• Strict
• Super-Strict
– Colors
– Extend: extend till last bar of SB session
🔹 Targets – support/resistance lines
– Previous session (any): S/R lines fetched between current and previous SB session
– Previous session (similar): S/R lines fetched between current and previous similar SB session
– Colors
– Keep lines (only in strict mode)
🔹 Show
– MSS ~ Session: Show Market Structure Shift , only when this happens during a SB session
– Trend: Show trend (Zigzag, colored ~ trend)

TASC 2023.07 Keeping With The Larger Trend█ OVERVIEW
TASC's July 2023 edition of Traders' Tips features an article by Barbara Star titled "Stay On Track With The Supertrend Indicator". The article explores how the supertrend indicator , whether used as a standalone tool or in conjunction with other indicators, can assist traders in aligning with the larger trend. Drawing inspiration from the article, this script enhances the supertrend indicator with additional visual and analytical features, making it easier to analyze the readings and make informed trading decisions.
█ CONCEPTS
Over the past few years, the supertrend indicator has gained significant popularity among traders. Unlike moving averages, it incorporates both price and volatility information, enabling traders to navigate upward or downward trends despite occasional price disruptions.
When using the supertrend indicator, a trader may consider entering a long position when the price surpasses the supertrend line or retraces to it after the initial crossover. Similarly, for short positions, a trader could enter when the price drops below the supertrend line or retests it. Exiting these positions can be triggered by the opposite scenario, such as a price drop below the supertrend line for long positions or a price rise above the supertrend line for short positions. To assist in monitoring the distance between the price and the indicator line, this script introduces the following display features:
Breach levels, representing fractions of the most recent maximum distance.
On-chart signals indicating crossings of the highest and lowest breach levels.
An infobox displaying the average value of the maximum distance.
█ CALCULATIONS
For calculating the supertrend line, this script uses the built-in function ta.supertrend() . Additionally, the script showcases the use of state-of-the-art PineScript® functionality, including methods and tables .
Volume profile zonesHi all!
This script calculates and shows the volume profile for the range of a higher timeframe candle. It then shows support or resistance (/supply or demand) zones based on the volume profiles with the most volume. The defaults are just my preferred settings so feel free to play with them! Also feel free to let me know about bugs and features. I already have a list of features to make, e.g.:
base on pivots
more info zone calculations, e.g. breaks and retests, virgin point of control etc.
add alerts
get rid of getPriceLevels()
get rid of _barVolumeProfile prefix
handle realtime
...
Best of trading luck!

Y/Q/M/W aVWAP BandsYearly, Quarterly, Monthly or Weekly VWAP with Standard Deviation Envelope
Previous Y/Q/M/W VWAP and Band are extended forward automatically*
VWAP standard deviation envelope serves as a kind of Value Area, with the boundaries of the envelope acting as support and resistance. Previous envelops often show confluence with price action once price retests them.
Helpful to form a bias on the available time frames, find areas of support and resistance, and determine acceptance/rejection from breakouts or consolidations.
* this is a unique feature of this script

BTC 1D Alerts V1This script contains a variety of key indicator for bitcoin all-in-one and they can be activated individually in the menu. These are meant to be used on the 1D chart for Bitcoin.
1457 Day Moving Average: the bottom of the bitcoin price and arguably the rock bottom price target.
Ichimoku Cloud: a common useful indicator for bitcoin support and resistance.
350ma fibs (21 8 5 3 2 and 1.6) : Signify the tops of each logarthmic rise in bitcoin price. They are generally curving higher over the long term. For halvening #3, the predicted market crash would be after hitting the 350ma x3 fib. Also the 350 ma / 111 ma cross signifies bull market top within about 3 days as well. Using the combination of the 350ma fibs and the 350/111 crosses, reasonably identify when market top is about to occur.
50,120,200 ma: Common moving averages that bitcoin retests during bull market runs. Also, the 50/200 golden and death crosses.
1D EMA Superguppy Ribbons: green = bull market, gray is indeterminate, red = bear market. Very high specificity indicator of bull runs, especially for bitcoin. You can change to 3D candle for even more specificity for a bull market start. Use the 1W for even more specificity. 1D Superguppy is recommended for decisionmaking.
1W EMA21: a very good moving average programmed to be shown on both the daily and weekly candle time. Bitcoin commonly corrects to this repeatedly during past bull runs. Acts as support during bull run and resistance during a bear market.
Steps to identifying a bull market:
1. 50/200 golden cross
2. 1D EMA superguppy green
3. 3D EMA superguppy green (if you prefer more certainty than step 2).
4. Hitting the 1W EMA21 and bouncing off during the bull run signifies corrections.
Once a bull market is identified,
Additional recommended buying and selling techniques:
Indicators:
- Fiblines - to determine retracements from peaks (such as all time high or recent highs)
- Stochastic RSI - 1d, 3d, and 1W SRSI are great time to buy, especially the 1W SRSI which comes much less frequently.
- volumen consolidado - for multi exchange volumes compiled into a single line. I prefer buying on the lowest volume days which generally coincide with dips.
- MACD - somewhat dubious utility but many algorithms are programmed to buy or sell based on this.
Check out the Alerts for golden crosses and 350ma Fib crosses which are invaluable for long term buying planning.
I left this open source so that all the formulas can be understood and verified. Much of it hacked together from other sources but all indicators that are fundamental to bitcoin. I apologize in advance for not attributing all the articles and references... but then again I am making no money off of this anyway.

Advanced Concept V4 Change your trading time zone to New York . To maximize readiness for institutional trading setups based on the prescribed models, traders should set alarms for specific times in the New York Time Zone (EST/EDT), which is generally 10.5 hours behind IST.
Asian Stop Hunt Model
The Stop Hunt Model is a liquidity-based strategy designed to exploit market stop-loss sweeps by aligning with the IPDA daily bias. The core idea is to wait for price to sweep the engineered liquidity of the Asian Session High or Low (after 10:30 AM IST). Once the sweep occurs, the trader confirms the market's true direction via a Change of Character (CHoCH) on the lower timeframe. The entry is then taken only on a retest of the resulting price inefficiency, specifically a Balanced Price Range (BPR) or imbalance, which represents the institutional entry point. By targeting the next major liquidity pool with a minimum 1:3 risk-to-reward ratio, the model prioritizes discipline and quality over frequent trading.
The New York Open Model
The New York Open Model is an index-focused strategy (SPX500, NAS100, US30) that trades solely during the New York Session (9:30 AM – 12:30 PM NYT). It establishes a Range Zone high and low from midnight until the open, treating these boundaries as institutional liquidity targets. Execution is triggered by a mandatory liquidity sweep of one side of this range, followed by a confirming Change of Character (CHoCH) on the 1-minute chart. Entry is taken precisely on the retest of a resulting price inefficiency (like an FVG), aiming for the opposite side of the session range, prioritizing simplicity, timing, and controlled risk over external biases like IPDA.
The ATM Strategy
The ATM Strategy is a high-precision, New York-session trading model designed to capture institutional liquidity moves using the IPDA directional bias. The strategy operates by first defining a Range Zone (00:00 to 8:30 AM NY time) where high and low boundaries act as liquidity targets. Execution is restricted to the Trading Zone (8:30AM to 12:30 PM NY time) and is only triggered when price executes a mandatory liquidity sweep of one range boundary that aligns with the IPDA bias. This sweep must then be confirmed on the 1-minute chart by a Change of Character (CHoCH). Final entry is taken on the retest of a resulting price inefficiency (like an FVG or BPR), with targets set at session highs or lows, ensuring institutional-style execution with high clarity and discipline.
The Central Bank Dealer Range (CBDR)
The Central Bank Dealer Range (CBDR) model is a disciplined, institutional trading strategy used on the 15-minute chart, primarily focusing on London Session liquidity for major currency pairs. The core idea is to align with Interbank Price Delivery Algorithm (IPDA) bias, which dictates a mandatory liquidity sweep (a false breakout of the previous day's high or low) must occur first. Following this sweep, a visible price imbalance (Fair Value Gap) must form within the London Session. Entry is strictly taken only on the retest of this imbalance zone, confirming institutional order flow, with a fixed target at the opposite boundary of the previous day's range.

BO Rule: Full Suite (Auto-Clean)** **
**BO Rule: Ultimate Breakout & Retest Suite (Body Only + Strict Sequence)**
This is a comprehensive Price Action indicator designed for traders who focus on **Structure Break & Retest** setups. Unlike standard fractal indicators, this script employs a strict "New Price Rule" and "Body-Only" logic to filter out noise, combined with a Multi-Timeframe (MTF) Dashboard and Mobile Alerts.
**Key Logic & Unique Features:**
1. **Classic Levels (Body Only):**
* **Logic:** Resistance is defined by a Green candle followed by a Red candle. Support is Red followed by Green.
* **Precision:** The script strictly uses Candle **Bodies** (Open/Close) to define levels and confirm breakouts. Wicks are ignored to avoid volatility fakeouts.
2. **Strict Sequence (New Price Rule):**
* **Reset Logic:** Once a breakout signal is confirmed, all previous structure levels are immediately invalidated.
* The script only scans for *new* structure levels formed *after* the latest confirmed signal. This ensures you are always trading the most current market structure.
3. **Smart Visualization (Auto-Clean):**
* **Queue System:** To keep your chart clean, the script includes a "Display Limit" feature. It only keeps the most recent N signals (e.g., 20) and automatically deletes the oldest ones.
4. **MTF Dashboard & Conflicts:**
* Includes a bottom-right dashboard showing trend directions across 5 user-defined timeframes.
* Displays "Conflict" lines if different timeframes show opposing signals on the same bar.
5. **Filter Duplicates:**
* Option to show only **Trend Reversals** (Buy -> Sell -> Buy) by hiding consecutive signals in the same direction.
6. **Mobile Notifications:**
* Supports custom alerts for specific timeframe reversals, designed to push notifications directly to the TradingView App.
**How to Trade:**
* **Green Dashed Line:** Bullish Confirmation (Body Breakout + Retest).
* **Red Dashed Line:** Bearish Confirmation (Body Breakdown + Retest).
* **Dashboard:** ▲ = Bullish Trend, ▼ = Bearish Trend.
-------------------------------------------------------
** **
**BO Rule: 經典水平突破回踩策略 (實體判斷 + 嚴格序列 + 自動清理)**
這是一個專為裸K交易者 (Price Action) 設計的完整突破回踩系統。它採用了嚴格的「新價格規則」與「僅看實體」邏輯,並整合了多週期儀表板與手機通知功能。
**核心邏輯與獨特功能:**
1. **經典水平 (僅看實體 Body Only):**
* **定義:** 阻力位由「綠K接紅K」形成;支撐位由「紅K接綠K」形成。
* **過濾:** 系統僅使用 K棒實體 (收盤/開盤) 來定義水平與判斷突破,完全忽略影線 (Wicks),有效避免假突破。
2. **新價格規則 (嚴格序列):**
* **重置機制:** 採用「最新優先」原則。一旦當前訊號確認,之前所有的舊結構水平立即作廢。系統只會尋找在「最新訊號之後」形成的新水平,確保交易邏輯符合當下的市場結構。
3. **智能顯示 (自動清理):**
* **佇列系統:** 為了保持圖表整潔,您可以設定「保留最近 N 個訊號」。系統會自動刪除最舊的線段,避免圖表充滿歷史線條。
4. **多週期 (MTF) 儀表板:**
* 右下角面板可同時監控 5 個不同時間級別的趨勢狀態。
* 若不同週期在同一根 K 棒出現相反訊號,會標記為「衝突」。
5. **過濾重複訊號:**
* 可勾選「只顯示反轉」。若當前是多頭,系統會隱藏後續的多頭訊號,直到出現空頭訊號為止 (呈現:多 -> 空 -> 多)。
6. **手機 App 通知:**
* 支援針對特定週期的反轉訊號發送推播通知。
**使用說明:**
* **綠色虛線**:多頭確認 (實體突破 + 回踩)。
* **紅色虛線**:空頭確認 (實體跌破 + 回踩)。
* **儀表板**:▲ = 多頭趨勢,▼ = 空頭趨勢。

BO Rule: Body & Filter Duplicates** **
**BO Rule: Advanced Breakout & Retest (Body Only + Strict Sequence)**
This indicator is designed for Price Action traders who focus on **Structure Break & Retest** setups. Unlike standard fractal indicators, this script employs a strict "New Price Rule" and "Body-Only" logic to filter out noise and identifying high-probability trend reversals.
**Key Logic & Features:**
1. **Classic Levels (Body Only):**
* Resistance is defined by a Green candle followed by a Red candle.
* Support is defined by a Red candle followed by a Green candle.
* **Crucial:** The script strictly uses Candle **Bodies** (Open/Close) to define levels, ignoring Wicks to avoid fakeouts caused by market volatility.
2. **Strict Sequence (New Price Rule):**
* The "Reset Logic" ensures that once a signal is confirmed, all previous structure levels are considered obsolete.
* The script resets its memory and only looks for *new* structure levels formed *after* the latest confirmed signal.
3. **Breakout & Retest Confirmation:**
* The script waits for a valid breakout of the classic level.
* It then monitors for a **Retest & Rejection**.
* Signal is generated only when price revisits the broken level and closes respecting the new direction.
4. **Trend Filter (No Duplicates):**
* **Option Included:** You can enable "Filter Duplicate Signals" to see only Trend Reversals (e.g., Buy -> Sell -> Buy). This hides consecutive signals in the same direction to keep the chart clean.
5. **MTF Dashboard:**
* Monitor up to 5 different timeframes simultaneously on one chart.
**How to Use:**
* **Green Dashed Line:** Bullish Confirmation (Breakout + Retest).
* **Red Dashed Line:** Bearish Confirmation (Breakdown + Retest).
* **Settings:** You can toggle the "Filter Duplicates" and "New Price Rule" in the settings menu.
-------------------------------------------------------
** **
**BO Rule: 經典水平突破回踩 (實體判斷 + 嚴格序列規則)**
這是一個專為裸K交易者 (Price Action) 設計的突破回踩指標。與傳統指標不同,它採用了嚴格的「新價格規則」與「僅看實體」邏輯,能有效過濾假突破並識別趨勢反轉。
**核心邏輯與功能:**
1. **經典水平 (僅看實體 Body Only):**
* 阻力位:由「綠K」接「紅K」形成。
* 支撐位:由「紅K」接「綠K」形成。
* **重點:** 系統僅使用 K棒實體 (收盤/開盤) 來定義水平,完全忽略影線 (Wicks),以避免影線造成的假訊號。
2. **新價格規則 (嚴格序列):**
* 採用「最新優先」原則。一旦當前訊號確認,之前所有的舊結構水平立即作廢。
* 系統只會尋找在「最新訊號之後」形成的新水平,確保交易邏輯符合當下的市場結構。
3. **突破回踩確認:**
* 偵測到實體突破後,系統會進入監控模式。
* 只有當價格回踩該水平並成功「拒絕」(收盤守住) 時,才會發出訊號。
4. **過濾重複訊號 (只看反轉):**
* **設定選項:** 您可以勾選「過濾重複方向訊號」。
* 勾選後,若當前是多頭,系統會隱藏後續的多頭訊號,直到出現空頭訊號為止 (呈現:多 -> 空 -> 多),讓圖表更乾淨。
5. **多週期 (MTF) 監控:**
* 可同時監控 5 個不同時間級別的突破狀態。
**使用說明:**
* **綠色虛線**:多頭確認 (5 多)。
* **紅色虛線**:空頭確認 (5 空)。

SNIPER ORB V4SNIPER ORB V4
### What It Does
Draws 5/15/30 minute Opening Range Breakout levels with confirmation patterns.
### Session Times
| Session | Hours (ET) |
|---------|------------|
| London | 3:00 - 9:30 |
| New York | 9:30 - 17:00 |
### Levels Drawn
| Level | Color Default | Purpose |
|-------|---------------|---------|
| 5m ORB H/L | Blue | Scalp levels |
| 15m ORB H/L | Cyan | Swing levels |
| 30m ORB H/L | Purple | **Primary levels** |
| Targets 1x-3x | Green/Red | Profit targets |
### Signals
| Signal | Meaning | Priority |
|--------|---------|----------|
| `ORB↑` | Confirmed breakout up | ⭐⭐ |
| `ORB↓` | Confirmed breakout down | ⭐⭐ |
| `RT↑` | Retest long entry | ⭐⭐⭐ **BEST** |
| `RT↓` | Retest short entry | ⭐⭐⭐ **BEST** |
| `FVG↑` | FVG zone long | ⭐⭐⭐ |
| `FVG↓` | FVG zone short | ⭐⭐⭐ |
| `ABS` | Absorption (caution) | ⚠️ Warning |
| `FK!` | Fakeout detected | ❌ Avoid |
### FVG Zones (Blue Boxes)
- **Bullish FVG** = Gap below price → Support zone
- **Bearish FVG** = Gap above price → Resistance zone
- **Best Entry** = Price touches FVG + Engulfing candle
### Bar Colors
| Color | Meaning |
|-------|---------|
| Bright Green | Bullish breakout confirmed |
| Bright Red | Bearish breakout confirmed |
| Light Green | Bullish retest entry |
| Light Red | Bearish retest entry |
### Info Table Key
| Field | Green = Good | Yellow/Orange = Caution |
|-------|--------------|-------------------------|
| Volume | HIGH VOL | Normal |
| Body | STRONG (70%+) | Normal/Weak |
| Status | BROKE HIGH/LOW | IN RANGE |
### Quick Trade Plan
```
LONG:
1. Wait for 30m ORB to complete
2. Watch for ORB↑ breakout
3. WAIT for pullback to ORB High
4. Enter on RT↑ or FVG↑ signal
5. SL = Below 30m ORB Low
6. TP = Target 1x or 2x
SHORT:
1. Wait for 30m ORB to complete
2. Watch for ORB↓ breakout
3. WAIT for pullback to ORB Low
4. Enter on RT↓ or FVG↓ signal
5. SL = Above 30m ORB High
6. TP = Target 1x or 2x
```
---
