Fibonacci Ranges (Real-Time) [LuxAlgo]The "Fibonacci Ranges" indicator combines Fibonacci ratio-derived ranges (channels), together with a Fibonacci pattern of the latest swing high/low.
🔶 USAGE
The indicator draws real-time ranges based on Fibonacci ratios as well as retracements. Breakouts from a Fibonacci Channel are also indicated by labels, indicating a potential reversal.
Each range extremity/area can also be used as support/resistance.
🔶 CONCEPTS
Fibonacci Channels
Latest Fibonacci
Both, Latest Fibonacci and Fibonacci Channels , display different Fibonacci levels (labels not included in the code):
However, the 2 react in a totally different way.
🔹 Fibonacci Channels
2 conditions must be fulfilled until a Fibonacci Channel is displayed:
New swing high/low
close has to be between chosen limits/levels ( Break level )
As visual guidance, chosen Break levels are accentuated by 2 small gray blocks:
Once the channel is displayed, it will remain visible until x consecutive bars break out of the chosen Break level at closing time.
• x consecutive bars is set by Break count .
The amount of breaks is counted in the code. When the price, without breaking the user-set limit, closes back between the 2 levels, the count is reset to 0.
By enabling Channels and Shadows you can see previous channels (" Shadows ", which is always delayed with 1 bar)
Previous channels can be helpful in finding potential support/resistance areas, especially from large channel blocks
The more narrow Break levels are set the less chance the price closes between these 2 levels, and the quicker close breaks out.
In other words, narrow levels give fewer & smaller channels, broader levels give more & larger channels.
Note:
• swing settings: L & R
• Break count (x consecutive bars that close outside chosen levels to invalidate the Fibonacci Channel )
will also be of influence in displaying the channels.
• Show breaks enable you to visualize signals when there is a break:
• Alerts can also be set ( Break Down / Break Up )
🔹 Latest Fibonacci
This displays the Fibonacci levels between the latest swing high and swing low, independently from the Fibonacci Channel .
The Lastest Fibonacci can be helpful in detecting the current trend against the larger Fibonacci Channel .
🔶 SETTINGS
🔹 Swing Settings
L: set left of pivothigh / pivotlow
R: set right of pivothigh / pivotlow
🔹 Fibonacci Channels
Channel : Channel / Channels + Shadows / None
Break level
-0.382 - 1.382
0.000 - 1.000
0.236 - 0.764
0.382 - 0.618
Break count
🔹 Fibonacci
Toggle
Colours: [ -0.382 - 0 ], [ 0.236 - 0.382 ], [ 0.5 ], [ 0.618 - 0.764 ], [ 1 - 1.382 ]
"reversal"に関するスクリプトを検索

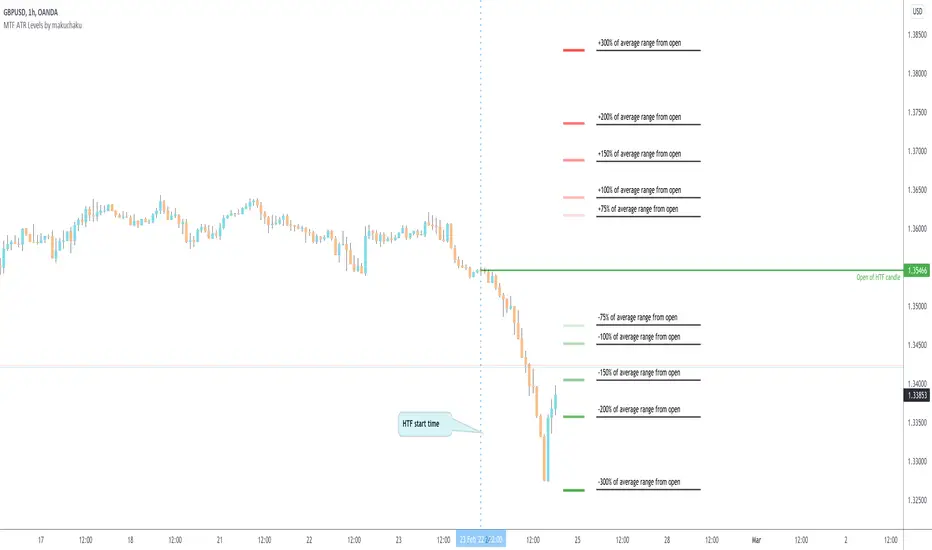
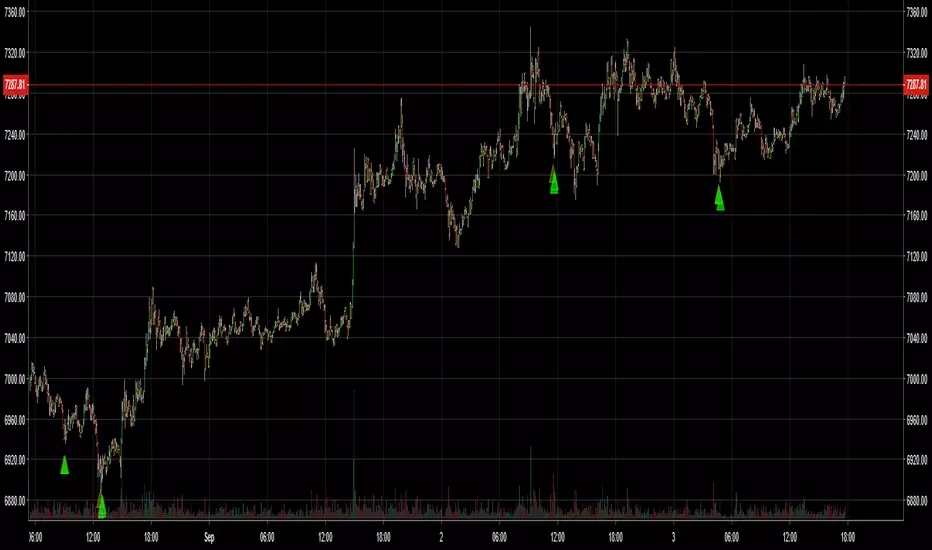
MTF ATR Levels by makuchakuKnowing how big a range one is operating in (from a higher time frame perspective) is very important to understand where the reversals could potentially come from.
This indicator uses the closing price of previous HTF candle and plots its ATR range - and several levels on top of it.
+/- 75%
+/- 100%
+/- 150%
+/- 200%
+/- 300%
Consecutive Color Reversal for Binary Option TradingThis indicator is only for Binary Option trading. It alerts when a specific number of consecutive same color candlesticks are generated and it signals for a reversal. As an example, when it signals "Long", a long trade should be opened for a few of next candlesticks (upto 2 to 3 candles).

Adjustable MA & Alternating Extremities [LuxAlgo]Returns a moving average allowing the user to control the amount of lag as well as the amplitude of its overshoots thanks to a parametric kernel. The indicator displays alternating extremities and aims to provide potential points where price might reverse.
Due to user requests, we added the option to display the moving average as candles instead of a solid line.
Settings
Length: MA period, refers to the number of most recent data points to use for its calculation.
Mult: Multiplicative factor for each extremity.
As Smoothed Candles: Allows the user to show the MA as a series of candles instead of a solid line.
Show Alternating Extremities : Determines whether to display the alternating extremities or not.
Lag: Controls the amount of lag of the MA, with higher values returning a MA with more lag.
Overshoot: Controls the amplitude of the overshoots returned by the MA, with higher values increasing the amplitude of the overshoots.
Usage
Moving averages using parametric kernels allows users to have more control over characteristics such as lag or smoothness; this can greatly benefit the analyst. A moving average with reduced lag can be used as a leading moving average in a MA crossover system, while lag will benefit moving averages used as slow MA in a crossover system.
Increasing 'Lag' will increase smoothness while increasing 'overshoot' will reduce lag.
The following indicator puts more emphasis on its alternating extremities, an upper extremity will be shown once the high price crosses the upper extremity, while a low extremity will be shown once the low price crosses the lower extremity. These can be interpreted like extremities of a band indicator.
The MA using a length value of 200 with a multiplicative factor of 1.
In general, extremities will effectively return points where price might potentially bounce in ranging markets while closing prices under trending markets will often be found above an upper extremity and under a lower extremity.
Reducing the lag of the moving average allows the user to obtain a more timely estimate of the underlying trend in the price, with a better fit overall. This allows the user to obtain potentially pertinent extremities where price might reverse upon a break, even under trending markets.
In the above chart, the price initially breaks the upper extremity, however, we can observe that the upper extremity eventually reaches back the price, goes above it, provides a resistance, and effectively indicates a reversal.
Users can plot candles from the moving average, these are fairly similar to heikin-ashi candles in the sense that CandleOpen(t) ≠ CandleClose(t-1) , each point of the candle is calculated as follows for our indicator:
Open = Average between MA(t-1) and MA(t-2)
High = MA using the high price as input
Low = MA using the low price as input
Close = MA using the closing price as input
Details
Lag is defined as the effect of moving averages to reflect past price variations instead of new ones, lag can be observed by the user and is the main cause of false signals. Lag is proportional to the degree of filtering returned by the moving average.
Overshooting is a common effect encountered in non-lagging moving averages, and is defined as the tendency of a moving average to exceed a maximum level (or minimum level, which can be defined as undershooting )
MA and rolling maximum/minimum, both using a length of 50 bars. While we can think of lag as a cost of smoothness, we can think of overshooting as a cost for reduced lag on some occasions.
Explaining the kernel design behind our moving average requires understanding of the logic behind lag reduction in moving averages. This can prove to be complex for non informed users, but let's just focus on the simpler part; moving averages can be defined as a weighted sum between past prices and a set of coefficients (kernel).
MA(t) = b(0)C(t) + b(1)C(t-1) + b(2)C(t-2) + ... + b(n-1)C(t-n-1)
Where n is the period of the moving average. Lag is (non optimally) reduced by "underweighting" past prices - that is multiplying them by negative numbers.
The kernel used in our moving average is based on a modified sinewave. A weighted sum making use of a sinewave as a kernel would return an oscillator centered at 0. We can divide this sinewave by an increasing linear function in order to obtain a kernel allowing us to obtain a low lag moving average instead of a centered oscillator. This is the main idea in the design of the kernel used by our moving average.
The kernel equation of our moving average is:
sin(2πx^α)(1 - x^β)
With 1>x>0 , and where α controls the lag, while β controls the overshoot amplitude.
Using this equation we can obtain the following kernels:
Here only α is changed, while β is equal to 1. Values to the left would represent the coefficients for the most recent prices. Notice how the most significant coefficients are given to the oldest prices in the case where α increases.
Higher overshoot would require more negative values, this is controlled by β
Here only β is changed, while α is equal to 1. Notice how higher values return lower negative coefficients. This effectively increases the overshoots amplitude in our moving average. We can decrease α in order for these negative coefficients to underweight more recent values.
Using α = 0 allows us to simplify the kernel equation to:
1 - x^β
Using this kernel we can obtain more classical moving averages, this can be seen from the following results:
Using β = 1 allows us to obtain a linearly decreasing kernel (the one of a WMA), while increasing allows the kernel to converge toward a rectangular kernel (the one of SMA).

[TrustedSignals] Oscillator DivergencesDivergences are powerful tools that assess the price momentum and the likelihood of a price reversal. A positive divergence occurs when the price of an asset makes a new low while an oscillator, starts to climb. Conversely, a negative divergence is when the price makes a new high but the oscillator analyzed makes a lower high.
Once again, with the idea of providing an All-in-One indicator, this script can display the Divergences in up to 9 most used oscillators (RSI, Stochastic RSI, Stochastic, Williams%, MFI, ChangeMO, CCI, BB %B) including our own branded no-lag ‘ TS Oscillator ’
We have also included an optional custom no-lag smoothing function, that allows the user to smooth out the noise on all the oscillators and increase their accuracy, without delaying the actual data. This feature can be turned off if necessary and the smoothing length can be manually adjusted.
After the user selects from the first input the desired oscillator, the indicator can display Regular and Hidden Divergences on the chart.
The lookback period of the divergences is also fully configurable, as the settings for each of our individual oscillators.

CuandoCrypto's Swing Trade IndicatorThis indicator combines RSI, MACD, Williams %R and Z-Score to determine if there's a high probability of an imminent trend reversal. This indicator is best used on higher timeframes.
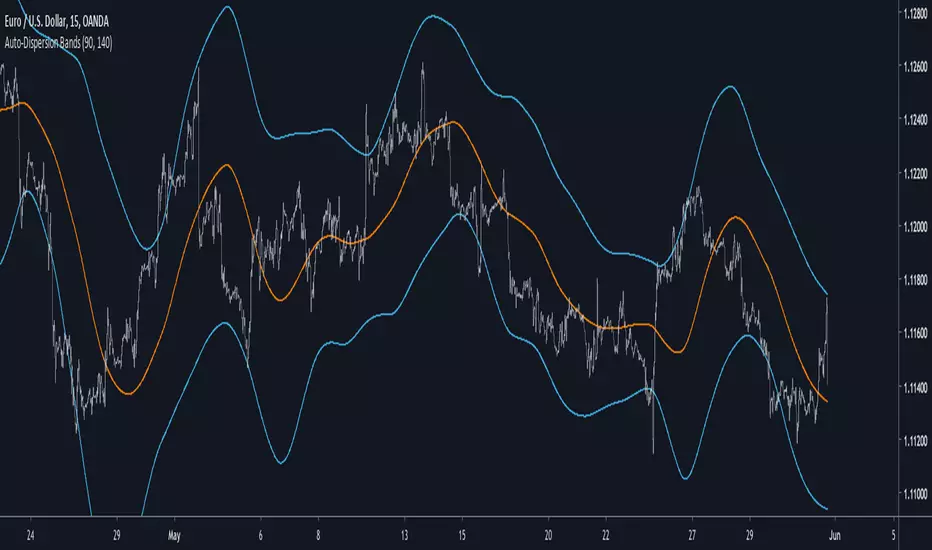
Auto-Dispersion BandsIntroduction
A really old indicator as well, thus i have no much ideas of what is going on with it, but i know that those bands returns good reversals points. The indicator don't use standard deviation, instead its a simple differencing of the price and the price length bars back who will provide a dispersion measurement, thus the name auto-dispersion.
The Indicator
The smooth parameter allow the band to cross the price, if smooth is low the chance of crosses are lower.
smooth = 3
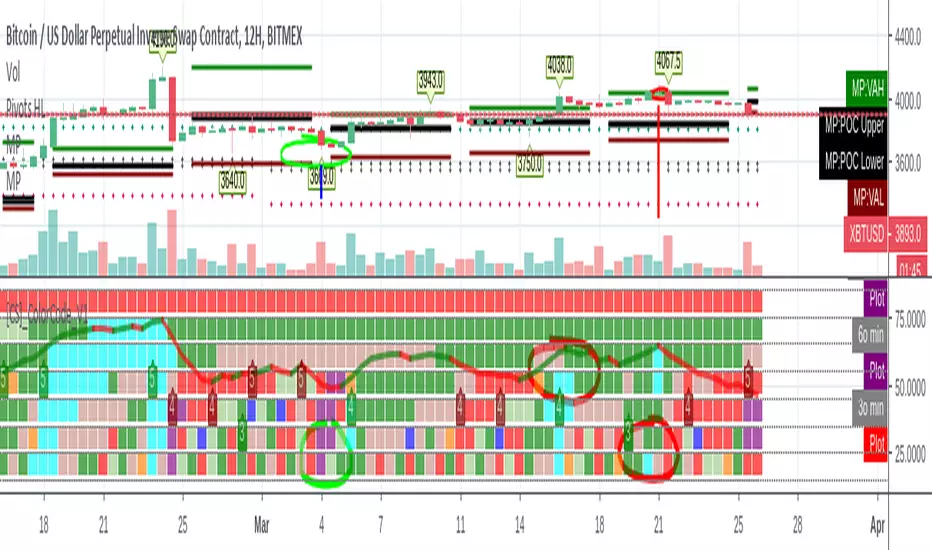
[CS]_ColorCode_V1 Multitimeframe Cardwell ReversalsToday I decided to create a powerful indicator for helping in identifying trend continuation and reversals using Cardwell's famous techniques.
For the whom interested Cardwell's work is widely presented in different textbooks such as "John Hayden" The Complete RSI Guide and accessible online.
From "John Hayden" The Complete RSI Guide:
Wilder (Author of RSI) states in his opinion that the greatest value of the RSI is in pointing out a divergence between the graphs for the RSI and price behavior. Their graphical behavior reveals a bullish divergence (or as he calls
it a bottom failure swing) when the price makes a new low, while the RSI continues under 30 and fails to make a new low. When the RSI proceeds to exceed the previous RSI peak, a short-term buy signal occurs
according to Wilder.
However, what the average investor comprehends is a small part of the dynamic overall picture. For example, if the range effectively shifts in a bull market so
that 80 is overbought, then Andrew Cardwell realized that the support level must also shift. Inversely if the oversold level in a bear market will shift down to 20, then the resistance level in a bear market must also
shift.
Another tools I prefer to use to indicate trend is moving averages, the standard workhorse used by most technical traders. Moving averages are valuable, as they will remove the volatility from whatever they are
calculated from. For example, calculating a moving average based on the RSI, effectively removes the volatility and gives a smoother signal. In fact, the trend can be confirmed by calculating a 9 period simple
moving average and a second 45 period weighted moving average on both the RSI and price.
From Cardwell's famous RSI Workbook, when the:
1. The 9 period on price is above the 45 period on price, and The 9 period on RSI is above the 45 period on RSI the trend is up.
2. The 9 period on price is below the 45 period on price, and The 9 period on RSI is below the 45 period on RSI the trend is down.
3. The 9 period on price is above the 45 period on price, and The 9 period on RSI is below the 45 period on RSI the trend is sideways to up.
4. The 9 period on price is below the 45 period on price, and The 9 period on RSI is above the 45 period on RSI the trend is sideways to down.
Since the RSI is more volatile than the price, the 9 period simple moving average (SMA) on RSI will cross its respective 45 period weighted moving average (WMA) before the 9 period (SMA) on price will cross its
respective 45 period moving average. I place more emphasis on the moving averages based on price than those based on RSI. Staying aware of what the moving averages are doing will help you to stay focused on
the overall trend. When I am talking to another trader, I will often say that the moving average on price is positive.
This implies that the short term, 9 period SMA is, above the longer term, 45 WMA. The largest moves will frequently come when both moving averages are moving in the same direction. One more thought on
moving averages. You will find the moving average 45 WMA will prove to be support or resistance on both price and RSI. For example, you will often see a bullish market retrace to its respective 45 period
moving average (price and/or RSI). When this is observed it is another sign of what the trend actually is.
On the indicator:
1. is represented in Green Color
2. is represented in Red Color
3. is represented in Light-Green-Grey
4. is represented in Light-Pink-Grey
1. + Overbought (RSI Above 80) is represented in Acqua
2. + Oversold (RSI Below 20) is represented in Purple
1. + RSI Turned Bearish (RSI Below 50) is represented in Orange
2. + RSI Turned Bullish (RSI Above 50) is represented in Blue
In Addition a counter is displayed about the positives or negatives timeframes and an average line is computed across timeframes with green / red color comparison.
Timeframes are specified in the indicator panel and are the following:
- Weekly
- Daily
- 12h
- 4h
- 2h
- 1h
- 30 min
Enjoy,
CryptoStatistical
MidnightMouse Bounce FestIdentifies areas with highly oversold conditions, leading to a high probability of a bounce or trend reversal. Does not include sell signals.
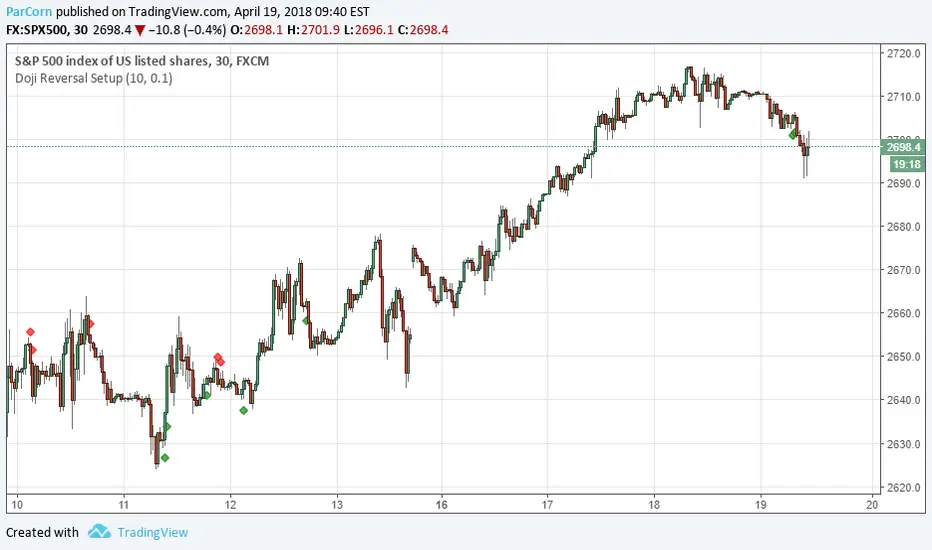
PivotBoss Doji Reversal SetupPATTERN SUMMARY
1. The open and close price of the doji should fall within 10 percent of each other, as measured by the total range
of the candlestick.
2. For a bullish doji, the high of the doji candlestick should be below the ten-period simple moving average (H <
SMA(lO)).
3. For a bearish doji, the low of the doji candlestick should be above the ten-period simple moving average (L >
SMA(lO)).
4. For a bearish doji, one of the two bars following the doji must close beneath the low of the doji (C < L or C <
L ).
5. For a bullish doji setup, one of the two bars following the doji must close above the high of the doji (C > H )
or C > H )
PATTERN PSYCHOLOGY
The doji candlestick is the epitome of indecision. The pattern illustrates a virtual stalemate between buyers
and sellers, which means the existing trend may be on the verge of a reversal. If buyers have been controlling a
bullish advance over a period of time, you will typically see full-bodied candlesticks that personify the bullish
nature of the move. However, if a doji candlestick suddenly appears, the indication is that buyers are suddenly
not as confident in upside price potential as they once were. This is clearly a point of indecision, as buyers are no
longer pushing price to higher valuation, and have allowed sellers to battle them to a draw-at least for this one
candlestick. This leads to profit taking, as buyers begin to sell their profitable long positions, which is heightened
by responsive sellers entering the market due to perceived overvaluation. This "double whammy" of selling
pressure essentially pushes price lower, as responsive sellers take control of the market and push price back
toward fair value.
Keltner Channel with auto highlighting of Bear/Bull reversals*** New version @ ****
All options configurable.
Reversals are marked using crosses. as well as highlighted using green/red color (depending on bull/bear). Enjoy!

The Ultimate Smart Money AQP + Reversal + Risk-Reward DashboardKEY FEATURES
Add. Analyze. Execute.
The Smart Money Way.
#AQUNAT_PRICE
#AQUNAT_PRICE
#AQUNAT_PRICE
FeatureBenefit15 Buy + 13 Sell Conditions Institutional-grade signal engine Next Target Prediction Auto-calculates closest pivot level Risk-Reward Ratio (Long/Short)Filters trades ≥ 2.0:1Wick Reversal Detector Bull/Bear Wick, Extreme, Outside, Doji Hot Zone Detection DPZ (Red), GPZ (Green), MTZ Valuation Engine Over/Undervalued vs VPOC, TC, BC Multi-Timeframe Summary Daily, Weekly, Monthly bias Buy/Sell Quant Layers Shows support/resistance clusters Probability Table PP-Tested vs PP-Untested rules Novice Mode Simplified "Yes/No" signals Customizable Levels Show All, Key, or None Alerts Built-InL3/H3, R1/S1, VPOC breaks
USE CASES & TRADING STRATEGIES
1. Scalping with Wick + Hot Zone (5M–15M)
Rule: Trade only when "Wick Reversal = Yes" + Hot Zone = GPZ
text Example:
Wick: Yes - Bull Wick
Hot Zone: GPZ: VPOC+PP
Buy Count: 12/15
→ Enter long at pullback to VPOC
Target: Next R1
Stop: Below L3
RR: 2.8:1
2. Risk-Reward Filter Trading (15M–1H)
Rule: Enter only if RR ≥ 2.0
text Long RR: 2.5 (Green)
Short RR: 1.4 (Gray)
→ Only take longs
Entry: Current Open
Target: Avg of Buy Targets
Stop: Avg of Buy Layers
3. Reversal Trading at L3/H3
Rule: Reversal Signal + Wick + Camarilla = Lower/Higher
text Price < L3
Reversal Signal: Bull Reversal
Camarilla: Lower Value
Wick: Yes - Bull Wick
→ High-Probability Bottom Reversal
4. Trend Continuation (PP-Untested)
Rule: Day Expectation = Bullish Beyond R1 + No Reversal
text Price > R1
Expectation: Extended Move
No Wick Reversal
→ Trail stop below PP
Target: R2 or H3
5. Multi-Timeframe Confluence
Rule: Enter when ≥2 timeframes agree
TFBuySellBiasDaily114BullishWeekly103BullishSummaryStrong Buy
→ Wait for pullback to Buy Layer (S1 or L3)
HOW TO READ THE DASHBOARD
Column Meaning Timeframe D, W, M Open Price Session open PP, R1, S1, etc . Key levels (highlighted if in Hot Zone) Buy X/15 (≥10 = Strong)Sell X/13 (≥7 = Strong)Wick Reversal "Yes - Bull Wick" = Enter Next Target Closest pivot level Long/Short RR Green = Valid trade Reversal Signal Bull/Bear Reversal at extremes Valuation Over/Undervalued Hot Zone DPZ = Sell, GPZ = Buy Camarilla Higher/Lower Value Day Expectation Momentum direction
PROBABILITY TABLE (PP-Tested vs PP-Untested)
LevelTouch%Close%PP-TestedPP-UntestedPP63%N/A All rules Trending rulesL173.3%46.6%Fade reversions73.8% close >L1L2↓50%↓70%*Take partials61.9% touchedL3↓25%90.9%*Avoid extremes72.4% touchedL4+Rare80%*High risk77.8% touched
*PP-Tested = Price opened inside CPR
*PP-Untested = Price opened outside CPR
PRO TIPS
Best on 5M–1H charts
Use with volume profile for VPOC confirmation
Set alerts on L3/H3 crossover or RR ≥ 2.5
Novice Mode for beginners (Yes/No only)
Hide levels to declutter: Show Levels = Key
Combine with A Quant Price Institutional Matrix for macro view
IDEAL MARKETS
Forex (EURUSD, GBPUSD, USDJPY)
Indices (NAS100, SPX500)
Crypto (BTC, ETH – set 6–8 decimals)
Futures (ES, NQ, CL)
SETUP GUIDE
Open TradingView
Go to Indicators
Search: AQuantPrice Dashboard
Click Add to Chart
Customize:
Min Buy = 10, Min Sell = 7
Min RR = 2.0
Show Levels = Key
Novice Mode = On (for beginners)
AUTHOR
© @AQuant_Price
Professional Pine Script Developer | 12+ Years in Algo Trading
Trusted by 15,000+ traders worldwide.
Not financial advice. Trade at your own risk.
FINAL TAGLINE
"One Dashboard. All Decisions."
A Quant Price Dashboard – Small Timeframes ALL IN ONE
Your Edge. Live.

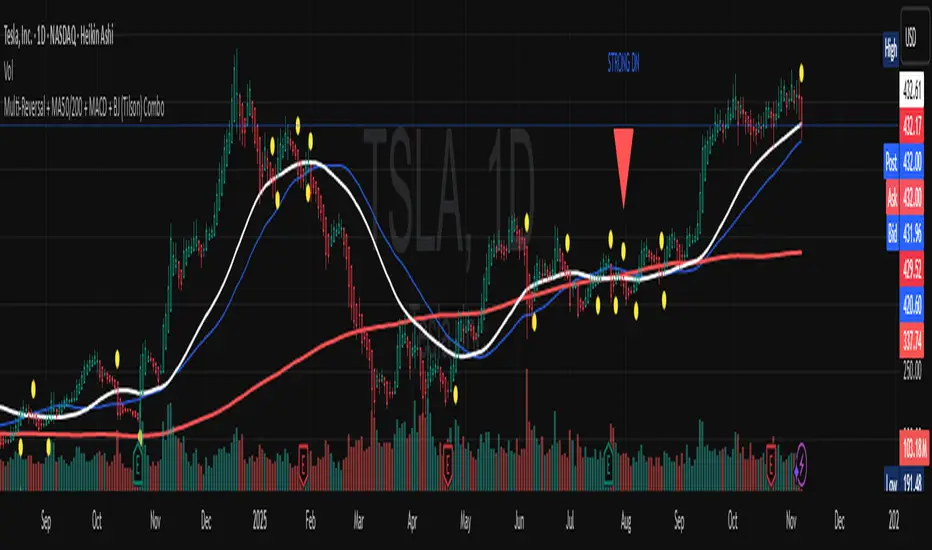
Multi-Reversal + MA50/200 + MACD + BJ (Tilson) Combo//@version=5
indicator(title="Multi-Reversal + MA50/200 + MACD + BJ (Tilson) Combo", overlay=true)
// --- Moving Averages (MA50, MA200) ---
ma_50 = ta.sma(close, 50)
ma_200 = ta.sma(close, 200)
plot(ma_50, color=color.blue, linewidth=1, title="MA50")
plot(ma_200, color=color.red, linewidth=2, title="MA200")
// --- MACD ---
fast_length = input(12, title="MACD Fast")
slow_length = input(26, title="MACD Slow")
signal_length = input(9, title="MACD Signal")
= ta.macd(close, fast_length, slow_length, signal_length)
macd_cross_up = ta.crossover(macdLine, signalLine)
macd_cross_down = ta.crossunder(macdLine, signalLine)
// --- Tilson MA (BJ reversal) ---
tilson_length = input(20, title="Tilson MA Length (BJ reversal)")
tilson_ma = ta.ema(ta.ema(close, tilson_length), tilson_length)
bj_cross_up = close > tilson_ma and close < tilson_ma
bj_cross_down = close < tilson_ma and close > tilson_ma
plot(tilson_ma, color=color.orange, linewidth=2, title="Tilson MA (BJ reversal)")
// --- Đảo chiều tổng hợp ---
bull_reversal = macd_cross_up and bj_cross_up and close > ma_50 and close > ma_200
bear_reversal = macd_cross_down and bj_cross_down and close < ma_50 and close < ma_200
// --- Plot tín hiệu trên chart ---
plotshape(bull_reversal, location=location.belowbar, style=shape.triangleup, size=size.large, color=color.lime, title="Bullish Reversal", text="STRONG UP")
plotshape(bear_reversal, location=location.abovebar, style=shape.triangledown, size=size.large, color=color.red, title="Bearish Reversal", text="STRONG DN")
// --- BJ riêng lẻ ---
plotshape(bj_cross_up, location=location.belowbar, color=color.yellow, style=shape.circle, size=size.tiny, title="BJ Up Only")
plotshape(bj_cross_down, location=location.abovebar, color=color.yellow, style=shape.circle, size=size.tiny, title="BJ Down Only")
// --- Alert conditions ---
alertcondition(bull_reversal, title="Bullish Strong Reversal", message="Buy opportunity: MA bullish + MACD + BJ reversal!")
alertcondition(bear_reversal, title="Bearish Strong Reversal", message="Sell warning: MA bearish + MACD + BJ reversal!")
PivotBoss Outside Reversal SetupPATTERN SUMMARY
1. The engulfing bar of a bullish outside reversal setup has a low that is below the prior bar's low (L < L ) and a
close that is above the prior bar's high (C > H ).
2. The engulfing bar of a bearish outside reversal setup has a high that is above the prior bar's high (H > H )
and a close that is below the prior bar's low (C < L ).
3. The engulfing bar is usually 5 to 25 percent larger than the size of the average bar in the lookback period.
PATTERN PSYCHOLOGY
The power behind this pattern lies in the psychology behind the traders involved in this setup. If you have
ever participated in a breakout at support or resistance only to have the market reverse sharply against you, then
you are familiar with the market dynamics of this setup. What exactly is going on at these levels? To understand
this concept is to understand the outside reversal pattern. Basically, market participants are testing the waters
above resistance or below support to make sure there is no new business to be done at these levels. When no
initiative buyers or sellers participate in range extension, responsive participants have all the information they
need to reverse price back toward a new area of perceived value.
As you look at a bullish outside reversal pattern, you will notice that the current bar's low is lower than the
prior bar's low. Essentially, the market is testing the waters below recently established lows to see if a downside
follow-through will occur. When no additional selling pressure enters the market, the result is a flood of buying
pressure that causes a springboard effect, thereby shooting price above the prior bar's highs and creating the
beginning of a bullish advance.
If you recall the child on the trampoline for a moment, you'll realize that the child had to force the bounce
mat down before he could spring into the air. Also, remember Jennifer the cake baker? She initially pushed price
to $20 per cake, which sent a flood of orders into her shop. The flood of buying pressure eventually sent the price
of her cakes to $35 apiece. Basically, price had to test the $20 level before it could rise to $35.
Let's analyze the outside reversal setup in a different light for a moment. One of the reasons I like this setup
is because the two-bar pattern reduces into the wick reversal setup, which we covered earlier in the chapter. If
you are not familiar with candlestick reduction, the idea is simple. You are taking the price data over two or more
candlesticks and combining them to create a single candlestick. Therefore, you will be taking the open, high, low,
and close prices of the bars in question to create a single composite candlestick.
Take a look at Figure 2.13, which illustrates the candlestick reduction of the outside reversal setup.
Essentially, taking the highest high and the lowest low over the two-bar period gives you the range of the
composite candlestick. Then, taking the opening price of the first candle and the closing price of the last candle
will finish off the composite candlestick. Depending on the structure of the bars of the outside reversal setup, the
result of the candlestick reduction will usually be the transformation into a wick reversal setup, which we know to
be quite powerful. Therefore, in many cases the physiology of the outside reversal pattern basically demonstrates
the inherent psychological traits of the wick reversal pattern. This is just another level of analysis that reinforces
my belief in the outside reversal setup.

RSI Regime: Continuation vs Reversal Indicator Description: RSI Regime (Continuation vs. Reversal)
This indicator uses the standard Relative Strength Index (RSI) to analyze market momentum and categorize it into three "regimes." Its primary goal is to help you determine if an overbought (OB) or oversold (OS) signal is likely to be a continuation of the current trend or a reversal point.
It also identifies "Fast Trend Starts," which are exceptionally fast and powerful moves from one extreme to the other.
Core Features & How to Read It
1. The Three RSI Regimes (Background Color) The script calculates a moving average (SMA) of the RSI to determine the dominant medium-term momentum. This is shown as the background color:
Bull Regime (Green Background): The RSI's average is high (e.g., above 55). The market is in a clear uptrend.
Bear Regime (Red Background): The RSI's average is low (e.g., below 45). The market is in a clear downtrend.
Range Regime (Orange Background): The RSI's average is in the middle. The market is consolidating or undecided.
2. Overbought (OB) & Oversold (OS) Signals
When the RSI line crosses into the overbought (e.g., >70) or oversold (e.g., <30) zones, the indicator generates one of two types of signals:
A) Continuation Signals (Small Triangles: ►)
These signals suggest an OB/OS reading is just a "pause" and the main trend will likely continue.
Orange ► (at the top): Appears when RSI becomes overbought while the market is already in a Bull Regime. This suggests the uptrend is strong, and this OB signal may not lead to a big drop.
Teal ► (at the bottom): Appears when RSI becomes oversold while the market is already in a Bear Regime. This suggests the downtrend is strong, and this OS signal may not lead to a big bounce.
(Note: An optional Price EMA filter can be enabled to make these signals more strict.)
B) Reversal Signals (Small Labels: "OS→>50" / "OB→<50")
These labels appear after an OB/OS signal to confirm that a reversal has actually occurred.
"OS→>50 Reversal" (Aqua Label): Appears if the RSI becomes oversold and then recovers back above the 50 midline within a set number of bars. This confirms the oversold dip was a reversal point.
"OB→<50 Reversal" (Orange Label): Appears if the RSI becomes overbought and then falls back below the 50 midline within a set number of bars. This confirms the overbought peak was a reversal point.
3. "Fast Trend Starts" (Large Labels)
This is a unique feature that identifies the fastest percentile of market moves. It measures how many bars it takes for the RSI to go from one extreme to the other and flags when a move is in the top 5% (default) of all historical moves.
"Long Pullbacks (Fast OS→BullRange)" (Large Green Label): This powerful signal appears when the RSI moves from oversold (<30) all the way up to the bull range (>60) exceptionally fast. It identifies a very strong, fast, and decisive bounce that could signal the start of a new uptrend.
"Short Pumps (Fast OB→BearRange)" (Large Red Label): This appears when the RSI moves from overbought (>70) all the way down to the bear range (<40) exceptionally fast. It identifies a very sharp, fast rejection or "pump-and-dump" that could signal the start of a new downtrend.
Key User Inputs
RSI Length (14): The lookback period for the main RSI calculation.
OB (70) / OS (30): The standard overbought and oversold levels.
Bull/Bear Range Threshold (60/40): These are the levels used to confirm the "Fast Trend Starts." They are separate from the OB/OS levels.
RSI Regime SMA Length (21): The lookback period for the moving average that determines the background regime.
Use Price EMA filter (true): If checked, the small "Continuation" triangles will only appear if the price is also above (for bulls) or below (for bears) its own 50-period EMA.
Fastest X% duration (5.0): This sets the percentile for the "Fast Trend Start" labels. 5.0 means it only flags moves that are in the fastest 5% of all recorded moves.

Scalp BTC/ETH — Reversal & Continuation (v1, Pine v6)Scalp BTC/ETH — Reversal & Continuation (1m à 10m)
Cet indicateur détecte des opportunités de micro-scalping sur futures (BTC/ETH) basées sur deux mécaniques courtes validées par structure de prix :
A) Reversal de pression (contre-mouvement contrôlé)
Détection d’une sur-extension brutale suivie d’une absorption sur la bougie suivante.
Objectif : capturer la première respiration après un excès de prix (rejet court).
B) Continuation courte (momentum + reprise)
Détection de 3 bougies directionnelles consécutives suivies d’un pullback léger, puis signal sur la reprise du mouvement initial.
Gestion intégrée (scénario standard TP dynamique)
TP1 → 50% de la position à un gain fixe (% adaptable au timeframe)
Stop déplacé au Break-Even sur le restant
Sortie finale sur bougie inverse significative
(correction ≥ X% du corps précédent) ou timeout (max bars en trade)
Scalp BTC/ETH — Reversal & Continuation (1m to 10m)
This indicator detects short-term futures scalping setups on BTC & ETH using two mechanical price-action models designed for fast execution:
A) Reversal Compression (counter-move entry)
Identifies a sharp impulse (overextension) followed by absorption / failure to extend on the next candle.
Objective: capture the first corrective pullback after exhaustion.
B) Controlled Continuation (momentum follow-through)
Identifies 3 consecutive trend candles, then a shallow pullback, and triggers an entry on the resumption of the main leg.
Built-in trade logic (dynamic TP structure)
TP1 → scale out 50% of the position at a fixed percentage (auto-scaled per timeframe)
Stop moved to Break-Even after TP1
Final exit on either:
• a meaningful opposite candle (≥ X% correction of prior body), or
• a timeout (max bars in trade)
Technical characteristics
Designed for 1m / 3m / 5m / 7m / 10m
No repainting (bar-close confirmed logic)
Works for both LONG & SHORT
Built-in alert events:
ENTRY_LONG / ENTRY_SHORT / TP1 / EXIT_STOP / EXIT_INVERSE / EXIT_TIMEOUT
Suitable for manual execution, semi-automation (alerts) or full bot integration (webhook JSON)
Purpose
Provide a repeatable, rule-based, non-subjective framework to harvest micro-moves with controlled risk, without relying on lagging indicators or long-term prediction.
(A Strategy / backtesting version is planned as a next iteration.)

Chronos Reversal Labs🧬 Chronos Reversal Lab - Machine Learning Market Structure Analysis
OVERVIEW
Chronos Reversal Lab (CRL) is an advanced market structure analyzer that combines computational intelligence kernels with classical technical analysis to identify high-probability reversal opportunities. The system integrates Shannon Entropy analysis, Detrended Fluctuation Analysis (DFA), Kalman adaptive filtering, and harmonic pattern recognition into a unified confluence-based signal engine.
WHAT MAKES IT ORIGINAL
Unlike traditional reversal indicators that rely solely on oscillators or pattern recognition, CRL employs a multi-kernel machine learning approach that analyzes market behavior through information theory, statistical physics, and adaptive state-space estimation. The system combines these computational methods with geometric pattern analysis and market microstructure to create a comprehensive reversal detection framework.
HOW IT WORKS (Technical Methodology)
1. COMPUTATIONAL KERNELS
Shannon Entropy Analysis
Measures market uncertainty using information theory:
• Discretizes price returns into bins (user-configurable 5-20 bins)
• Calculates probability distribution entropy over lookback window
• Normalizes entropy to 0-1 scale (0 = perfectly predictable, 1 = random)
• Low entropy states (< 0.3 default) indicate algorithmic clarity phases
• When entropy drops, directional moves become statistically more probable
Detrended Fluctuation Analysis (DFA)
Statistical technique measuring long-range correlations:
• Analyzes price series across multiple box sizes (4 to user-set maximum)
• Calculates fluctuation scaling exponent (Alpha)
• Alpha > 0.5: Trend persistence (momentum regime)
• Alpha < 0.5: Mean reversion tendency (reversal regime)
• Alpha range 0.3-1.5 mapped to trading strategies
Kalman Adaptive Filter
State-space estimation for lag-free trend tracking:
• Maintains separate fast and slow Kalman filters
• Process noise and measurement noise are user-configurable
• Tracks price state with adaptive gain adjustments
• Calculates acceleration (second derivative) for momentum detection
• Provides cleaner trend signals than traditional moving averages
2. HARMONIC PATTERN DETECTION
Identifies geometric reversal patterns:
• Gartley: 0.618 AB/XA, 0.786 AD/XA retracement
• Bat: 0.382-0.5 AB/XA, 0.886 AD/XA retracement
• Butterfly: 0.786 AB/XA, 1.272-1.618 AD/XA extension
• Cypher: 0.382-0.618 AB/XA, 0.786 AD/XA retracement
Pattern Validation Process:
• Requires alternating swing structure (XABCD points)
• Fibonacci ratio tolerance: 0.02-0.20 (user-adjustable precision)
• Minimum 50% ratio accuracy score required
• PRZ (Potential Reversal Zone) calculated around D point
• Zone size: ATR-based with pattern-specific multipliers
• Active pattern tracking with 100-bar invalidation window
3. MARKET STRUCTURE ANALYSIS
Swing Point Detection:
• Pivot-based swing identification (3-21 bars configurable)
• Minimum swing size: ATR multiples (0.5-5.0x)
• Adaptive filtering: volatility regime adjustment (0.7-1.3x)
• Swing confirmation tracking with RSI and volume context
• Maintains structural history (up to 500 swings)
Break of Structure (BOS):
• Detects price crossing previous swing highs/lows
• Used for trend continuation vs reversal classification
• Optional requirement for signal validation
Support/Resistance Detection:
• Identifies horizontal levels from swing clusters
• Touch counting algorithm (price within ATR×0.3 tolerance)
• Weighted by recency and number of tests
• Dynamic updating as structure evolves
4. CONFLUENCE SCORING SYSTEM
Multi-factor analysis with regime-aware weighting:
Hierarchical Kernel Logic:
• Entropy gates advanced kernel activation
• Only when entropy < threshold do DFA and Kalman accelerate scoring
• Prevents false signals during chaotic (high entropy) conditions
Scoring Components:
ML Kernels (when entropy low):
• Low entropy + trend alignment: +3.0 points × trend weight
• DFA super-trend (α>1.5): +4.0 points × trend weight
• DFA persistence (α>0.65): +2.5 points × trend weight
• DFA mean-reversion (α<0.35): +2.0 points × mean-reversion weight
• Kalman acceleration: up to +3.0 points (scaled by magnitude)
Classical Technical Analysis:
• RSI oversold (<30) / overbought (>70): +1.5 points
• RSI divergence (bullish/bearish): +2.5 points
• High relative volume (>1.5x): +0-2.0 points (scaled)
• Volume impulse (>2.0x): +1.5 points
• VWAP extremes: +1.0 point
• Trend alignment (Kalman fast vs slow): +1.5 points
• MACD crossover/momentum: +1.0 point
Structural Factors:
• Near support (within 0.5 ATR): +0-2.0 points (inverse distance)
• Near resistance (within 0.5 ATR): +0-2.0 points (inverse distance)
• Harmonic PRZ zone: +3.0 to +6.0 points (pattern score dependent)
• Break of structure: +1.5 points
Regime Adjustments:
• Trend weight: 1.5× in trend regime, 0.5× in mean-reversion
• Mean-reversion weight: 1.5× in MR regime, 0.5× in trend
• Volatility multiplier: 0.7-1.3× based on ATR regime
• Theory mode multiplier: 0.8× (Conservative) to 1.2× (APEX)
Final Threshold:
Base threshold (default 3.5) adjusted by:
• Theory mode: -0.3 (APEX) to +0.8 (Conservative)
• Regime: +0.5 (high vol) to -0.3 (low vol or strong trend)
• Filter: +0.2 if regime filter enabled
5. SIGNAL GENERATION ARCHITECTURE
Five-stage validation process:
Stage 1 - ML Kernel Analysis:
• Entropy threshold check
• DFA regime classification
• Kalman acceleration confirmation
Stage 2 - Structural Confirmation:
• Market structure supports directional bias
• BOS alignment (if required)
• Swing point validation
Stage 3 - Trigger Validation:
• Engulfing candle (if required)
• HTF bias confirmation (if strict HTF enabled)
• Harmonic PRZ alignment (if confirmation enabled)
Stage 4 - Consistency Check:
• Anticipation depth: checks N bars back (1-13 configurable)
• Ensures Kalman acceleration direction persists
• Filters whipsaw conditions
Stage 5 - Structural Soundness (Critical Filter):
• Verifies adequate room before next major swing level
• Long signals: must have >0.25 ATR clearance to last swing high
• Short signals: must have >0.25 ATR clearance to last swing low
• Prevents trades directly into obvious structural barriers
Dynamic Risk Management:
• Stop-loss: Placed beyond last structural swing ± 2 ticks
• Take-profit 1: Risk × configurable R1 multiplier (default 1.5R)
• Take-profit 2: Risk × configurable R2 multiplier (default 3.0R)
• Confidence score: Calibrated 0-99% based on confluence + kernel boost
6. ADAPTIVE REGIME SYSTEM
Continuous market state monitoring:
Trend Regime:
• Kalman fast vs slow positioning
• Multi-timeframe alignment (optional HTF)
• Strength: ATR-normalized fast/slow spread
Volatility Regime:
• Current ATR vs 100-bar average
• Regime ratio: 0.7-1.3 typical range
• Affects swing size filtering and cooldown periods
Signal Cooldown:
• Base: User-set bars (1-300)
• High volatility (>1.5): cooldown × 1.5
• Low volatility (<0.5): cooldown × 0.7
• Post-BOS: minimum 20-bar cooldown enforced
FOUR OPERATIONAL MODES
CONSERVATIVE MODE:
• Threshold adjustment: +0.8
• Mode multiplier: 0.8×
• Strictest filtering for highest quality
• Recommended for: Beginners, large accounts, swing trading
• Expected signals: 3-5 per week (typical volatile instrument)
BALANCED MODE:
• Threshold adjustment: +0.3
• Mode multiplier: 1.0×
• Standard operational parameters
• Recommended for: General trading, learning phase
• Expected signals: 5-10 per week
APEX MODE:
• Threshold adjustment: -0.3
• Mode multiplier: 1.2×
• Maximum sensitivity, reduced cooldowns
• Recommended for: Scalping, high volatility, experienced traders
• Expected signals: 10-20 per week
INSTITUTIONAL MODE:
• Threshold adjustment: +0.5
• Mode multiplier: 1.1×
• Enhanced structural weighting, HTF emphasis
• Recommended for: Professional traders, swing positions
• Expected signals: 4-8 per week
VISUAL COMPONENTS
1. Fibonacci Retracement Levels
• Auto-calculated from most recent swing structure
• Standard levels: 0%, 23.6%, 38.2%, 50%, 61.8%, 78.6%, 100%, 127.2%, 161.8%, 200%, 261.8%
• Key levels emphasized (50%, 61.8%, 100%, 161.8%)
• Color gradient from bullish to bearish based on level
• Automatic cleanup when levels are crossed
• Label intensity control (None/Fib only/All)
2. Support and Resistance Lines
• Dynamic horizontal levels from swing clusters
• Width: 2px solid lines
• Colors: Green (support), Red (resistance)
• Labels show price and level type
• Touch-based validation (minimum 2 touches)
• Real-time updates and invalidation
3. Harmonic PRZ Boxes
• Displayed around pattern completion (D point)
• Pattern-specific colors (Gartley: purple, Bat: orange, etc.)
• Box height: ATR-based zone sizing
• Score-dependent transparency
• 100-bar active window before removal
4. Confluence Boxes
• Appear when confluence ≥ threshold
• Yellow/orange gradient based on score strength
• Height: High to low of bar
• Width: 1 bar on each side
• Real-time score-based transparency
5. Kalman Filter Lines
• Fast filter: Bullish color (green default)
• Slow filter: Bearish color (red default)
• Width: 2px
• Transparency adjustable (0-90%)
• Optional display toggle
6. Signal Markers
• Long: Green triangle below bar (tiny size)
• Short: Red triangle above bar (tiny size)
• Appear only on confirmed signals
• Includes alert generation
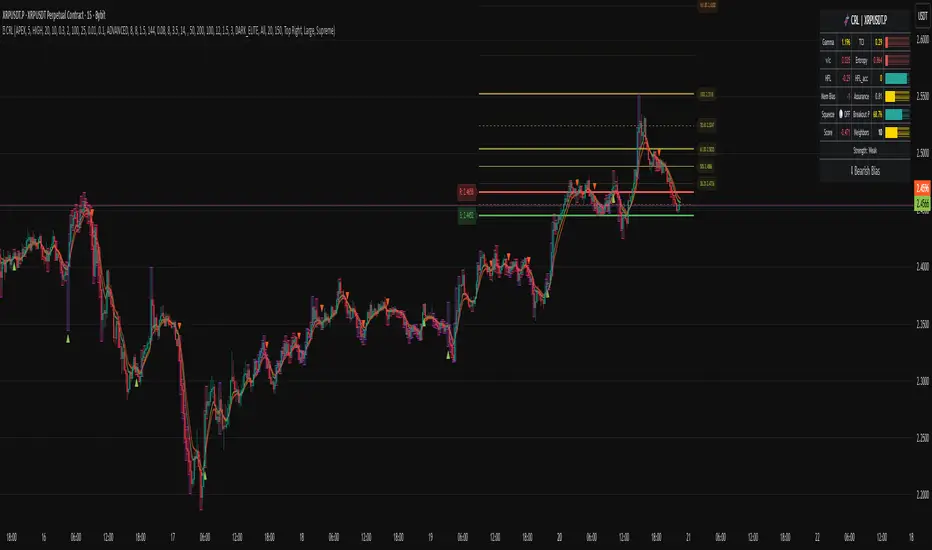
7. Premium Dashboard
Features real-time metrics with visual gauges:
Layout Options:
• Position: 4 corners selectable
• Size: Small (9 rows) / Normal (12 rows) / Large (14 rows)
• Themes: Supreme, Cosmic, Vortex, Heritage
Metrics Displayed:
• Gamma (DFA - 0.5): Shows trend persistence vs mean-reversion
• TCI (Trend Strength): ATR-normalized Kalman spread with gauge
• v/c (Relative Volume): Current vs average with color coding
• Entropy: Market predictability state with gauge
• HFL (High-Frequency Line): Kalman fast/slow difference / ATR
• HFL_acc (Acceleration): Second derivative momentum
• Mem Bias: Net bullish-bearish confluence (-1 to +1)
• Assurance: Confidence × (1-entropy) metric
• Squeeze: Bollinger Band / Keltner Channel squeeze detection
• Breakout P: Probability estimate from DFA + trend + acceleration
• Score: Final confluence vs threshold (normalized)
• Neighbors: Active harmonic patterns count
• Signal Strength: Strong/Moderate/Weak classification
• Signal Banner: Current directional bias with emoji indicators
Gauge Visualization:
• 10-bar horizontal gauges (█ filled, ░ empty)
• Color-coded: Green (strong) / Gold (moderate) / Red (weak)
• Real-time updates every bar
HOW TO USE
Step 1: Configure Mode and Resolution
• Select Theory Mode based on trading style (Conservative/Balanced/APEX/Institutional)
• Set Structural Resolution (Standard for fast markets, High for balanced, Ultra/Institutional for swing)
• Enable Adaptive Filtering (recommended for all volatile assets)
Step 2: Enable Desired Kernels
• Shannon Entropy: Essential for predictability detection (recommended ON)
• DFA Analysis: Critical for regime classification (recommended ON)
• Kalman Filter: Provides lag-free trend tracking (recommended ON)
• All three work synergistically; disabling reduces effectiveness
Step 3: Configure Confluence Factors
• Enable desired technical factors (RSI, MACD, Volume, Divergence)
• Enable Liquidity Mapping for support/resistance proximity scoring
• Enable Harmonic Detection if trading pattern-based setups
• Adjust base confluence threshold (3.5 default; higher = fewer, cleaner signals)
Step 4: Set Trigger Requirements
• Require Engulfing: Adds precision, reduces frequency (recommended for Conservative)
• Require BOS: Ensures structural alignment (recommended for trend-following)
• Require Structural Soundness: Critical filter preventing traps (highly recommended)
• Strict HTF Bias: For multi-timeframe traders only
Step 5: Adjust Visual Preferences
• Enable/disable Fibonacci levels, S/R lines, PRZ boxes, confluence boxes
• Set label intensity (None/Fib/All)
• Adjust transparency (0-90%) for overlay clarity
• Configure dashboard position, size, and theme
Step 6: Configure Alerts
• Enable master alerts toggle
• Select alert types: Anticipation, Confirmation, High Confluence, Low Entropy
• Enable JSON details for automated trading integration
Step 7: Interpret Signals
• Wait for triangle markers (green up = long, red down = short)
• Check dashboard for confluence score, entropy, DFA regime
• Verify signal aligns with higher timeframe bias (if using HTF setting)
• Confirm adequate space to take-profit levels (no nearby structural barriers)
Step 8: Execute and Manage
• Enter at close of signal candle (or next bar open)
• Set stop-loss at calculated level (visible in alert if JSON enabled)
• Scale out at TP1 (1.5R default), trail remaining to TP2 (3.0R default)
• Exit early if entropy spikes >0.7 or DFA regime flips against position
CUSTOMIZATION GUIDE
Timeframe Optimization:
Scalping (1-5 minutes):
• Theory Mode: APEX
• Anticipation Depth: 3-5
• Structural Resolution: STANDARD
• Signal Cooldown: 8-12 bars
• Enable fast kernels, disable HTF bias
Day Trading (15m-1H):
• Theory Mode: BALANCED
• Anticipation Depth: 5-8
• Structural Resolution: HIGH
• Signal Cooldown: 12-20 bars
• Standard configuration
Swing Trading (4H-Daily):
• Theory Mode: INSTITUTIONAL
• Anticipation Depth: 8-13
• Structural Resolution: ULTRA or INSTITUTIONAL
• Signal Cooldown: 20-50 bars
• Enable HTF bias, strict confirmations
Market Type Optimization:
Forex Majors:
• All kernels enabled
• Harmonic patterns effective
• Balanced or Institutional mode
• Standard settings work well
Stock Indices:
• Emphasis on volume analysis
• DFA critical for regime detection
• Conservative or Balanced mode
• Enable liquidity mapping
Cryptocurrencies:
• Adaptive filtering essential
• Higher volatility regime expected
• APEX mode for active trading
• Wider ATR multiples for swing sizing
IMPORTANT DISCLAIMERS
• This indicator does not predict future price movements
• Computational kernels calculate probabilities, not certainties
• Past confluence scores do not guarantee future signal performance
• Always backtest on YOUR specific instruments and timeframes before live trading
• Machine learning kernels require calibration period (minimum 100 bars of data)
• Performance varies significantly across market conditions and regimes
• Signals are suggestions for analysis, not automated trading instructions
• Proper risk management (stops, position sizing) is mandatory
• Complex calculations may impact performance on lower-end devices
• Designed for liquid markets; avoid illiquid or gap-prone instruments
PERFORMANCE CONSIDERATIONS
Computational Intensity:
• DFA analysis: Moderate (scales with length and box size parameters)
• Entropy calculation: Moderate (scales with lookback and bins)
• Kalman filtering: Low (efficient state-space updates)
• Harmonic detection: Moderate to High (pattern matching across swing history)
• Overall: Medium computational load
Optimization Tips:
• Reduce Structural Analysis Depth (144 default → 50-100 for faster performance)
• Increase Calc Step (2 default → 3-4 for lighter load)
• Reduce Pattern Analysis Depth (8 default → 3-5 if harmonics not primary focus)
• Limit Draw Window (150 bars default prevents visual clutter on long charts)
• Disable unused confluence factors to reduce calculations
Best Suited For:
• Liquid instruments: Major forex, stock indices, large-cap crypto
• Active timeframes: 5-minute through daily (avoid tick/second charts)
• Trending or ranging markets: Adapts to both via regime detection
• Pattern traders: Harmonic integration adds geometric confluence
• Multi-timeframe analysts: HTF bias and regime detection support this approach
Not Recommended For:
• Illiquid penny stocks or micro-cap altcoins
• Markets with frequent gaps (stocks outside regular hours without gap adjustment)
• Extremely fast timeframes (tick, second charts) due to calculation overhead
• Pure mean-reversion systems (unless using CONSERVATIVE mode with DFA filters)
METHODOLOGY NOTE
The computational kernels (Shannon Entropy, DFA, Kalman Filter) are established statistical and signal processing techniques adapted for financial time series analysis. These are deterministic mathematical algorithms, not predictive AI models. The term "machine learning" refers to the adaptive, data-driven nature of the calculations, not neural networks or training processes.
Confluence scoring is rule-based with regime-dependent weighting. The system does not "learn" from historical trades but adapts its sensitivity to current volatility and trend conditions through mathematical regime classification.
SUPPORT & UPDATES
• Questions about configuration or usage? Send me a message on TradingView
• Feature requests are welcome for consideration in future updates
• Bug reports appreciated and addressed promptly
• I respond to messages within 24 hours
• Regular updates included (improvements, optimizations, new features)
FINAL REMINDERS
• This is an analytical tool for confluence analysis, not a standalone trading system
• Combine with your existing strategy, risk management, and market analysis
• Start with paper trading to learn the system's behavior on your markets
• Allow 50-100 signals minimum for performance evaluation
• Adjust parameters based on YOUR timeframe, instrument, and trading style
• No indicator guarantees profitable trades - proper risk management is essential
— Dskyz, Trade with insight. Trade with anticipation.
HA Reversal + Doji 🔥 Heikin Ashi Reversal + Stochastic Filter (Precision Entry System)
This indicator is designed to detect high–quality reversal entries using a Heikin Ashi candle pattern (Doji + 2 no–wick confirmation) combined with a strict Stochastic filter that uses memory of extreme touches to control trade direction.
✅ Entry Logic
🔹 Bullish BUY Signal
A BUY is triggered only when:
A valid reversal pattern is detected:
Doji candle (pivot) 3 bars back
Followed by 2 bullish candles with no lower wicks
Stochastic touched Oversold (≤ 20) at least once before the signal
Pattern + Stoch alignment = BUY
🔹 Bearish SELL Signal
A SELL is triggered only when:
Valid bearish reversal pattern:
Doji candle (pivot) 3 bars back
Followed by 2 bearish candles with no upper wicks
Stochastic touched Overbought (≥ 80) before the signal
Pattern + Stoch alignment = SELL
🧠 Stochastic “Memory” Filter
This is not a basic OB/OS filter — it uses event memory:
If Stochastic touches Oversold, the system becomes ready for BUY
If it touches Overbought, it becomes ready for SELL
Both directions can be armed at once
Once a BUY or SELL actually triggers, memory resets to neutral
Prevents “signal spam” during chop and keeps direction meaningful
🎯 Why This Works
✔ Filters out random countertrend noise
✔ Only trades after momentum exhaustion
✔ Uses strict Heikin Ashi reversal structure
✔ Works great across crypto, forex, indices, metals
✔ Designed for precision entries and swing continuation traps
⚙️ Customizable Options
Doji detection mode (body % / ticks / hybrid)
Wick tolerance
Heikin Ashi source (chart or calculated)
Stochastic source (raw or smoothed)
Option to avoid duplicate same-direction signals
Visual aids: pattern markers, blocked signals, doji debugging
📌 Best Use Cases
Reversal scalping on 5m/15m
Swing entries on 1H/4H
Trend exhaustion confirmation
Smart Money Concepts entry refinement
Entry timing after liquidity sweeps
🚨 Important
This is not a repainting system. Signals are generated at bar close only. Always combine with proper risk management and market context.
Let me know if you want:
✅ A shorter description
✅ An SEO optimized TradingView title
✅ A strategy version with backtesting
✅ Alerts version for automation

CVD Absorption + Confirmation [Orderflow & Volume]This indicator detects bullish and bearish absorption setups by combining Cumulative Volume Delta (CVD) with price action, candlestick, and volume confirmations.
🔹 What is Absorption?
Absorption happens when aggressive buyers/sellers push CVD to new highs or lows, but price fails to follow through.
Bearish absorption: CVD makes a higher high, but price does not.
Bullish absorption: CVD makes a lower low, but price does not.
This often signals that limit orders are absorbing aggressive market orders, creating potential reversal points.
🔹 Confirmation Patterns
Absorption signals are only shown if they are validated by one of the following patterns:
Engulfing candle with low volume → reversal faces little resistance.
Engulfing candle with high volume → strong aggressive participation.
Pin bar with high volume → absorption visible in the wick.
CVD flattening / slope reversal → shift in aggressive order flow.
🔹 Signals
✅ Bullish absorption confirmed → Green label below the bar.
❌ Bearish absorption confirmed → Red label above the bar.
Each label represents a potential reversal setup after orderflow absorption is validated.
🔹 Alerts
Built-in alerts are included for both bullish and bearish confirmations, so you can track setups in real-time without watching the chart 24/7.
📌 How to Use:
Best applied at key levels (supply/demand, VWAP, OR, liquidity zones).
Look for confluence with your trading strategy before taking entries.
Works on all markets and timeframes where volume is reliable.

CHoCH Reversal Hunter🔥 CHoCH Reversal Hunter — Detect Bearish CHoCH Patterns & Fibonacci Golden Zone For Precision Reversal Setups
📈 Overview
CHoCH Reversal Hunter is a Pine Script™ indicator for structured bearish market analysis.
It combines major/minor pivot detection, Change of Character (CHoCH) filtering, and logarithmic Fibonacci retracements into one framework.
The goal: identify Small LL → CHoCH → Golden Zone setups with higher precision.
🧠 Core Logic
1. 📊 Market Structure Backbone
Tracks the 4 most recent major highs (H0–H3) and 3 major lows.
These pivots form the basis for trend evaluation.
2. 🔻 Bearish Background Conditions
A bearish market context is confirmed when:
// Bearish Background Condition
isBearish = (High 3 < High 2) and (
(High 2 > High 1 and High 2 < High 0) or
(High 2 <= High 1)
)
// Reset to neutral if High 2 < High 3
This ensures that only a true lower-high structure activates the bearish framework.
3. 🎯 Hunt for Small Lower Low (LL)
Monitors minor pivot lows with a smaller lookback period.
A valid Small LL must break below the third major low (Low 2).
This Small LL becomes the 0% Fibonacci anchor.
4. 🔄 Change of Character (CHoCH) Selection
The indicator scans recent bars for three possible CHoCH patterns:
// CHoCH Type Definitions in CHoCH Hunter
// Inside → current bar inside previous bar
isInsideBar = high < high and low > low
// Smarty → short-term reversal clue
isSmartyBar = low > low and low < low
// Pivot → minor swing high (small swing detection)
isSmallPivotHigh = ta.pivothigh(high, small_swing_period, small_swing_period)
Filter rules for validity:
CHoCH must occur before the Small LL bar.
Its high must be greater than the Small LL bar’s high (dominance criterion).
5. ⚡ Confirmation & Fibonacci Activation
Once price crosses above the selected CHoCH → setup confirmed.
Fibonacci retracements (logarithmic scale) are calculated:
100% → current high (dynamic, updates before breach).
65% → Golden Zone upper boundary.
50% → Golden Zone lower boundary.
0% → Small LL anchor.
6. 📈 Dynamic Management & Reset Rules
Before 50% breach → Fibo High auto-updates with new highs.
After breach → Levels freeze.
Setup resets if:
Price drops below Small LL.
Price breaks beyond frozen levels.
New Small LL formation detected.
✨ Key Features
📍 Automatic detection of major & minor pivots.
🔍 Clear definitions for Inside, Smarty, Pivot CHoCHs.
📐 Logarithmic Fibonacci retracements for exponential markets.
🎯 Golden Zone highlighting (50%–65%).
🔄 Built-in reset logic to invalidate weak setups.
🎨 Visualization
Pivot markers for Major (📕) & Minor (📘) swings.
Labels for CHoCH points with type (“Inside”, “Smarty”, “Pivot”).
Golden Zone highlighted between 50%–65%.
Optional structure labels for clarity.
⚙️ Inputs & Customization
Major Structure Period (default: 4) — sensitivity for big swings.
Minor Structure Period (default: 2) — sensitivity for small swings.
Toggle display of pivots, structure labels, and Golden Zone.
📚 Educational Value
CHoCH Reversal Hunter is designed to help traders learn:
How bearish structures are objectively defined.
Different CHoCH types and how to filter them.
Applying Fibonacci retracements in structured setups.
⚠️ Risk Disclaimer
🚨 This indicator is for educational purposes only and does not constitute financial advice.
Trading involves significant risk — always backtest and apply sound risk management.
🆕 Release Notes v1.0
Bearish structure detection logic added.
CHoCH type classification (Inside, Smarty, Pivot).
Logarithmic Fibonacci retracement with Golden Zone.
Automatic reset & invalidation rules.
💡 Pro Tip: Watch for the sequence Bearish Background → Small LL → CHoCH → Golden Zone — this is the core hunting pattern of CHoCH Reversal Hunter.

Volatility Wick Trap — Smart Reversal EngineThe Volatility Wick Trap — Smart Reversal Engine is a precision reversal detection tool designed for traders who rely on smart money footprints, volatility compression, and liquidity wick exhaustion to time entries near market turns.
💡 Core Components:
Volatility Squeeze Detection: Identifies candles where range compresses significantly compared to the 14-period average true range, highlighting potential breakout zones.
Liquidity Wick Exhaustion: Detects candles with dominant upper or lower wicks, signaling failed liquidity grabs or stop hunts.
Contextual EMA Filter: Uses a 21-period EMA to filter signals, improving accuracy by aligning with market structure bias.
🔍 How It Works:
Green diamond lines mark bullish hidden reversal zones.
Red diamond lines mark bearish hidden reversal traps.
These lines only appear when volatility compresses and wick traps are confirmed within the trend context.
✅ Clean. Minimal. Tactical.
Ideal for scalpers, swing traders, and smart money enthusiasts looking to fade emotional price spikes.

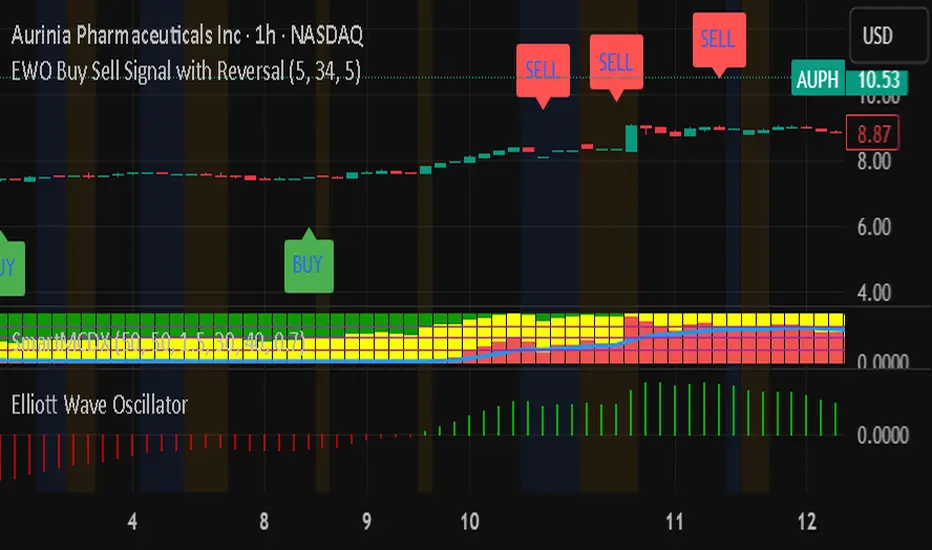
EWO Buy Sell Signal with ReversalEWO Buy Sell Signal with Reversal EWO Buy Sell Signal with Reversal EWO Buy Sell Signal with Reversal EWO Buy Sell Signal with Reversal
WT + Stoch RSI Reversal Combo📊MR.Z RSI : WT + Stochastic RSI Reversal Combo
This custom indicator combines WaveTrend oscillator and Stochastic RSI to detect high-confidence market reversal points, filtering signals so they only appear when both indicators align.
🔍 Core Components:
✅ WaveTrend Oscillator
Based on smoothed deviation from EMA (similar to TCI logic)
Plots:
WT1 (main line)
WT2 (signal line = SMA of WT1)
Uses overbought/oversold thresholds (default: ±53) to filter signals
✅ Stochastic RSI
Momentum oscillator based on RSI's stochastic value
Plots:
%K: smoothed Stoch of RSI
%D: smoothed version of %K
Adjustable oversold/overbought thresholds (default: 20/80)
🔁 Combined Reversal Signal Logic:
🔼 Buy Signal
WT1 crosses above WT2 below WT oversold level (e.g., -53)
%K crosses above %D below Stoch RSI oversold level (e.g., 20)
🔽 Sell Signal
WT1 crosses below WT2 above WT overbought level (e.g., 53)
%K crosses below %D above Stoch RSI overbought level (e.g., 80)
🔔 Signals are only plotted and alerted if both conditions are true.
📌 Features:
Toggle on/off:
WaveTrend lines and histogram
Stochastic RSI
Combined Buy/Sell signals
Horizontal reference lines (±100, OB/OS)
Fully customizable smoothing lengths and thresholds
Signal plots:
✅ Green up-triangle = Combo Buy
✅ Red down-triangle = Combo Sell
Optional: Circle/cross markers for WT-only and Stoch-only signals
🔔 Built-in alerts for Buy/Sell signals
📈 Use Cases:
Reversal Trading: Wait for both indicators to confirm momentum shift
Entry Filter: Use in combination with trend indicators (like EMA)
Scalping or Swing: Works on intraday and higher timeframes
