Rate of Change StrategyRate of Change Strategy :
INTRODUCTION :
This strategy is based on the Rate of Change indicator. It compares the current price with that of a user-defined period of time ago. This makes it easy to spot trends and even speculative bubbles. The strategy is long term and very risky, which is why we've added a Stop Loss. There's also a money management method that allows you to reinvest part of your profits or reduce the size of your orders in the event of substantial losses.
RATE OF CHANGE (ROC) :
As explained above, the ROC is used to situate the current price compared to that of a certain period of time ago. The formula for calculating ROC in relation to the previous year is as follows :
ROC (365) = (close/close (365) - 1) * 100
With this formula we can find out how many percent the change in the current price is compared with 365 days ago, and thus assess the trend.
PARAMETERS :
ROC Length : Length of the ROC to be calculated. The current price is compared with that of the selected length ago.
ROC Bubble Signal : ROC value indicating that we are in a bubble. This value varies enormously depending on the financial product. For example, in the equity market, a bubble exists when ROC = 40, whereas in cryptocurrencies, a bubble exists when ROC = 150.
Stop Loss (in %) : Stop Loss value in percentage. This is the maximum trade value percentage that can be lost in a single trade.
Fixed Ratio : This is the amount of gain or loss at which the order quantity is changed. The default is 400, which means that for each $400 gain or loss, the order size is increased or decreased by an amount chosen by the user.
Increasing Order Amount : This is the amount to be added to or subtracted from orders when the fixed ratio is reached. The default is $200, which means that for every $400 gain, $200 is reinvested in the strategy. On the other hand, for every $400 loss, the order size is reduced by $200.
Initial capital : $1000
Fees : Interactive Broker fees apply to this strategy. They are set at 0.18% of the trade value.
Slippage : 3 ticks or $0.03 per trade. Corresponds to the latency time between the moment the signal is received and the moment the order is executed by the broker.
Important : A bot has been used to test the different parameters and determine which ones maximize return while limiting drawdown. This strategy is the most optimal on BITSTAMP:BTCUSD in 1D timeframe with the following parameters :
ROC Length = 365
ROC Bubble Signal = 180
Stop Loss (in %) = 6
LONG CONDITION :
We are in a LONG position if ROC (365) > 0 for at least two days. This allows us to limit noise and irrelevant signals to ensure that the ROC remains positive.
SHORT CONDITION :
We are in a SHORT position if ROC (365) < 0 for at least two days. We also open a SHORT position when the speculative bubble is about to burst. If ROC (365) > 180, we're in a bubble. If the bubble has been in existence for at least a week and the ROC falls back below this threshold, we can expect the asset to return to reasonable prices, and thus a downward trend. So we're opening a SHORT position to take advantage of this upcoming decline.
EXIT RULES FOR WINNING TRADE :
The strategy is self-regulating. We don't exit a LONG trade until a SHORT signal has arrived, and vice versa. So, to exit a winning position, you have to wait for the entry signal of the opposite position.
RISK MANAGEMENT :
This strategy is very risky, and we can easily end up on the wrong side of the trade. That's why we're going to manage our risk with a Stop Loss, limiting our losses as a percentage of the trade's value. By default, this percentage is set at 6%. Each trade will therefore take a maximum loss of 6%.
If the SL has been triggered, it probably means we were on the wrong side. This is why we change the direction of the trade when a SL is triggered. For example, if we were SHORT and lost 6% of the trade value, the strategy will close this losing trade and open a long position without taking into account the ROC value. This allows us to be in position all the time and not miss the best opportunities.
MONEY MANAGEMENT :
The fixed ratio method was used to manage our gains and losses. For each gain of an amount equal to the value of the fixed ratio, we increase the order size by a value defined by the user in the "Increasing order amount" parameter. Similarly, each time we lose an amount equal to the value of the fixed ratio, we decrease the order size by the same user-defined value. This strategy increases both performance and drawdown.
NOTE :
Please note that the strategy is backtested from 2017-01-01. As the timeframe is 1D, this strategy is a medium/long-term strategy. That's why only 34 trades were closed. Be careful, as the test sample is small and performance may not necessarily reflect what may happen in the future.
Enjoy the strategy and don't forget to take the trade :)
"roc"に関するスクリプトを検索

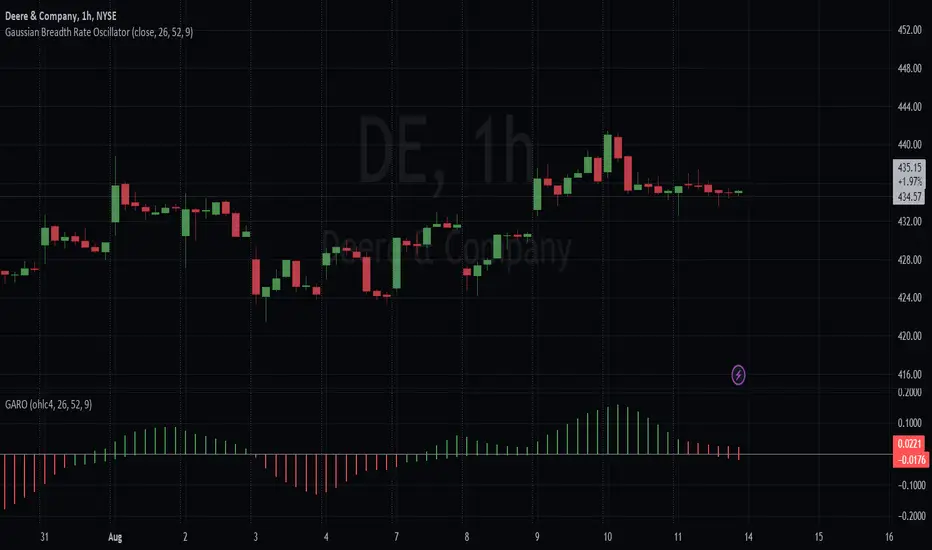
Gaussian Average Rate Oscillator
Within the ALMA calculation, the Gaussian function is applied to each price data point within the specified window. The idea is to give more weight to data points that are closer to the center and reduce the weight for points that are farther away.
The strategy calculates and compares two different Rate of Change (ROC) indicators: one based on the Arnaud Legoux Moving Average (ALMA) and the other based on a smoothed Exponential Moving Average (EMA). The primary goal of this strategy is to identify potential buy and sell signals based on the relationship between these ROC indicators.
Here's how the strategy logic works
Calculating the ROC Indicators:
The script first calculates the ROC (Rate of Change) of the smoothed ALMA and the smoothed EMA. The smoothed ALMA is calculated using a specified window size and is then smoothed further with a specified smoothing period. The smoothed EMA is calculated using a specified EMA length and is also smoothed with the same smoothing period.
Comparing ROCs:
The script compares the calculated ROC values of the smoothed ALMA and smoothed EMA.
The color of the histogram bars representing the ROC of the smoothed ALMA depends on its relationship with the ROC of the smoothed EMA. Green indicates that the ROC of ALMA is higher, red indicates that it's lower, and black indicates equality.
Similarly, the color of the histogram bars representing the ROC of the smoothed EMA is determined based on its relationship with the ROC of the smoothed ALMA, they are simply inversed so that they match.
With the default color scheme, green bars indicate the Gaussian average is outperforming the EMA within the breadth and red bars mean it's underperforming. This is regardless of the rate of average price changes.
Generating Trade Signals:
Based on the comparison of the ROC values, the strategy identifies potential crossover points and trends. Buy signals could occur when the ROC of the smoothed ALMA crosses above the ROC of the smoothed EMA. Sell signals could occur when the ROC of the smoothed ALMA crosses below the ROC of the smoothed EMA.
Additional Information:
The script also plots a zero rate line at the zero level to provide a reference point for interpreting the ROC values.
In summary, the strategy attempts to capture potential buy and sell signals by analyzing the relationships between the ROC values of the smoothed ALMA and the smoothed EMA. These signals can provide insights into potential trends and momentum shifts in the price data.
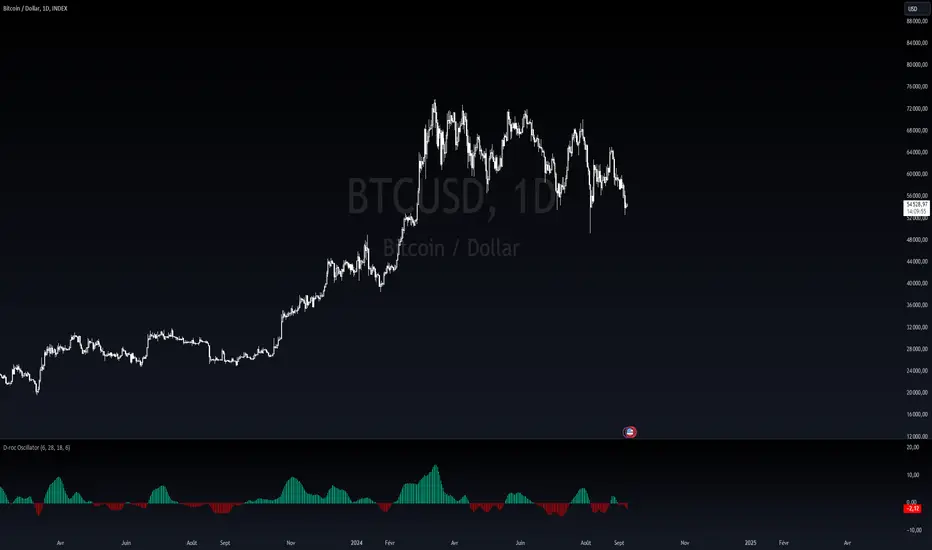
Dynamic Rate of Change OscillatorDynamic Rate of Change (RoC) Oscillator with Color-Coded Histogram
Detailed Description for Publication
The Dynamic Rate of Change (RoC) Oscillator with Color-Coded Histogram is a sophisticated technical analysis tool designed to enhance your understanding of market momentum. Created using Pine Script v5 on the TradingView platform, this indicator integrates multiple Rate of Change (RoC) calculations into a unified momentum oscillator. The resulting data is displayed as a color-coded histogram, providing a clear visual representation of momentum changes.
Key Features and Functionality
Multi-Length RoC Calculation:
Short-term RoC: Calculated over a user-defined period (shortRoCLength), this captures variations in price momentum over a shorter duration, offering insights into the immediate price action.
Long-term RoC: This uses a longer period (longRoCLength) to provide a broader view of momentum, helping to smooth out short-term fluctuations and highlight more established trends.
Mid-term RoC: A weighted average of the short-term and long-term RoCs, the mid-term RoC (midRoCWeight) allows you to balance sensitivity and stability in the oscillator's behavior.
Weighted RoC Calculation:
The indicator calculates a single weighted average RoC by integrating short-term, long-term, and mid-term RoCs. The weighting factor can be adjusted to prioritize different market dynamics according to the trader’s strategy. This flexible approach enables the oscillator to remain applicable across diverse market conditions.
Oscillator Calculation and Smoothing:
The oscillator value is computed by subtracting a 14-period Weighted Moving Average (WMA) from the weighted RoC, which helps to normalize the oscillator, making it more responsive to changes in momentum.
The oscillator is then smoothed using a Simple Moving Average (SMA) over a user-defined period (smoothLength). This process reduces market noise, making the oscillator's signals clearer and easier to interpret.
Color-Coded Histogram:
The smoothed oscillator is displayed as a histogram, which is color-coded to reflect bullish or bearish momentum. You can customize the colors to match your charting style, with green typically representing upward momentum and red representing downward momentum.
The color-coded histogram allows for quick visual identification of momentum changes on the chart, aiding in your market analysis.
Zero-Line Reference:
A horizontal line at the zero level is plotted as a reference point. This zero-line helps in identifying when the histogram shifts from positive to negative or vice versa, which can be useful in understanding momentum shifts.
The zero-line offers a straightforward visual cue, making it easier to interpret the oscillator's signals in relation to market movements.
Customization and Versatility
The Dynamic RoC Oscillator with Histogram is designed with flexibility in mind, making it suitable for a wide range of trading styles, from short-term trading to longer-term analysis. Users have the ability to fine-tune the indicator’s input parameters to align with their specific needs:
Adjustable RoC Periods: Customize the short-term and long-term RoC lengths to match the timeframes you focus on.
Weighted Sensitivity: Adjust the mid-term RoC weight to emphasize different aspects of momentum according to your analysis approach.
Smoothing Options: Modify the smoothing moving average length to control the sensitivity of the oscillator, allowing you to balance responsiveness with noise reduction.
Use Cases
Momentum Analysis: Gain a clearer understanding of momentum changes within the market, which can aid in the evaluation of market trends.
Trend Analysis: The oscillator can help in assessing trends by highlighting when momentum is increasing or decreasing.
Chart Visualization: The color-coded histogram provides a visually intuitive method for monitoring momentum, helping you to more easily interpret market behavior.
Conclusion
The Dynamic Rate of Change (RoC) Oscillator with Color-Coded Histogram is a versatile and powerful tool for traders who seek a deeper analysis of market momentum. With its dynamic calculation methods and high degree of customization, this indicator can be tailored to suit a variety of trading strategies. By integrating it into your TradingView charts, you can enhance your technical analysis capabilities, gaining valuable insights into market momentum.
This indicator is easy to use and highly customizable, making it a valuable addition to any trader’s toolkit. Add it to your charts on the TradingView platform and start exploring its potential to enrich your market analysis.
DeepSignalFilterHelpersLibrary "DeepSignalFilterHelpers"
filter_intraday_intensity(useIiiFilter)
Parameters:
useIiiFilter (bool)
filter_vwma(src, length, useVwmaFilter)
Parameters:
src (float)
length (int)
useVwmaFilter (bool)
filter_nvi(useNviFilter)
Parameters:
useNviFilter (bool)
filter_emv(length, emvThreshold, useEmvFilter, useMovingAvg)
EMV filter for filtering signals based on Ease of Movement
Parameters:
length (int) : The length of the EMV calculation
emvThreshold (float) : The EMV threshold
useEmvFilter (bool) : Whether to apply the EMV filter
useMovingAvg (bool) : Whether to use moving average as threshold
Returns: Filtered result indicating whether the signal should be used
filter_adi(length, threshold, useAdiFilter, useMovingAvg)
ADI filter for filtering signals based on Accumulation/Distribution Index
Parameters:
length (int) : The length of the ADI moving average calculation
threshold (float) : The ADI threshold
useAdiFilter (bool) : Whether to apply the ADI filter
useMovingAvg (bool) : Whether to use moving average as threshold
Returns: Filtered result indicating whether the signal should be used
filter_mfi(length, mfiThreshold, useMfiFilter, useMovingAvg)
MFI filter for filtering signals based on Money Flow Index
Parameters:
length (int) : The length of the MFI calculation
mfiThreshold (float) : The MFI threshold
useMfiFilter (bool) : Whether to apply the MFI filter
useMovingAvg (bool) : Whether to use moving average as threshold
Returns: Filtered result indicating whether the signal should be used
detect_obv_states(obvThresholdStrong, obvThresholdModerate, lookbackPeriod, obvMode)
detect_obv_states: Identify OBV states with three levels (Strong, Moderate, Weak) over a configurable period
Parameters:
obvThresholdStrong (float) : Threshold for strong OBV movements
obvThresholdModerate (float) : Threshold for moderate OBV movements
lookbackPeriod (int) : Number of periods to analyze OBV trends
obvMode (string) : OBV mode to filter ("Strong", "Moderate", "Weak")
Returns: OBV state ("Strong Up", "Moderate Up", "Weak Up", "Positive Divergence", "Negative Divergence", "Consolidation", "Weak Down", "Moderate Down", "Strong Down")
filter_obv(src, length, obvMode, threshold, useObvFilter, useMovingAvg)
filter_obv: Filter signals based on OBV states
Parameters:
src (float) : The source series (default: close)
length (int) : The length of the OBV moving average calculation
obvMode (string) : OBV mode to filter ("Strong", "Moderate", "Weak")
threshold (float) : Optional threshold for additional filtering
useObvFilter (bool) : Whether to apply the OBV filter
useMovingAvg (bool) : Whether to use moving average as threshold
Returns: Filtered result indicating whether the signal should be used
filter_cmf(length, cmfThreshold, useCmfFilter, useMovingAvg)
CMF filter for filtering signals based on Chaikin Money Flow
Parameters:
length (int) : The length of the CMF calculation
cmfThreshold (float) : The CMF threshold
useCmfFilter (bool) : Whether to apply the CMF filter
useMovingAvg (bool) : Whether to use moving average as threshold
Returns: Filtered result indicating whether the signal should be used
filter_vwap(useVwapFilter)
VWAP filter for filtering signals based on Volume-Weighted Average Price
Parameters:
useVwapFilter (bool) : Whether to apply the VWAP filter
Returns: Filtered result indicating whether the signal should be used
filter_pvt(length, pvtThreshold, usePvtFilter, useMovingAvg)
PVT filter for filtering signals based on Price Volume Trend
Parameters:
length (int) : The length of the PVT moving average calculation
pvtThreshold (float) : The PVT threshold
usePvtFilter (bool) : Whether to apply the PVT filter
useMovingAvg (bool) : Whether to use moving average as threshold
Returns: Filtered result indicating whether the signal should be used
filter_vo(shortLength, longLength, voThreshold, useVoFilter, useMovingAvg)
VO filter for filtering signals based on Volume Oscillator
Parameters:
shortLength (int) : The length of the short-term volume moving average
longLength (int) : The length of the long-term volume moving average
voThreshold (float) : The Volume Oscillator threshold
useVoFilter (bool) : Whether to apply the VO filter
useMovingAvg (bool) : Whether to use moving average as threshold
Returns: Filtered result indicating whether the signal should be used
filter_cho(shortLength, longLength, choThreshold, useChoFilter, useMovingAvg)
CHO filter for filtering signals based on Chaikin Oscillator
Parameters:
shortLength (int) : The length of the short-term ADI moving average
longLength (int) : The length of the long-term ADI moving average
choThreshold (float) : The Chaikin Oscillator threshold
useChoFilter (bool) : Whether to apply the CHO filter
useMovingAvg (bool) : Whether to use moving average as threshold
Returns: Filtered result indicating whether the signal should be used
filter_fi(length, fiThreshold, useFiFilter, useMovingAvg)
FI filter for filtering signals based on Force Index
Parameters:
length (int) : The length of the FI calculation
fiThreshold (float) : The Force Index threshold
useFiFilter (bool) : Whether to apply the FI filter
useMovingAvg (bool) : Whether to use moving average as threshold
Returns: Filtered result indicating whether the signal should be used
filter_garman_klass_volatility(length, useGkFilter)
Parameters:
length (int)
useGkFilter (bool)
filter_frama(src, length, useFramaFilter)
Parameters:
src (float)
length (int)
useFramaFilter (bool)
filter_bollinger_bands(src, length, stdDev, useBollingerFilter)
Parameters:
src (float)
length (int)
stdDev (float)
useBollingerFilter (bool)
filter_keltner_channel(src, length, atrMult, useKeltnerFilter)
Parameters:
src (float)
length (simple int)
atrMult (float)
useKeltnerFilter (bool)
regime_filter(src, threshold, useRegimeFilter)
Regime filter for filtering signals based on trend strength
Parameters:
src (float) : The source series
threshold (float) : The threshold for the filter
useRegimeFilter (bool) : Whether to apply the regime filter
Returns: Filtered result indicating whether the signal should be used
regime_filter_v2(src, threshold, useRegimeFilter)
Regime filter for filtering signals based on trend strength
Parameters:
src (float) : The source series
threshold (float) : The threshold for the filter
useRegimeFilter (bool) : Whether to apply the regime filter
Returns: Filtered result indicating whether the signal should be used
filter_adx(src, length, adxThreshold, useAdxFilter)
ADX filter for filtering signals based on ADX strength
Parameters:
src (float) : The source series
length (simple int) : The length of the ADX calculation
adxThreshold (int) : The ADX threshold
useAdxFilter (bool) : Whether to apply the ADX filter
Returns: Filtered result indicating whether the signal should be used
filter_volatility(minLength, maxLength, useVolatilityFilter)
Volatility filter for filtering signals based on volatility
Parameters:
minLength (simple int) : The minimum length for ATR calculation
maxLength (simple int) : The maximum length for ATR calculation
useVolatilityFilter (bool) : Whether to apply the volatility filter
Returns: Filtered result indicating whether the signal should be used
filter_ulcer(src, length, ulcerThreshold, useUlcerFilter)
Ulcer Index filter for filtering signals based on Ulcer Index
Parameters:
src (float) : The source series
length (int) : The length of the Ulcer Index calculation
ulcerThreshold (float) : The Ulcer Index threshold (default: average Ulcer Index)
useUlcerFilter (bool) : Whether to apply the Ulcer Index filter
Returns: Filtered result indicating whether the signal should be used
filter_stddev(src, length, stdDevThreshold, useStdDevFilter)
Standard Deviation filter for filtering signals based on Standard Deviation
Parameters:
src (float) : The source series
length (int) : The length of the Standard Deviation calculation
stdDevThreshold (float) : The Standard Deviation threshold (default: average Standard Deviation)
useStdDevFilter (bool) : Whether to apply the Standard Deviation filter
Returns: Filtered result indicating whether the signal should be used
filter_macdv(src, shortLength, longLength, signalSmoothing, macdVThreshold, useMacdVFilter)
MACD-V filter for filtering signals based on MACD-V
Parameters:
src (float) : The source series
shortLength (simple int) : The short length for MACD calculation
longLength (simple int) : The long length for MACD calculation
signalSmoothing (simple int) : The signal smoothing length for MACD
macdVThreshold (float) : The MACD-V threshold (default: average MACD-V)
useMacdVFilter (bool) : Whether to apply the MACD-V filter
Returns: Filtered result indicating whether the signal should be used
filter_atr(length, atrThreshold, useAtrFilter)
ATR filter for filtering signals based on Average True Range (ATR)
Parameters:
length (simple int) : The length of the ATR calculation
atrThreshold (float) : The ATR threshold (default: average ATR)
useAtrFilter (bool) : Whether to apply the ATR filter
Returns: Filtered result indicating whether the signal should be used
filter_candle_body_and_atr(length, bodyThreshold, atrThreshold, useFilter)
Candle Body and ATR filter for filtering signals
Parameters:
length (simple int) : The length of the ATR calculation
bodyThreshold (float) : The threshold for candle body size (relative to ATR)
atrThreshold (float) : The ATR threshold (default: average ATR)
useFilter (bool) : Whether to apply the candle body and ATR filter
Returns: Filtered result indicating whether the signal should be used
filter_atrp(length, atrpThreshold, useAtrpFilter)
ATRP filter for filtering signals based on ATR Percentage (ATRP)
Parameters:
length (simple int) : The length of the ATR calculation
atrpThreshold (float) : The ATRP threshold (default: average ATRP)
useAtrpFilter (bool) : Whether to apply the ATRP filter
Returns: Filtered result indicating whether the signal should be used
filter_jma(src, length, phase, useJmaFilter)
Parameters:
src (float)
length (simple int)
phase (float)
useJmaFilter (bool)
filter_cidi(src, rsiLength, shortMaLength, longMaLength, useCidiFilter)
Parameters:
src (float)
rsiLength (simple int)
shortMaLength (int)
longMaLength (int)
useCidiFilter (bool)
filter_rsi(src, length, rsiThreshold, useRsiFilter)
Parameters:
src (float)
length (simple int)
rsiThreshold (float)
useRsiFilter (bool)
filter_ichimoku_oscillator(length, threshold, useFilter)
Ichimoku Oscillator filter for filtering signals based on Ichimoku Oscillator
Parameters:
length (int) : The length of the Ichimoku Oscillator calculation
threshold (float) : The threshold for the filter (default: average Ichimoku Oscillator)
useFilter (bool) : Whether to apply the filter
Returns: Filtered result indicating whether the signal should be used
filter_cmb_composite_index(src, shortLength, longLength, threshold, useFilter)
CMB Composite Index filter for filtering signals based on CMB Composite Index
Parameters:
src (float) : The source series
shortLength (simple int) : The short length for CMB calculation
longLength (simple int) : The long length for CMB calculation
threshold (float) : The threshold for the filter (default: average CMB Composite Index)
useFilter (bool) : Whether to apply the filter
Returns: Filtered result indicating whether the signal should be used
filter_connors_rsi(src, rsiLength, rocLength, streakLength, threshold, useFilter)
Connors RSI filter for filtering signals based on Connors RSI
Parameters:
src (float) : The source series
rsiLength (simple int) : The length for RSI calculation
rocLength (int) : The length for ROC calculation
streakLength (simple int) : The length for streak calculation
threshold (float) : The threshold for the filter (default: average Connors RSI)
useFilter (bool) : Whether to apply the filter
Returns: Filtered result indicating whether the signal should be used
filter_coppock_curve(src, roc1Length, roc2Length, wmaLength, threshold, useFilter)
Coppock Curve filter for filtering signals based on Coppock Curve
Parameters:
src (float) : The source series
roc1Length (int) : The length for the first ROC calculation
roc2Length (int) : The length for the second ROC calculation
wmaLength (int) : The length for the WMA calculation
threshold (float) : The threshold for the filter (default: average Coppock Curve)
useFilter (bool) : Whether to apply the filter
Returns: Filtered result indicating whether the signal should be used
filter_pmo(src, pmoLength, smoothingLength, threshold, useFilter)
DecisionPoint Price Momentum Oscillator filter for filtering signals based on PMO
Parameters:
src (float) : The source series
pmoLength (simple int) : The length for PMO calculation
smoothingLength (simple int) : The smoothing length for PMO
threshold (float) : The threshold for the filter (default: average PMO Oscillator)
useFilter (bool) : Whether to apply the filter
Returns: Filtered result indicating whether the signal should be used
filter_macd(src, shortLength, longLength, signalSmoothing, threshold, useFilter)
MACD filter for filtering signals based on MACD
Parameters:
src (float) : The source series
shortLength (simple int) : The short length for MACD calculation
longLength (simple int) : The long length for MACD calculation
signalSmoothing (simple int) : The signal smoothing length for MACD
threshold (float) : The threshold for the filter (default: average MACD)
useFilter (bool) : Whether to apply the filter
Returns: Filtered result indicating whether the signal should be used
filter_macd_histogram(src, shortLength, longLength, signalSmoothing, threshold, useFilter)
MACD-Histogram filter for filtering signals based on MACD-Histogram
Parameters:
src (float) : The source series
shortLength (simple int) : The short length for MACD calculation
longLength (simple int) : The long length for MACD calculation
signalSmoothing (simple int) : The signal smoothing length for MACD
threshold (float) : The threshold for the filter (default: average MACD-Histogram)
useFilter (bool) : Whether to apply the filter
Returns: Filtered result indicating whether the signal should be used
filter_kst(src, r1, r2, r3, r4, sm1, sm2, sm3, sm4, signalLength, threshold, useFilter)
Pring's Know Sure Thing filter for filtering signals based on KST
Parameters:
src (float) : The source series
r1 (int) : The first ROC length
r2 (int) : The second ROC length
r3 (int) : The third ROC length
r4 (int) : The fourth ROC length
sm1 (int) : The first smoothing length
sm2 (int) : The second smoothing length
sm3 (int) : The third smoothing length
sm4 (int) : The fourth smoothing length
signalLength (int) : The signal line smoothing length
threshold (float) : The threshold for the filter (default: average KST Oscillator)
useFilter (bool) : Whether to apply the filter
Returns: Filtered result indicating whether the signal should be used
filter_special_k(src, r1, r2, r3, r4, sm1, sm2, sm3, sm4, threshold, useFilter)
Pring's Special K filter for filtering signals based on Special K
Parameters:
src (float) : The source series
r1 (int) : The first ROC length
r2 (int) : The second ROC length
r3 (int) : The third ROC length
r4 (int) : The fourth ROC length
sm1 (int) : The first smoothing length
sm2 (int) : The second smoothing length
sm3 (int) : The third smoothing length
sm4 (int) : The fourth smoothing length
threshold (float) : The threshold for the filter (default: average Special K)
useFilter (bool) : Whether to apply the filter
Returns: Filtered result indicating whether the signal should be used
filter_roc_momentum(src, rocLength, momentumLength, threshold, useFilter)
ROC and Momentum filter for filtering signals based on ROC and Momentum
Parameters:
src (float) : The source series
rocLength (int) : The length for ROC calculation
momentumLength (int) : The length for Momentum calculation
threshold (float) : The threshold for the filter (default: average ROC and Momentum)
useFilter (bool) : Whether to apply the filter
Returns: Filtered result indicating whether the signal should be used
filter_rrg_relative_strength(src, length, threshold, useFilter)
RRG Relative Strength filter for filtering signals based on RRG Relative Strength
Parameters:
src (float) : The source series
length (int) : The length for RRG Relative Strength calculation
threshold (float) : The threshold for the filter (default: average RRG Relative Strength)
useFilter (bool) : Whether to apply the filter
Returns: Filtered result indicating whether the signal should be used
filter_alligator(useFilter)
Parameters:
useFilter (bool)
filter_wyckoff(useFilter)
Parameters:
useFilter (bool)
filter_squeeze_momentum(bbLength, bbStdDev, kcLength, kcMult, useFilter)
Parameters:
bbLength (int)
bbStdDev (float)
kcLength (simple int)
kcMult (float)
useFilter (bool)
filter_atr_compression(length, atrThreshold, useFilter)
Parameters:
length (simple int)
atrThreshold (float)
useFilter (bool)
filter_low_volume(length, useFilter)
Parameters:
length (int)
useFilter (bool)
filter_nvi_accumulation(useFilter)
Parameters:
useFilter (bool)
filter_ma_slope(src, length, slopeThreshold, useFilter)
Parameters:
src (float)
length (int)
slopeThreshold (float)
useFilter (bool)
filter_adx_low(len, lensig, adxThreshold, useFilter)
Parameters:
len (simple int)
lensig (simple int)
adxThreshold (int)
useFilter (bool)
filter_choppiness_index(length, chopThreshold, useFilter)
Parameters:
length (int)
chopThreshold (float)
useFilter (bool)
filter_range_detection(length, useFilter)
Parameters:
length (int)
useFilter (bool)

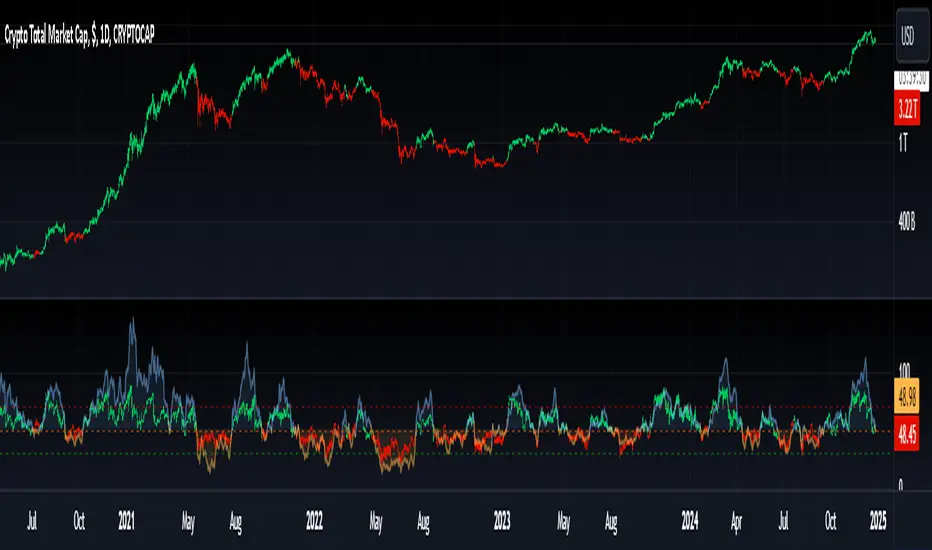
Recency-Weighted Market Memory w/ Quantile-Based DriftRecency-Weighted Market Memory w/ Quantile-Based Drift
This indicator combines market memory, recency-weighted drift, quantile-based volatility analysis, momentum (RoC) filtering, and historical correlation checks to generate dynamic forecasts of possible future price levels. It calculates bullish and bearish forecast lines at each horizon, reflecting how the price might behave based on historical similarities.
Trading Concepts & Mathematical Foundations Explained
1) Market Memory
Concept:
Markets tend to repeat past behaviors under similar conditions. By identifying historical market states that closely match current conditions, we predict future price movements based on what happened historically.
Calculation Steps:
We select a historical lookback window (for example, 210 bars).
Each historical bar within this window is evaluated to see if its conditions match the current market. Conditions include:
Correlation between price change and bullish/bearish volume changes (over a user-defined correlation lookback period).
Momentum (Rate of Change, RoC) measured over a separate lookback period.
Only bars closely matching current conditions (within user-defined tolerance percentages) are included.
2) Recency-Weighted Drift
Concept:
Recent market movements often influence future direction. We assign more importance to recent bars to capture the current market bias effectively.
Calculation Steps:
Consider recent price changes between opens and closes for a user-defined drift lookback (for example, last 20 bars).
Give higher weight to recent bars (the most recent bar gets the highest weight, and weights decrease progressively for older bars).
Average these weighted changes separately for upward and downward movements, then combine these averages to calculate a final drift percentage relative to the current price.
3) Correlation Filtering
Concept:
Price changes often correlate strongly with bullish or bearish volume activity. By using historical correlation comparisons, we focus only on past market states with similar volume-price dynamics.
Calculation Steps:
Compute current correlations between price changes and bullish/bearish volume over the user-defined correlation lookback.
Evaluate each historical bar to see if its correlation closely matches the current correlation (within a user-specified percentage tolerance).
Only historical bars meeting this correlation criterion are selected.
4) Momentum (RoC) Filtering
Concept:
Two market periods may exhibit similar correlation structures but differ in how fast prices move (momentum). To ensure true similarity, momentum is checked as an additional filter.
Calculation Steps:
Compute the current Rate of Change (RoC) over the specified RoC lookback.
For each candidate historical bar, calculate its historical RoC.
Only include historical bars whose RoC closely matches the current RoC (within the RoC percentage tolerance).
5) Quantile-Based Volatility and Drift Amplification
Concept:
Quantiles (such as the 95th, 50th, and 5th percentiles) help gauge if current prices are near historical extremes or the median. Quantile bands measure volatility expansions and contractions.
Calculation Steps:
Calculate the 95%, 50%, and 5% quantiles of price over the quantile lookback period.
Add and subtract multiples of the standard deviation to these quantiles, creating upper and lower bands.
Measure the bands' widths relative to the current price as volatility indicators.
Determine the active quantile (95%, 50%, or 5%) based on proximity to the current price (within a percentage tolerance).
Compute the rate of change (RoC) of the active quantile to detect directional bias.
Combine volatility and quantile RoC into a scaling factor that amplifies or dampens expected price moves.
6) Expected Value (EV) Computation & Forecast Lines
Concept:
We forecast future prices based on how similarly-conditioned historical periods performed. We average historical moves to estimate the expected future price.
Calculation Steps:
For each forecast horizon (e.g., 1 to 27 bars ahead), collect all historical price moves that passed correlation and RoC filters.
Calculate average historical moves for bullish and bearish cases separately.
Adjust these averages by applying recency-weighted drift and quantile-based scaling.
Translate adjusted percentages into absolute future price forecasts.
Draw bullish and bearish forecast lines accordingly.
Indicator Inputs & Their Roles
Correlation Tolerance (%)
Adjusts how strictly the indicator matches historical correlation. Higher tolerance includes more matches, lower tolerance selects fewer but closer matches.
Price RoC Lookback and Price RoC Tolerance (%)
Controls how momentum (speed of price moves) is matched historically. Increasing tolerance broadens historical matches.
Drift Lookback (bars)
Determines the number of recent bars influencing current drift estimation.
Quantile Lookback Period and Std Dev Multipliers
Defines quantile calculation and the size of the volatility bands.
Quantile Contact Tolerance (%)
Sets how close the current price must be to a quantile for it to be considered "active."
Forecast Horizons
Specifies how many future bars to forecast.
Continuous Forecast Lines
Toggles between drawing continuous lines or separate horizontal segments for each forecast horizon.
Practical Trading Applications
Bullish & Bearish EV Lines
These forecast lines indicate expected price levels based on historical similarity. Green indicates positive expectations; red indicates negative.
Momentum vs. Mean Reversion
Wide quantile bands and high drift suggest momentum, while extremes may signal possible reversals.
Volatility Sensitivity
Forecasts adapt dynamically to market volatility. Broader bands increase forecasted price movements.
Filtering Non-Relevant Historical Data
By using both correlation and RoC filtering, irrelevant past periods are excluded, enhancing forecast reliability.
Multi-Timeframe Suitability
Adaptable parameters make this indicator suitable for different trading styles and timeframes.
Complementary Tool
This indicator provides probabilistic projections rather than direct buy or sell signals. Combine it with other trading signals and analyses for optimal results.
Important Considerations
While historically-informed forecasts are valuable, market behavior can evolve unpredictably. Always manage risks and use supplementary analysis.
Experiment extensively with input settings for your specific market and timeframe to optimize forecasting performance.
Summary
The Recency-Weighted Market Memory w/ Quantile-Based Drift indicator uniquely merges multiple sophisticated concepts, delivering dynamic, historically-informed price forecasts. By combining historical similarity, adaptive drift, momentum filtering, and quantile-driven volatility scaling, traders gain an insightful perspective on future price possibilities.
Feel free to experiment, explore, and enjoy this powerful addition to your trading toolkit!

Rate of Change RSIIndicator Name: Rate of Change RSI
Description:
The Rate of Change (ROC) of the Relative Strength Index (RSI) is a technical indicator designed to provide insights into the momentum of an asset's price movement. It combines the Relative Strength Index (RSI), a popular momentum oscillator, with the Rate of Change (ROC) concept to assess the speed at which RSI values are changing.
How It Works:
Relative Strength Index (RSI): The RSI measures the magnitude of recent price changes to evaluate overbought or oversold conditions in an asset. It oscillates between 0 and 100, with readings above 70 typically indicating overbought conditions and readings below 30 indicating oversold conditions.
Rate of Change (ROC): The ROC calculates the percentage change in a given indicator over a specified period. In this indicator, we apply the ROC to the RSI values to determine how quickly the RSI is changing over time.
Key Features:
Acceleration and Deceleration: The ROC of RSI helps traders identify whether the momentum of the RSI is accelerating or decelerating. Positive values suggest increasing momentum, while negative values indicate decreasing momentum.
Dynamic Color Change: The color of the ROC RSI line changes dynamically based on the RSI level. When the RSI is between 0 and 40, the line color is blue, indicating potential oversold conditions. When the RSI is between 40 and 60, the line color is yellow, suggesting neutral conditions. When the RSI is above 60, the line color changes to green, indicating potential overbought conditions.
How to Use:
Acceleration: When the ROC RSI is positive and increasing while the RSI is above 60 (green), it may signal strong upward momentum.
Deceleration: Conversely, if the ROC RSI is negative and decreasing while the RSI is below 40 (blue), it may indicate weakening downward momentum.
Originality and Usefulness:
This indicator combines the RSI, a well-known momentum oscillator, with the ROC concept to provide a unique perspective on momentum dynamics. By dynamically adjusting the color of the ROC RSI line based on RSI levels, traders can quickly assess potential overbought or oversold conditions in the market.
Chart:
The chart displayed alongside this script provides a clean and easy-to-understand visualization of the ROC RSI indicator. The ROC RSI line color changes dynamically based on RSI levels, allowing traders to visually identify potential market conditions at a glance.

Smooth RSI [MarktQuant]This indicator combines elements of the Relative Strength Index (RSI) and Rate of Change (RoC) to provide a smoother and potentially more insightful view of market momentum and price movement. The Smooth RSI calculates RSI values across four price points (high, open, low, close) to average them, offering a less volatile RSI signal. Additionally, it incorporates a Rate of Change for trend confirmation, enhancing the decision-making process for trade entries and exits.
Features:
Multi-RSI Calculation: RSI is computed for high, open, low, and close prices, then averaged to reduce noise.
Trend Confirmation with RoC: Uses the Rate of Change to validate the RSI signals, coloring bars based on the trend direction.
Visual Signals:
Bar colors change based on combined RSI and RoC signals.
Green for bullish signals (RSI above 50 and positive RoC).
Red for bearish signals (RSI below 50 and negative RoC).
Horizontal lines at 30, 50, and 70 to denote overbought, neutral, and oversold conditions.
Customizable Display:
Option to show/hide RSI plot or RoC plot for cleaner charts.
Candle plot overlay option to visualize current price action alongside the indicator.
Inputs:
RSI Length: Default 28. Adjusts the lookback period for RSI calculation.
RoC Length: Default 28. Sets the period for the Rate of Change calculation.
Plot Settings:
Show RSI - Toggle RSI plot visibility.
Show RoC - Toggle RoC plot visibility.
Usage:
Long signals are indicated when the average RSI is above 50 and the RoC is positive.
Short signals are suggested when the average RSI falls below 50 with a negative RoC.
The color coding helps visually confirm trends at a glance.
Notes:
This indicator is best used in conjunction with other analysis methods to confirm signals.
Adjust the length parameters based on your trading timeframe for optimal results.
Disclaimer:
This indicator does not guarantee trading success; use it as part of a comprehensive trading strategy. Always conduct your own analysis before making trading decisions.
[JL] Fractals ATR BlockI decided to combine Fractal ROC , ATR Break, and Order Blocks to an Indicator
The Fractal ROC , ATR Break, and Order Blocks indicator combines three concepts to help traders identify potential trade opportunities and manage risk. By using a combination of Fractal ROC , ATR Break, and Order Blocks, traders can gain a deeper understanding of market dynamics and make more informed trading decisions.
Fractal ROC is a momentum-based indicator that calculates the rate of change of the price between fractals, which are turning points in the market. It is calculated by taking the difference between the closing price and the lowest price in the previous n+1 periods, and dividing it by the difference between the open price 2n periods ago and the lowest price in the previous n+1 periods. This calculation is done for both up and down fractals. When the Fractal ROC value is greater than the ROC Break Level (as determined by the input variable roclevel), it indicates a potential momentum shift in the market. This can be used to identify potential trade entries or exits, depending on your trading strategy.
ATR Break is an indicator that helps traders identify significant price movements in the market. It measures the distance between the price and the Average True Range (ATR), which is a measure of the volatility of the market. ATR Break is calculated by taking the difference between the close and high/low, and dividing it by the previous ATR value. This calculation is done for both up and down movements. When the ATR Break value is greater than the ATR Break Level (as determined by the input variable atrlevel), it indicates a significant move in the market. This can be used to identify potential breakouts or breakdowns, and can be used to set stop-loss and take-profit levels.
An Order Block is a price level where significant buying or selling activity has taken place. The order blocks made by ATR Break and Fractal ROC are drawn using boxes on the chart. When the ATR or Fractal ROC level is breached, a box is drawn with the high and low of the candle that breached the level as the top and bottom of the box, respectively. The box is then extended to the right until the end of the chart or until another ATR or Fractal ROC level is breached, at which point a new box is drawn. This allows traders to easily identify significant price movements and potential support and resistance levels on the chart. When an Order Block is identified, it can be used as a potential support or resistance level . If price approaches an Order Block from below, it is likely to bounce off this level and continue in an upward direction. Similarly, if price approaches an Order Block from above, it is likely to bounce off this level and continue in a downward direction. Traders can use these levels to identify potential trade entries or exits, as well as to set stop-loss and take-profit levels.
Overall, the Fractal ROC , ATR Break, and Order Blocks indicator is a powerful tool for traders who want to identify potential trade opportunities and manage risk. By combining these three concepts, traders can gain a deeper understanding of market dynamics and make more informed trading decisions. As with any indicator, it is important to use it in conjunction with other analysis tools and to have a clear trading plan in place.

Rate Of Change [SIDD]This Oscillator is helping identify rate of change in Price.
Basic Definition :-
The Rate of Change ( ROC ) is a momentum technical indicator.
It measures the percentage change in price between the current price and the price a certain number of periods ago.
This indicator is plotted against zero, with the indicator moving upwards into positive territory if price changes are to the upside, and moving into negative territory if price changes are to the downside.
Customization of inbuilt ROC:- I have created EMA of ROC with 9 days exponential moving average and Coloring the plot of 9 EMA of ROC Green and RED. Green line indicates that Price change rate is positive in last 9 time period on selected resolution (time frame) and Red line indicated that negative price change rate.
I have identified the zone like +5 and -5 line area in study where some resistance or support is there for 9 EMA ROC line. and if 9 EMA ROC crosses those line then intensity of previous trend get increased.
I have drawn here breakout trendline from lower high candle with hand mark up and same time ROC is above 5 marked with hand up. Similarly I have drawn hand mark down where breakdown trendline is drawn for higher low candle breakdown.
You can see clearly ROC 9 EMA is sync correctly with breakout and breakdown candle when ROC 9 EMA
is above 5 and below 5.
I able to observed that ROC 9 EMA is helping in finding correct breakout and breakdown candles with proper trendline breakout and breakdown.
above all my observation is with daily time frame and 1 Hr time frame candles mostly. If you are changing time frame then see the difference and post same in comment so I can watch those changes as well,
You can modify this study and lets create better than this as well. As I think nothing is perfect in this world always there is scope of improvement.
This study to see how the price are getting changing and what is the rate of change .
This study doesn't give any buy and sell recommendation.
I have other indicator which is given in my signature below that you can check.

Macro Momentum – 4-Theme, Vol Target, RebalanceMacro Momentum — 4-Theme, Vol Target, Rebalance
Purpose. A macro-aware strategy that blends four economic “themes”—Business Cycle, Trade/USD, Monetary Policy, and Risk Sentiment—into a single, smoothed Composite signal. It then:
gates entries/exits with hysteresis bands,
enforces optional regime filters (200-day bias), and
sizes the position via volatility targeting with caps for long/short exposure.
It’s designed to run on any chart (index, ETF, futures, single stocks) while reading external macro proxies on a chosen Signal Timeframe.
How it works (high level)
Build four theme signals from robust macro proxies:
Business Cycle: XLI/XLU and Copper/Gold momentum, confirmed by the chart’s price vs a long SMA (default 200D).
Trade / USD: DXY momentum (sign-flipped so a rising USD is bearish for risk assets).
Monetary Policy: 10Y–2Y curve slope momentum and 10Y yield trend (steepening & falling 10Y = risk-on; rising 10Y = risk-off).
Risk Sentiment: VIX momentum (bearish if higher) and HYG/IEF momentum (bullish if credit outperforms duration).
Normalize & de-noise.
Optional Winsorization (MAD or stdev) clamps outliers over a lookback window.
Optional Z-score → tanh mapping compresses to ~ for stable weighting.
Theme lines are SMA-smoothed; the final Composite is LSMA-smoothed (linreg).
Decide direction with hysteresis.
Enter/hold long when Composite ≥ Entry Band; enter/hold short when Composite ≤ −Entry Band.
Exit bands are tighter than entry bands to avoid whipsaws.
Apply regime & direction constraints.
Optional Long-only above 200MA (chart symbol) and/or Short-only below 200MA.
Global Direction control (Long / Short / Both) and Invert switch.
Size via volatility targeting.
Realized close-to-close vol is annualized (choose 9-5 or 24/7 market profile).
Target exposure = TargetVol / RealizedVol, capped by Max Long/Max Short multipliers.
Quantity is computed from equity; futures are rounded to whole contracts.
Rebalance cadence & execution.
Trades are placed on Weekly / Monthly / Quarterly rebalance bars or when the sign of exposure flips.
Optional ATR stop/TP for single-stock style risk management.
Inputs you’ll actually tweak
General
Signal Timeframe: Where macro is sampled (e.g., D/W).
Rebalance Frequency: Weekly / Monthly / Quarterly.
ROC & SMA lengths: Defaults for theme momentum and the 200D regime filter.
Normalization: Z-score (tanh) on/off.
Winsorization
Toggle, lookback, multiplier, MAD vs Stdev.
Risk / Sizing
Target Annualized Vol & Realized Vol Lookback.
Direction (Long/Short/Both) and Invert.
Max long/short exposure caps.
Advanced Thresholds
Theme/Composite smoothing lengths.
Entry/Exit bands (hysteresis).
Regime / Execution
Long-only above 200MA, Short-only below 200MA.
Stops/TP (optional)
ATR length and SL/TP multiples.
Theme Weights
Per-theme scalars so you can push/pull emphasis (e.g., overweight Policy during rate cycles).
Macro Proxies
Symbols for each theme (XLI, XLU, HG1!, GC1!, DXY, US10Y, US02Y, VIX, HYG, IEF). Swap to alternatives as needed (e.g., UUP for DXY).
Signals & logic (under the hood)
Business Cycle = ½ ROC(XLI/XLU) + ½ ROC(Copper/Gold), then confirmed by (price > 200SMA ? +1 : −1).
Trade / USD = −ROC(DXY).
Monetary Policy = 0.6·ROC(10Y–2Y) − 0.4·ROC(10Y).
Risk Sentiment = −0.6·ROC(VIX) + 0.4·ROC(HYG/IEF).
Each theme → (optional Winsor) → (robust z or scaled ROC) → tanh → SMA smoothing.
Composite = weighted average → LSMA smoothing → compare to bands → dir ∈ {−1,0,+1}.
Rebalance & flips. Orders fire on your chosen cadence or when the sign of exposure changes.
Position size. exposure = clamp(TargetVol / realizedVol, maxLong/Short) × dir.
Note: The script also exposes Gross Exposure (% equity) and Signed Exposure (× equity) as diagnostics. These can help you audit how vol-targeting and caps translate into sizing over time.
Visuals & alerts
Composite line + columns (color/intensity reflect direction & strength).
Entry/Exit bands with green/red fills for quick polarity reads.
Hidden plots for each Theme if you want to show them.
Optional rebalance labels (direction, gross & signed exposure, σ).
Background heatmap keyed to Composite.
Alerts
Enter/Inc LONG when Composite crosses up (and on rebalance bars).
Enter/Inc SHORT when Composite crosses down (and on rebalance bars).
Exit to FLAT when Composite returns toward neutral (and on rebalance bars).
Practical tips
Start higher timeframes. Daily signals with Monthly rebalance are a good baseline; weekly signals with quarterly rebalances are even cleaner.
Tune Entry/Exit bands before anything else. Wider bands = fewer trades and less noise.
Weights reflect regime. If policy dominates markets, raise Monetary Policy weight; if credit stress drives moves, raise Risk Sentiment.
Proxies are swappable. Use UUP for USD, or futures-continuous symbols that match your data plan.
Futures vs ETFs. Quantity auto-rounds for futures; ETFs accept fractional shares. Check contract multipliers when interpreting exposure.
Caveats
Macro proxies can repaint at the selected signal timeframe as higher-TF bars form; that’s intentional for macro sampling, but test live.
Vol targeting assumes reasonably stationary realized vol over the lookback; if markets regime-shift, revisit volLook and targetVol.
If you disable normalization/winsorization, themes can become spikier; expect more hysteresis band crossings.
What to change first (quick start)
Set Signal Timeframe = D, Rebalance = Monthly, Z-score on, Winsor on (MAD).
Entry/Exit bands: 0.25 / 0.12 (defaults), then nudge until trade count and turnover feel right.
TargetVol: try 10% for diversified indices; lower for single stocks, higher for vol-sell strategies.
Leave weights = 1.0 until you’ve inspected the four theme lines; then tilt deliberately.

CCO_LibraryLibrary "CCO_Library"
Contrarian Crowd Oscillator (CCO) Library - Multi-oscillator consensus indicator for contrarian trading signals
@author B3AR_Trades
calculate_oscillators(rsi_length, stoch_length, cci_length, williams_length, roc_length, mfi_length, percentile_lookback, use_rsi, use_stochastic, use_williams, use_cci, use_roc, use_mfi)
Calculate normalized oscillator values
Parameters:
rsi_length (simple int) : (int) RSI calculation period
stoch_length (int) : (int) Stochastic calculation period
cci_length (int) : (int) CCI calculation period
williams_length (int) : (int) Williams %R calculation period
roc_length (int) : (int) ROC calculation period
mfi_length (int) : (int) MFI calculation period
percentile_lookback (int) : (int) Lookback period for CCI/ROC percentile ranking
use_rsi (bool) : (bool) Include RSI in calculations
use_stochastic (bool) : (bool) Include Stochastic in calculations
use_williams (bool) : (bool) Include Williams %R in calculations
use_cci (bool) : (bool) Include CCI in calculations
use_roc (bool) : (bool) Include ROC in calculations
use_mfi (bool) : (bool) Include MFI in calculations
Returns: (OscillatorValues) Normalized oscillator values
calculate_consensus_score(oscillators, use_rsi, use_stochastic, use_williams, use_cci, use_roc, use_mfi, weight_by_reliability, consensus_smoothing)
Calculate weighted consensus score
Parameters:
oscillators (OscillatorValues) : (OscillatorValues) Individual oscillator values
use_rsi (bool) : (bool) Include RSI in consensus
use_stochastic (bool) : (bool) Include Stochastic in consensus
use_williams (bool) : (bool) Include Williams %R in consensus
use_cci (bool) : (bool) Include CCI in consensus
use_roc (bool) : (bool) Include ROC in consensus
use_mfi (bool) : (bool) Include MFI in consensus
weight_by_reliability (bool) : (bool) Apply reliability-based weights
consensus_smoothing (int) : (int) Smoothing period for consensus
Returns: (float) Weighted consensus score (0-100)
calculate_consensus_strength(oscillators, consensus_score, use_rsi, use_stochastic, use_williams, use_cci, use_roc, use_mfi)
Calculate consensus strength (agreement between oscillators)
Parameters:
oscillators (OscillatorValues) : (OscillatorValues) Individual oscillator values
consensus_score (float) : (float) Current consensus score
use_rsi (bool) : (bool) Include RSI in strength calculation
use_stochastic (bool) : (bool) Include Stochastic in strength calculation
use_williams (bool) : (bool) Include Williams %R in strength calculation
use_cci (bool) : (bool) Include CCI in strength calculation
use_roc (bool) : (bool) Include ROC in strength calculation
use_mfi (bool) : (bool) Include MFI in strength calculation
Returns: (float) Consensus strength (0-100)
classify_regime(consensus_score)
Classify consensus regime
Parameters:
consensus_score (float) : (float) Current consensus score
Returns: (ConsensusRegime) Regime classification
detect_signals(consensus_score, consensus_strength, consensus_momentum, regime)
Detect trading signals
Parameters:
consensus_score (float) : (float) Current consensus score
consensus_strength (float) : (float) Current consensus strength
consensus_momentum (float) : (float) Consensus momentum
regime (ConsensusRegime) : (ConsensusRegime) Current regime classification
Returns: (TradingSignals) Trading signal conditions
calculate_cco(rsi_length, stoch_length, cci_length, williams_length, roc_length, mfi_length, consensus_smoothing, percentile_lookback, use_rsi, use_stochastic, use_williams, use_cci, use_roc, use_mfi, weight_by_reliability, detect_momentum)
Calculate complete CCO analysis
Parameters:
rsi_length (simple int) : (int) RSI calculation period
stoch_length (int) : (int) Stochastic calculation period
cci_length (int) : (int) CCI calculation period
williams_length (int) : (int) Williams %R calculation period
roc_length (int) : (int) ROC calculation period
mfi_length (int) : (int) MFI calculation period
consensus_smoothing (int) : (int) Consensus smoothing period
percentile_lookback (int) : (int) Percentile ranking lookback
use_rsi (bool) : (bool) Include RSI
use_stochastic (bool) : (bool) Include Stochastic
use_williams (bool) : (bool) Include Williams %R
use_cci (bool) : (bool) Include CCI
use_roc (bool) : (bool) Include ROC
use_mfi (bool) : (bool) Include MFI
weight_by_reliability (bool) : (bool) Apply reliability weights
detect_momentum (bool) : (bool) Calculate momentum and acceleration
Returns: (CCOResult) Complete CCO analysis results
calculate_cco_default()
Calculate CCO with default parameters
Returns: (CCOResult) CCO result with standard settings
cco_consensus_score()
Get just the consensus score with default parameters
Returns: (float) Consensus score (0-100)
cco_consensus_strength()
Get just the consensus strength with default parameters
Returns: (float) Consensus strength (0-100)
is_panic_bottom()
Check if in panic bottom condition
Returns: (bool) True if panic bottom signal active
is_euphoric_top()
Check if in euphoric top condition
Returns: (bool) True if euphoric top signal active
bullish_consensus_reversal()
Check for bullish consensus reversal
Returns: (bool) True if bullish reversal detected
bearish_consensus_reversal()
Check for bearish consensus reversal
Returns: (bool) True if bearish reversal detected
bearish_divergence()
Check for bearish divergence
Returns: (bool) True if bearish divergence detected
bullish_divergence()
Check for bullish divergence
Returns: (bool) True if bullish divergence detected
get_regime_name()
Get current regime name
Returns: (string) Current consensus regime name
get_contrarian_signal()
Get contrarian signal
Returns: (string) Current contrarian trading signal
get_position_multiplier()
Get position size multiplier
Returns: (float) Recommended position sizing multiplier
OscillatorValues
Individual oscillator values
Fields:
rsi (series float) : RSI value (0-100)
stochastic (series float) : Stochastic value (0-100)
williams (series float) : Williams %R value (0-100, normalized)
cci (series float) : CCI percentile value (0-100)
roc (series float) : ROC percentile value (0-100)
mfi (series float) : Money Flow Index value (0-100)
ConsensusRegime
Consensus regime classification
Fields:
extreme_bearish (series bool) : Extreme bearish consensus (<= 20)
moderate_bearish (series bool) : Moderate bearish consensus (20-40)
mixed (series bool) : Mixed consensus (40-60)
moderate_bullish (series bool) : Moderate bullish consensus (60-80)
extreme_bullish (series bool) : Extreme bullish consensus (>= 80)
regime_name (series string) : Text description of current regime
contrarian_signal (series string) : Contrarian trading signal
TradingSignals
Trading signals
Fields:
panic_bottom_signal (series bool) : Extreme bearish consensus with high strength
euphoric_top_signal (series bool) : Extreme bullish consensus with high strength
consensus_reversal_bullish (series bool) : Bullish consensus reversal
consensus_reversal_bearish (series bool) : Bearish consensus reversal
bearish_divergence (series bool) : Bearish price-consensus divergence
bullish_divergence (series bool) : Bullish price-consensus divergence
strong_consensus (series bool) : High consensus strength signal
CCOResult
Complete CCO calculation results
Fields:
consensus_score (series float) : Main consensus score (0-100)
consensus_strength (series float) : Consensus strength (0-100)
consensus_momentum (series float) : Rate of consensus change
consensus_acceleration (series float) : Rate of momentum change
oscillators (OscillatorValues) : Individual oscillator values
regime (ConsensusRegime) : Regime classification
signals (TradingSignals) : Trading signals
position_multiplier (series float) : Recommended position sizing multiplier

simple swing indicator-KTRNSE:NIFTY
1. Pivot High/Low as Lines:
Purpose: Identifies local peaks (pivot highs) and troughs (pivot lows) in price and draws horizontal lines at these levels.
How it Works:
A pivot high occurs when the price is higher than the surrounding bars (based on the pivotLength parameter).
A pivot low occurs when the price is lower than the surrounding bars.
These pivots are drawn as horizontal lines at the price level of the pivot.
Visualization:
Pivot High: A red horizontal line is drawn at the price level of the pivot high.
Pivot Low: A green horizontal line is drawn at the price level of the pivot low.
Example:
Imagine the price is trending up, and at some point, it forms a peak. The script identifies this peak as a pivot high and draws a red line at the price of that peak. Similarly, if the price forms a trough, the script will draw a green line at the low point.
2. Moving Averages (20-day and 50-day):
Purpose: Plots the 20-day and 50-day simple moving averages (SMA) on the chart.
How it Works:
The 20-day SMA smooths the closing price over the last 20 days.
The 50-day SMA smooths the closing price over the last 50 days.
These lines provide an overview of short-term and long-term price trends.
Visualization:
20-day SMA: A blue line showing the 20-day moving average.
50-day SMA: An orange line showing the 50-day moving average.
Example:
When the price is above both moving averages, it indicates an uptrend. If the price crosses below these averages, it might signal a downtrend.
3. Supertrend:
Purpose: The Supertrend is an indicator based on the Average True Range (ATR) and is used to track the market trend.
How it Works:
When the market is in an uptrend, the Supertrend line will be green.
When the market is in a downtrend, the Supertrend line will be red.
Visualization:
Uptrend: The Supertrend line will be plotted in green.
Downtrend: The Supertrend line will be plotted in red.
Example:
If the price is above the Supertrend, the market is considered to be in an uptrend, and if the price is below the Supertrend, the market is in a downtrend.
4. Momentum (Rate of Change):
Purpose: Measures the rate at which the price changes over a set period, showing if the momentum is positive or negative.
How it Works:
The Rate of Change (ROC) measures how much the price has changed over a certain number of periods (e.g., 14).
Positive ROC indicates upward momentum, and negative ROC indicates downward momentum.
Visualization:
Positive ROC: A purple line is plotted above the zero line.
Negative ROC: A purple line is plotted below the zero line.
Example:
If the ROC line is above zero, it means the price is increasing, suggesting bullish momentum. If the ROC is below zero, it indicates bearish momentum.
5. Volume:
Purpose: Displays the volume of traded assets, giving insight into the strength of price movements.
How it Works:
The script will color the volume bars based on whether the price closed higher or lower than the previous bar.
Green bars indicate bullish volume (closing price higher than the previous bar), and red bars indicate bearish volume (closing price lower than the previous bar).
Visualization:
Bullish Volume: Green volume bars when the price closes higher.
Bearish Volume: Red volume bars when the price closes lower.
Example:
If you see a green volume bar, it suggests that the market is participating in an uptrend, and the price has closed higher than the previous period. Red bars indicate a downtrend or selling pressure.
6. MACD (Moving Average Convergence Divergence):
Purpose: The MACD is a trend-following momentum indicator that shows the relationship between two moving averages of the price.
How it Works:
The MACD Line is the difference between the 12-period EMA (Exponential Moving Average) and the 26-period EMA.
The Signal Line is the 9-period EMA of the MACD Line.
The MACD Histogram shows the difference between the MACD line and the Signal line.
Visualization:
MACD Line: A blue line representing the difference between the 12-period and 26-period EMAs.
Signal Line: An orange line representing the 9-period EMA of the MACD line.
MACD Histogram: A red or green histogram that shows the difference between the MACD line and the Signal line.
Example:
When the MACD line crosses above the Signal line, it’s considered a bullish signal. When the MACD line crosses below the Signal line, it’s considered a bearish signal.
Full Chart Example:
Imagine you're looking at a price chart with all the indicators:
Pivot High/Low Lines are drawn as red and green horizontal lines.
20-day and 50-day SMAs are plotted as blue and orange lines, respectively.
Supertrend shows a green or red line indicating the trend.
Momentum (ROC) is shown as a purple line oscillating around zero.
Volume bars are green or red based on whether the close is higher or lower.
MACD appears as a blue line and orange line, with a red or green histogram showing the MACD vs. Signal line difference.
How the Indicators Work Together:
Trend Confirmation: If the price is above the Supertrend line and both SMAs are trending up, it indicates a strong bullish trend.
Momentum: If the ROC is positive and the MACD line is above the Signal line, it further confirms bullish momentum.
Volume: Increasing volume, especially with green bars, suggests that the trend is being supported by active participation.
By using these combined indicators, you can get a comprehensive view of the market's trend, momentum, and potential reversal points (via pivot highs and lows).

T3 [RATE OF CHANGE] by SKiNNiEHDeveloped by Tim Tillson, the Tilson Moving Average (T3) is a trend indicator with the advantage of having less lag than other ones. That is, a faster moving average. The T3 moving average is an "indicator of an indicator" as it includes several EMAs of another EMA. Unlike other moving averages, the t3 adds the so-called volume factor, a value between 0 and 1.
The T3 RATE OF CHANGE by SKiNNiEH is a unique indicator that integrates the T3 moving average with a normalized Rate of Change (RoC) calculation. Unlike traditional T3 moving averages, this indicator provides additional smoothing modes (SINGLE, DOUBLE & TRIPLE) for the T3, whilst enhancing visual feedback of the plotted line by generating a dynamic line thickness, a dynamic line color & brightness and trade entry bars, offering traders a more dynamic view of market conditions without going "overboard" with settings.
How It Works
Visualization
The T3 line varies in thickness and color based on the RoC values, giving traders visual cues about market strength and direction.
Thicker and brighter lines indicate stronger trends, while thinner and duller lines suggest weaker trends.
Rate of Change Filte r
This filter refines trend detection by using the line thickness measurement.
Adjustable from 0 (disabled) to 4, where higher settings only consider stronger trends for signals.
The T3 line turns gray when the filter is triggered or when the RoC is extremely low, signaling a weak or neutral market.
T3 Calculation (mode)
SINGLE
The T3 calculation is applied once to the closing price.
This mode has the least smoothing effect and the least lag. It reacts more quickly to price changes but is less smooth.
DOUBLE
The T3 calculation is applied twice sequentially.
The first T3 calculation smooths the closing price.
The second T3 calculation smooths the result of the first T3 calculation.
This mode provides more smoothing and introduces more lag compared to SINGLE mode. It is smoother but reacts slower to price changes.
TRIPLE
The T3 calculation is applied three times sequentially.
The first T3 calculation smooths the closing price.
The second T3 calculation smooths the result of the first T3 calculation.
The third T3 calculation smooths the result of the second T3 calculation.
This mode provides the most smoothing and introduces the most lag by reacting the slowest to price changes.
Rate of Change (RoC) Calculation
The script calculates the Rate of Change (RoC) for the T3 values based on the selected mode (SINGLE, DOUBLE, TRIPLE). The RoC measures the percentage change between the most recent value and a value in the past. The measurement is then normalized in three different ranges.
Normalization 5: Determines T3 line thickness on a scale from 0 - 5
Normalization 10: Determines T3 color brightness on a scale from 0 - 10
Normalization 100: Determines Rate of Change percentage
Rate of Change Filter
The script uses the RoC filter to refine the trend detection logic. By using the line thickness measurement, a filter can be enabled by setting this input on 1 - 4. As an example, setting this to 4 means that only a line thickness of 5 would be considered for a trade signal. Setting this to 0 disables the filter. The T3 line will turn gray when the filter is triggered, the T3 line can also turn gray without the filter, when the Rate of Change is extremely low.
Trade Signals
A trade signal is printed as a vertical green or red bar when the following conditions are met:
Long:
Closing price is above the T3 line
Rate of Change percentage is above 0
Previous trade signal was a short signal **
Rate of Change is not filtered
Short:
Closing price is below the T3 line
Rate of Change percentage is below 0
Previous trade signal was a long signal **
Rate of Change is not filtered
** Or this is the very first recorded trade signal
It should be noted that the trade signals in this script are trade entry signals, not trade exit signals. Use at your own risk.
Instructions for Use
Setting Up the Indicator
Apply the indicator to your trading chart.
Choose the desired T3 mode (SINGLE, DOUBLE, TRIPLE) based on your need for smoothing and lag.
Set the desired length (lookback period).
Set the desired factor between 0 and 1 (increments of 0.1)
Choose an overall line thickness and brightness that suits your screen and taste preferences.
Apply the Rate of Change filter. Setting this to 0 will disable the filter
Tip: use the trade entry vertical bars as a visual calibration tool the adjust mode, length, factor and filter.
Interpreting Visual Cues
Observe the T3 line's thickness: thicker lines indicate stronger trends, while thinner lines suggest weaker trends.
Observe the T3 line's color and color brightness: green indicates a more bullish trend, while red indicates a more bearish trend. A brighter color suggest a stronger trend. A gray color means the RoC is very low / neutral, or the RoC filter is active.
Observe the T3 line's location relative to price: below price indicates a more bullish trend, above price indicates a more bearish trend. The T3 line distance from price can also be an indication of trend strength.
Observe vertical bars: a vertical bar is printed green when long conditions are met, a vertical bar is printed red when short conditions are met. See the rules that explain the trigger for this bar above.
Alerts
Go to the settings tab, set the condition to T3.RoC.S + LONG or SHORT.
Enter an alert name and message.
Configure your notification preferences in the notifications tab and create the alert
Notifications-tab: Choose your notification preferences
Create the alert.

Rate Of Change - Weekly SignalsRate of Change - Weekly Signals
This indicator gives a potential "buy signal" using Rate of Change of SPX and VIX together,
using the following criteria:
SPX Weekly ROC(10) has been BELOW -9 and now rises ABOVE -5
*PLUS*
VIX Weekly ROC(10) has been ABOVE +80 and now falls BELOW +10
The background will turn RED when ROC(SPX) is below -9 and ROC(VIX) is above +80.
The background will turn GREEN when ROC(SPX) is above -5 and ROC(VIX) is below +10.
So the potential "buy signal" is when you start to get GREEN BARS AFTER RED - usually with
some white/empty bars in between...but wait for the green. This indicates that the volatility
has settled down, and the market is starting to turn up.
This indicator gives excellent entry points, but be careful of the occasional false signals.
See Nov. 2001 and Nov. 2008, in both cases the market dropped another 25-30% before the final
bottom was formed. Always have an exit strategy, especially when buying in after a downtrend.
How I use this indicator, pretty much as shown in the preview. Weekly SPX as the main chart with
some medium/long moving averages to identify the trend, VIX added as a "Compare Symbol" in red,
and then the Weekly ROC signals below.
For the ROC graphs, you can show SPX+VIX together, SPX alone, or VIX alone. I prefer to display
them separately because they don't scale well together (VIX crowds out the SPX when it spikes).
Background color is still based on both SPX/VIX together, regardless of which graph is shown.
Note that there is no VIX data available on Trading View prior to 1990, so for those dates the
formula is using only ROC(SPX) and the assigned thresholds (-9 and -5, or whatever you choose).

Puts vs Longs vs Price Oscillator SwiftEdgeWhat is this Indicator?
The "Low-Latency Puts vs Longs vs Price Oscillator" is a custom technical indicator built for TradingView to help traders visualize buying and selling activity in a market without access to order book data. It displays three lines in an oscillator below the price chart:
Green Line (Longs): Represents the strength of buying activity (bullish pressure).
Red Line (Puts): Represents the strength of selling activity (bearish pressure).
Yellow Line (Price): Shows the asset’s price in a scaled format for direct comparison.
The indicator uses price movements, volume, and momentum to estimate when buyers or sellers are active, providing a quick snapshot of market dynamics. It’s optimized for fast response to price changes (low latency), making it useful for both short-term and longer-term trading strategies.
How Does it Work?
Since TradingView doesn’t provide direct access to order book data (which shows real-time buy and sell orders), this indicator approximates buying and selling pressure using commonly available data: price, volume, and a momentum measure called Rate of Change (ROC). Here’s how it combines these elements:
Price Movement: The indicator checks if the price is rising or falling compared to the previous candlestick. A rising price suggests buying (longs), while a falling price suggests selling (puts).
Volume: Volume acts as a "weight" to measure the strength of these price moves. Higher volume during a price increase boosts the green line, while higher volume during a price decrease boosts the red line. This mimics how large orders in an order book would influence the market.
Rate of Change (ROC): ROC measures how fast the price is changing over a set period (e.g., 5 candlesticks). It adds a momentum filter—strong upward momentum reinforces buying signals, while strong downward momentum reinforces selling signals.
These components are calculated for each candlestick and summed over a short lookback period (e.g., 5 candlesticks) to create the green and red lines. The yellow line is simply the asset’s closing price scaled down to fit the oscillator’s range, allowing you to compare buying/selling strength directly with price action.
Why Combine These Elements?
The combination of price, volume, and ROC is intentional and synergistic:
Price alone isn’t enough—it tells you what happened but not how strong the move was.
Volume adds context by showing the intensity behind price changes, much like how order book volume indicates real buying or selling interest.
ROC ensures the indicator captures momentum, filtering out weak or random price moves and focusing on significant trends, similar to how aggressive order execution might appear in an order book.
Together, they create a balanced picture of market activity that’s more reliable than any single factor alone. The goal is to simulate the insights you’d get from an order book—where you’d see buy/sell imbalances—using data available in TradingView.
How to Use It
Setup:
Add the indicator to your chart via TradingView’s Pine Editor by copying and pasting the script.
Adjust the inputs to suit your trading style:
Lookback Period: Number of candlesticks (default 5) to sum buying/selling activity. Shorter = more responsive; longer = smoother.
Price Scale Factor: Scales the yellow price line (default 0.001). Increase for high-priced assets (e.g., 0.01 for indices like DAX) or decrease for low-priced ones (e.g., 0.0001 for crypto).
ROC Period: Candlesticks for momentum calculation (default 5). Shorter = faster response.
ROC Weight: How much momentum affects the signal (default 0.5). Higher = stronger momentum influence.
Volume Threshold: Minimum volume multiplier (default 1.5) to boost signals during high activity.
Reading the Oscillator:
Green Line Above Yellow: Strong buying pressure—price is rising with volume and momentum support. Consider this a bullish signal.
Red Line Above Yellow: Strong selling pressure—price is falling with volume and momentum support. Consider this a bearish signal.
Green/Red Crossovers: When the green line crosses above the red, it suggests buyers are taking control. When the red crosses above the green, sellers may be dominating.
Yellow Line Context: Compare green/red lines to the yellow price line to see if buying/selling strength aligns with price trends.
Trading Examples:
Bullish Setup: Green line spikes above yellow after a price breakout with high volume (e.g., DAX opening jump). Enter a long position if confirmed by other indicators.
Bearish Setup: Red line rises above yellow during a price drop with increasing volume. Look for a short opportunity.
Reversal Warning: If the green line stays high while price (yellow) flattens or drops, it could signal overbought conditions—be cautious.
What Makes It Unique?
Unlike traditional oscillators like RSI or MACD, which focus solely on price momentum or trends, this indicator blends price, volume, and momentum into a three-line system that mimics order book dynamics. Its low-latency design (short lookback and no heavy smoothing) makes it react quickly to market shifts, ideal for volatile markets like DAX or forex. The visual separation of buying (green) and selling (red) against price (yellow) offers a clear, intuitive way to spot imbalances without needing complex data.
Tips and Customization
Volatile Markets: Use a shorter lookback (e.g., 3) and ROC period (e.g., 3) for faster signals.
Stable Markets: Increase lookback (e.g., 10) for smoother, less noisy lines.
Scaling: If the green/red lines dwarf the yellow, adjust Price Scale Factor up (e.g., 0.01) to balance them.
Experiment: Test on your asset (stocks, crypto, indices) and tweak inputs to match its behavior.

Cartera SuperTrends v4 PublicDescription
This script creates a screener with a list of ETFs ordered by their average ROC in three different periods representing 4, 6 and 8 months by default. The ETF
BIL
is always included as a reference.
The previous average ROC value shows the calculation using the closing price from last month.
The current average ROC value shows the calculation using the current price.
The previous average column background color represents if the ETF average ROC is positive or negative.
The current average column background color represents if the ETF average ROC is positive or negative.
The current average column letters color represents if the current ETF average ROC is improving or not from the previous month.
Changes from V2 to V3
Added the option to make the calculation monthly, weekly or daily
Changes from V3 to V4
Adding up to 25 symbols
Highlight the number of tickers selected
Highlight the sorted column
Complete refactor of the code using a matrix of arrays
Options
The options available are:
Make the calculation monthly, weekly or daily
Adjust Data for Dividends
Manual calculation instead of using ta.roc function
Sort table
Sort table by the previous average ROC or the current average ROC
Number of tickers selected to highlight
First Period in months, weeks or days
Second Period in months, weeks or days
Third Period in months, weeks or days
Select the assets (max 25)
Usage
Just add the indicator to your favorite indicators and then add it to your chart.

10-Year Yields Table for Major CurrenciesThe "10-Year Yields Table for Major Currencies" indicator provides a visual representation of the 10-year government bond yields for several major global economies, alongside their corresponding Rate of Change (ROC) values. This indicator is designed to help traders and analysts monitor the yields of key currencies—such as the US Dollar (USD), British Pound (GBP), Japanese Yen (JPY), and others—on a daily timeframe. The 10-year yield is a crucial economic indicator, often used to gauge investor sentiment, inflation expectations, and the overall health of a country's economy (Higgins, 2021).
Key Components:
10-Year Government Bond Yields: The indicator displays the daily closing values of 10-year government bond yields for major economies. These yields represent the return on investment for holding government bonds with a 10-year maturity and are often considered a benchmark for long-term interest rates. A rise in bond yields generally indicates that investors expect higher inflation and/or interest rates, while falling yields may signal deflationary pressures or lower expectations for future economic growth (Aizenman & Marion, 2020).
Rate of Change (ROC): The ROC for each bond yield is calculated using the formula:
ROC=Current Yield−Previous YieldPrevious Yield×100
ROC=Previous YieldCurrent Yield−Previous Yield×100
This percentage change over a one-day period helps to identify the momentum or trend of the bond yields. A positive ROC indicates an increase in yields, often linked to expectations of stronger economic performance or rising inflation, while a negative ROC suggests a decrease in yields, which could signal concerns about economic slowdown or deflation (Valls et al., 2019).
Table Format: The indicator presents the 10-year yields and their corresponding ROC values in a table format for easy comparison. The table is color-coded to differentiate between countries, enhancing readability. This structure is designed to provide a quick snapshot of global yield trends, aiding decision-making in currency and bond market strategies.
Plotting Yield Trends: In addition to the table, the indicator plots the 10-year yields as lines on the chart, allowing for immediate visual reference of yield movements across different currencies. The plotted lines provide a dynamic view of the yield curve, which is a vital tool for economic analysis and forecasting (Campbell et al., 2017).
Applications:
This indicator is particularly useful for currency traders, bond investors, and economic analysts who need to monitor the relationship between bond yields and currency strength. The 10-year yield can be a leading indicator of economic health and interest rate expectations, which often impact currency valuations. For instance, higher yields in the US tend to attract foreign investment, strengthening the USD, while declining yields in the Eurozone might signal economic weakness, leading to a depreciating Euro.
Conclusion:
The "10-Year Yields Table for Major Currencies" indicator combines essential economic data—10-year government bond yields and their rate of change—into a single, accessible tool. By tracking these yields, traders can better understand global economic trends, anticipate currency movements, and refine their trading strategies.
References:
Aizenman, J., & Marion, N. (2020). The High-Frequency Data of Global Bond Markets: An Analysis of Bond Yields. Journal of International Economics, 115, 26-45.
Campbell, J. Y., Lo, A. W., & MacKinlay, A. C. (2017). The Econometrics of Financial Markets. Princeton University Press.
Higgins, M. (2021). Macroeconomic Analysis: Bond Markets and Inflation. Harvard Business Review, 99(5), 45-60.
Valls, A., Ferreira, M., & Lopes, M. (2019). Understanding Yield Curves and Economic Indicators. Financial Markets Review, 32(4), 72-91.
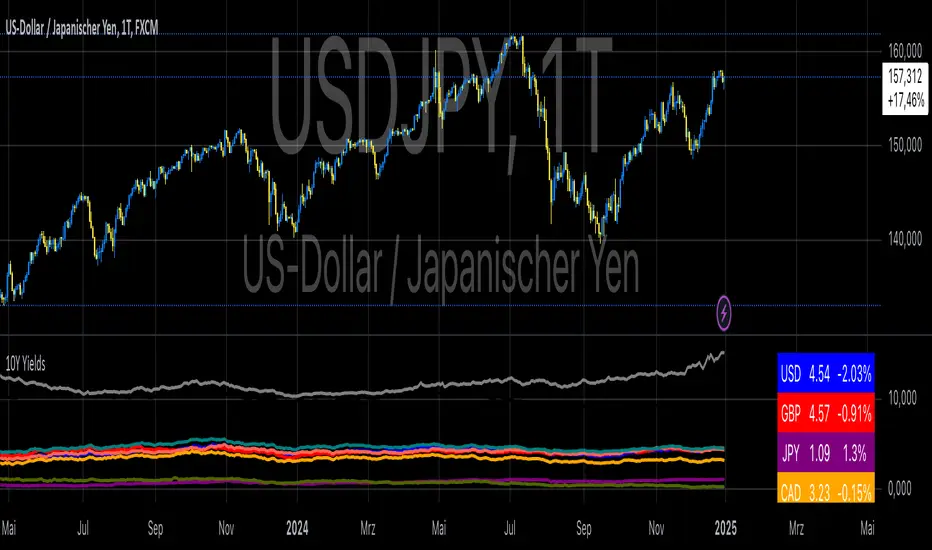
Rate of Change of OBV with RSI ColorThis indicator combines three popular tools in technical analysis : On-Balance Volume (OBV), Rate of Change (ROC), and Relative Strength Index (RSI). It aims to monitor momentum and potential trend reversals based on volume and price changes.
Calculation:
ROC(OBV) = ((OBV(today) - OBV(today - period)) / OBV(today - period)) * 100
This calculates the percentage change in OBV over a specific period. A positive ROC indicates an upward trend in volume, while a negative ROC suggests a downward trend.
What it Monitors:
OBV: Tracks the volume flow associated with price movements. Rising OBV suggests buying pressure, while falling OBV suggests selling pressure.
ROC of OBV:
Measures the rate of change in the OBV, indicating if the volume flow is accelerating or decelerating.
RSI: Measures the strength of recent price movements, indicating potential overbought or oversold conditions.
How it can be Used:
Identifying Trend Continuation: Rising ROC OBV with a rising RSI might suggest a continuation of an uptrend, especially if the color is lime (RSI above 60).
Identifying Trend Reversal: Falling ROC OBV with a declining RSI might suggest a potential trend reversal, especially if the color approaches blue (RSI below 40).
Confirmation with Threshold: The horizontal line (threshold) can be used as a support or resistance level. Bouncing ROC OBV off the threshold with a color change could suggest a pause in the trend but not necessarily a reversal.
When this Indicator is Useful:
This indicator can be useful for assets with strong volume activity, where tracking volume changes provides additional insights.
It might be helpful during periods of consolidation or trend continuation to identify potential breakouts or confirmations.
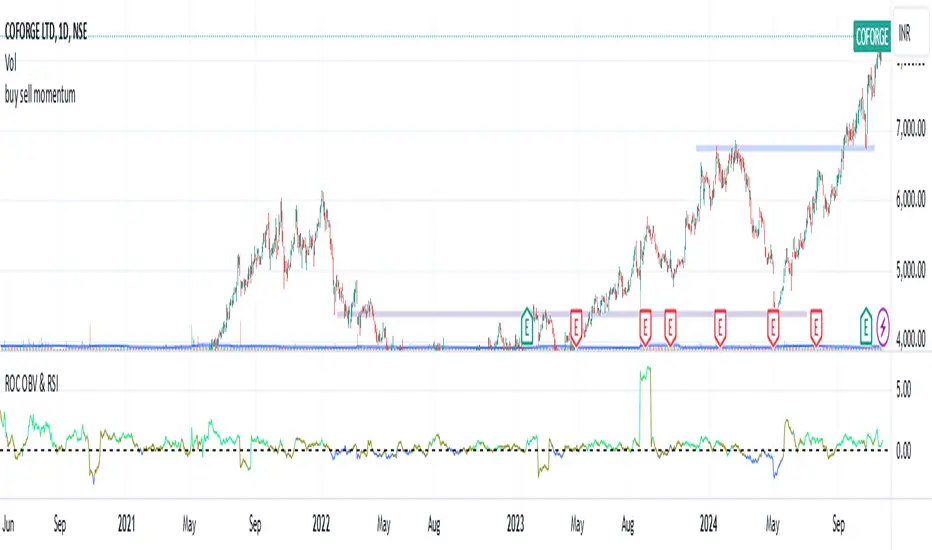
Iridescent Liquidity Prism [JOAT]Iridescent Liquidity Prism | Peer Momentum HUD
A multi-layered order-flow indicator that combines microstructure analysis, smart-money footprint detection, and intermarket momentum signals. The script uses dynamic color-shifting themes to visualize liquidity patterns, structure, and peer momentum data directly on the chart.
There is so much to choose from inside the settings, if you think it's a mess on the chart it's because you have to personally customize it based on your needs...
Core Functionality
The indicator calculates and displays several analytical layers simultaneously:
Order-Flow Imbalance (OFI): Calculates buy vs. sell volume pressure using volume-weighted price distribution within each bar. Uses an EMA filter (default: 55 periods) to smooth the signal. Values are normalized using standard deviation to identify significant imbalances.
Smart Money Footprints: Detects accumulation and distribution zones by comparing volume rate of change (ROC) against price ROC. When volume ROC exceeds a threshold (default: 65%) and price ROC is positive, accumulation is detected. When volume ROC is high but price ROC is negative, distribution is detected.
Fractal Structure Mapping: Identifies pivot highs and lows using a fractal detection algorithm (default: 5-bar period). Maintains a rolling window of recent structure points (default: 4 levels) and draws connecting lines to show trend structure.
Fair Value Gap (FVG) Detection: Automatically detects price gaps where three consecutive candles create an imbalance. Bullish FVGs occur when the current low exceeds the high two bars ago. Bearish FVGs occur when the current high is below the low two bars ago. Gaps persist for a configurable duration (default: 320 bars) and fade when price fills the gap.
Liquidity Void Detection: Identifies candles where the high-low range exceeds an ATR threshold (default: 1.7x ATR) while volume is below average (default: 65% of 20-bar average). These conditions suggest areas where liquidity may be thin.
Price/Volume Divergence: Uses linear regression to detect when price trend direction disagrees with volume trend direction. A divergence alert appears when price is trending up while volume is trending down, or vice versa.
Peer Momentum Heatmap (PMH): Calculates composite momentum scores for up to 6 symbols across 4 timeframes. Each score combines RSI (default: 14 periods) and StochRSI (default: 14 periods, 3-bar smooth) to create a momentum composite between -1 and +1. The highest absolute momentum score across all combinations is displayed in the HUD.
Custom settings using Fractal Pivots, Skeleton Structure, Pulse Liquidity Voids, Bottom Colorful HeatMaps, and Iridescent Field.
---
Visual Components
Spectrum Aura Glow: ATR-weighted bands (default: 0.25x ATR) that expand and contract around price action, indicating volatility conditions. The thickness adapts to market volatility.
Chromatic Flow Trail: A blended line combining EMA and WMA of price (default: 8-period EMA blended with WMA at 65% ratio). The trail uses gradient colors that shift based on a phase oscillator, creating an iridescent effect.
Volume Heat Projection: Creates horizontal volume profile bands at price levels (default: 14 levels). Scans recent bars (default: 150 bars) to calculate volume concentration. Each level is colored based on its volume density relative to the maximum volume level.
Structure Skeleton: Dashed lines connecting fractal pivot points. Uses two layers: a primary line (2-3px width) and an optional glow overlay (4-5px width) for enhanced visibility.
Fractal Markers: Diamond shapes placed at pivot high and low points. Color-coded: primary color for highs, secondary color for lows.
Iridescent Color Themes: Five color themes available: Iridescent (default), Pearlescent, Prismatic, ColorShift, and Metallic. Colors shift dynamically using a phase oscillator that cycles through the color spectrum based on bar index and a speed multiplier (default: 0.35).
---
HUD Console Metrics
The right-side HUD displays seven key metrics:
Flow: Shows OFI status: ▲ FLOW BUY when normalized OFI exceeds imbalance threshold (default: 2.2), ▼ FLOW SELL when below -2.2, or ◆ FLOW BAL when balanced.
Struct: Structure trend bias: ▲ STRUCT BULL when microtrend > 2, ▼ STRUCT BEAR when < -2, or ◆ STRUCT RANGE when neutral.
Smart$: Institutional activity: ◈ ACCUM when smart money index = 1, ◈ DISTRIB when = -1, or ○ IDLE when inactive.
Liquid: Liquidity state: ⚡ VOID when a liquidity void is detected, or ● NORMAL otherwise.
Diverg: Divergence status: ⚠ ALERT when price/volume divergence detected, or ✓ CLEAR when aligned.
PMH: Peer Momentum Heatmap status: Shows dominant timeframe and momentum score. Displays 🪩 for bull surge (above 0.55 threshold) or 🧨 for bear surge (below -0.55).
FVG: Fair Value Gap status: Shows active gap count or CLEAR when no gaps exist. Displays GAP LONG when bullish gap detected, GAP SHORT when bearish gap detected.
Pearlscent Color with Volume Heatmap.
Parameters and Settings
Microstructure Engine:
Analysis Depth: 20-250 bars (default: 55) - Controls OFI smoothing period
Liquidity Threshold ATR: 1.0-4.0 (default: 1.7) - Multiplier for void detection
Imbalance Ratio: 1.5-6.0 (default: 2.2) - Standard deviations for OFI significance
Smart Money Layer:
Smart Money Window: 10-150 bars (default: 24) - Period for ROC calculations
Accumulation Threshold: 40-95% (default: 65%) - Volume ROC threshold
Structural Mapping:
Fractal Pivot Period: 3-15 bars (default: 5) - Period for pivot detection
Structure Memory: 2-8 levels (default: 4) - Number of structure points to track
Volume Heat Projection:
Heat Map Lookback: 60-400 bars (default: 150) - Bars to analyze for volume profile
Heat Map Levels: 5-30 levels (default: 14) - Number of price level bands
Heat Map Opacity: 40-100% (default: 92%) - Transparency of heat map boxes
Heat Map Width Limit: 6-80 bars (default: 26) - Maximum width of heat map boxes
Heat Map Visibility Threshold: 0.0-0.5 (default: 0.08) - Minimum density to display
Iridescent Enhancements:
Visual Theme: Iridescent, Pearlescent, Prismatic, ColorShift, or Metallic
Color Shift Speed: 0.05-1.00 (default: 0.35) - Speed of color phase oscillation
Aura Thickness (ATR): 0.05-1.0 (default: 0.25) - Multiplier for aura band width
Chromatic Trail Length: 2-50 bars (default: 8) - Period for trail calculation
Trail Blend Ratio: 0.1-0.95 (default: 0.65) - EMA/WMA blend percentage
FVG Persistence: 50-600 bars (default: 320) - Bars to keep FVG boxes active
Max Active FVG Boxes: 10-200 (default: 40) - Maximum boxes on chart
FVG Base Opacity: 20-95% (default: 80%) - Transparency of FVG boxes
Peer Momentum Heatmap:
Peer Symbols: Comma-separated list of up to 6 symbols (e.g., "BTCUSD,ETHUSD")
Peer Timeframes: Comma-separated list of up to 4 timeframes (default: "60,240,D")
PMH RSI Length: 5-50 periods (default: 14)
PMH StochRSI Length: 5-50 periods (default: 14)
PMH StochRSI Smooth: 1-10 periods (default: 3)
Super Momentum Threshold: 0.2-0.95 (default: 0.55) - Threshold for surge detection
Clarity & Readability:
Liquidity Void Opacity: 5-90% (default: 30%)
Smart Money Footprint Opacity: 5-90% (default: 35%)
HUD Background Opacity: 40-95% (default: 70%)
Iridescent Field:
Field Opacity: 20-100% (default: 86%) - Background color intensity
Field Smooth Length: 10-200 bars (default: 34) - Smoothing for background gradient
---
Alerts
The indicator provides seven alert conditions:
Liquidity Void Detected - Triggers when void conditions are met
Strong Order Flow - Triggers when normalized OFI exceeds imbalance ratio
Smart Money Activity - Triggers when accumulation or distribution detected
Price/Volume Divergence - Triggers when divergence conditions occur
Structure Shift - Triggers when structure polarity changes significantly
PMH Bull Surge - Triggers when PMH exceeds positive threshold (if enabled)
PMH Bear Surge - Triggers when PMH exceeds negative threshold (if enabled)
Bull/Bear Prismatic FVG - Triggers when new FVG is detected (if FVG display enabled)
---
Usage Considerations
Performance may vary on lower timeframes due to the volume heat map calculations scanning multiple bars. Consider reducing heat map lookback or levels if experiencing slowdowns.
The PMH feature requires data requests to other symbols/timeframes, which may impact performance. Limit the number of peer symbols and timeframes for optimal performance.
FVG boxes automatically expire after the persistence period to prevent chart clutter. The maximum box limit (default: 40) prevents excessive memory usage.
Color themes affect all visual elements. Choose a theme that provides good contrast with your chart background.
The indicator is designed for overlay display. All visual elements are positioned relative to price action.
Structure lines are drawn dynamically as new pivots form. On fast-moving markets, structure may update frequently.
Volume calculations assume typical volume data availability. Symbols without volume may show incomplete data for volume-dependent features.
---
Technical Notes
Built on Pine Script v6 with dynamic request capability for PMH functionality.
Uses exponential moving averages (EMA) and weighted moving averages (WMA) for trail calculations to balance responsiveness and smoothness.
Volume profile calculation uses price level buckets. Higher levels provide finer granularity but require more computation.
Iridescent color engine uses a phase oscillator with sine wave calculations for smooth color transitions.
Box management includes automatic cleanup of expired boxes to maintain performance.
All visual elements use color gradients and transparency for smooth blending with price action.
---
Customization Examples
Intraday Scalping Setup:
Analysis Depth: 30 bars
Heat Map Lookback: 100 bars
FVG Persistence: 150 bars
PMH Window: 15 bars
Fast color shift speed: 0.5+
Macro Structure Tracking:
Analysis Depth: 100+ bars
Heat Map Lookback: 300+ bars
FVG Persistence: 500+ bars
Structure Memory: 6-8 levels
Slower color shift speed: 0.2
---
Limitations
Volume heat map calculations may be computationally intensive on lower timeframes with high lookback values.
PMH requires valid symbol names and accessible timeframes. Invalid symbols or timeframes will return no data.
FVG detection requires at least 3 bars of history. Early bars may not show FVG boxes.
Structure lines connect points but do not predict future structure. They reflect historical pivot relationships.
Color themes are aesthetic choices and do not affect calculation logic.
The indicator does not provide trading signals. All visual elements are analytical tools that require interpretation in context of market conditions.
Open Source
This indicator is open source and available for modification and distribution. The code is published with Pine Script v6 compliance. Users are free to customize parameters, modify calculations, and adapt the visual elements to their trading needs.
For questions, suggestions, or anything please talk to me in private messages or comments below!
Would love to help!
- officialjackofalltrades

Uptrick: Momentum-Volatility Composite Signal### Title: Uptrick: Momentum-Volatility Composite Signal
### Overview
The "Uptrick: Momentum-Volatility Composite Signal" is an innovative trading tool designed to offer traders a sophisticated synthesis of momentum, volatility, volume flow, and trend detection into a single comprehensive indicator. This tool stands out by providing an integrated view of market dynamics, which is critical for identifying potential trading opportunities with greater precision and confidence. Its unique approach differentiates it from traditional indicators available on the TradingView platform, making it a valuable asset for traders aiming to enhance their market analysis.
### Unique Features
This indicator integrates multiple crucial elements of market behavior:
- Momentum Analysis : Utilizes Rate of Change (ROC) metrics to assess the speed and strength of market movements.
- Volatility Tracking : Incorporates Average True Range (ATR) metrics to measure market volatility, aiding in risk assessment.
- Volume Flow Analysis : Analyzes shifts in volume to detect buying or selling pressure, adding depth to market understanding.
- Trend Detection : Uses the difference between short-term and long-term Exponential Moving Averages (EMA) to detect market trends, providing insights into potential reversals or confirmations.
Customization and Inputs
The Uptrick indicator offers a variety of user-defined settings tailored to fit different trading styles and strategies, enhancing its adaptability across various market conditions:
Rate of Change Length (rocLength) : This setting defines the period over which momentum is calculated. Shorter periods may be preferred by day traders who need to respond quickly to market changes, while longer periods could be better suited for position traders looking at more extended trends.
ATR Length (atrLength) : Adjusts the timeframe for assessing volatility. A shorter ATR length can help day traders manage the quick shifts in market volatility, whereas longer lengths might be more applicable for swing or position traders who deal with longer-term market movements.
Volume Flow Length (volumeFlowLength): Determines the analysis period for volume flow to identify buying or selling pressure. Day traders might opt for shorter periods to catch rapid volume changes, while longer periods could serve swing traders to understand the accumulation or distribution phases better.
Short EMA Length (shortEmaLength): Specifies the period for the short-term EMA, crucial for trend detection. Shorter lengths can aid day traders in spotting immediate trend shifts, whereas longer lengths might help swing traders in identifying more sustainable trend changes.
Long EMA Length (longEmaLength): Sets the period for the long-term EMA, which is useful for observing longer-term market trends. This setting is particularly valuable for position traders who need to align with the broader market direction.
Composite Signal Moving Average Length (maLength): This parameter sets the smoothing period for the composite signal's moving average, helping to reduce noise in the signal output. A shorter moving average length can be beneficial for day traders reacting to market conditions swiftly, while a longer length might help swing and position traders in smoothing out less significant fluctuations to focus on significant trends.
These customization options ensure that traders can fine-tune the Uptrick indicator to their specific trading needs, whether they are scanning for quick opportunities or analyzing more prolonged market trends.
### Functionality Details
The indicator operates through a sophisticated algorithm that integrates multiple market dimensions:
1. Momentum and Volatility Calculation : Combines ROC and ATR to gauge the market’s momentum and stability.
2. Volume and Trend Analysis : Integrates volume data with EMAs to provide a comprehensive view of current market trends and potential shifts.
3. Signal Composite : Each component is normalized and combined into a composite signal, offering traders a nuanced perspective on when to enter or exit trades.
The indicator performs its calculations as follows:
Momentum and Volatility Calculation:
roc = ta.roc(close, rocLength)
atr = ta.atr(atrLength)
Volume and Trend Analysis:
volumeFlow = ta.cum(volume) - ta.ema(ta.cum(volume), volumeFlowLength)
emaShort = ta.ema(close, shortEmaLength)
emaLong = ta.ema(close, longEmaLength)
emaDifference = emaShort - emaLong
Composite Signal Calculation:
Normalizes each component (ROC, ATR, volume flow, EMA difference) and combines them into a composite signal:
rocNorm = (roc - ta.sma(roc, rocLength)) / ta.stdev(roc, rocLength)
atrNorm = (atr - ta.sma(atr, atrLength)) / ta.stdev(atr, atrLength)
volumeFlowNorm = (volumeFlow - ta.sma(volumeFlow, volumeFlowLength)) / ta.stdev(volumeFlow, volumeFlowLength)
emaDiffNorm = (emaDifference - ta.sma(emaDifference, longEmaLength)) / ta.stdev(emaDifference, longEmaLength)
compositeSignal = (rocNorm + atrNorm + volumeFlowNorm + emaDiffNorm) / 4
### Originality
The originality of the Uptrick indicator lies in its ability to merge diverse market metrics into a unified signal. This multi-faceted approach goes beyond traditional indicators by offering a deeper, more holistic analysis of market conditions, providing traders with insights that are not only based on price movements but also on underlying market dynamics.
### Practical Application
The Uptrick indicator excels in environments where understanding the interplay between volume, momentum, and volatility is crucial. It is especially useful for:
- Day Traders : Can leverage real-time data to make quick decisions based on sudden market changes.
- Swing Traders : Benefit from understanding medium-term trends to optimize entry and exit points.
- Position Traders : Utilize long-term market trend data to align with overall market movements.
### Best Practices
To maximize the effectiveness of the Uptrick indicator, consider the following:
- Combine with Other Indicators : Use alongside other technical tools like RSI or MACD for additional validation.
- Adapt Settings to Market Conditions : Adjust the indicator settings based on the asset and market volatility to improve signal accuracy.
- Risk Management : Implement robust risk management strategies, including setting stop-loss orders based on the volatility measured by the ATR.
### Practical Examples and Demonstrations
- Example for Day Trading : In a volatile market, a trader notices a sharp increase in the momentum score coinciding with a surge in volume but stable volatility, signaling a potential bullish breakout.
- Example for Swing Trading : On a 4-hour chart, the indicator shows a gradual alignment of decreasing volatility and increasing buying volume, suggesting a strengthening upward trend suitable for a long position.
### Alerts and Their Uses
- Alert Configurations : Set alerts for when the composite score crosses predefined thresholds to capture potential buy or sell events.
- Strategic Application : Use alerts to stay informed of significant market moves without the need to continuously monitor the markets, enabling timely and informed trading decisions.
Technical Notes
Efficiency and Compatibility: The indicator is designed for efficiency, running smoothly across different trading platforms including TradingView, and can be easily integrated with existing trading setups. It leverages advanced mathematical models for normalizing and smoothing data, ensuring consistent and reliable signal quality across different market conditions.
Limitations : The effectiveness of the Uptrick indicator can vary significantly across different market conditions and asset classes. It is designed to perform best in liquid markets where data on volume, volatility, and price trends are readily available and reliable. Traders should be aware that in low-liquidity or highly volatile markets, the signals might be less reliable and require additional confirmation.
Usage Recommendations : While the Uptrick indicator is a powerful tool, it is recommended to use it in conjunction with other analysis methods to confirm signals. Traders should also continuously monitor the performance and adjust settings as needed to align with their specific trading strategies and market conditions.
### Conclusion
The "Uptrick: Momentum-Volatility Composite Signal" is a revolutionary tool that offers traders an advanced methodology for analyzing market dynamics. By combining momentum, volatility, volume, and trend detection into a single, cohesive indicator, it provides a powerful, actionable insight into market movements, making it an indispensable tool for traders aiming to optimize their trading strategies.

TASC 2024.09 Precision Trend Analysis█ OVERVIEW
This script introduces an approach for detecting and confirming trends in price series based on digital signal processing principles, as presented by John Ehlers in the "Precision Trend Analysis" article from the September 2024 edition of TASC's Traders' Tips .
█ CONCEPTS
Traditional trend-following indicators, such as moving averages , are lowpass filters that pass low-frequency components in a series and remove high-frequency components. Because lowpass filters preserve lengthy cycles in the data while attenuating shorter cycles, such filters have unavoidable lag that impacts the timeliness of trading signals.
In his article, John Ehlers presents an alternative approach that combines two highpass filters with different lengths to remove undesired high-frequency content via cancellation . Highpass filters have nearly zero lag. As such, the resulting trend indicator from this approach is very responsive to changes in the price series, with peaks and valleys that closely align with those of the price data. The indicator signifies an uptrend when its value is positive (i.e., above the balance point) and a downtrend when it is negative.
Subsequently, John Ehlers demonstrates that one can use the trend indicator's rate of change (ROC) to determine the onset of new trend movements. The ROC is zero at peaks and valleys in the trend indicator. Therefore, when the ROC crosses above zero, it signifies the onset or continuation of an uptrend. Likewise, the ROC crossing below zero indicates the onset or continuation of a downtrend. Note, however, that because the ROC does not preserve lower-frequency information, it can produce whipsaw trading signals in sideways or continuously trending price series.
This script implements both the trend indicator and its ROC along with the following on-chart signals:
• Green and red arrows that indicate the possible onset or continuation of an uptrend and downtrend, respectively
• Bar and plot colors that signify the sign (direction) of the trend indicator
█ CALCULATIONS
The math behind the trend indicator comes from digital filter design principles. The first step applies a digital highpass filter that attenuates long cycles with periods above the user-specified critical period. The default value is 250 bars, representing roughly one year for instruments such as stocks on the daily timeframe. The next step applies a highpass filter with a shorter period (40 bars by default). The difference between these filters determines the trend indicator, which preserves cyclic components between 40 and 250 bars by default while attenuating and eliminating others. The ROC represents the scaled one-bar difference in the trend indicator.

US Futures Momentum OverviewThe "US Futures Momentum Overview" indicator is designed to provide a comprehensive view of momentum across various U.S. futures markets. It calculates the Rate of Change (ROC) for multiple futures contracts and displays them as lines on a chart. Each futures market is plotted with a unique color for easy differentiation, allowing traders to quickly assess the momentum in different markets.
Features:
ROC Calculation: Measures the percentage change in price over a specified period, indicating the rate of change in momentum.
Futures Markets Covered: Includes major U.S. indices, commodities, and agricultural products.
How to Use:
Momentum Analysis: Observe the ROC lines for each futures market. A positive ROC indicates increasing momentum, while a negative ROC suggests decreasing momentum.
Trend Identification: Use the ROC values to identify strong trends in different markets. Markets with higher positive ROC values show stronger upward momentum.
Comparison: Compare momentum across various futures markets to identify which ones are showing stronger trends and might offer better trading opportunities.

MomentumIndicatorsLibrary "MomentumIndicators"
This is a library of 'Momentum Indicators', also denominated as oscillators.
The purpose of this library is to organize momentum indicators in just one place, making it easy to access.
In addition, it aims to allow customized versions, not being restricted to just the price value.
An example of this use case is the popular Stochastic RSI.
# Indicators:
1. Relative Strength Index (RSI):
Measures the relative strength of recent price gains to recent price losses of an asset.
2. Rate of Change (ROC):
Measures the percentage change in price of an asset over a specified time period.
3. Stochastic Oscillator (Stoch):
Compares the current price of an asset to its price range over a specified time period.
4. True Strength Index (TSI):
Measures the price change, calculating the ratio of the price change (positive or negative) in relation to the
absolute price change.
The values of both are smoothed twice to reduce noise, and the final result is normalized
in a range between 100 and -100.
5. Stochastic Momentum Index (SMI):
Combination of the True Strength Index with a signal line to help identify turning points in the market.
6. Williams Percent Range (Williams %R):
Compares the current price of an asset to its highest high and lowest low over a specified time period.
7. Commodity Channel Index (CCI):
Measures the relationship between an asset's current price and its moving average.
8. Ultimate Oscillator (UO):
Combines three different time periods to help identify possible reversal points.
9. Moving Average Convergence/Divergence (MACD):
Shows the difference between short-term and long-term exponential moving averages.
10. Fisher Transform (FT):
Normalize prices into a Gaussian normal distribution.
11. Inverse Fisher Transform (IFT):
Transform the values of the Fisher Transform into a smaller and more easily interpretable scale is through the
application of an inverse transformation to the hyperbolic tangent function.
This transformation takes the values of the FT, which range from -infinity to +infinity, to a scale limited
between -1 and +1, allowing them to be more easily visualized and compared.
12. Premier Stochastic Oscillator (PSO):
Normalizes the standard stochastic oscillator by applying a five-period double exponential smoothing average of
the %K value, resulting in a symmetric scale of 1 to -1
# Indicators of indicators:
## Stochastic:
1. Stochastic of RSI (Relative Strengh Index)
2. Stochastic of ROC (Rate of Change)
3. Stochastic of UO (Ultimate Oscillator)
4. Stochastic of TSI (True Strengh Index)
5. Stochastic of Williams R%
6. Stochastic of CCI (Commodity Channel Index).
7. Stochastic of MACD (Moving Average Convergence/Divergence)
8. Stochastic of FT (Fisher Transform)
9. Stochastic of Volume
10. Stochastic of MFI (Money Flow Index)
11. Stochastic of On OBV (Balance Volume)
12. Stochastic of PVI (Positive Volume Index)
13. Stochastic of NVI (Negative Volume Index)
14. Stochastic of PVT (Price-Volume Trend)
15. Stochastic of VO (Volume Oscillator)
16. Stochastic of VROC (Volume Rate of Change)
## Inverse Fisher Transform:
1.Inverse Fisher Transform on RSI (Relative Strengh Index)
2.Inverse Fisher Transform on ROC (Rate of Change)
3.Inverse Fisher Transform on UO (Ultimate Oscillator)
4.Inverse Fisher Transform on Stochastic
5.Inverse Fisher Transform on TSI (True Strength Index)
6.Inverse Fisher Transform on CCI (Commodity Channel Index)
7.Inverse Fisher Transform on Fisher Transform (FT)
8.Inverse Fisher Transform on MACD (Moving Average Convergence/Divergence)
9.Inverse Fisher Transfor on Williams R% (Williams Percent Range)
10.Inverse Fisher Transfor on CMF (Chaikin Money Flow)
11.Inverse Fisher Transform on VO (Volume Oscillator)
12.Inverse Fisher Transform on VROC (Volume Rate of Change)
## Stochastic Momentum Index:
1.Stochastic Momentum Index of RSI (Relative Strength Index)
2.Stochastic Momentum Index of ROC (Rate of Change)
3.Stochastic Momentum Index of VROC (Volume Rate of Change)
4.Stochastic Momentum Index of Williams R% (Williams Percent Range)
5.Stochastic Momentum Index of FT (Fisher Transform)
6.Stochastic Momentum Index of CCI (Commodity Channel Index)
7.Stochastic Momentum Index of UO (Ultimate Oscillator)
8.Stochastic Momentum Index of MACD (Moving Average Convergence/Divergence)
9.Stochastic Momentum Index of Volume
10.Stochastic Momentum Index of MFI (Money Flow Index)
11.Stochastic Momentum Index of CMF (Chaikin Money Flow)
12.Stochastic Momentum Index of On Balance Volume (OBV)
13.Stochastic Momentum Index of Price-Volume Trend (PVT)
14.Stochastic Momentum Index of Volume Oscillator (VO)
15.Stochastic Momentum Index of Positive Volume Index (PVI)
16.Stochastic Momentum Index of Negative Volume Index (NVI)
## Relative Strength Index:
1. RSI for Volume
2. RSI for Moving Average
rsi(source, length)
RSI (Relative Strengh Index). Measures the relative strength of recent price gains to recent price losses of an asset.
Parameters:
source : (float) Source of series (close, high, low, etc.)
length : (int) Period of loopback
Returns: (float) Series of RSI
roc(source, length)
ROC (Rate of Change). Measures the percentage change in price of an asset over a specified time period.
Parameters:
source : (float) Source of series (close, high, low, etc.)
length : (int) Period of loopback
Returns: (float) Series of ROC
stoch(kLength, kSmoothing, dSmoothing, maTypeK, maTypeD, almaOffsetKD, almaSigmaKD, lsmaOffSetKD)
Stochastic Oscillator. Compares the current price of an asset to its price range over a specified time period.
Parameters:
kLength
kSmoothing : (int) Period for smoothig stochastic
dSmoothing : (int) Period for signal (moving average of stochastic)
maTypeK : (int) Type of Moving Average for Stochastic Oscillator
maTypeD : (int) Type of Moving Average for Stochastic Oscillator Signal
almaOffsetKD : (float) Offset for Arnaud Legoux Moving Average for Oscillator and Signal
almaSigmaKD : (float) Sigma for Arnaud Legoux Moving Average for Oscillator and Signal
lsmaOffSetKD : (int) Offset for Least Squares Moving Average for Oscillator and Signal
Returns: A tuple of Stochastic Oscillator and Moving Average of Stochastic Oscillator
stoch(source, kLength, kSmoothing, dSmoothing, maTypeK, maTypeD, almaOffsetKD, almaSigmaKD, lsmaOffSetKD)
Stochastic Oscillator. Customized source. Compares the current price of an asset to its price range over a specified time period.
Parameters:
source : (float) Source of series (close, high, low, etc.)
kLength : (int) Period of loopback to calculate the stochastic
kSmoothing : (int) Period for smoothig stochastic
dSmoothing : (int) Period for signal (moving average of stochastic)
maTypeK : (int) Type of Moving Average for Stochastic Oscillator
maTypeD : (int) Type of Moving Average for Stochastic Oscillator Signal
almaOffsetKD : (float) Offset for Arnaud Legoux Moving Average for Stoch and Signal
almaSigmaKD : (float) Sigma for Arnaud Legoux Moving Average for Stoch and Signal
lsmaOffSetKD : (int) Offset for Least Squares Moving Average for Stoch and Signal
Returns: A tuple of Stochastic Oscillator and Moving Average of Stochastic Oscillator
tsi(source, shortLength, longLength, maType, almaOffset, almaSigma, lsmaOffSet)
TSI (True Strengh Index). Measures the price change, calculating the ratio of the price change (positive or negative) in relation to the absolute price change.
The values of both are smoothed twice to reduce noise, and the final result is normalized in a range between 100 and -100.
Parameters:
source : (float) Source of series (close, high, low, etc.)
shortLength : (int) Short length
longLength : (int) Long length
maType : (int) Type of Moving Average for TSI
almaOffset : (float) Offset for Arnaud Legoux Moving Average
almaSigma : (float) Sigma for Arnaud Legoux Moving Average
lsmaOffSet : (int) Offset for Least Squares Moving Average
Returns: (float) TSI
smi(sourceTSI, shortLengthTSI, longLengthTSI, maTypeTSI, almaOffsetTSI, almaSigmaTSI, lsmaOffSetTSI, maTypeSignal, smoothingLengthSignal, almaOffsetSignal, almaSigmaSignal, lsmaOffSetSignal)
SMI (Stochastic Momentum Index). A TSI (True Strengh Index) plus a signal line.
Parameters:
sourceTSI : (float) Source of series for TSI (close, high, low, etc.)
shortLengthTSI : (int) Short length for TSI
longLengthTSI : (int) Long length for TSI
maTypeTSI : (int) Type of Moving Average for Signal of TSI
almaOffsetTSI : (float) Offset for Arnaud Legoux Moving Average
almaSigmaTSI : (float) Sigma for Arnaud Legoux Moving Average
lsmaOffSetTSI : (int) Offset for Least Squares Moving Average
maTypeSignal
smoothingLengthSignal
almaOffsetSignal
almaSigmaSignal
lsmaOffSetSignal
Returns: A tuple with TSI, signal of TSI and histogram of difference
wpr(source, length)
Williams R% (Williams Percent Range). Compares the current price of an asset to its highest high and lowest low over a specified time period.
Parameters:
source : (float) Source of series (close, high, low, etc.)
length : (int) Period of loopback
Returns: (float) Series of Williams R%
cci(source, length, maType, almaOffset, almaSigma, lsmaOffSet)
CCI (Commodity Channel Index). Measures the relationship between an asset's current price and its moving average.
Parameters:
source : (float) Source of series (close, high, low, etc.)
length : (int) Period of loopback
maType : (int) Type of Moving Average
almaOffset : (float) Offset for Arnaud Legoux Moving Average
almaSigma : (float) Sigma for Arnaud Legoux Moving Average
lsmaOffSet : (int) Offset for Least Squares Moving Average
Returns: (float) Series of CCI
ultimateOscillator(fastLength, middleLength, slowLength)
UO (Ultimate Oscilator). Combines three different time periods to help identify possible reversal points.
Parameters:
fastLength : (int) Fast period of loopback
middleLength : (int) Middle period of loopback
slowLength : (int) Slow period of loopback
Returns: (float) Series of Ultimate Oscilator
ultimateOscillator(source, fastLength, middleLength, slowLength)
UO (Ultimate Oscilator). Customized source. Combines three different time periods to help identify possible reversal points.
Parameters:
source : (float) Source of series (close, high, low, etc.)
fastLength : (int) Fast period of loopback
middleLength : (int) Middle period of loopback
slowLength : (int) Slow period of loopback
Returns: (float) Series of Ultimate Oscilator
macd(source, fastLength, slowLength, signalLength, maTypeFast, maTypeSlow, maTypeMACD, almaOffset, almaSigma, lsmaOffSet)
MACD (Moving Average Convergence/Divergence). Shows the difference between short-term and long-term exponential moving averages.
Parameters:
source : (float) Source of series (close, high, low, etc.)
fastLength : (int) Period for fast moving average
slowLength : (int) Period for slow moving average
signalLength : (int) Signal length
maTypeFast : (int) Type of fast moving average
maTypeSlow : (int) Type of slow moving average
maTypeMACD : (int) Type of MACD moving average
almaOffset : (float) Offset for Arnaud Legoux Moving Average
almaSigma : (float) Sigma for Arnaud Legoux Moving Average
lsmaOffSet : (int) Offset for Least Squares Moving Average
Returns: A tuple with MACD, Signal, and Histgram
fisher(length)
Fisher Transform. Normalize prices into a Gaussian normal distribution.
Parameters:
length
Returns: A tuple with Fisher Transform and signal
fisher(source, length)
Fisher Transform. Customized source. Normalize prices into a Gaussian normal distribution.
Parameters:
source : (float) Source of series (close, high, low, etc.)
length
Returns: A tuple with Fisher Transform and signal
inverseFisher(source, length, subtrahend, denominator)
Inverse Fisher Transform.
Transform the values of the Fisher Transform into a smaller and more easily interpretable scale is
through the application of an inverse transformation to the hyperbolic tangent function.
This transformation takes the values of the FT, which range from -infinity to +infinity,
to a scale limited between -1 and +1, allowing them to be more easily visualized and compared.
Parameters:
source : (float) Source of series (close, high, low, etc.)
length : (int) Period for loopback
subtrahend : (int) Denominator. Useful in unbounded indicators. For example, in CCI.
denominator
Returns: (float) Series of Inverse Fisher Transform
premierStoch(length, smoothlen)
Premier Stochastic Oscillator (PSO).
Normalizes the standard stochastic oscillator by applying a five-period double exponential smoothing
average of the %K value, resulting in a symmetric scale of 1 to -1.
Parameters:
length : (int) Period for loopback
smoothlen : (int) Period for smoothing
Returns: (float) Series of PSO
premierStoch(source, smoothlen, subtrahend, denominator)
Premier Stochastic Oscillator (PSO) of custom source.
Normalizes the source by applying a five-period double exponential smoothing average.
Parameters:
source : (float) Source of series (close, high, low, etc.)
smoothlen : (int) Period for smoothing
subtrahend : (int) Denominator. Useful in unbounded indicators. For example, in CCI.
denominator
Returns: (float) Series of PSO
stochRsi(sourceRSI, lengthRSI, kLength, kSmoothing, dSmoothing, maTypeK, maTypeD, almaOffsetKD, almaSigmaKD, lsmaOffSetKD)
Parameters:
sourceRSI
lengthRSI
kLength
kSmoothing
dSmoothing
maTypeK
maTypeD
almaOffsetKD
almaSigmaKD
lsmaOffSetKD
stochRoc(sourceROC, lengthROC, kLength, kSmoothing, dSmoothing, maTypeK, maTypeD, almaOffsetKD, almaSigmaKD, lsmaOffSetKD)
Parameters:
sourceROC
lengthROC
kLength
kSmoothing
dSmoothing
maTypeK
maTypeD
almaOffsetKD
almaSigmaKD
lsmaOffSetKD
stochUO(fastLength, middleLength, slowLength, kLength, kSmoothing, dSmoothing, maTypeK, maTypeD, almaOffsetKD, almaSigmaKD, lsmaOffSetKD)
Parameters:
fastLength
middleLength
slowLength
kLength
kSmoothing
dSmoothing
maTypeK
maTypeD
almaOffsetKD
almaSigmaKD
lsmaOffSetKD
stochTSI(source, shortLength, longLength, maType, almaOffset, almaSigma, lsmaOffSet, kLength, kSmoothing, dSmoothing, maTypeK, maTypeD, almaOffsetKD, almaSigmaKD, lsmaOffSetKD)
Parameters:
source
shortLength
longLength
maType
almaOffset
almaSigma
lsmaOffSet
kLength
kSmoothing
dSmoothing
maTypeK
maTypeD
almaOffsetKD
almaSigmaKD
lsmaOffSetKD
stochWPR(source, length, kLength, kSmoothing, dSmoothing, maTypeK, maTypeD, almaOffsetKD, almaSigmaKD, lsmaOffSetKD)
Parameters:
source
length
kLength
kSmoothing
dSmoothing
maTypeK
maTypeD
almaOffsetKD
almaSigmaKD
lsmaOffSetKD
stochCCI(source, length, maType, almaOffset, almaSigma, lsmaOffSet, kLength, kSmoothing, dSmoothing, maTypeK, maTypeD, almaOffsetKD, almaSigmaKD, lsmaOffSetKD)
Parameters:
source
length
maType
almaOffset
almaSigma
lsmaOffSet
kLength
kSmoothing
dSmoothing
maTypeK
maTypeD
almaOffsetKD
almaSigmaKD
lsmaOffSetKD
stochMACD(source, fastLength, slowLength, signalLength, maTypeFast, maTypeSlow, maTypeMACD, almaOffset, almaSigma, lsmaOffSet, kLength, kSmoothing, dSmoothing, maTypeK, maTypeD, almaOffsetKD, almaSigmaKD, lsmaOffSetKD)
Parameters:
source
fastLength
slowLength
signalLength
maTypeFast
maTypeSlow
maTypeMACD
almaOffset
almaSigma
lsmaOffSet
kLength
kSmoothing
dSmoothing
maTypeK
maTypeD
almaOffsetKD
almaSigmaKD
lsmaOffSetKD
stochFT(length, kLength, kSmoothing, dSmoothing, maTypeK, maTypeD, almaOffsetKD, almaSigmaKD, lsmaOffSetKD)
Parameters:
length
kLength
kSmoothing
dSmoothing
maTypeK
maTypeD
almaOffsetKD
almaSigmaKD
lsmaOffSetKD
stochVolume(kLength, kSmoothing, dSmoothing, maTypeK, maTypeD, almaOffsetKD, almaSigmaKD, lsmaOffSetKD)
Parameters:
kLength
kSmoothing
dSmoothing
maTypeK
maTypeD
almaOffsetKD
almaSigmaKD
lsmaOffSetKD
stochMFI(source, length, kLength, kSmoothing, dSmoothing, maTypeK, maTypeD, almaOffsetKD, almaSigmaKD, lsmaOffSetKD)
Parameters:
source
length
kLength
kSmoothing
dSmoothing
maTypeK
maTypeD
almaOffsetKD
almaSigmaKD
lsmaOffSetKD
stochOBV(source, kLength, kSmoothing, dSmoothing, maTypeK, maTypeD, almaOffsetKD, almaSigmaKD, lsmaOffSetKD)
Parameters:
source
kLength
kSmoothing
dSmoothing
maTypeK
maTypeD
almaOffsetKD
almaSigmaKD
lsmaOffSetKD
stochPVI(source, kLength, kSmoothing, dSmoothing, maTypeK, maTypeD, almaOffsetKD, almaSigmaKD, lsmaOffSetKD)
Parameters:
source
kLength
kSmoothing
dSmoothing
maTypeK
maTypeD
almaOffsetKD
almaSigmaKD
lsmaOffSetKD
stochNVI(source, kLength, kSmoothing, dSmoothing, maTypeK, maTypeD, almaOffsetKD, almaSigmaKD, lsmaOffSetKD)
Parameters:
source
kLength
kSmoothing
dSmoothing
maTypeK
maTypeD
almaOffsetKD
almaSigmaKD
lsmaOffSetKD
stochPVT(source, kLength, kSmoothing, dSmoothing, maTypeK, maTypeD, almaOffsetKD, almaSigmaKD, lsmaOffSetKD)
Parameters:
source
kLength
kSmoothing
dSmoothing
maTypeK
maTypeD
almaOffsetKD
almaSigmaKD
lsmaOffSetKD
stochVO(shortLen, longLen, maType, almaOffset, almaSigma, lsmaOffSet, kLength, kSmoothing, dSmoothing, maTypeK, maTypeD, almaOffsetKD, almaSigmaKD, lsmaOffSetKD)
Parameters:
shortLen
longLen
maType
almaOffset
almaSigma
lsmaOffSet
kLength
kSmoothing
dSmoothing
maTypeK
maTypeD
almaOffsetKD
almaSigmaKD
lsmaOffSetKD
stochVROC(length, kLength, kSmoothing, dSmoothing, maTypeK, maTypeD, almaOffsetKD, almaSigmaKD, lsmaOffSetKD)
Parameters:
length
kLength
kSmoothing
dSmoothing
maTypeK
maTypeD
almaOffsetKD
almaSigmaKD
lsmaOffSetKD
iftRSI(sourceRSI, lengthRSI, lengthIFT)
Parameters:
sourceRSI
lengthRSI
lengthIFT
iftROC(sourceROC, lengthROC, lengthIFT)
Parameters:
sourceROC
lengthROC
lengthIFT
iftUO(fastLength, middleLength, slowLength, lengthIFT)
Parameters:
fastLength
middleLength
slowLength
lengthIFT
iftStoch(kLength, kSmoothing, dSmoothing, maTypeK, maTypeD, almaOffsetKD, almaSigmaKD, lsmaOffSetKD, lengthIFT)
Parameters:
kLength
kSmoothing
dSmoothing
maTypeK
maTypeD
almaOffsetKD
almaSigmaKD
lsmaOffSetKD
lengthIFT
iftTSI(source, shortLength, longLength, maType, almaOffset, almaSigma, lsmaOffSet, lengthIFT)
Parameters:
source
shortLength
longLength
maType
almaOffset
almaSigma
lsmaOffSet
lengthIFT
iftCCI(source, length, maType, almaOffset, almaSigma, lsmaOffSet, lengthIFT)
Parameters:
source
length
maType
almaOffset
almaSigma
lsmaOffSet
lengthIFT
iftFisher(length, lengthIFT)
Parameters:
length
lengthIFT
iftMACD(source, fastLength, slowLength, signalLength, maTypeFast, maTypeSlow, maTypeMACD, almaOffset, almaSigma, lsmaOffSet, lengthIFT)
Parameters:
source
fastLength
slowLength
signalLength
maTypeFast
maTypeSlow
maTypeMACD
almaOffset
almaSigma
lsmaOffSet
lengthIFT
iftWPR(source, length, lengthIFT)
Parameters:
source
length
lengthIFT
iftMFI(source, length, lengthIFT)
Parameters:
source
length
lengthIFT
iftCMF(length, lengthIFT)
Parameters:
length
lengthIFT
iftVO(shortLen, longLen, maType, almaOffset, almaSigma, lsmaOffSet, lengthIFT)
Parameters:
shortLen
longLen
maType
almaOffset
almaSigma
lsmaOffSet
lengthIFT
iftVROC(length, lengthIFT)
Parameters:
length
lengthIFT
smiRSI(source, length, shortLengthTSI, longLengthTSI, maTypeTSI, almaOffsetTSI, almaSigmaTSI, lsmaOffSetTSI, maTypeSignal, smoothingLengthSignal, almaOffsetSignal, almaSigmaSignal, lsmaOffSetSignal)
Parameters:
source
length
shortLengthTSI
longLengthTSI
maTypeTSI
almaOffsetTSI
almaSigmaTSI
lsmaOffSetTSI
maTypeSignal
smoothingLengthSignal
almaOffsetSignal
almaSigmaSignal
lsmaOffSetSignal
smiROC(source, length, shortLengthTSI, longLengthTSI, maTypeTSI, almaOffsetTSI, almaSigmaTSI, lsmaOffSetTSI, maTypeSignal, smoothingLengthSignal, almaOffsetSignal, almaSigmaSignal, lsmaOffSetSignal)
Parameters:
source
length
shortLengthTSI
longLengthTSI
maTypeTSI
almaOffsetTSI
almaSigmaTSI
lsmaOffSetTSI
maTypeSignal
smoothingLengthSignal
almaOffsetSignal
almaSigmaSignal
lsmaOffSetSignal
smiVROC(length, shortLengthTSI, longLengthTSI, maTypeTSI, almaOffsetTSI, almaSigmaTSI, lsmaOffSetTSI, maTypeSignal, smoothingLengthSignal, almaOffsetSignal, almaSigmaSignal, lsmaOffSetSignal)
Parameters:
length
shortLengthTSI
longLengthTSI
maTypeTSI
almaOffsetTSI
almaSigmaTSI
lsmaOffSetTSI
maTypeSignal
smoothingLengthSignal
almaOffsetSignal
almaSigmaSignal
lsmaOffSetSignal
smiWPR(source, length, shortLengthTSI, longLengthTSI, maTypeTSI, almaOffsetTSI, almaSigmaTSI, lsmaOffSetTSI, maTypeSignal, smoothingLengthSignal, almaOffsetSignal, almaSigmaSignal, lsmaOffSetSignal)
Parameters:
source
length
shortLengthTSI
longLengthTSI
maTypeTSI
almaOffsetTSI
almaSigmaTSI
lsmaOffSetTSI
maTypeSignal
smoothingLengthSignal
almaOffsetSignal
almaSigmaSignal
lsmaOffSetSignal
smiFT(length, shortLengthTSI, longLengthTSI, maTypeTSI, almaOffsetTSI, almaSigmaTSI, lsmaOffSetTSI, maTypeSignal, smoothingLengthSignal, almaOffsetSignal, almaSigmaSignal, lsmaOffSetSignal)
Parameters:
length
shortLengthTSI
longLengthTSI
maTypeTSI
almaOffsetTSI
almaSigmaTSI
lsmaOffSetTSI
maTypeSignal
smoothingLengthSignal
almaOffsetSignal
almaSigmaSignal
lsmaOffSetSignal
smiFT(source, length, shortLengthTSI, longLengthTSI, maTypeTSI, almaOffsetTSI, almaSigmaTSI, lsmaOffSetTSI, maTypeSignal, smoothingLengthSignal, almaOffsetSignal, almaSigmaSignal, lsmaOffSetSignal)
Parameters:
source
length
shortLengthTSI
longLengthTSI
maTypeTSI
almaOffsetTSI
almaSigmaTSI
lsmaOffSetTSI
maTypeSignal
smoothingLengthSignal
almaOffsetSignal
almaSigmaSignal
lsmaOffSetSignal
smiCCI(source, length, maTypeCCI, almaOffsetCCI, almaSigmaCCI, lsmaOffSetCCI, shortLengthTSI, longLengthTSI, maTypeTSI, almaOffsetTSI, almaSigmaTSI, lsmaOffSetTSI, maTypeSignal, smoothingLengthSignal, almaOffsetSignal, almaSigmaSignal, lsmaOffSetSignal)
Parameters:
source
length
maTypeCCI
almaOffsetCCI
almaSigmaCCI
lsmaOffSetCCI
shortLengthTSI
longLengthTSI
maTypeTSI
almaOffsetTSI
almaSigmaTSI
lsmaOffSetTSI
maTypeSignal
smoothingLengthSignal
almaOffsetSignal
almaSigmaSignal
lsmaOffSetSignal
smiUO(fastLength, middleLength, slowLength, shortLengthTSI, longLengthTSI, maTypeTSI, almaOffsetTSI, almaSigmaTSI, lsmaOffSetTSI, maTypeSignal, smoothingLengthSignal, almaOffsetSignal, almaSigmaSignal, lsmaOffSetSignal)
Parameters:
fastLength
middleLength
slowLength
shortLengthTSI
longLengthTSI
maTypeTSI
almaOffsetTSI
almaSigmaTSI
lsmaOffSetTSI
maTypeSignal
smoothingLengthSignal
almaOffsetSignal
almaSigmaSignal
lsmaOffSetSignal
smiMACD(source, fastLength, slowLength, signalLength, maTypeFast, maTypeSlow, maTypeMACD, almaOffset, almaSigma, lsmaOffSet, shortLengthTSI, longLengthTSI, maTypeTSI, almaOffsetTSI, almaSigmaTSI, lsmaOffSetTSI, maTypeSignal, smoothingLengthSignal, almaOffsetSignal, almaSigmaSignal, lsmaOffSetSignal)
Parameters:
source
fastLength
slowLength
signalLength
maTypeFast
maTypeSlow
maTypeMACD
almaOffset
almaSigma
lsmaOffSet
shortLengthTSI
longLengthTSI
maTypeTSI
almaOffsetTSI
almaSigmaTSI
lsmaOffSetTSI
maTypeSignal
smoothingLengthSignal
almaOffsetSignal
almaSigmaSignal
lsmaOffSetSignal
smiVol(shortLengthTSI, longLengthTSI, maTypeTSI, almaOffsetTSI, almaSigmaTSI, lsmaOffSetTSI, maTypeSignal, smoothingLengthSignal, almaOffsetSignal, almaSigmaSignal, lsmaOffSetSignal)
Parameters:
shortLengthTSI
longLengthTSI
maTypeTSI
almaOffsetTSI
almaSigmaTSI
lsmaOffSetTSI
maTypeSignal
smoothingLengthSignal
almaOffsetSignal
almaSigmaSignal
lsmaOffSetSignal
smiMFI(source, length, shortLengthTSI, longLengthTSI, maTypeTSI, almaOffsetTSI, almaSigmaTSI, lsmaOffSetTSI, maTypeSignal, smoothingLengthSignal, almaOffsetSignal, almaSigmaSignal, lsmaOffSetSignal)
Parameters:
source
length
shortLengthTSI
longLengthTSI
maTypeTSI
almaOffsetTSI
almaSigmaTSI
lsmaOffSetTSI
maTypeSignal
smoothingLengthSignal
almaOffsetSignal
almaSigmaSignal
lsmaOffSetSignal
smiCMF(length, shortLengthTSI, longLengthTSI, maTypeTSI, almaOffsetTSI, almaSigmaTSI, lsmaOffSetTSI, maTypeSignal, smoothingLengthSignal, almaOffsetSignal, almaSigmaSignal, lsmaOffSetSignal)
Parameters:
length
shortLengthTSI
longLengthTSI
maTypeTSI
almaOffsetTSI
almaSigmaTSI
lsmaOffSetTSI
maTypeSignal
smoothingLengthSignal
almaOffsetSignal
almaSigmaSignal
lsmaOffSetSignal
smiOBV(source, shortLengthTSI, longLengthTSI, maTypeTSI, almaOffsetTSI, almaSigmaTSI, lsmaOffSetTSI, maTypeSignal, smoothingLengthSignal, almaOffsetSignal, almaSigmaSignal, lsmaOffSetSignal)
Parameters:
source
shortLengthTSI
longLengthTSI
maTypeTSI
almaOffsetTSI
almaSigmaTSI
lsmaOffSetTSI
maTypeSignal
smoothingLengthSignal
almaOffsetSignal
almaSigmaSignal
lsmaOffSetSignal
smiPVT(source, shortLengthTSI, longLengthTSI, maTypeTSI, almaOffsetTSI, almaSigmaTSI, lsmaOffSetTSI, maTypeSignal, smoothingLengthSignal, almaOffsetSignal, almaSigmaSignal, lsmaOffSetSignal)
Parameters:
source
shortLengthTSI
longLengthTSI
maTypeTSI
almaOffsetTSI
almaSigmaTSI
lsmaOffSetTSI
maTypeSignal
smoothingLengthSignal
almaOffsetSignal
almaSigmaSignal
lsmaOffSetSignal
smiVO(shortLen, longLen, maType, almaOffset, almaSigma, lsmaOffSet, shortLengthTSI, longLengthTSI, maTypeTSI, almaOffsetTSI, almaSigmaTSI, lsmaOffSetTSI, maTypeSignal, smoothingLengthSignal, almaOffsetSignal, almaSigmaSignal, lsmaOffSetSignal)
Parameters:
shortLen
longLen
maType
almaOffset
almaSigma
lsmaOffSet
shortLengthTSI
longLengthTSI
maTypeTSI
almaOffsetTSI
almaSigmaTSI
lsmaOffSetTSI
maTypeSignal
smoothingLengthSignal
almaOffsetSignal
almaSigmaSignal
lsmaOffSetSignal
smiPVI(source, shortLengthTSI, longLengthTSI, maTypeTSI, almaOffsetTSI, almaSigmaTSI, lsmaOffSetTSI, maTypeSignal, smoothingLengthSignal, almaOffsetSignal, almaSigmaSignal, lsmaOffSetSignal)
Parameters:
source
shortLengthTSI
longLengthTSI
maTypeTSI
almaOffsetTSI
almaSigmaTSI
lsmaOffSetTSI
maTypeSignal
smoothingLengthSignal
almaOffsetSignal
almaSigmaSignal
lsmaOffSetSignal
smiNVI(source, shortLengthTSI, longLengthTSI, maTypeTSI, almaOffsetTSI, almaSigmaTSI, lsmaOffSetTSI, maTypeSignal, smoothingLengthSignal, almaOffsetSignal, almaSigmaSignal, lsmaOffSetSignal)
Parameters:
source
shortLengthTSI
longLengthTSI
maTypeTSI
almaOffsetTSI
almaSigmaTSI
lsmaOffSetTSI
maTypeSignal
smoothingLengthSignal
almaOffsetSignal
almaSigmaSignal
lsmaOffSetSignal
rsiVolume(length)
Parameters:
length
rsiMA(sourceMA, lengthMA, maType, almaOffset, almaSigma, lsmaOffSet, lengthRSI)
Parameters:
sourceMA
lengthMA
maType
almaOffset
almaSigma
lsmaOffSet
lengthRSI
