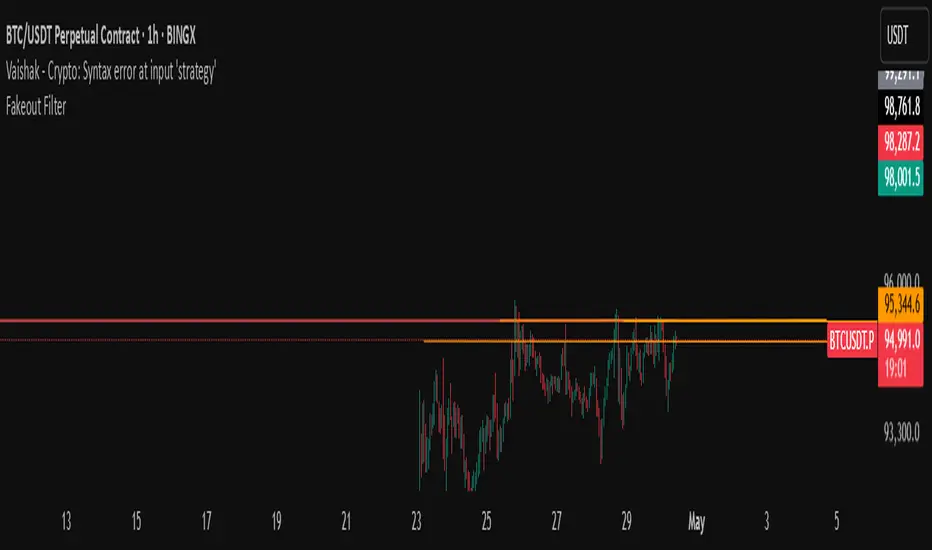
Trend Reversal Engine (CHoCH + EMA + RSI)This professional-grade indicator is not just a collection of signals; it is a complete algorithmic trading system designed to solve the most common problem in retail trading: The Fake-Out.
By combining Institutional Market Structure (SMC) with High-Frequency Momentum Filters, the Pine Reversal Engine V6 provides a high-conviction "Confluence Engine" that filters out noise and identifies high-probability turning points.
The Three Pillars of Execution
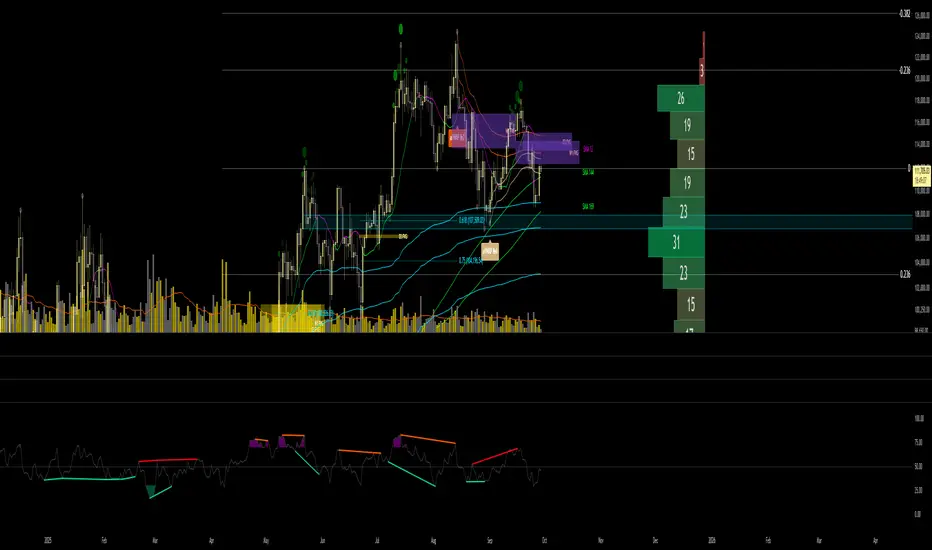
1. The Institutional Foundation: Market Structure (CHoCH + HL)
Most traders lose money because they trade against the trend. This engine identifies the Change of Character (CHoCH)—the exact moment a downtrend breaks and the first institutional "buy-side" liquidity is injected. It doesn't stop there; it requires a Higher Low (HL) confirmation, ensuring you aren't catching a falling knife, but riding a confirmed structural shift.
2. The Momentum Shield: Dual EMA & RSI Engine
We use a 9-period and 21-period EMA combo as a dynamic filter. The system only permits "Long Entry" labels when the 9 EMA is trending above the 21, acting as a trend-strength validator. Furthermore, it integrates a Bullish RSI Divergence engine. This is the "secret sauce"—it detects when price makes a lower low while momentum (RSI) makes a higher low, signaling that sellers are exhausted and a massive reversal is imminent.
3. The Precision Trigger: Confluence Confirmation
A signal is only generated when all "stars align." This includes:
Historical Support Validation: Price must be sitting on a major pivot zone.
The Retest Logic: High-probability entries occur when price "kisses" the 9 EMA from above during a bullish trend.
Candlestick Psychology: The final "Go" signal requires a Bullish Engulfing or Pin-bar pattern, proving that buyers have physically seized control of the price action at that specific second.
Why Professionals Choose This Engine
Zero-Guesswork Dashboard: A real-time overlay table that summarizes Trend, Structure, and Divergence. You see exactly why a trade is valid at a single glance.
Pine V6 Architecture: Built on the bleeding edge of TradingView’s newest language version. It is faster, more efficient, and future-proof.
Visual Clarity: Beautifully rendered labels and background highlights (EMA Retest zones) turn your chart into a professional workstation, reducing cognitive load and trading fatigue.
Risk-Focused: By requiring price to be at historical support levels, it naturally forces you into trades with tight stop-loss potential and massive Reward-to-Risk ratios.
Stop trading lagging indicators. Start trading the confluence of Structure, Momentum, and Price Action
Pine Script® インジケーター