RSI Strategy The RSI is a very popular indicator that follows price activity.
It calculates an average of the positive net changes, and an average
of the negative net changes in the most recent bars, and it determines
the ratio between these averages. The result is expressed as a number
between 0 and 100. Commonly it is said that if the RSI has a low value,
for example 30 or under, the symbol is oversold. And if the RSI has a
high value, 70 for example, the symbol is overbought.
"rsi"に関するスクリプトを検索

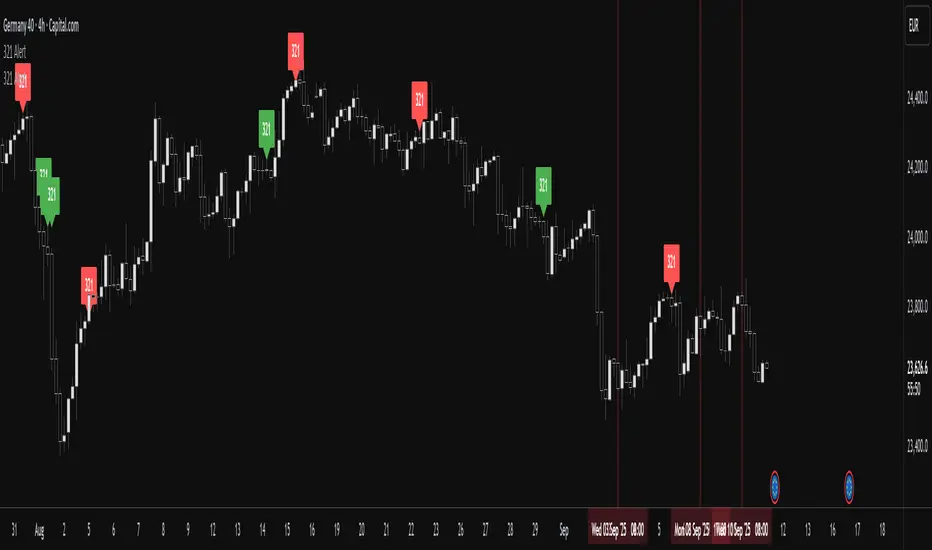
RSI < 25 + Price Below 200 SMA (4H) - Text Signal
Price below 200MA on 4hr chart
RSI is below 25 ovsersold
Start buying small positions at every signal
Eventually price will capture the 200MA on 4hr
This will work great for NVDA, AAPL, MSFT, NFLX, PANW, AMZN, PLTR, CRWD and META.
Good for swing trading based on price action, RSI oversold and reversal
Add more on the Pin bar candles on 4hr time frame once the price is oversold.

Indicador de divergencias RSI (confirmación EMA12)RSI divergence indicator on the 5-period timescale for BTC. It includes a filter for the first RSI peak in extreme zones (overbought for long positions, overbought for short positions). It also features optional confirmation of a 12-period EMA breakout after the divergence.

SEE + RSI Signal with Dual Invalidationrsi mcd and see close signal. when a candle closes below rsi, see and macd the script prints a tiny circle

RSI UpDown [DivineTrade]This indicator displays the RSI values across multiple timeframes in real time. It provides a compact panel showing RSI readings for 1W, 1D, 4H, 1H, 15M, 5M and 1M, updating continuously as new price data arrives. Each value is color-coded based on market conditions: strong overbought levels, moderate overbought zones, neutral ranges and oversold areas. This allows traders to quickly assess multi-timeframe momentum and identify alignment or divergence across different market horizons.


RSI + ADX + ATR Strength GaugeThis indicator combines Relative Strength Index (RSI), Average Directional Index (ADX), and Average True Range (ATR) into a unified strength gauge that identifies high-quality trending conditions while filtering out choppy, low-volatility markets.
RSI measures momentum and overbought/oversold conditions.
ADX confirms trend strength (not direction), highlighting when price movement has strong follow-through.
ATR captures volatility expansion, filtering out flat, low-range candles where fake signals occur.
When the components diverge or show contraction, the gauge warns of market chop, suggesting it’s better to avoid entries or reduce position size.
Purpose:
To keep you out of sideways markets and confirm entries only when momentum, trend strength, and volatility all agree — reducing whipsaws and improving trade quality.
Tweak to your liking.

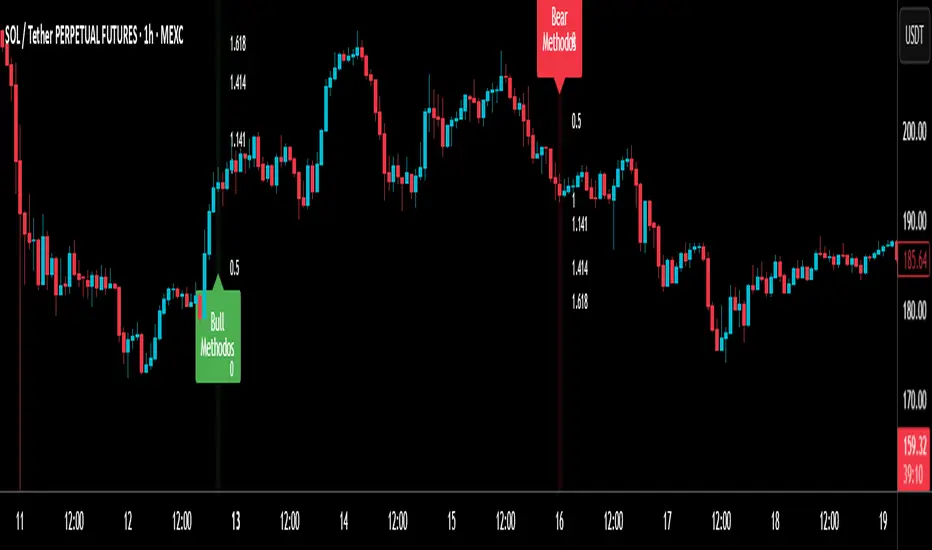
RSI MethodosThe RSI Methodos is a simple RSI-based indicator that generates rare but strong signals: Bull Methodos for bullish opportunities and Bear Methodos for bearish ones. It displays labels, background highlights, and alerts for easy use, plus optional Fibonacci labels for key levels. Ideal for swing trading in trending markets!
RSI Buy/Sell Signals (Small Stars)Here's a modular Pine Script that generates a Buy signal when both daily and weekly RSI exceed 70, and a Sell signal only when weekly RSI drops below 70

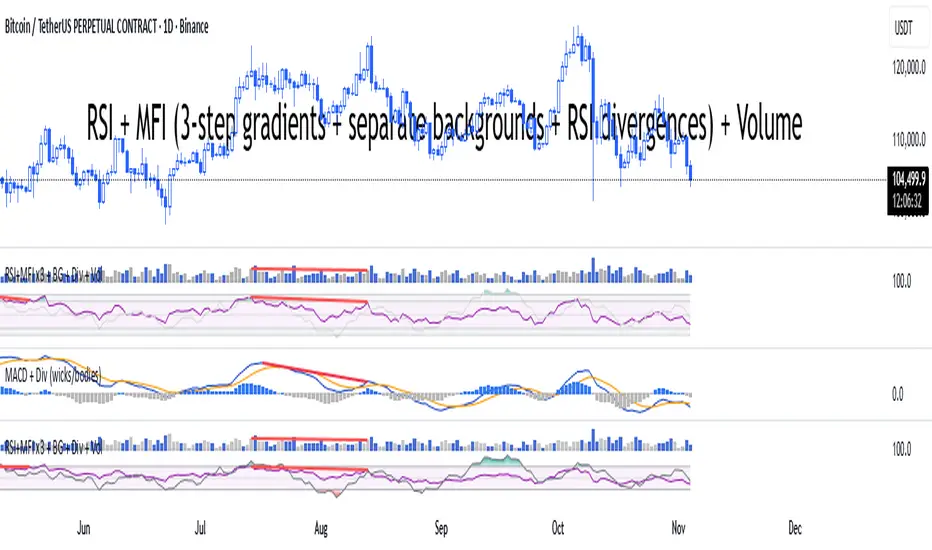
RSI + MFI + VolumeIndicator shows RSI + MFI + Volume in one panel, marks divergences separate for wicks and bodies, green dots shows where MFI and RSI are oversold
RSI to Price Projection PanelThis indicator calculates the current RSI based on the closing price and projects estimated prices for user-defined RSI target levels. Results are displayed in a table at the top-right corner of the chart.

RSI DivergenceStrat WCredit to faytterro. Buy when RSI is staying flat or going up while the ticker price is going down. Sell when RSI is staying flat or going down while the ticker price is going up.
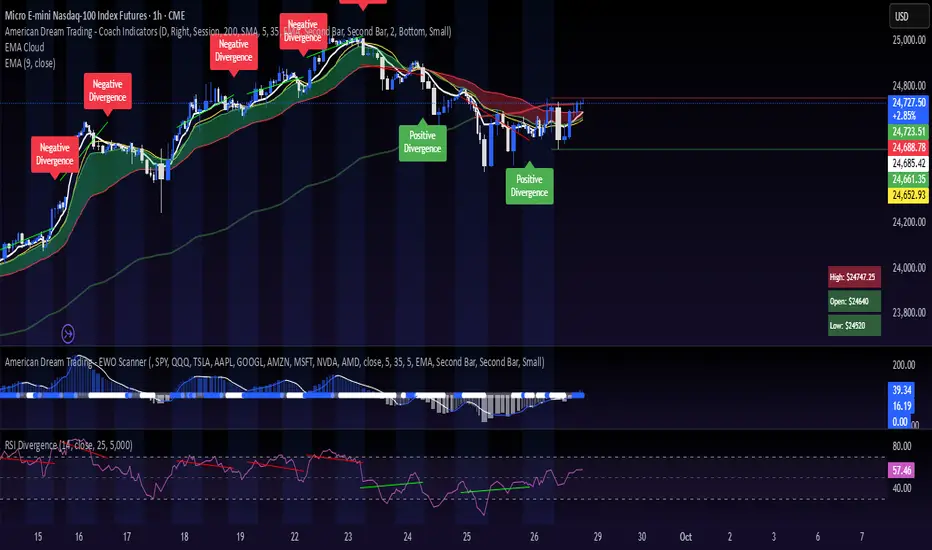
RSI extremes + Nasdaq 100 +Crossover of moving averages
In this indicator, we integrate four main features.
1. Oversold and overbought price signals, based on the 1-minute RSI extremes, marked on the chart with a yellow triangle.
2. Combination of oversold and overbought signals in the stock price and its index (only applicable to Nasdaq 100 symbols). Marked on the chart with a green triangle for oversold and a red triangle for overbought.
3. Use of four moving averages for early trend detection: EMA 10, 20, and 45 - SMA 200.
4. Crossover of moving averages in order 10, 20, and 45. On the upside, a green cross appears; on the downside, an orange cross appears.
Combine this indicator with "RSI (1 and 5m) + divergences and rsiNDX 1m " to check the signals and you will have a scalping strategy for reversals and trend following in NASDAQ 100 stocks.

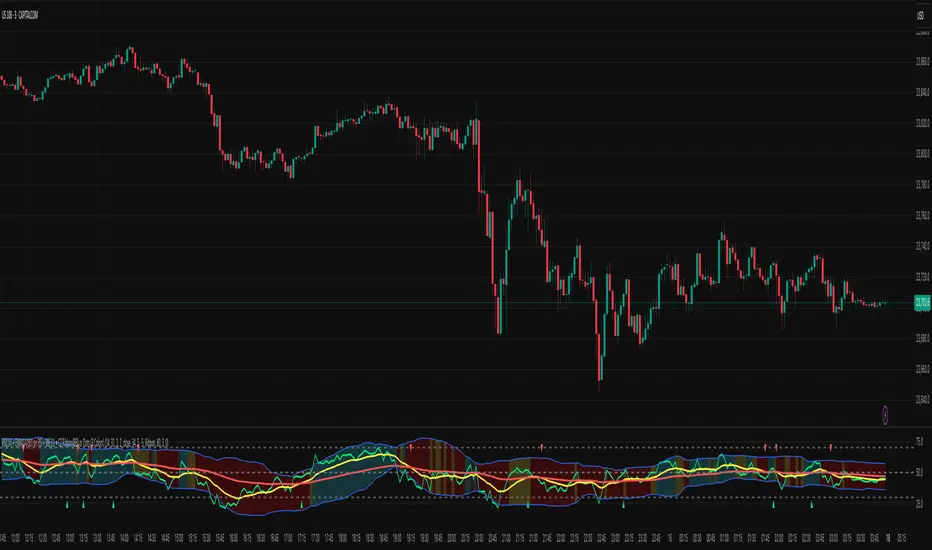
RSI/Stochastic with overlays a moving average + Bollinger BandsCompact oscillator panel that lets you switch the base between RSI and Stochastic %K, then overlays a moving average + Bollinger Bands on the oscillator values (not on price) to read momentum strength and squeeze/expansion.
What’s added
Selectable base: RSI ↔ Stochastic %K (plots %D when Stoch is chosen).
MA + BB on oscillator to gauge momentum trend (MA) and volatility (bands).
Adjustable bands 70/50/30 with optional fill, plus optional regular divergence and alerts.
How to read
Bull bias: %K above osc-MA and pushing/closing near Upper BB; confirm with %K > %D.
Bear bias: %K below osc-MA and near Lower BB; confirm with %K < %D.
Squeeze: BB on oscillator tightens → expect momentum breakout.
Overextension: repeated touches of Upper/Lower BB in 70/30 zones → strong trend; watch for %K–%D recross.
Quick settings (start here)
Stoch: 14 / 3 / 3; Bands: 70/50/30.
Osc-MA: EMA 14.
BB on oscillator: StdDev 2.0 (tune 1.5–2.5).
Note
Analysis tool, not financial advice. Backtest across timeframes and use risk management.

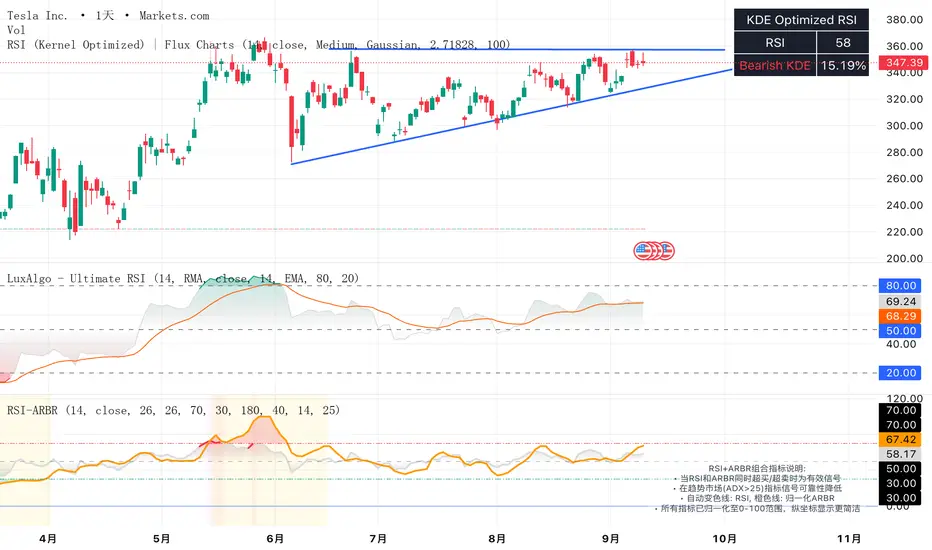
RSI + ARBR 组合指标The RSI + ARBR indicator mainly harmonizes the values of the two indicators, enabling investors to exit at market tops or buy at market bottoms when market sentiment surges or collapses.
### 补充说明:
- **RSI**:全称为Relative Strength Index(相对强弱指数),是常用的技术分析指标,用于衡量市场多空双方力量的对比。
- **ARBR**:由AR(Activity Ratio,人气指标)和BR(Buying Ratio,意愿指标)两个子指标组成,主要反映市场交易的活跃程度和投资者的买卖意愿。
- 句中“逃顶”译为“exit at market tops”,“抄底”译为“buy at market bottoms”,均为金融领域常用表达,准确对应“在高位卖出规避风险”和“在低位买入等待上涨”的操作含义。
RSI ALL INOverbought and Oversold with Candle Pattern Confluences
1. Overbought / Oversold signal only
2. RSI + Engulfing Candle
3. RSI + Hammer/Shooting Star
RSI+MA by RAThis Indicator generates buy and sell signal on the crossover of RSI and MA, HTF RSI is also plotted for HTF trend.

EMA +BB + CZ or dot (3 Colors) on RSI RSI(14) + EMA(14/60) on RSI + BB(31) • CZ Ribbon(BB) or Dots (3 Colors)
RSI + MACD Combo (sajadbagheri)The "RSI+MACD Persian Combo" integrates two classic oscillators with smart normalization. It detects overbought/oversold zones, MACD/RSI convergences, and highlights high-probability reversals using Z-Score scaling. Customizable alerts provide trade-ready signals.
Created by: Sajad Bagheri

RSI + Estocástico con Flechas y Divergencias RSIThis indicator combines the Relative Strength Index (RSI) and the Stochastic Oscill ator in one panel, displaying arrows at key overbought and oversold points. It helps traders identify potential reversal zones using two momentum indicators for confirmation.

RSI Wave squeezePlots TTM Squeeze momentum histogram (green/red).
Plots RSI (blue) in the same pane.
Shows squeeze dots and RSI overbought/oversold lines.

AK_Trend reversal_Range_Market_RSI + Stoch. RSIRSI + Stoch. RSI based indicator to predict trend reversal. Most applicable in range market

RSI and MACD Table with Cross [BY UKT]This script displays a compact, real-time dashboard of RSI and MACD values across multiple timeframes, along with the MACD cross direction (↑ / ↓) to help traders quickly assess momentum and trend strength.
▶️ Key Features:
RSI values for Weekly, Daily, 1H, 30M, 15M, 5M, and 3M
MACD values and cross status for each timeframe
Color-coded values for visual clarity (Green = Bullish, Red = Bearish)
Useful for both scalping and swing trading to get a multi-timeframe momentum overview
📌 Works on all asset classes: stocks, forex, crypto, and indices
👨💻 Developed in Pine Script v5
