BBS – Bond Breadth Signal"When bonds scream, breadth collapses, and fear spikes — BBS listens."
🧠 BBS – Bond Breadth Signal
A reversal timing tool built on macro conviction, not price noise.
The Bond Breadth Signal (BBS) was developed to identify major market inflection points by combining four key market stress indicators:
1) 10-Year Yield ROC – Measures sharp moves in the bond market
2) Z-Score of the 10Y – Captures statistical extremes
3) NSHF (Net Highs–Lows) – Signals internal market strength or weakness
4) TLT ROC + VIX – Confirmations of flight to safety and volatility-driven fear
When all conditions align, BBS marks either a For-Sure Buy or For-Sure Sell — these are rare, high-confidence signals designed to cut through noise and focus on true market dislocations.
🔧 Features:
-Background color and signal arrows on confirmation days
-Signals remain visually active for 3 days for added clarity
-Fully adjustable thresholds and alert toggles
-Plot panel for yield, TLT, NSHF, VIX, and Z-score visuals
This tool isn’t designed to fire every day. It’s meant to wait for those moments when the market truly bends — not just wiggles.
Best used on major indices (SPY, QQQ, IWM) to assess macro turning points.
"signal"に関するスクリプトを検索

Consolidation Range with Signals (Zeiierman)█ Overview
Consolidation Range with Signals (Zeiierman) is a precision tool for identifying and trading market consolidation zones, where price contracts into tight ranges before significant movement. It provides dynamic range detection using either ADX-based trend strength or volatility compression metrics, and offers built-in take profit and stop loss signals based on breakout dynamics.
Whether you trade breakouts, range reversals, or trend continuation setups, this indicator visualizes the balance between supply and demand with clearly defined mid-bands, breakout zones, and momentum-sensitive TP/SL placements.
█ How It Works
⚪ Multi-Method Range Detection
ADX Mode
Uses the Average Directional Index (ADX) to detect low-trend-strength environments. When ADX is below your selected threshold, price is considered to be in consolidation.
Volatility Mode
This mode detects consolidation by identifying periods of volatility compression. It evaluates whether the following metrics are simultaneously below their respective historical rolling averages:
Standard Deviation
Variance
Average True Range (ATR)
⚪ Dynamic Range Band System
Once a range is confirmed, the system builds a dynamic band structure using a volatility-based filter and price-jump logic:
Middle Line (Trend Filter): Reacts to price imbalance using adaptive jump logic.
Upper & Lower Bands: Calculated by expanding from the middle line using a configurable multiplier.
This creates a clean, visual box that reflects current consolidation conditions and adapts as price fluctuates within or escapes the zone.
⚪ SL/TP Signal Engine
On detection of a breakout from the range, the indicator generates up to 3 Take Profit levels and one Stop Loss, based on the breakout direction:
All TP/SL levels are calculated using the filtered base range and multipliers.
Cooldown logic ensures signals are not spammed bar-to-bar.
Entries are visualized with colored lines and labeled levels.
This feature is ideal for traders who want automated risk and reward reference points for range breakout plays.
█ How to Use
⚪ Breakout Traders
Use the SL/TP signals when the price breaks above or below the range bands, especially after extended sideways movement. You can customize how far TP1, TP2, and TP3 sit from the entry using your own risk/reward profile.
⚪ Mean Reversion Traders
Use the bands to locate high-probability reversion zones. These serve as reference zones for scalping or fade entries within stable consolidation phases.
█ Settings
Range Detection Method – Choose between ADX or Volatility compression to define range criteria.
Range Period – Determines how many bars are used to compute trend/volatility.
Range Multiplier – Scales the width of the consolidation zone.
SL/TP System – Optional levels that project TP1/TP2/TP3 and SL from the base price using multipliers.
Cooldown – Prevents repeated SL/TP signals from triggering too frequently.
ADX Threshold & Smoothing – Adjusts sensitivity of trend strength detection.
StdDev / Variance / ATR Multipliers – Fine-tune compression detection logic.
-----------------
Disclaimer
The content provided in my scripts, indicators, ideas, algorithms, and systems is for educational and informational purposes only. It does not constitute financial advice, investment recommendations, or a solicitation to buy or sell any financial instruments. I will not accept liability for any loss or damage, including without limitation any loss of profit, which may arise directly or indirectly from the use of or reliance on such information.
All investments involve risk, and the past performance of a security, industry, sector, market, financial product, trading strategy, backtest, or individual's trading does not guarantee future results or returns. Investors are fully responsible for any investment decisions they make. Such decisions should be based solely on an evaluation of their financial circumstances, investment objectives, risk tolerance, and liquidity needs.

Liquidity Sweep Candlestick Pattern with MA Filter📌 Liquidity Sweep Candlestick Pattern with MA Filter
This custom indicator detects liquidity sweep candlestick patterns—price action events where the market briefly breaks a previous candle’s high or low to trap traders—paired with optional filters such as moving averages, color change candles, and strictness rules for better signal accuracy.
🔍 What is a Liquidity Sweep?
A liquidity sweep occurs when the price briefly breaks the high or low of a previous candle and then reverses direction. These events often occur around key support/resistance zones and are used by institutional traders to trap retail positions before moving the price in the intended direction.
🟢 Bullish Liquidity Sweep Criteria
The current candle is bullish (closes above its open).
The low of the current candle breaks the low of the previous candle.
The candle closes above the previous candle’s open.
Optionally, in Strict mode, it must also close above the previous candle’s high.
Optionally, it can be filtered to only show if the candle changed color from the previous one (e.g., red to green).
Can be filtered to only show when the price is above or below a moving average (if MA filter is enabled).
🔴 Bearish Liquidity Sweep Criteria
The current candle is bearish (closes below its open).
The high of the current candle breaks the high of the previous candle.
The candle closes below the previous candle’s open.
Optionally, in Strict mode, it must also close below the previous candle’s low.
Optionally, it can be filtered to only show if the candle changed color from the previous one (e.g., green to red).
Can be filtered to only show when the price is above or below a moving average (if MA filter is enabled).
⚙️ Features & Customization
✅ Signal Strictness
Choose between:
Less Strict (default): Basic wick break and close conditions.
Strict: Must close beyond the wick of the previous candle.
✅ Color Change Candles Only
Enable this to only show patterns when the candle color changes (e.g., from red to green or green to red). Helps filter fake-outs.
✅ Moving Average Filter (optional)
Supports several types of MAs: SMA, EMA, WMA, VWMA, RMA, HMA
Choose whether signals should only appear above or below the selected moving average.
✅ Custom Visuals
Show short (BS) or full (Bull Sweep / Bear Sweep) labels
Plot triangles or arrows to represent bullish and bearish sweeps
Customize label and shape colors
Optionally show/hide the moving average line
✅ Alerts
Includes alert options for:
Bullish sweep
Bearish sweep
Any sweep
📈 How to Use
Add the indicator to your chart.
Configure the strictness, color change, or MA filters based on your strategy.
Observe signals where price is likely to reverse after taking out liquidity.
Use with key support/resistance levels, order blocks, or volume zones for confluence.
⚠️ Note
This tool is for educational and strategy-building purposes. Always confirm signals with other indicators, context, and sound risk management.

Bullish Bearish Signal with EMA Color + LabelsThis script generates clear BUY and SELL signals based on a combination of trend direction, momentum, and confirmation from multiple indicators. It is intended to help traders identify strong bullish or bearish conditions using commonly trusted tools: EMA 200, MACD, and RSI.
🔍 How it works:
The strategy combines three key elements:
EMA 200 Trend Filter
Identifies the long-term trend:
Price above EMA200 → Bullish trend bias
Price below EMA200 → Bearish trend bias
The EMA line is color-coded:
🔵 Blue for bullish
🔴 Red for bearish
⚪ Gray for neutral/unclear
MACD Crossover
Detects shifts in market momentum:
Bullish: MACD line crosses above signal line
Bearish: MACD line crosses below signal line
RSI Confirmation
Adds an extra layer of confirmation:
Bullish: RSI is above its signal line
Bearish: RSI is below its signal line
✅ Signal Logic:
BUY Signal appears when:
Price > EMA200
MACD crosses up
RSI > its signal line
SELL Signal appears when:
Price < EMA200
MACD crosses down
RSI < its signal line
Labels will appear on the chart to highlight these events.
🔔 Alerts:
The script includes alerts for both Buy and Sell conditions, so you can be notified in real-time when they occur.
📈 How to Use:
Best used in trending markets.
Recommended for higher timeframes (1H and above).
May be combined with other tools such as support/resistance or candlestick analysis.
⚠️ Disclaimer: This script is intended for educational purposes only and does not constitute financial advice or a trading recommendation.

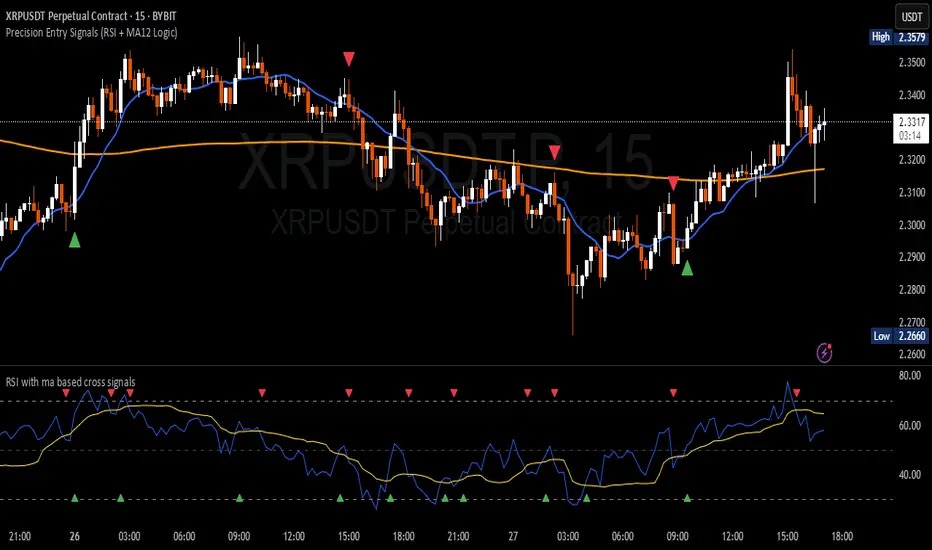
Precision Entry Signals (RSI + MA12 Logic)Description:
This script provides precise entry signals based on a clean confluence of MA12 breakouts and RSI momentum, filtered by a VWMA (Volume-Weighted Moving Average) of the RSI.
-----------------------------------------------------------------------------------------------------------------
🔹 Long entry conditions:
- Candle opens below the 12-period MA and closes above it
- RSI crosses above its VWMA
- Previous candle is bearish (additional confirmation)
🔹 Short entry conditions:
- Candle opens above the 12-period MA and closes below it
- RSI crosses below its VWMA
- Previous candle is bullish
----------------------------------------------------------------------------------------------------------------
Once a signal is confirmed, the script automatically draws:
Entry line (at close price)
Stop Loss line (just below recent lows for long, or above highs for short)
Take Profit 1 (1R)
Take Profit 2 (2R)
Labels are attached to the lines for clarity: ENTRY, SL, TP1, and TP2.
⚠️ Note: This tool only provides entry signals and visual risk/reward guidance. It does not manage exits dynamically. Manual trade management is recommended.
This script is intended for active intraday traders, especially on lower timeframes like 3-minute, 5-minute or 15-minute charts.
---------------------------------------------------------------------------------------------------------------
🔧 Recommended companion indicator:
For better confirmation and visual tracking of the RSI/VWMA cross logic, it is strongly recommended to also use the companion script:
🔹 Relative Strength Index (with MA based cross signals)
→ Shows RSI and its moving average visually, with triangle plots on every valid cross.
→ Matches exactly the RSI/VWMA behavior used in this entry signal script.
📌 Important:
After adding the RSI script to your chart, make sure to set:
RSI Length = 14
MA Type = VWMA
MA Length = 20
This ensures it visually matches the logic used by the entry signal script.
Both indicators are fully open source and meant to be used together — especially when trading manually.
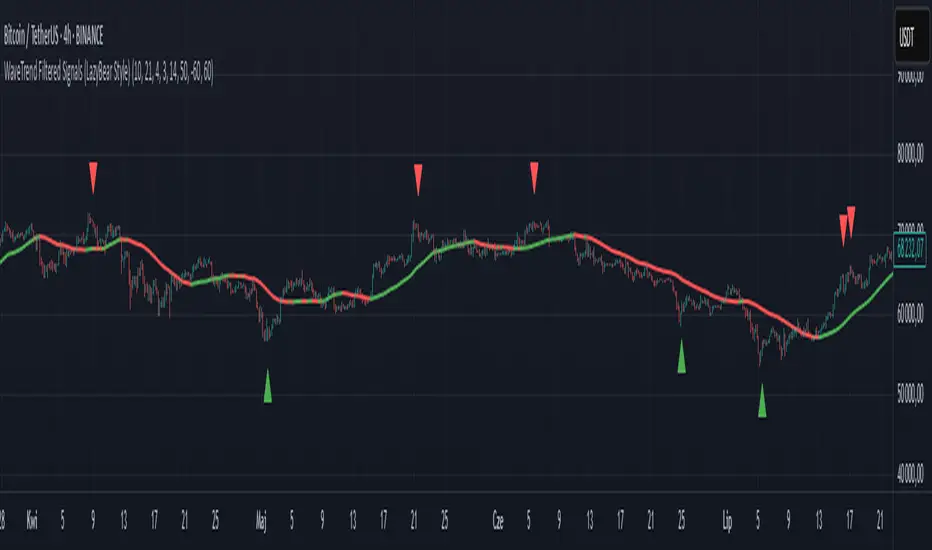
WaveTrend Filtered Signals (LazyBear Style)WaveTrend Filtered Signals (LazyBear Style)
This indicator is based on the popular WaveTrend oscillator (LazyBear) and adds several optional filters to improve signal quality:
✅ Available filters:
WT oversold/overbought zones – enabled by default. Signals are shown only if WT was previously in the specified zone (e.g., < -60 for longs, > 60 for shorts).
SMA trend filter – allows filtering signals in the direction of the moving average trend.
SMA position filter – signals appear only when price is above (for long) or below (for short) the moving average.
Consolidation filter – ignores signals during low-volatility sideways price movement.
💡 All filters are optional and can be enabled or disabled in the settings.
The default setup focuses on a clean approach: WaveTrend + oversold/overbought zones, with other filters left for customization.
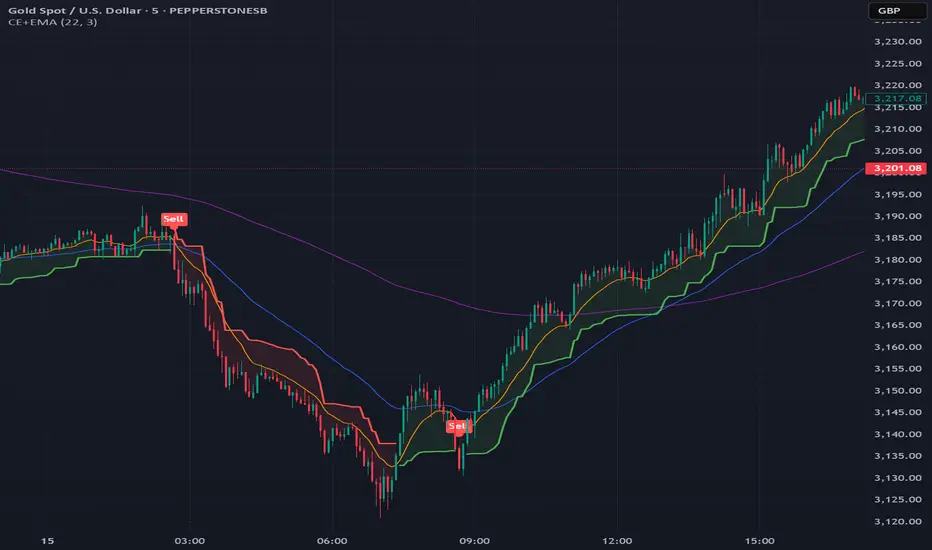
Chandelier Exit + EMA Filtered SignalsThis script is a powerful upgrade to the original Chandelier Exit by Alex Orekhov (everget), combining trend-following logic with higher-quality trade filtering.
✅ Key Features:
Chandelier Exit logic with ATR-based stop levels
Buy/Sell signals only when trend is confirmed:
Buy: Price must be above EMA 13, 50, and 200
Sell: Price must be below EMA 13, 50, and 200
Candle highlighting: Green for Buy, Red for Sell
Signal labels for visual clarity
Toggle to show/hide EMAs
Built-in alerts for:
Buy signal
Sell signal
Trend direction change
🛠️ Inputs:
ATR Period and Multiplier
Toggle: Use Close Price for High/Low Calculation
Toggle: Show/Hide Labels and State Highlight
Toggle: Show/Hide EMA 13, 50, 200
Toggle: Await confirmed bar for alerts
🔔 Alerts Included:
Chandelier Exit Buy
Chandelier Exit Sell
Direction Change (long to short or vice versa)
💡 How to Use:
Use on trending assets (e.g., Gold, Indices, Crypto).
Combine with support/resistance or session filters for optimal results.
Enable alerts to be notified on trade setups.
📢 Credits:
Based on the original Chandelier Exit script by everget.
Enhancements by AP Capital for filtered signals and better visual feedback.
Gap Reversal Signal with Indicators🔍 Gap Reversal Signal with Indicators — 結合 KD、MACD、SAR 與背離分析的多功能指標
🔍 Gap Reversal Signal with Indicators — A Multi-Tool Signal Indicator Combining KD, MACD, SAR, and Divergence Analysis
中文說明:
本指標結合多種常用技術分析工具,包括 KD 隨機指標、MACD 動能交叉、SAR 趨勢方向、以及 MACD 背離偵測,用以辨識潛在的價格反轉區域。適用於日內交易與波段操作,支援各類市場,如加密貨幣、股票與外匯等。
English Description:
This indicator combines several popular technical tools: Stochastic KD, MACD momentum crossovers, SAR trend direction, and MACD divergence detection. It helps traders identify potential reversal areas and is ideal for both intraday and swing trading. Works well on crypto, stocks, and forex markets.
🧠 功能特點 | Key Features
✅ KD指標(慢速隨機指標)檢測超買超賣並提供%K與%D交叉訊號
✅ Stochastic KD (slow) to detect overbought/oversold zones and crossover signals
✅ MACD金叉/死叉與零軸突破捕捉趨勢轉變與動能反轉
✅ MACD Crossovers + Zero-Line Breaks to capture trend changes and momentum reversals
✅ SAR指標即時顯示多空方向
✅ Parabolic SAR for real-time trend direction indication
✅ MACD背離偵測協助辨識潛在反轉區域
✅ MACD Divergence Detection for identifying hidden trend reversals
✅ 圖形提示與標籤提示可視化呈現各類訊號
✅ Visual Alerts and Labels for easy and quick signal recognition
📈 支援市場 | Supported Markets
📊 台股 / 美股 / 外匯 / 加密貨幣
📊 Taiwan Stocks / US Stocks / Forex / Cryptocurrencies (e.g. BTC, ETH)
🔧 推薦用法 | Recommended Use
搭配缺口策略與支撐壓力位使用
Use with gap-trading strategies and support/resistance zones
用於盤整末期或趨勢反轉的提示
Helpful for end-of-consolidation signals or trend reversals
支援短線與波段交易風格
Suitable for scalping and swing trading styles
💡 把這個指標加入你的圖表,立即體驗多重技術分析所帶來的交易優勢!
💡 Add this indicator to your chart now and experience the power of multi-tool technical analysis!

External Signals Strategy Tester v5External Signals Strategy Tester v5 – User Guide (English)
1. Purpose
This Pine Script strategy is a universal back‑tester that lets you plug in any external buy/sell series (for example, another indicator, webhook feed, or higher‑time‑frame condition) and evaluate a rich set of money‑management rules around it – with a single click on/off workflow for every module.
2. Core Workflow
Feed signals
Buy Signal / Sell Signal inputs accept any series (price, boolean, output of request.security(), etc.).
A crossover above 0 is treated as “signal fired”.
Date filter
Start Date / End Date restricts the test window so you can exclude unwanted history.
Trade engine
Optional Long / Short enable toggles.
Choose whether opposite signals simply close the trade or reverse it (flip direction in one transaction).
Risk modules – all opt‑in via check‑boxes
Classic % block – fixed % Take‑Profit / Stop‑Loss / Break‑Even.
Fibonacci Bollinger Bands (FBB) module
Draws dynamic VWMA/HMA/SMA/EMA/DEMA/TEMA mid‑line with ATR‑scaled Fibonacci envelopes.
Every line can be used for stops, trailing, or multi‑target exits.
Separate LONG and SHORT sub‑modules
Each has its own SL plus three Take‑Profits (TP1‑TP3).
Per TP you set line, position‑percentage to close, and an optional trailing flag.
Executed TP/SLs deactivate themselves so they cannot refire.
Trailing behaviour
If Trail is checked, the selected line is re‑evaluated once per bar; the order is amended via strategy.exit().
3. Inputs Overview
Group Parameter Notes
Trade Settings Enable Long / Enable Short Master switches
Close on Opposite / Reverse Position How to react to a counter‑signal
Risk % Use TP / SL / BE + their % Traditional fixed‑distance management
Fibo Bands FIBO LEVELS ENABLE + visual style/length Turn indicator overlay on/off
FBB LONG SL / TP1‑TP3 Enable, Line, %, Trail Rules applied only while a long is open
FBB SHORT SL / TP1‑TP3 Enable, Line, %, Trail Rules applied only while a short is open
Line choices: Basis, 0.236, 0.382, 0.5, 0.618, 0.764, 1.0 – long rules use lower bands, short rules use upper bands automatically.
4. Algorithm Details
Position open
On the very first bar after entry, the script checks the direction and activates the corresponding LONG or SHORT module, deactivating the other.
Order management loop (every bar)
FBB Stop‑Loss: placed/updated at chosen band; if trailing, follows the new value.
TP1‑TP3: each active target updates its limit price to the selected band (or holds static if trailing is off).
The classic % block runs in parallel; its exits have priority because they call strategy.close_all().
Exit handling
When any strategy.exit() fires, the script reads exit_id and flips the *_Active flag so that order will not be recreated.
A Stop‑Loss (SL) also disables all remaining TPs for that leg.
5. Typical Use Cases
Scenario Suggested Setup
Scalping longs into VWAP‐reversion Enable LONG TP1 @ 0.382 (30 %), TP2 @ 0.618 (40 %), SL @ 0.236 + trailing
Fade shorts during news spikes Enable SHORT SL @ 1.0 (no trail) and SHORT TP1,2,3 on consecutive lowers with small size‑outs
Classic trend‑follow Use only classic % TP/SL block and disable FBB modules
6. Hints & Tips
Signal quality matters – this script manages exits, it does not generate entries.
Keep TV time zone in mind when picking start/end dates.
For portfolio‑style testing allocate smaller default_qty_value than 100 % or use strategy.percent_of_equity sizing.
You can combine FBB exits with fixed‑% ones for layered management.
7. Limitations / Safety
No pyramiding; the script holds max one position at a time.
All calculations are bar‑close; intra‑bar touches may differ from real‑time execution.
The indicator overlay is optional, so you can run visual‑clean tests by unchecking FIBO LEVELS ENABLE.

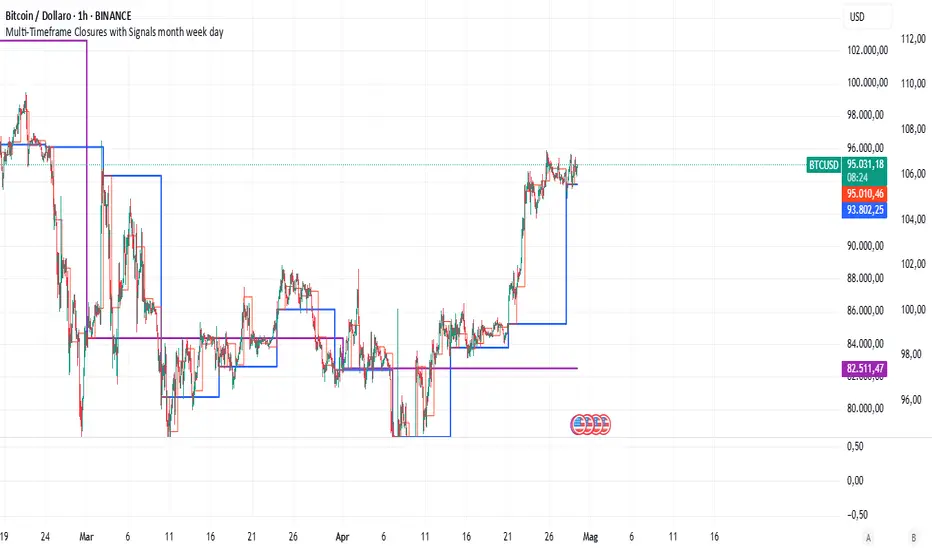
Multi-Timeframe Closures with Signals month week dayMulti-Timeframe Price Anchoring Indicator (Monthly, Weekly, Daily)
This indicator provides a powerful visual framework for analyzing price action across three major timeframes: monthly, weekly, and daily. It plots the closing prices of each timeframe directly on the chart to help traders assess where current price stands in relation to significant historical levels.
🔍 Core Features:
Monthly, Weekly, and Daily Close Lines: Automatically updated at the start of each new period.
Color-coded Price Anchors: Each timeframe is visually distinct for fast interpretation.
Multi-timeframe Awareness: Helps you identify trend alignment or divergence across different time horizons.
Long & Short Bias Signals: The script can optionally display long or short suggestions based on where the current price stands relative to the anchored closing prices.
📈 How to Use:
Trend Confirmation: If price is consistently above all three levels, it signals a strong bullish trend (potential long bias). If it’s below, the opposite applies (short bias).
Reversal or Pullback Zones: When price becomes extended far above/below the monthly and weekly closes, it may suggest overbought/oversold conditions and the possibility of a reversal or retracement.
Intraday Alignment: Useful for traders who want to enter positions on lower timeframes while being aware of higher timeframe trends.
This indicator is ideal for swing traders, day traders, and position traders who want to anchor their decisions to meaningful multi-timeframe reference points.
Head Hunter HHHead Hunter HH - Advanced Market Structure & Volume Analysis Indicator
This indicator combines volume analysis, price action, and VWAP to identify high-probability trading opportunities across multiple timeframes.
Key Features:
• Smart Volume Analysis: Detects institutional volume patterns using dynamic thresholds
• VWAP-Based Market Structure: Multiple standard deviation bands for precision entry/exit
• Daily Level Integration: Previous day's high, low, close, and current day's open
• Advanced Signal Classification: Regular, Super Strong, and Scalp signals
Signal Types:
1. Regular Signals (White/Purple Triangles)
• Volume-confirmed reversals
• Institutional price levels
• Technical momentum alignment
2. Super Strong Signals (Green/Red Diamonds)
• High-volume breakouts
• Strong momentum confirmation
• Multiple timeframe alignment
3. Scalp Signals (Green/Magenta Circles)
• Quick reversal opportunities
• VWAP deviation analysis
• Volume surge confirmation
Visual Components:
• VWAP with Standard Deviation Bands
• 50 MA (optional)
• Daily Reference Levels
• Color-coded signals based on strength
• Bar color changes on confirmed signals
Best Practices:
• Most effective on higher timeframes (1H+)
• Use with major pairs/instruments
• Combine signals with support/resistance
• Monitor volume confirmation
• Wait for candle close confirmation
This indicator helps identify institutional order flow and high-probability reversal zones by analyzing volume patterns, price action, and market structure, providing traders with multiple confirmation layers before entry.
Note: Results may vary based on market conditions and timeframe selection. Always use proper risk management.

Advanced Momentum Scanner [QuantAlgo]The Advanced Momentum Scanner is a sophisticated technical indicator designed to identify market momentum and trend direction using multiple exponential moving averages (EMAs), momentum metrics, and adaptive visualization techniques. It is particularly valuable for those looking to identify trading and investing opportunities based on trend changes and momentum shifts across any market and timeframe.
🟢 Technical Foundation
The Advanced Momentum Scanner utilizes a multi-layered approach with four different EMA periods to identify market momentum and trend direction:
Ultra-Fast EMA for quick trend changes detection (default: 5)
Fast EMA for short-term trend analysis (default: 10)
Mid EMA for intermediate confirmation (default: 30)
Slow EMA for long-term trend identification (default: 100)
For momentum detection, the indicator implements a Rate of Change (RoC) calculation to measure price momentum over a specified period. It further enhances analysis by incorporating RSI readings for overbought/oversold conditions, volatility measurements through ATR, and optional volume confirmation. When these elements align, the indicator generates trading signals based on the selected sensitivity mode (Conservative, Balanced, or Aggressive).
🟢 Key Features & Signals
1. Multi-Period Trend Identification
The indicator combines multiple EMAs of different lengths to provide comprehensive trend analysis within the same timeframe, displaying the information through color-coded visual elements on the chart.
When an uptrend is detected, chart elements are colored with the bullish theme color (default: green/teal).
Similarly, when a downtrend is detected, chart elements are colored with the bearish theme color (default: red).
During neutral or indecisive periods, chart elements are colored with a neutral gray color, providing clear visual distinction between trending and non-trending market conditions.
This visualization provides immediate insights into underlying trend direction without requiring separate indicators, helping traders and investors quickly identify the market's current state.
2. Trend Strength Information Panel
The trend panel operates in three different sensitivity modes (Conservative, Aggressive, and Balanced), each affecting how the indicator processes and displays market information.
The Conservative mode prioritizes trend sustainability over frequency, showing only strong trend movements with high probability.
The Aggressive mode detects early trend changes, providing more frequent signals but potentially more false positives.
The Balanced mode offers a middle ground with moderate signal frequency and reliability.
Regardless of the selected mode, the panel displays:
Current trend direction (UPTREND, DOWNTREND, or NEUTRAL)
Trend strength percentage (0-100%)
Early detection signals when applicable
The active sensitivity mode
This comprehensive approach helps traders and investors:
→ Assess the strength of current market trends
→ Identify early potential trend changes before full confirmation
→ Make more informed trading and investing decisions based on trend context
3. Customizable Visualization Settings
This indicator offers extensive visual customization options to suit different trading styles and preferences:
Display options:
→ Fully customizable uptrend, downtrend, and neutral colors
→ Color-coded price bars showing trend direction
→ Dynamic gradient bands visualizing potential trend channels
→ Optional background coloring based on trend intensity
→ Adjustable transparency levels for all visual elements
These visualization settings can be fine-tuned through the indicator's interface, allowing traders and investors to create a personalized chart environment that emphasizes the most relevant information for their strategy.
The indicator also features a comprehensive alert system with notifications for:
New trend formations (uptrend, downtrend, neutral)
Early trend change signals
Momentum threshold crossovers
Other significant market conditions
Alerts can be customized and delivered through TradingView's notification system, making it easy to stay informed of important market developments even when you are away from the charts.
🟢 Practical Usage Tips
→ Trend Analysis and Interpretation: The indicator visualizes trend direction and strength directly on the chart through color-coding and the information panel, allowing traders and investors to immediately identify the current market context. This information helps in assessing the potential for continuation or reversal.
→ Signal Generation Strategies: The indicator generates potential trading signals based on trend direction, momentum confirmation, and selected sensitivity mode. Users can choose between Conservative (fewer but more reliable signals), Balanced (moderate approach), or Aggressive (more frequent but potentially less reliable signals).
→ Multi-Period Trend Assessment: Through its layered EMA approach, the indicator enables users to understand trend conditions across different lookback periods within the same timeframe. This helps in identifying the dominant trend and potential turning points.
🟢 Pro Tips
Adjust EMA periods based on your timeframe:
→ Lower values for shorter timeframes and more frequent signals
→ Higher values for higher timeframes and more reliable signals
Fine-tune sensitivity mode based on your trading style:
→ "Conservative" for position trading/long-term investing and fewer false signals
→ "Balanced" for swing trading/medium-term investing with moderate signal frequency
→ "Aggressive" for scalping/day trading and catching early trend changes
Look for confluence between components:
→ Strong trend strength percentage and direction in the information panel
→ Overall market context aligning with the expected direction
Use for multiple trading approaches:
→ Trend following during strong momentum periods
→ Counter-trend trading at band extremes during overextension
→ Early trend change detection with sensitivity adjustments
→ Stop loss placement using dynamic bands
Combine with:
→ Volume indicators for additional confirmation
→ Support/resistance analysis for strategic entry/exit points
→ Multiple timeframe analysis for broader market context

Statistical Trailing Stop [LuxAlgo]The Statistical Trailing Stop tool offers traders a way to lock in profits in trending markets with four statistical levels based on the log-normal distribution of volatility.
The indicator also features a dashboard with statistics of all detected signals.
🔶 USAGE
The tool works out of the box, traders can adjust the data used with two parameters: data & distribution length.
By default, the tool takes volatility measures of groups of 10 candles, and statistical measures of the last 100 of these groups then traders can adjust the base level to use as trailing, the larger the level, the more resistant the tool will be to moves against the trend.
🔹 Base Levels
Traders can choose up to 4 different levels of trailing, all based on the statistical distribution of volatility.
As we can see in the chart above, each higher level is more resistant to market movements, so level 0 is the most reactive and level 3 the least.
It is up to the trader to determine the best level for each underlying, time frame and market conditions.
🔹 Dashboard
The tool provides a dashboard with the statistics of all trades, making it very easy to assess the performance of the parameters used for any given market.
As we can see on the chart, all Daily BTC signals with default parameters but different base levels, level 2 is the best performing of all four, giving a positive expectation of $2435 per trade, taking into account all long and short trades.
Of note are the long trades with a win rate of 76.47% and a risk-to-reward of 3.34, giving a positive expectation of $4839 per trade, with winners having an average duration of 210 days and losers 32 days.
This, compared to short trades with negative expectation, speaks to the uptrend bias of this particular market.
🔶 SETTINGS
Data Length: Select how many bars to use per data point
Distribution Length: Select how many data points the distribution will have
Base Level: Choose between 4 different trailing levels
🔹 Dashboard
Show Statistics: Enable/disable dashboard
Position: Select dashboard position
Size: Select dashboard size

Gap & Reversal Signals (Normal vs Heikin-Ashi)🔍 Gap & Reversal Signals (Normal vs Heikin-Ashi) — by
This script is designed to help traders identify key market signals by comparing Normal Candlestick Patterns with Heikin-Ashi values to highlight potential:
✅ Gap Up Opportunities (Strong Bullish Continuation)
🔻 Gap Down Alerts (Strong Bearish Continuation)
🔄 Bullish Reversal Zones (Possible Trend Reversal from Bearish to Bullish)
🔁 Bearish Reversal Zones (Possible Trend Reversal from Bullish to Bearish)
🧠 How it Works:
Gap Up: Normal candle is bullish, Heikin-Ashi is also bullish, and price closes higher than the HA close.
Gap Down: Normal candle is bearish, Heikin-Ashi is also bearish, and price closes lower than the HA close.
Bullish Reversal: Normal candle is bullish, but Heikin-Ashi shows bearish — potential reversal signal.
Bearish Reversal: Normal candle is bearish, but Heikin-Ashi shows bullish — potential reversal signal.
📊 Plot Details:
💚 Gap Up → Green Label Below Bar
❤️ Gap Down → Red Label Above Bar
💙 Bullish Reversal → Blue Label Below Bar
🧡 Bearish Reversal → Orange Label Above Bar
🚀 Use Cases:
Swing and positional traders looking for high-probability reversal setups
Intraday traders spotting early momentum shifts
Backtesters combining HA + candlestick logic for more robust strategies

Trend Targets [AlgoAlpha]OVERVIEW
This script combines a smoothed trend-following model with dynamic price rejection logic and ATR-based target projection to give traders a complete visual framework for trading trend continuations. It overlays on price and automatically detects potential trend shifts, confirms rejections near dynamic support/resistance, and displays calculated stop-loss and take-profit levels to support structured risk-reward management. Unlike traditional indicators that only show trend direction or signal entries, this tool brings together a unique mix of signal validation, volatility-aware positioning, and layered profit-taking to guide decision-making with more context.
CONCEPTS
The core trend logic is built on a custom Supertrend that uses an ATR-based band structure with long smoothing chains—first through a WMA, then an EMA—allowing the trend line to respond to major shifts while ignoring noise. A key addition is the use of rejection logic: the script looks for consolidation candles that "hug" the smoothed trend line and counts how many consecutive bars reject from it. This behavior often precedes significant moves. A user-defined threshold filters out weak tests and highlights only meaningful rejections.
FEATURES
Trend Detection : Automatically identifies trend direction using a smoothed Supertrend (WMA + EMA), with shape markers on trend shifts and color-coded bars for clarity.
Rejection Signals : Detects price rejections at the trend line after a user-defined number of consolidation bars; plots ▲/▼ icons to highlight strong continuation setups.
Target Projection : On trend confirmation, plots entry, stop-loss (ATR-based), and three dynamic take-profit levels based on customizable multiples.
Dynamic Updates : All levels (entry, SL, TP1–TP3) auto-adjust based on volatility and are labeled in real time on the chart.
Customization : Users can tweak trend parameters, rejection confirmation count, SL/TP ratios, smoothing lengths, and appearance settings.
Alerts : Built-in alerts for trend changes, rejection events, and when TP1, TP2, or TP3 are reached.
Chart Overlay : Plots directly on price chart with minimal clutter and clearly labeled levels for easy trading.
USAGE
Start by tuning the Supertrend factor and ATR period to fit your asset and timeframe—higher values will catch bigger swings, lower values catch faster moves. The confirmation count should match how tightly you want to filter rejection behavior—higher values make signals rarer but stronger. When the trend shifts, the indicator colors the bars and line accordingly, and if enabled, plots the full entry-TP-SL structure. Rejection markers appear only after enough qualifying bars confirm price pressure at the trend line. This is especially useful for continuation plays where price retests the trend but fails to break it. All calculations are based on volatility (ATR), so targets naturally adjust with market conditions. Add alerts to get notified of important signals even when away from the chart.

Multi Oscillator OB/OS Signals v3 - Scope TestIndicator Description: Multi Oscillator OB/OS Signals
Purpose:
The "Multi Oscillator OB/OS Signals" indicator is a TradingView tool designed to help traders identify potential market extremes and momentum shifts by monitoring four popular oscillators simultaneously: RSI, Stochastic RSI, CCI, and MACD. Instead of displaying these oscillators in separate panes, this indicator plots distinct visual symbols directly onto the main price chart whenever specific predefined conditions (typically related to overbought/oversold levels or line crossovers) are met for each oscillator. This provides a consolidated view of potential signals from these different technical tools.
How It Works:
The indicator calculates the values for each of the four oscillators based on user-defined settings (like length periods and price sources) and then checks for specific signal conditions on every bar:
Relative Strength Index (RSI):
It monitors the standard RSI value.
When the RSI crosses above the user-defined Overbought (OB) level (e.g., 70), it plots an "Overbought" symbol (like a downward triangle) above that price bar.
When the RSI crosses below the user-defined Oversold (OS) level (e.g., 30), it plots an "Oversold" symbol (like an upward triangle) below that price bar.
Stochastic RSI:
This works similarly to RSI but is based on the Stochastic calculation applied to the RSI value itself (specifically, the %K line of the Stoch RSI).
When the Stoch RSI's %K line crosses above its Overbought level (e.g., 80), it plots its designated OB symbol (like a downward arrow) above the bar.
When the %K line crosses below its Oversold level (e.g., 20), it plots its OS symbol (like an upward arrow) below the bar.
Commodity Channel Index (CCI):
It tracks the CCI value.
When the CCI crosses above its Overbought level (e.g., +100), it plots its OB symbol (like a square) above the bar.
When the CCI crosses below its Oversold level (e.g., -100), it plots its OS symbol (like a square) below the bar.
Moving Average Convergence Divergence (MACD):
Unlike the others, MACD signals here are not based on fixed OB/OS levels.
It identifies when the main MACD line crosses above its Signal line. This is considered a bullish crossover and is indicated by a specific symbol (like an upward label) plotted below the price bar.
It also identifies when the MACD line crosses below its Signal line. This is a bearish crossover, indicated by a different symbol (like a downward label) plotted above the price bar.
Visualization:
All these signals appear as small, distinct shapes directly on the price chart at the bar where the condition occurred. The shapes, their colors, and their position (above or below the bar) are predefined for each signal type to allow for quick visual identification. Note: In the current version of the underlying code, the size of these shapes is fixed (e.g., tiny) and not user-adjustable via the settings.
Configuration:
Users can access the indicator's settings to customize:
The calculation parameters (Length periods, smoothing, price source) for each individual oscillator (RSI, Stoch RSI, CCI, MACD).
The specific Overbought and Oversold threshold levels for RSI, Stoch RSI, and CCI.
The colors associated with each type of signal (OB, OS, Bullish Cross, Bearish Cross).
(Limitation Note: While settings exist to toggle the visibility of signals for each oscillator individually, due to a technical workaround in the current code, these toggles may not actively prevent the shapes from plotting if the underlying condition is met.)
Alerts:
The indicator itself does not automatically generate pop-up alerts. However, it creates the necessary "Alert Conditions" within TradingView's alert system. This means users can manually set up alerts for any of the specific signals generated by the indicator (e.g., "RSI Overbought Enter," "MACD Bullish Crossover"). When creating an alert, the user selects this indicator, chooses the desired condition from the list provided by the script, and configures the alert actions.
Intended Use:
This indicator aims to provide traders with convenient visual cues for potential over-extension in price (via OB/OS signals) or shifts in momentum (via MACD crossovers) based on multiple standard oscillators. These signals are often used as potential indicators for:
Identifying areas where a trend might be exhausted and prone to a pullback or reversal.
Confirming signals generated by other analysis methods or trading strategies.
Noting shifts in short-term momentum.
Disclaimer: As with any technical indicator, the signals generated should not be taken as direct buy or sell recommendations. They are best used in conjunction with other forms of analysis (price action, trend analysis, volume, fundamental analysis, etc.) and within the framework of a well-defined trading plan that includes risk management. Market conditions can change, and indicator signals can sometimes be false or misleading.

Fibonacci Levels with SMA SignalsThis strategy leverages Fibonacci retracement levels along with the 100-period and 200-period Simple Moving Averages (SMAs) to generate robust entry and exit signals for long-term swing trades, particularly on the daily timeframe. The combination of Fibonacci levels and SMAs provides a powerful way to capitalize on major trend reversals and market retracements, especially in stocks and major crypto assets.
The core of this strategy involves calculating key Fibonacci retracement levels (23.6%, 38.2%, 61.8%, and 78.6%) based on the highest high and lowest low over a 365-day lookback period. These Fibonacci levels act as potential support and resistance zones, indicating areas where price may retrace before continuing its trend. The 100-period SMA and 200-period SMA are used to define the broader market trend, with the strategy favoring uptrend conditions for buying and downtrend conditions for selling.
This indicator highlights high-probability zones for long or short swing setups based on Fibonacci retracements and the broader trend, using the 100 and 200 SMAs.
In addition, this strategy integrates alert conditions to notify the trader when these key conditions are met, providing real-time notifications for optimal entry and exit points. These alerts ensure that the trader does not miss significant trade opportunities.
Key Features:
Fibonacci Retracement Levels: The Fibonacci levels provide natural price zones that traders often watch for potential reversals, making them highly relevant in the context of swing trading.
100 and 200 SMAs: These moving averages help define the overall market trend, ensuring that the strategy operates in line with broader price action.
Buy and Sell Signals: The strategy generates buy signals when the price is above the 200 SMA and retraces to the 61.8% Fibonacci level. Sell signals are triggered when the price is below the 200 SMA and retraces to the 38.2% Fibonacci level.
Alert Conditions: The alert conditions notify traders when the price is at the key Fibonacci levels in the context of an uptrend or downtrend, allowing for efficient monitoring of trade opportunities.
Application:
This strategy is ideal for long-term swing trades in both stocks and major cryptocurrencies (such as BTC and ETH), particularly on the daily timeframe. The daily timeframe allows for capturing broader, more sustained trends, making it suitable for identifying high-quality entries and exits. By using the 100 and 200 SMAs, the strategy filters out noise and focuses on larger, more meaningful trends, which is especially useful for longer-term positions.
This script is optimized for swing traders looking to capitalize on retracements and trends in markets like stocks and crypto. By combining Fibonacci levels with SMAs, the strategy ensures that traders are not only entering at optimal levels but also trading in the direction of the prevailing trend.

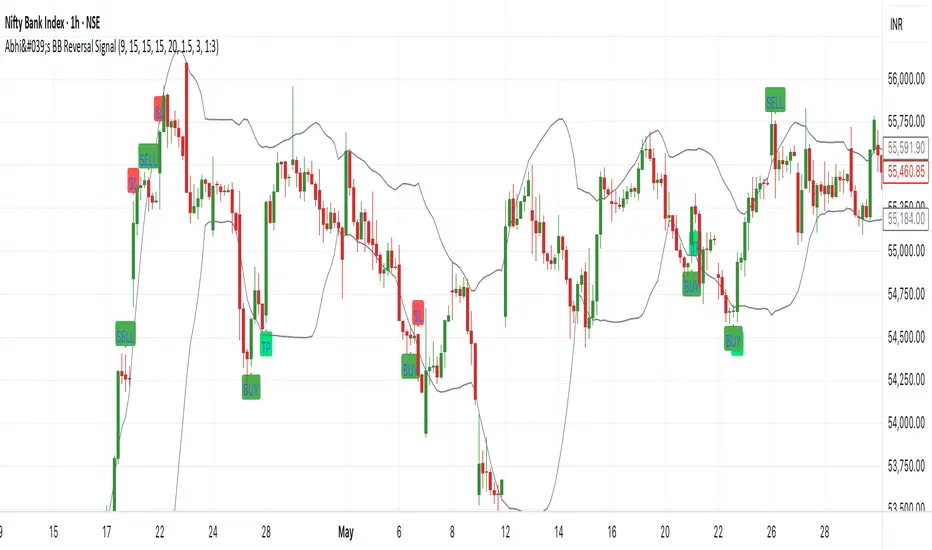
Abhi's Bollinger Band Reversal SignalThis Pine Script indicator is designed to detect reversal trade opportunities using Bollinger Band breakouts. It identifies both buy and sell setups with clearly defined entry, stop-loss (SL), and target (TP) conditions. It also manages trades visually with real-time signal plotting, and limits entries per trading day.
⚙️ How It Works
🔽 Sell Signal Conditions
- The previous candle must close above the upper Bollinger Band, and its entire body must be above the band
- The current candle must fail to break the previous high, and must break below the previous low
- Entry is taken at the previous candle’s low, with SL at its high
- Target is calculated based on a configurable Risk:Reward ratio
🔼 Buy Signal Conditions
- The previous candle must close below the lower Bollinger Band, and its entire body must be below the band
- The current candle must fail to break the previous low, and must break above the previous high
- Entry is at the previous candle’s high, with SL at its low
- Target is calculated using the same Risk:Reward ratio
⏰ Time-Based Exit
- If a trade is still active by a user-defined exit time (e.g. 15:15), the trade is closed
- Labels are plotted to show whether this exit was a profit or loss
🧩 User Inputs
- Start Time for signals
- Exit Time for open trades
- Bollinger Band Settings: Period and Std Dev
- Max Entries Per Day
- Risk:Reward Ratio: Dropdown for 1:1, 1:1.5, ..., 1:3
🎨 Visual Features
✅ BUY and SELL signals are plotted when valid conditions are detected
🟢 TP and 🔴 SL labels show trade outcome
🕒 TIME EXIT labels appear at user-set exit time with green/red coloring based on profitability
📉 Bollinger Bands plotted for visual context
📌 Notes:
- Designed for intraday trading, resets entry counter daily
- Uses bar_index > tradeBarIndex to avoid SL/TP being triggered on the same candle as entry
- Tracks only one trade at a time (tradeActive) — ensures clear, non-overlapping logic
[COG]Adaptive Volatility Bands# Adaptive Volatility Bands (AVB) Indicator Guide for Traders
## Special Acknowledgment 🙌
This script is inspired by and builds upon the foundational work of **DonovanWall**, a respected contributor to the trading community. His innovative approach to adaptive indicators has been instrumental in developing this advanced trading tool.
## What is the Adaptive Volatility Bands Indicator?
The Adaptive Volatility Bands (AVB) is a sophisticated technical analysis tool designed to help traders understand market dynamics by creating dynamic, responsive price channels that adapt to changing market conditions. Unlike traditional static indicators, this script uses advanced mathematical techniques to create flexible bands that adjust to market volatility in real-time.
## Key Features and Inputs
### 1. Price and Filtering Options
- **Price Source**: Determines the base price used for calculations (default is HLC3 - Average of High, Low, and Close)
- **Filter Poles**: Controls the smoothness of the indicator (1-9 poles)
- Lower values: More responsive, more noise
- Higher values: Smoother, but slower to react
### 2. Volatility and Band Settings
- **Sample Length**: Determines how many bars are used to calculate volatility (default 144)
- **Volatility Multiplier**: Adjusts the width of the main bands (default 1.414)
- **Outer Band Multiplier**: Controls the width of the outer bands (default 2.5)
- **Inner Band Ratio**: Positions the inner bands between the center and outer bands (default 0.25)
### 3. Advanced Processing Options
- **Lag Reduction Mode**: Helps reduce indicator delay
- **Fast Response Mode**: Makes the indicator more responsive to recent price changes
### 4. Signal and Visualization Options
- **Show Entry Signals**: Displays buy and sell signals
- **Signal Display Style**: Choose between labels or shapes
- **Range Filter**: Adds an additional filter for signal validation
## How the Indicator Works
The Adaptive Volatility Bands create a dynamic price channel with three key components:
1. **Center Line**: Represents the core trend direction
2. **Inner Bands**: Closer to the center line
3. **Outer Bands**: Wider bands that show broader price potential
### Color Dynamics
- The indicator uses a smart color gradient system
- Colors change based on price position within the bands
- Helps visualize bullish (green/blue) and bearish (red) market conditions
## Trading Strategies for Beginners
### Basic Entry Signals
- **Buy Signal**:
- Price touches the center line from below
- Candle is bullish (closes higher than it opens)
- Price is above the center line
- Trend is upward
- **Sell Signal**:
- Price touches the center line from above
- Candle is bearish (closes lower than it opens)
- Price is below the center line
- Trend is downward
### Risk Management Tips
1. Use the bands to identify:
- Potential trend changes
- Volatility levels
- Support and resistance areas
2. Combine with other indicators for confirmation
3. Always use stop-loss orders
4. Adjust parameters to match your trading style and asset
## When to Use This Indicator
Best suited for:
- Trending markets
- Swing trading
- Identifying potential entry and exit points
- Understanding market volatility
### Recommended Markets
- Stocks
- Forex
- Cryptocurrencies
- Futures
## Customization
The script offers extensive customization:
- Adjust smoothness
- Change band multipliers
- Modify color schemes
- Enable/disable features like lag reduction
## Important Considerations for Beginners
🚨 **Disclaimer**:
- No indicator guarantees profits
- Always practice with a demo account first
- Learn and understand the indicator before live trading
- Market conditions change, so continually adapt your strategy
## Getting Started
1. Add the script to your TradingView chart
2. Experiment with different settings
3. Backtest on historical data
4. Start with small positions
5. Continuously learn and improve
Happy Trading! 📈🔍

Forexsom MA Crossover SignalsA Trend-Following Trading Indicator for TradingView
Overview
This indicator plots two moving averages (MA) on your chart and generates visual signals when they cross, helping traders identify potential trend reversals. It is designed to be simple yet effective for both beginners and experienced traders.
Key Features
✅ Dual Moving Averages – Plots a Fast MA (default: 9-period) and a Slow MA (default: 21-period)
✅ Customizable MA Types – Choose between EMA (Exponential Moving Average) or SMA (Simple Moving Average)
✅ Clear Buy/Sell Signals – Displays "BUY" (green label) when the Fast MA crosses above the Slow MA and "SELL" (red label) when it crosses below
✅ Alerts – Get notified when new signals appear (compatible with TradingView alerts)
✅ Clean Visuals – Easy-to-read moving averages with adjustable colors
How It Works
Bullish Signal (BUY) → Fast MA crosses above Slow MA (suggests uptrend)
Bearish Signal (SELL) → Fast MA crosses below Slow MA (suggests downtrend)
Best Used For
✔ Trend-following strategies (swing trading, day trading)
✔ Confirming trend reversals
✔ Filtering trade entries in combination with other indicators
Customization Options
Adjust Fast & Slow MA lengths
Switch between EMA or SMA for smoother or more responsive signals
Why Use This Indicator?
Simple & Effective – No clutter, just clear signals
Works on All Timeframes – From scalping (1M, 5M) to long-term trading (4H, Daily)
Alerts for Real-Time Trading – Never miss a signal

RSI Disparity SignalRSI Disparity Signal Indicator
Overview:
This TradingView indicator detects when the RSI is significantly lower than its RSI-based moving average (RSI MA). Whenever the RSI is 20 points or more below the RSI MA, a signal (red dot) appears above the corresponding candlestick.
How It Works:
Calculates RSI using the default 14-period setting.
Calculates the RSI-based Moving Average (RSI MA) using a 14-period simple moving average (SMA).
Measures the disparity between the RSI and its MA.
Generates a signal when the RSI is 20 points or more below the RSI MA.
Plots a red circle above the candlestick whenever this condition is met.
Customization:
You can modify the RSI length and MA period to fit your trading strategy.
Change the plotshape() style to use different symbols like triangles or arrows.
Adjust the disparity threshold (currently set at 20) to make the signal more or less sensitive.
Use Case:
This indicator can help identify potentially oversold conditions where RSI is significantly below its average, signaling possible price reversals.

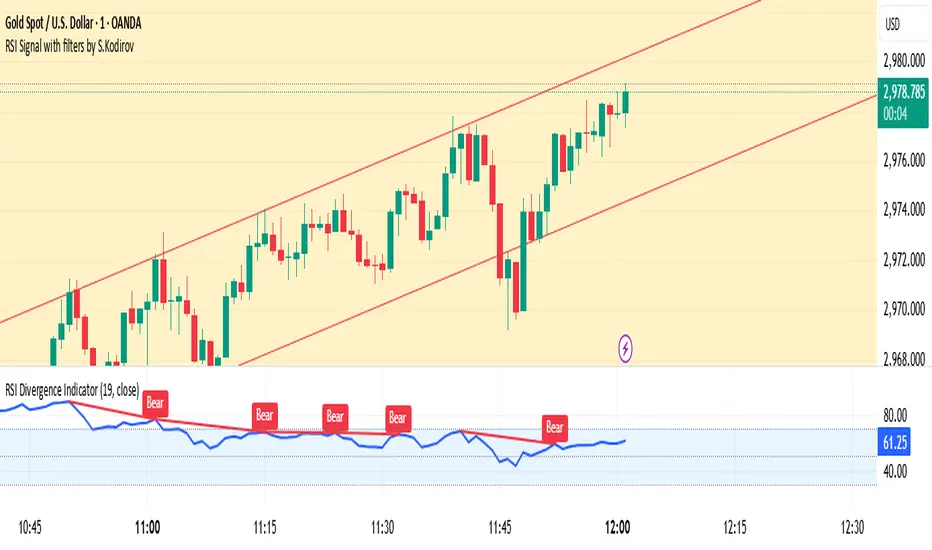
RSI Signal with filters by S.Kodirov📌 English
RSI Signal with Multi-Timeframe Filters
This TradingView indicator generates RSI-based buy and sell signals on the 15-minute timeframe with additional filtering from other timeframes (5M, 30M, 1M).
🔹 Signal Types:
✅ 15/5B & 15/5S – RSI 15M filtered by 5M
✅ 15/30/1B & 15/30/1S – RSI 15M filtered by 30M & 1M
✅ 15B & 15S – RSI 15M without filters
🔹 How It Works:
Signals are displayed as colored triangles on the chart.
Labels indicate the type of signal (e.g., 15/5B, 15S).
Alerts notify users when a signal appears.
🚀 Best for short-term trading with RSI confirmation from multiple timeframes!
📌 Русский
Индикатор RSI с мульти-таймфрейм фильтрами
Этот индикатор для TradingView генерирует сигналы покупки и продажи на 15-минутном таймфрейме, используя фильтрацию с других таймфреймов (5M, 30M, 1M).
🔹 Типы сигналов:
✅ 15/5B & 15/5S – RSI 15M с фильтром 5M
✅ 15/30/1B & 15/30/1S – RSI 15M с фильтрами 30M и 1M
✅ 15B & 15S – RSI 15M без фильтров
🔹 Как это работает:
Сигналы отображаются как цветные треугольники на графике.
Подписи показывают тип сигнала (например, 15/5B, 15S).
Алерты уведомляют трейдера о появлении сигнала.
🚀 Идеально для краткосрочной торговли с подтверждением RSI на нескольких таймфреймах!
📌 O'zbekcha
Ko'p vaqt oralig‘idagi RSI signallari
Ushbu TradingView indikatori 15 daqiqalik vaqt oralig‘ida RSI asosida sotib olish va sotish signallarini yaratadi. Bundan tashqari, boshqa vaqt oralig‘idagi (5M, 30M, 1M) RSI filtrlarini ham hisobga oladi.
🔹 Signal turlari:
✅ 15/5B & 15/5S – 5M bilan filtrlangan RSI 15M
✅ 15/30/1B & 15/30/1S – 30M va 1M bilan filtrlangan RSI 15M
✅ 15B & 15S – Filtrsiz RSI 15M
🔹 Qanday ishlaydi?
Signallar rangli uchburchaklar shaklida ko‘rsatiladi.
Yozuvlar signal turini ko‘rsatadi (masalan, 15/5B, 15S).
Xabarnomalar yangi signal paydo bo‘lganda treyderni ogohlantiradi.
🚀 Ko‘p vaqt oralig‘ida RSI tasdig‘i bilan qisqa muddatli savdo uchun ideal!
3x Supertrend + EMA200 Signal Buy/Sell [nsen]The indicator uses signals from three Supertrend lines to determine whether to trade Buy or Sell, with the assistance of a moving average for bias.
Buy/Sell signals are generated when the conditions are met:
A Buy signal is triggered when all three Supertrend lines indicate a bullish trend and are above the EMA.
A Sell signal is triggered when all three Supertrend lines indicate a bearish trend and are below the EMA.
Indicator ใช้สัญญาณจาก Supertrend ทั้งหมด 3 เส้น โดยใช้ในการกำหนดว่าจะเลือกเทรด Buy หรือ Sell โดยการใช้ moveing average เข้ามาช่วยในการ bias
แสดงสัญญาณ Buy/Sell เมื่อเข้าเงื่อนไข
- Supertrend ทั้ง 3 เส้นเป็นสัญญาณ Bullish และอยู่เหนือเส้น EMA จะเปิดสัญญาณ Buy
- Supertrend ทั้ง 3 เส้นเป็นสัญญาณ Bearish และอยู่ใต้เส้น EMA จะเปิดสัญญาณ Sell
