TCP | Market Session | Session Analyzer📌 TCP | Market Session Indicator | Crypto Version
A powerful, real-time market session visualization tool tailored for crypto traders. Track the heartbeat of Asia, Europe, and US trading hours directly on your chart with live session boxes, behavioral analysis, liquidity grab detection, and countdown timers. Know when the action starts, how the market behaves, and where the traps lie.
🔰 Introduction:
Trade the Right Hours with the Right Tools
Time matters in trading. Most significant moves happen during key sessions—and knowing when and how each session unfolds can give you a sharp edge. The TCP Market Session Indicator, developed by Trade City Pro (TCP), puts professional session tracking and behavioral insights at your fingertips.
Whether you're a scalper or swing trader, this indicator gives you the timing context to enter and exit trades with greater confidence and clarity.
🕒 Core Features
• Live Session Boxes :
Highlight active ranges during Asia, Europe, and US sessions with dynamic high/low updates.
• Session Start/End Labels :
Know exactly when each session begins and ends plotted clearly on your chart with context.
• Session Behavior Analysis :
At the end of each session, the indicator classifies the price action as:
- Trend Up
- Trend Down
- Consolidation
- Manipulation
• Liquidity Grab Detection: Automatically detects possible stop hunts (fake breakouts) and marks them on the chart with precision filters (volume, ATR, reversal).
• Session Countdown Table: A live dashboard showing:
- Current active session
- Time left in session
- Upcoming session and how many minutes until it starts
- Utility time converter (e.g. 90 min = 01:30)
• Vertical Session Lines: Visualize past and upcoming session boundaries with customizable history and future range.
• Multi-Day Support: Draw session ranges for previous, current, and future days for better backtesting and forecasting.
⚙️ Settings Panel
Customize everything to fit your trading style and schedule:
• Session Time Settings:
Set the opening and closing time for each session manually using UTC-based minute inputs.
→ For example, enter Asia Start: 0, Asia End: 480 for 00:00–08:00 UTC.
This gives full flexibility to adjust session hours to match your preferred market behavior.
• Enable or Disable Elements:
Toggle the visibility of each session (Asia, Europe, US), as well as:
- Session Boxes
- Countdown Table
- Session Lines
- Liquidity Grab Labels
• Timezone Selection:
Choose between using UTC or your chart’s local timezone for session calculations.
• Customization Options:
Select number of past and future days to draw session data
Adjust vertical line transparency
Fine-tune label offset and spacing for clean layout
📊 Smart Session Boxes
Each session box tracks high, low, open, and close in real time, providing visual clarity on market structure. Once a session ends, the box closes, and the behavior type is saved and labeled ideal for spotting patterns across sessions.
• Asia: Green Box
• Europe: Orange Box
• US: Blue Box
💡 Why Use This Tool?
• Perfect Timing: Don’t get chopped in low-liquidity hours. Focus on sessions where volume and volatility align.
• Pattern Recognition: Study how price behaves session-to-session to build better strategies.
• Trap Detection: Spot manipulation moves (liquidity grabs) early and avoid common retail pitfalls.
• Macro Session Mapping: Use as a foundational layer to align trades with market structure and news cycles.
🔍 Example Use Case
You're watching BTC at 12:45 UTC. The indicator tells you:
The Asia session just ended (label shows “Asia Session End: Trend Up”)
Europe session starts in 15 minutes
A liquidity grab just triggered at the previous high—label confirmed
Now you know who’s active, what the market just did, and what’s about to start—all in one glance.
✅ Why Traders Trust It
• Visual & Intuitive: Fully chart-based, no clutter, no guessing
• Crypto-Focused: Designed specifically for 24/7 crypto markets (not outdated forex models)
• Non-Repainting: All labels and boxes stay as printed—no tricks
• Reliable: Tested across multiple exchanges, pairs, and timeframes
🧩 Built by Trade City Pro (TCP)
The TCP Market Session Indicator is part of a suite of professional tools used by over 150,000 traders. It’s coded in Pine Script v6 for full compatibility with TradingView’s latest capabilities.
🔗 Resources
• Tutorial: Learn how to analyze sessions like a pro in our TradingView guide:
"TradeCityPro Academy: Session Mapping & Liquidity Traps"
• More Tools: Explore our full library of indicators on
"stop hunt"に関するスクリプトを検索

Gold Killzone Bias Suite🟡 Gold Killzone Bias Suite
The Gold Killzone Bias Suite is an advanced institutional-grade tool designed to generate high-confidence directional bias for XAU/USD (Gold) during the London and New York killzones.
Built for traders using a structured, confluence-driven approach, this tool blends price action, smart money principles, momentum, and volume into a real-time bias engine with a clean, easy-to-read dashboard.
🔧 Key Features
🕰️ Session-Based Bias (London / New York)
Independent bias calculation per session
Killzone times customizable with timezone support
Background highlighting (blue/red) for each session
📊 VWAP Engine
Reclaim & rejection detection
VWAP deviation alerts
Daily HTF VWAP integration
Score impact based on VWAP behaviour
📉 Market Structure (CHoCH / BOS)
Detects swing highs/lows
Labels bullish/bearish CHoCHs
Structure score contributes to session bias
💧 Liquidity Grabs
Detects stop hunts above highs / below lows
Confirms with candle rejection (body % filter)
Plots labels and adds to bias scoring
⚡ Momentum Filters
RSI: Bullish >55, Bearish <45
MACD: Histogram + Signal Line crossovers
Combined momentum score used in bias
🧠 Smart Money Proximity
Optional FVG/OB score toggle (placeholder for custom logic)
Adds static confluence for proximity-based setups
⏫ Higher Time Frame Context
Daily VWAP comparison
4H high/low structure breaks
Adds trend score to current session bias
🧠 How Bias Works
The suite uses a scoring model. Each confluence adds or subtracts points:
VWAP reclaim/reject: ±30
CHoCH/BOS: ±30
Liquidity grab: ±20
RSI/MACD: ±10
FVG/OB Proximity: +10
Daily VWAP trend: ±10
H4 Trend Break: ±10
Final Bias:
Bullish if score ≥ +20
Bearish if score ≤ -20
Neutral if between -19 and +19
A confidence % (capped at 100) is also shown, along with the contributing confluences (VWAP, Structure, Liquidity, etc.).
📋 Dashboard
A real-time dashboard shows for each session:
Session name and time
Bias (Bullish / Bearish / Neutral)
Confidence (%)
Confluences used
Position can be moved (Top Left, Top Right, etc.). Designed to be unobtrusive yet informative.
🧪 Best Practices
Use on 15m / 5m charts for intraday setups
Confirm with D1 or H4 structure for directional context
Combine with OB/FVG zones or SMT for entries
Use Trading View alerts for bias flips or liquidity grabs (custom logic can be added)
Bar Replay compatible for back testing and journaling bias shifts
🔐 Notes
Does not generate trade signals or alerts by default
Focused on bias generation and confluence stacking
Compatible with funded account trading models
📈 Built for traders who want a systematic, score-based approach to identifying directional edge in high-volume gold sessions.

Ayman – Full Smart Suite Auto/Manual Presets + PanelIndicator Name
Ayman – Full Smart Suite (OB/BoS/Liq/FVG/Pin/ADX/HTF) + Auto/Manual Presets + Panel
This is a multi-condition trading tool for TradingView that combines advanced Smart Money Concepts (SMC) with classic technical filters.
It generates BUY/SELL signals, draws Stop Loss (SL) and Take Profit (TP1, TP2) levels, and displays a control panel with all active settings and conditions.
1. Main Features
Smart Money Concepts Filters:
Order Block (OB) Zones
Break of Structure (BoS)
Liquidity Sweeps
Fair Value Gaps (FVG)
Pin Bar patterns
ADX filter
Higher Timeframe EMA filter (HTF EMA)
Two Operating Modes:
Auto Presets: Automatically adjusts all settings (buffers, ATR multipliers, RR, etc.) based on your chart timeframe (M1/M5/M15).
Manual Mode: Fully customize all parameters yourself.
Trade Management Levels:
Stop Loss (SL)
TP1 – partial profit
TP2 – full profit
Visual Panel showing:
Current settings
Filter status
Trend direction
Last swing levels
SL/TP status
Alerts for BUY/SELL conditions
2. Entry Conditions
A BUY signal is generated when all these are true:
Trend: Price above EMA (bullish)
HTF EMA: Higher timeframe trend also bullish
ADX: Trend strength above threshold
OB: Price in a valid bullish Order Block zone
BoS: Structure break to the upside
Liquidity Sweep: Sweep of recent lows in bullish context
FVG: A bullish Fair Value Gap is present
Pin Bar: Bullish Pin Bar pattern detected (if enabled)
A SELL signal is generated when the opposite conditions are met.
3. Stop Loss & Take Profits
SL: Placed just beyond the last swing low (BUY) or swing high (SELL), with a small ATR buffer.
TP1: Partial profit target, defined as a ratio of the SL distance.
TP2: Full profit target, based on Reward:Risk ratio.
4. How to Use
Step 1 – Apply Indicator
Open TradingView
Go to your chart (recommended: XAUUSD, M1/M5 for scalping)
Add the indicator script
Step 2 – Choose Mode
AUTO Mode: Leave “Use Auto Presets” ON – parameters adapt to your timeframe.
MANUAL Mode: Turn Auto OFF and adjust all lengths, buffers, RR, and filters.
Step 3 – Filters
In the Filters On/Off section, enable/disable specific conditions (OB, BoS, Liq, FVG, Pin Bar, ADX, HTF EMA).
Step 4 – Trading the Signals
Wait for a BUY or SELL arrow to appear.
SL and TP levels will be plotted automatically.
TP1 can be used for partial close and TP2 for full exit.
Step 5 – Alerts
Set alerts via BUY Signal or SELL Signal to receive notifications.
5. Best Practices
Scalping: Use M1 or M5 with AUTO mode for gold or forex pairs.
Swing Trading: Use M15+ and adjust buffers/ATR manually.
Combine with price action confirmation before entering trades.
For higher accuracy, wait for multiple filter confirmations rather than acting on the first arrow.
6. Summary Table
Feature Purpose Can Disable?
Order Block Finds key supply/demand zones ✅
Break of Structure Detects trend continuation ✅
Liquidity Sweep Finds stop-hunt moves ✅
Fair Value Gap Confirms imbalance entries ✅
Pin Bar Price action reversal filter ✅
ADX Trend strength filter ✅
HTF EMA Higher timeframe confirmation ✅

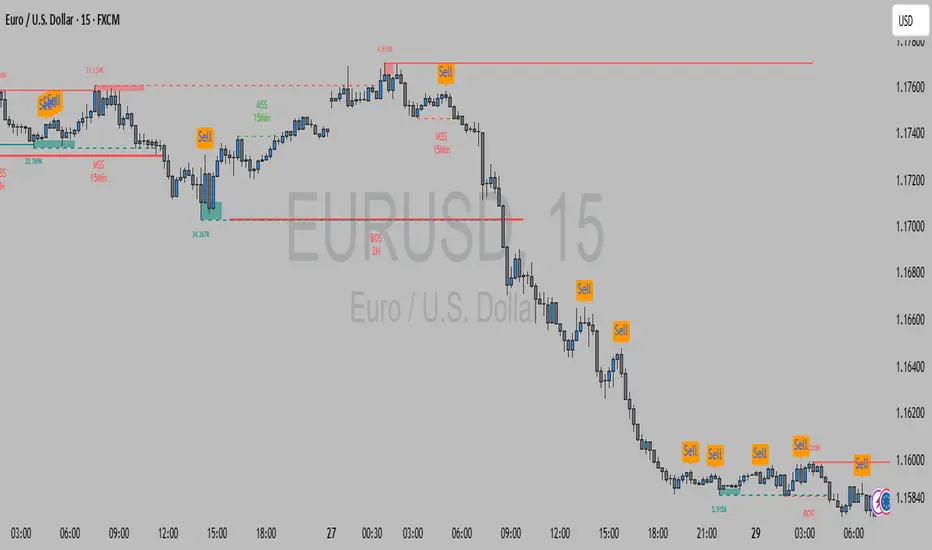
FMX Trend Confirmation - No Reversals🔍 FMX Continuation Signal – No Reversals
Powered by the FMX Model (Fundamentals Meet Execution)
This indicator is designed to capture high-probability continuation trades only, avoiding risky reversals. It confirms buy or sell signals based on:
✅ 15-Minute Structure Shift Confirmation
✅ Liquidity Sweeps (stop hunts beyond recent highs/lows)
✅ Trend Validation using HTF SMA (default: 15min)
✅ Second Candle Close inside the sweep range — FMX-grade precision
📈 Green “Buy” labels appear when:
Liquidity is swept below recent lows
Price closes back inside the range
The higher timeframe trend is bullish
📉 Orange “Sell” labels appear when:
Liquidity is swept above recent highs
Price closes back inside the range
The higher timeframe trend is bearish
🛡️ No reversal signals are plotted. This tool is meant for traders who follow the trend with smart money logic, inspired by FMX principles.
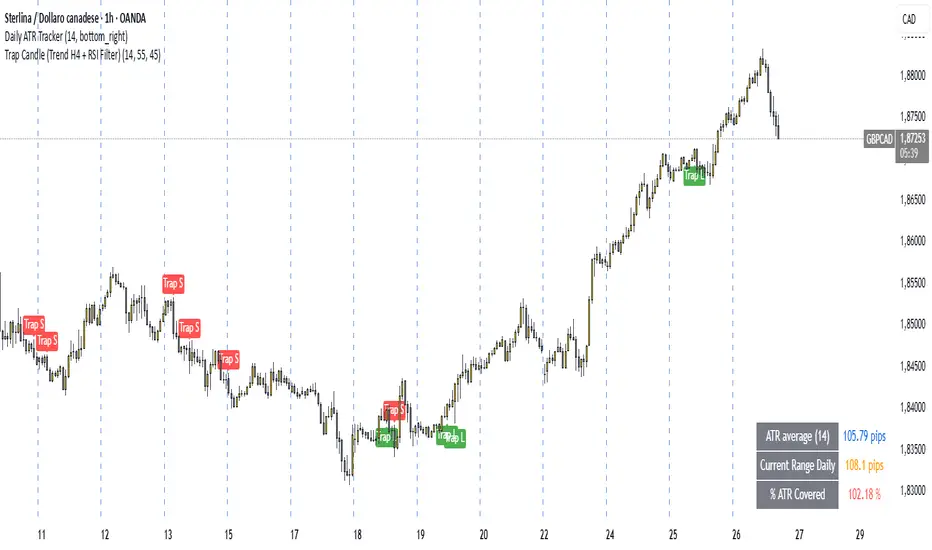
Trap Candle (Trend H4 + RSI Filter)🔍 Trap Candle (Trend H4 + RSI Filter)
Description:
The Trap Candle indicator is designed to identify a specific and powerful two-candle price action pattern that often signals a false breakout followed by a strong reversal. It combines pure price action with two objective filters to increase signal quality and trend alignment.
📊 Pattern Logic:
Bullish Trap: The current candle breaks the previous candle’s low, but closes above its high (and is bullish).
Bearish Trap: The current candle breaks the previous candle’s high, but closes below its low (and is bearish).
This pattern often reveals institutional traps or stop hunts before directional movement.
🧠 Trend Filter (H4):
Ensures long signals occur only when the H4 close is higher than the previous H4 close (uptrend).
Ensures short signals occur only in a H4 downtrend.
Designed to align intraday entries (M15, H1) with higher timeframe momentum.
💪 RSI Confirmation:
Includes a configurable RSI filter on the current timeframe.
Only long signals are shown when RSI is above a user-defined threshold (e.g. 55).
Only short signals are shown when RSI is below a user-defined threshold (e.g. 45).
⚙️ Key Features:
Full customization of RSI period and thresholds.
Clean, visual signal plotting on the chart (with “Trap L” or “Trap S” labels).
Built-in alerts for both long and short trap candle setups.
Perfect for traders who want to trade smart reversals with trend and momentum confirmation.
✅ Recommended Timeframes:
M15 and H1 (entry)
Uses H4 for trend bias
If you’re looking to filter out noise and spot only the highest quality reversal setups, the Trap Candle (Trend H4 + RSI Filter) is a solid tool for any price action-based strategy.
CoffeeShopCrypto Supertrend Liquidity EngineMost SuperTrend indicators use fixed ATR multipliers that ignore context—forcing traders to constantly tweak settings that rarely adapt well across timeframes or assets.
This Supertrend is a nodd to and a more completion of the work
done by Olivier Seban ( @olivierseban )
This version replaces guesswork with an adaptive factor based on prior session volatility, dynamically adjusting stops to match current conditions. It also introduces liquidity-aware zones, real-time strength histograms, and a visual control panel—making your stoploss smarter, more responsive, and aligned with how the market actually moves.
📏 The Multiplier Problem & Adaptive Factor Solution
Traditional SuperTrend indicators rely on fixed ATR multipliers—often arbitrary numbers like 1.5, 2, or 3. The issue? No logical basis ties these values to actual market conditions. What works on a 5-minute Nasdaq chart fails on a daily EUR/USD chart. Traders spend hours tweaking multipliers per asset, timeframe, or volatility phase—and still end up with stoplosses that are either too tight or too loose. Worse, the market doesn’t care about your setting—it behaves according to underlying volatility, not your parameter.
This version fixes that by automating the multiplier selection entirely. It uses a 4-zone model based on the current ATR relative to the previous session’s ATR, dynamically adjusting the SuperTrend factor to match current volatility. It eliminates guesswork, adapts to the asset and timeframe, and ensures you’re always using a context-aware stoploss—one that evolves with the market instead of fighting it.
ATR EXAMPLE
Let’s say prior session ATR = 2.00
Now suppose current ATR = 0.32
This places us in Zone 1 (Very Low Volatility)
It doesn’t imply "overbought" or "oversold" — it tells you the market is moving very little, which often means:
Lower risk | Smaller stops | Smaller opportunities (and losses)
🔁 Liquidity Zones vs. Arbitrary Pullbacks
The standard SuperTrend stop loss line often looks like price “barely misses it” before continuing its trend. Traders call this "stop hunting," but what’s really happening is liquidity collection—price pulls back into a zone rich in orders before continuing. The problem? The old SuperTrend doesn’t show this zone. It only draws the outer limit, leaving no visual cue for where entries or continuation moves might realistically originate.
This script introduces 2 levels in the Liquidity Zone. One for Support and one for Stophunts, which draw dynamically between the current price and the SuperTrend line. These levels reflect where the market is most likely to revisit before resuming the trend. By visualizing the area just above the Supertrend stop loss, you can anticipate pullbacks, spot ideal re-entries, and avoid premature exits. This bridges the gap between mechanical stoploss logic and real-world liquidity behavior.
⏳ Prior Session ATR vs. Live ATR
Using real-time ATR to determine movement potential is like driving by looking in your rearview mirror. It’s reactive, not predictive. Traders often base decisions on live ATR, unaware that today’s range is still unfolding —creating volatility mismatches between what’s calculated and what actually matters. Since ATR reflects range, calculating it mid-session gives an incomplete and misleading picture of true volatility.
Instead, this system uses the ATR from the previous session , anchoring your volatility assumptions in a fully-formed price structure . It tells you how far price moved in the last full market phase—be it London, New York, or Tokyo—giving you a more reliable gauge of expected range today. This is a smarter way to estimate how far price could move rather than how far it has moved.
The Smoothing function will take the ATR, Support, Resistance, Stophunt Levels, and the Moving Avearage and smooth them by the calculation you choose.
It will also plot a moving average on your chart against closing prices by the smoothing function you choose.
🧭 Scalping vs. Trending Modes
The market moves in at least 4 phases. Trending, Ranging, Consolidation, Distribution.
Every trader has a different style —some scalp low-volatility moves during off-hours, while others ride macro trends across days. The problem with classic SuperTrend? It treats every market condition the same. A fixed system can’t possibly provide proper stoploss spacing for both a fast scalp and a long-term swing. Traders are forced to rebuild their system every time the market changes character or the session shifts.
This version solves that with a simple toggle:
Scalping or Trend Mode . With one switch, it inverts the logic of the adaptive factor to either tighten or loosen your trailing stops. During low-liquidity hours or consolidation phases, Scalping Mode offers snug stoplosses. During expansion or clear directional bias.
Trend Mode lets the trade breathe. This is flexibility built directly into the logic—not something you have to recalibrate manually.
📉 Histogram Oscillator for Move Strength
In legacy indicators, there’s no built-in way to gauge when the move is losing power . Traders rely on price action or momentum indicators to guess if a trend is fading. But this adds clutter, lag, and often contradiction. The classic SuperTrend doesn’t offer insight into how strong or weak the current trend leg is—only whether price has crossed a line.
This version includes a Trending Liquidity Histogram —a histogram that shows whether the liquidity in the SuperTrend zone is expanding or compressing. When the bars weaken or cross toward zero, it signals liquidity exhaustion . This early warning gives you time to prep for reversals or anticipate pullbacks. It even adapts visually depending on your trading mode, showing color-coded signals for scalping vs. trending behavior. It's both a strength gauge and a trade timing tool—built into your stoploss logic.
Histogram in Scalping Mode
Histogram in Trending Mode
📊 Visual Table for Real-Time Clarity
A major issue with custom indicators is opacity —you don’t always know what settings or values are currently being used. Even worse, if your dynamic logic changes mid-trade, you may not notice unless you go digging into the code or logs. This can create confusion, especially for discretionary traders.
This SuperTrend solves it with a clean visual summary table right on your chart. It shows your current ATR value, adaptive multiplier, trailing stop level, and whether a new zone size is active. That means no surprises and no second-guessing—everything important is visible and updated in real-time.

AP Session Liquidity with EQH/EQL and Previous DayThis indicator plots key intraday session highs and lows, along with essential market structure levels, to help traders identify areas of interest, potential liquidity zones, and high-probability trade setups. It includes the Asia Session High and Low (typically 00:00–08:00 UTC), London Session High and Low (08:00–12:00 UTC), New York AM Session High and Low (12:00–15:00 UTC), and New York Lunch High and Low (15:00–17:00 UTC). Additionally, it displays the Previous Day’s High and Low for context on recent price action, as well as automatically detected Equal Highs and Lows based on configurable proximity settings to highlight potential liquidity pools or engineered price levels. These session levels are widely used by institutional traders and are critical for analyzing market behavior during time-based volatility windows. Traders can use this indicator to anticipate breakouts, fakeouts, and reversals around session boundaries—such as liquidity grabs at Asia highs/lows before the London or New York sessions—or to identify key consolidation and expansion zones. Equal Highs and Lows serve as magnets for price, offering insight into potential stop hunts or inducement zones. This tool is ideal for day traders, scalpers, and smart money concept practitioners, and includes full customization for session timings, color schemes, line styles, and alert conditions. Whether you're trading price action, ICT concepts, or supply and demand, this indicator provides a powerful framework for intraday analysis.

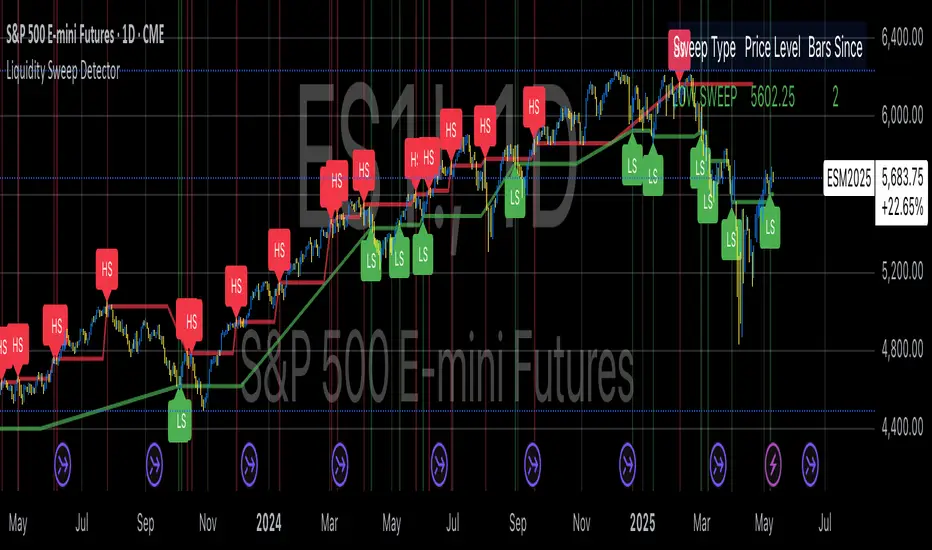
Liquidity Sweep DetectorThe Liquidity Sweep Detector represents a technical analysis tool specifically designed to identify market microstructure patterns typically associated with institutional trading activity. According to Harris (2003), institutional traders frequently employ tactics where they momentarily break through price levels to trigger stop orders before redirecting the market in the opposite direction. This phenomenon, commonly referred to as "stop hunting" or "liquidity sweeping," constitutes a significant aspect of institutional order flow analysis (Osler, 2003). The current implementation provides retail traders with a means to identify these patterns, potentially aligning their trading decisions with institutional movements rather than becoming victims of such strategies.
Osler's (2003) research documents how stop-loss orders tend to cluster around significant price levels, creating concentrations of liquidity. Taylor (2005) argues that sophisticated institutional participants systematically exploit these liquidity clusters by inducing price movements that trigger these orders, subsequently profiting from the ensuing price reaction. The algorithmic detection of such patterns involves several key processes. First, the indicator identifies swing points—local maxima and minima—through comparison with historical price data within a definable lookback period. These swing points correspond to what Bulkowski (2011) describes as "significant pivot points" that frequently serve as liquidity zones where stop orders accumulate.
The core detection algorithm utilizes a multi-stage process to identify potential sweeps. For high sweeps, it monitors when price exceeds a previous swing high by a specified threshold percentage, followed by a bearish candle that closes below the original swing high level. Conversely, for low sweeps, it detects when price drops below a previous swing low by the threshold percentage, followed by a bullish candle closing above the original swing low. As noted by Lo and MacKinlay (2011), these price patterns often emerge when large institutional players attempt to capture liquidity before initiating significant directional moves.
The indicator maintains historical arrays of detected sweep events with their corresponding timestamps, enabling temporal analysis of market behavior following such events. Visual elements include horizontal lines marking sweep levels, background color highlighting for sweep events, and an information table displaying active sweeps with their corresponding price levels and elapsed time since detection. This visualization approach allows traders to quickly identify potential institutional activity without requiring complex interpretation of raw price data.
Parameter customization includes adjustable lookback periods for swing point identification, sweep threshold percentages for signal sensitivity, and display duration settings. These parameters allow traders to adapt the indicator to various market conditions and timeframes, as markets demonstrate different liquidity characteristics across instruments and periods (Madhavan, 2000).
Empirical studies by Easley et al. (2012) suggest that retail traders who successfully identify and act upon institutional liquidity sweeps may achieve superior risk-adjusted returns compared to conventional technical analysis approaches. However, as cautioned by Chordia et al. (2008), such patterns should be considered within broader market context rather than in isolation, as their predictive value varies significantly with overall market volatility and liquidity conditions.
References:
Bulkowski, T. (2011). Encyclopedia of Chart Patterns (2nd ed.). John Wiley & Sons.
Chordia, T., Roll, R., & Subrahmanyam, A. (2008). Liquidity and market efficiency. Journal of Financial Economics, 87(2), 249-268.
Easley, D., López de Prado, M., & O'Hara, M. (2012). Flow Toxicity and Liquidity in a High-frequency World. The Review of Financial Studies, 25(5), 1457-1493.
Harris, L. (2003). Trading and Exchanges: Market Microstructure for Practitioners. Oxford University Press.
Lo, A. W., & MacKinlay, A. C. (2011). A Non-Random Walk Down Wall Street. Princeton University Press.
Madhavan, A. (2000). Market microstructure: A survey. Journal of Financial Markets, 3(3), 205-258.
Osler, C. L. (2003). Currency Orders and Exchange Rate Dynamics: An Explanation for the Predictive Success of Technical Analysis. Journal of Finance, 58(5), 1791-1820.
Taylor, M. P. (2005). Official Foreign Exchange Intervention as a Coordinating Signal in the Dollar-Yen Market. Pacific Economic Review, 10(1), 73-82.
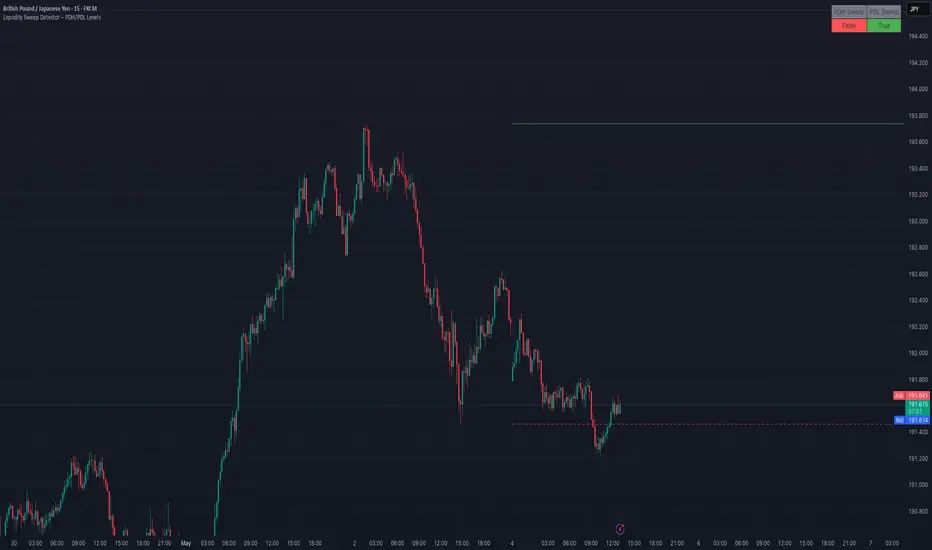
Liquidity Sweep Detector – PDH/PDL LevelsPrevious Day High/Low Liquidity Sweep Detector (Intraday Accurate)
This indicator tracks the previous day's high and low using intraday data, rather than the daily candle, ensuring precise sweep detection across lower timeframes (15m to 4H).
It monitors for liquidity sweeps—moments when price briefly moves above the previous high or below the previous low—and visually marks these events on the chart.
Key Features
Intraday-accurate PDH/PDL tracking
Real-time sweep detection
On-chart labels marking sweep events
Toggleable table showing sweep status
Alert conditions for PDH/PDL sweep triggers
Best For
Traders who use Smart Money Concepts (SMC), liquidity-based strategies, or look for stop hunts and reversal zones tied to key prior-day levels.
Works well across FX, crypto, and indices on 15m, 1H, and 4H charts.
ICT Macro Zone Boxes w/ Individual H/L Tracking v3.1ICT Macro Zones (Grey Box Version
This indicator dynamically highlights key intraday time-based macro sessions using a clean, minimalistic grey box overlay, helping traders align with institutional trading cycles. Inspired by ICT (Inner Circle Trader) concepts, it tracks real-time highs and lows for each session and optionally extends the zone box after the session ends — making it a precision tool for intraday setups, order flow analysis, and macro-level liquidity sweeps.
### 🔍 **What It Does**
- Plots **six predefined macro sessions** used in Smart Money Concepts:
- AM Macro (09:50–10:10)
- London Close (10:50–11:10)
- Lunch Macro (11:30–13:30)
- PM Macro (14:50–15:10)
- London SB (03:00–04:00)
- PM SB (15:00–16:00)
- Each zone:
- **Tracks high and low dynamically** throughout the session.
- **Draws a consistent grey shaded box** to visualize price boundaries.
- **Displays a label** at the first bar of the session (optional).
- **Optionally extends** the box to the right after the session closes.
### 🧠 **How It Works**
- Uses Pine Script arrays to define each session’s time window, label, and color.
- Detects session entry using `time()` within a New York timezone context.
- High/Low values are updated per bar inside the session window.
- Once a session ends, the box is optionally closed and fixed in place.
- All visual zones use a standardized grey tone for clarity and consistency across charts.
### 🛠️ **Settings**
- **Shade Zone High→Low:** Enable/disable the grey macro box.
- **Extend Box After Session:** Keep the zone visible after it ends.
- **Show Entry Label:** Display a label at the start of each session.
### 🎯 **Why This Script is Unique**
Unlike basic session markers or colored backgrounds, this tool:
- Focuses on **macro moments of liquidity and reversal**, not just open/close times.
- Uses **per-session logic** to individually track price behavior inside key time windows.
- Supports **real-time high/low tracking and clean zone drawing**, ideal for Smart Money and ICT-style strategies.
Perfect — based on your list, here's a **bundle-style description** that not only explains the function of each script but also shows how they **work together** in a Smart Money/ICT workflow. This kind of cross-script explanation is exactly what TradingView wants to see to justify closed-source mashups or interdependent tools.
---
📚 ICT SMC Toolkit — Script Integration Guide
This set of advanced Smart Money Concept (SMC) tools is designed for traders who follow ICT-based methodologies, combining liquidity theory, time-based precision, and engineered confluences for high-probability trades. Each indicator is optimized to work both independently and synergistically, forming a comprehensive trading framework.
---
First FVG Custom Time Range
**Purpose:**
Plots the **first Fair Value Gap (FVG)** that appears within a defined session (e.g., NY Kill Zone, Custom range). Includes optional retest alerts.
**Best Used With:**
- Use with **ICT Macro Zones (Grey Box Version)** to isolate FVGs during high-probability times like AM Macro or PM SB.
- Combine with **Liquidity Levels** to assess whether FVGs form near swing points or liquidity voids.
---
ICT SMC Liquidity Grabs and OB s
**Purpose:**
Detects **liquidity grabs** (stop hunts above/below swing highs/lows) and **bullish/bearish order blocks**. Includes optional Fibonacci OTE levels for sniper entries.
**Best Used With:**
- Use with **ICT Turtle Soup (Reversal)** for confirmation after a liquidity grab.
- Combine with **Macro Zones** to catch order blocks forming inside timed macro windows.
- Match with **Smart Swing Levels** to confirm structure breaks before entry.
ICT SMC Liquidity Levels (Smart Swing Lows)
**Purpose:**
Automatically marks swing highs/lows based on user-defined lookbacks. Tracks whether those levels have been breached or respected.
**Best Used With:**
- Combine with **Turtle Soup** to detect if a swing level was swept, then reversed.
- Use with **Liquidity Grabs** to confirm a grab occurred at a meaningful structural point.
- Align with **Macro Zones** to understand when liquidity events occur within macro session timing.
ICT Turtle Soup (Liquidity Reversal)
**Purpose:**
Implements the classic ICT Turtle Soup model. Looks for swing failure and quick reversals after a liquidity sweep — ideal for catching traps.
Best Used With:
- Confirm with **Liquidity Grabs + OBs** to identify institutional activity at the reversal point.
- Use **Liquidity Levels** to ensure the reversal is happening at valid previous swing highs/lows.
- Amplify probability when pattern appears during **Macro Zones** or near the **First FVG**.
ICT Turtle Soup Ultimate V2
**Purpose:**
An enhanced, multi-layer version of the Turtle Soup setup that includes built-in liquidity checks, OTE levels, structure validation, and customizable visual output.
**Best Used With:**
- Use as an **entry signal generator** when other indicators (e.g., OBs, liquidity grabs) are aligned.
- Pair with **Macro Zones** for high-precision timing.
- Combine with **First FVG** to anticipate price rebalancing before explosive moves.
---
## 🧠 Workflow Example:
1. **Start with Macro Zones** to focus only on institutional trading windows.
2. Look for **Liquidity Grabs or Swing Sweeps** around key highs/lows.
3. Check for a **Turtle Soup Reversal** or **Order Block Reaction** near that level.
4. Confirm confluence with a **Fair Value Gap**.
5. Execute using the **OTE level** from the Liquidity Grabs + OB script.
---
Let me know which script you want to publish first — I’ll tailor its **individual TradingView description** and flag its ideal **“Best Used With” partners** to help users see the value in your ecosystem.

ICT SMC Liquidity Grabs and OBsICT SMC Liquidity Grabs + Order Blocks + Fibonacci OTE Levels
A High-Probability Entry Engine for Smart Money Concept Traders
This script combines three powerful Smart Money Concepts (SMC) into a single tool: Liquidity Grabs, Order Block Zones, and Fibonacci OTE Levels, allowing traders to identify institutional entry models with clean, rule-based visual signals.
It’s designed to simplify SMC trading by highlighting confluence zones where price is likely to reverse or continue — with clear visual zones, entry arrows, and take profit projections.
🔍 What This Script Does:
Detects Liquidity Grabs
Identifies when price sweeps above/below the highest high or lowest low within a user-defined lookback period and closes back inside.
Plots orange labels on the chart to signal potential liquidity events (LG-H / LG-L).
Plots Order Blocks After Liquidity Grabs
After a liquidity grab, the script looks for displacement candles (strong bullish or bearish moves) and draws highlighted OB zones extending several bars to the right.
These zones represent potential institutional footprints for price reversals.
Draws Fibonacci OTE Levels (Optimal Trade Entry)
Uses recent swing high and low pivots to automatically calculate OTE zones (default: 62% and 75% retracement levels).
Draws these retracement zones for both bullish and bearish setups.
Marks Valid OTE Entry Zones
Buy/Sell zones only trigger when:
A liquidity grab occurs,
Price enters the OTE zone,
And a strong confirming candle is present.
Plots green/red arrows for valid buy/sell OTE entries.
Auto-Draws Take Profit Zones
TP1 = Previous swing high/low
TP2 = Risk-based R-multiplied extension (e.g., 1.5R — customizable)
Alerts
Triggers alerts when valid buy or sell OTE setups are detected.
⚙️ Customization Features:
Toggle each feature: Liquidity Grabs, Order Blocks, Fibonacci OTE levels
Set Fibonacci retracement percentages (e.g., 0.62 / 0.75)
Adjust lookback window for liquidity detection
Customize the take-profit multiplier (R-based)
Full control over visuals: colors, labels, and lines
💡 How to Use:
Use this script to scan for high-confluence trade setups based on Smart Money principles.
Combine with session timing (e.g., New York open), major swing structure, or Kill Zone windows for maximum edge.
Look for arrows inside OB zones or OTE levels following liquidity sweeps for cleaner entries.
🔗 Works Best With:
✅ First FVG — Opening Range Fair Value Gap Detector: Identify early inefficiencies to set the narrative for the day.
✅ Liquidity Levels — Smart Swing Lows: Spot key structural lows that can fuel stop hunts and reversals.
✅ ICT Turtle Soup — Liquidity Reversal: Add a classic reversal pattern to your toolkit to catch fakeouts cleanly.
Together, these tools build a complete Smart Money ecosystem for entry precision, risk management, and price behavior forecasting.

Liquidity Fracture DetectorThe Liquidity Fracture Detector is an advanced tool designed to identify micro-liquidity traps and structural fakeouts on intraday charts. These occur when the market appears to break out, only to quickly reverse — often triggered by stop hunts, inefficient fills, or manipulated order flow.
The script combines volume spikes, volatility anomalies, and price structure breaks to signal "fractures" — points where the market temporarily breaks its behavior, often followed by strong reversals or trend accelerations.
Detection logic in the script:
Volume spike greater than 2x the average (adjustable)
Volatility spike: candle range is > 1.5x the average
Extreme wicks: wick is larger than the candle body (a classic trap signal)
Structure break: price breaks previous high/low but closes back within the old range
Combine these elements → a “fracture” is marked
Visual representation:
Red background = potential bull trap (fake breakout to the upside)
Green background = potential bear trap (fake breakdown to the downside)
A label appears at each fracture: “Echo” with the number of previous hits
Ideal use cases:
Intraday trading (1m, 5m, 15m)
Crypto, indices, futures, and forex
Detecting reactive zones where the market takes a false direction
Confluence with S/R zones, order blocks, or liquidity pools
Fully customizable:
Volume and range sensitivity
Heatmap intensity
Toggle labels on/off
Note:
This script is intended to support discretionary analysis. It does not provide buy or sell signals and is not an automated strategy. Combine it with your own price action or order flow setup for optimal results.

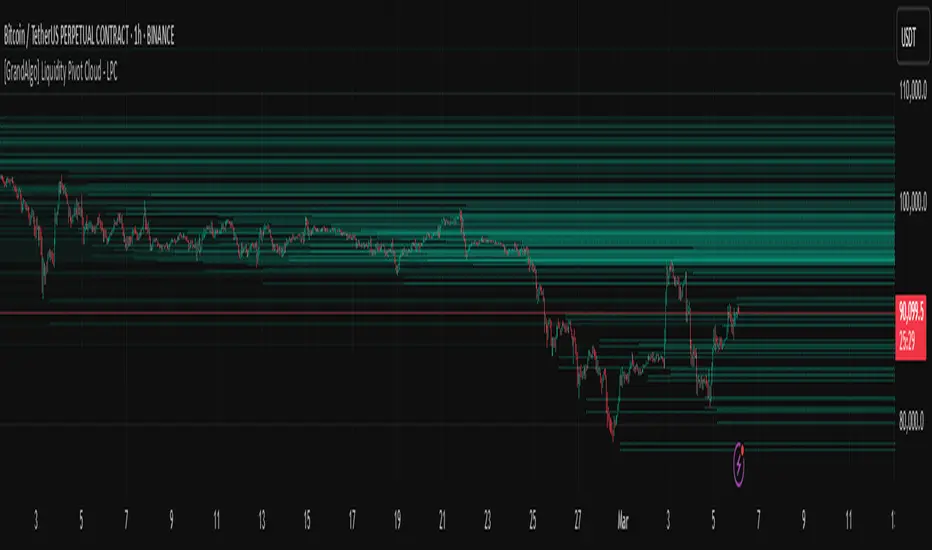
[GrandAlgo] Liquidity Pivot Cloud - LPCLiquidity Pivot Cloud (LPC) is a visualization tool that extends all pivot levels to the right, creating a structured liquidity map across the chart. Instead of treating pivot points as static levels, LPC transforms them into a dynamic cloud, highlighting key areas where price has historically reacted.
Key Features:
Extended Pivot Levels – Automatically stretches all pivot highs and lows, forming a continuous liquidity zone.
Clear Structure – Provides an organized view of price action, making it easy to identify reaction zones.
Dynamic Liquidity Map – Helps traders spot potential liquidity sweeps and areas of price absorption.
How to Use:
Identify Liquidity Zones – Areas with multiple overlapping pivots signal strong liquidity pools.
Look for Reactions – Price often consolidates, wicks, or reverses around extended pivot clouds.
Combine with Confluence – Use alongside Fair Value Gaps, Institutional Price Blocks, or Market Structure shifts for higher probability setups.
LPC aligns with smart money concepts by revealing key liquidity areas where stop hunts, liquidity grabs, and institutional activity are likely to occur. It helps traders see where price is likely to be drawn before a major move, making it a valuable tool for those trading liquidity-based strategies.
Consecutive Bullish/Bearish Candles🔍 Overview:
This indicator detects market manipulation and deception by identifying sequences of consecutive bullish or bearish candles. It highlights potential reversal zones where trends may exhaust or trap traders before reversing.
📌 How It Works:
The user can set a custom number of consecutive bullish or bearish candles (default: 5).
If the set number of consecutive green (bullish) or red (bearish) candles appears, the indicator plots a signal on the chart.
This pattern often signals exhaustion, stop hunts, or market traps, making it useful for traders looking for reversal opportunities.
📊 Features:
✅ Customizable candle count for detection
✅ Visual signals (✅ for bullish, ❌ for bearish)
✅ Alerts support for automated notifications
✅ Works on all timeframes and all markets (crypto, stocks, forex)
⚠️ Note:
This indicator does not guarantee reversals but helps identify areas where traders may be trapped and a trend shift is likely. Always use it with other confluence factors like volume, support/resistance, and market sentiment.
🚀 Use this tool to spot market deception and trade smart!

Weekend RangeWeekend Range Indicator – Customizable High/Low Zones
🔹 Overview
The Weekend Range Indicator marks the last 20 weekends on your chart, highlighting their highs and lows with fully customizable colors, transparency, and time settings. This tool helps traders identify key support and resistance levels from weekend price action.
🛠️ Features
✅ Custom Weekend Start & End – Choose the weekend days and time (UTC)
✅ Automatically Tracks the Last 20 Weekends (configurable up to 50)
✅ Custom Box Colors & Transparency – Adjust the fill and border colors easily
✅ Works on All Timeframes – Best viewed on 1H, 4H, or higher
✅ Efficient & Optimized Code – No lag, smooth performance
🎯 How to Use
1️⃣ Add the indicator to your chart.
2️⃣ Adjust the weekend start & end time in the settings.
3️⃣ Customize the box colors and transparency to match your style.
4️⃣ Watch how price reacts around the weekend high/low zones for trade opportunities.
💡 Trading Strategies
🔹 Breakout Trading – Look for price breaking above or below the weekend range.
🔹 Reversal Zones – Watch for rejections at weekend highs/lows.
🔹 Liquidity & Stop Hunts – Large players often target these levels.
📈 Recommended Markets
✔ Works best on Forex, Crypto, Indices, and Commodities
✔ Ideal for swing traders and intraday traders
🚀 Enjoy using the indicator! Let me know if you’d like any new features added! 🎯🔥

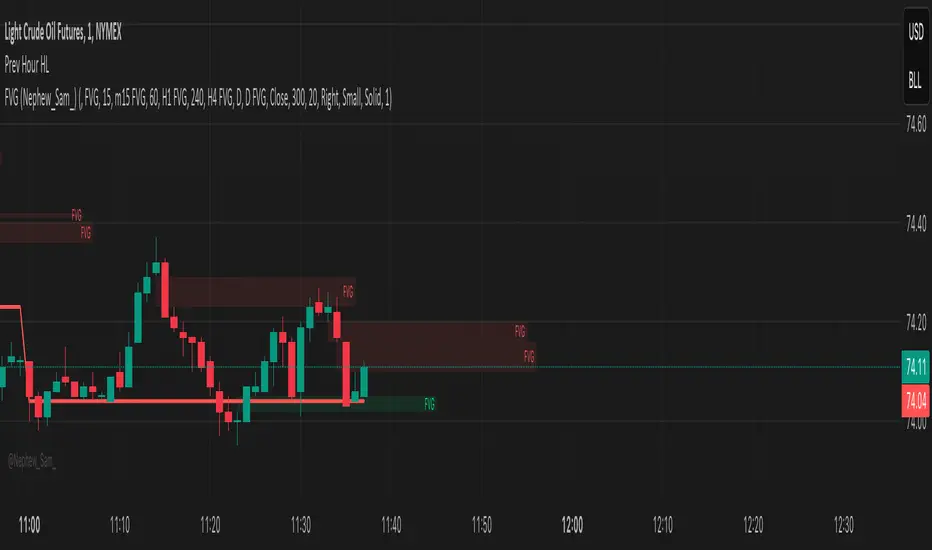
Previous Hour High and Low### **🔷 Previous Hour High & Low Indicator – Description**
#### 📌 **Overview**
The **Previous Hour High & Low Indicator** is designed to help traders identify key levels from the last completed hourly candle. These levels often act as **support and resistance zones**, helping traders make informed decisions about potential breakouts, reversals, and liquidity grabs.
#### 🎯 **How It Works**
- At the start of every new hour, the indicator **locks in** the **high and low** from the **previous fully completed hour**.
- It then **draws horizontal lines** on the chart, marking these levels.
- Works **only on intraday timeframes** (e.g., 1m, 5m, 15m, 30m), ensuring clean and relevant levels.
- Updates dynamically **every new hour** without repainting.
#### 🔑 **Why Is This Useful?**
✔ **Identifies Key Liquidity Zones** – The market often reacts to previous hour highs/lows, making them useful for stop hunts, liquidity grabs, and order block setups.
✔ **Works Well with ICT Concepts** – If you're trading **ICT kill zones**, these levels can help in finding optimal trade entries.
✔ **Helps with Breakout & Rejection Setups** – Traders can watch for price breaking or rejecting these levels for trade confirmation.
✔ **Useful for Scalping & Day Trading** – Works best for short-term traders looking for intraday movements.
#### ⚙ **Customization Options**
- The high and low levels are color-coded:
🔵 **Previous Hour High (Blue)** → Acts as potential resistance or breakout point.
🔴 **Previous Hour Low (Red)** → Acts as potential support or breakdown level.
#### 📊 **Best Timeframes to Use This On**
- **1-minute, 5-minute, 15-minute, 30-minute charts** → Most effective for intraday trading.
- Avoid using on **hourly or higher timeframes**, as these levels become less relevant.
---
🚀 **This indicator is perfect for traders looking to track short-term price reactions at key levels.** Let me know if you want to add alerts, zone shading, or any other enhancements! 🔥
[TTM] ICT Key Levels🌟 Overview 🌟
This tool highlights key price levels, such as highs, lows, and session opens, that can influence market moves. Based on ICT concepts, these levels help traders spot potential areas for market reversals or trend continuations.
🌟 Key Levels 🌟
🔹 Week Open (00:00 EST)
Marks the start of the trading week. This level helps track price direction and is useful for framing the Weekly candle formation using ICT’s Power of 3.
🔹 Midnight Open (00:00 EST)
The Midnight Open (MNOP) marks the start of the new trading day. Price often retraces to this level for liquidity grabs, setting up larger moves in the daily trend. It's also key for framing the Daily Power of 3 and spotting possible market manipulation.
🔹 New York Stock Exchange Open (09:30 EST)
The NYSE Open is a major liquidity event, where price seeks liquidity from earlier in the day, like stop hunts or retracements to the London or Midnight Open. This time often brings reversals or trend continuations as volatility increases.
🔹 Previous Day High/Low
These levels show where liquidity rests, often serving as targets for price revisits, ideal for reversals or continuation trades.
🔹 Previous Week High/Low
Similar to daily levels but on a larger scale. They help identify swing trades and track broader market trends.
🔹 Previous Month High/Low
These monthly levels are important for long-term traders, as price often aims to clear them before setting new trends or market cycles.
Happy Trading!
TheTickMagnet

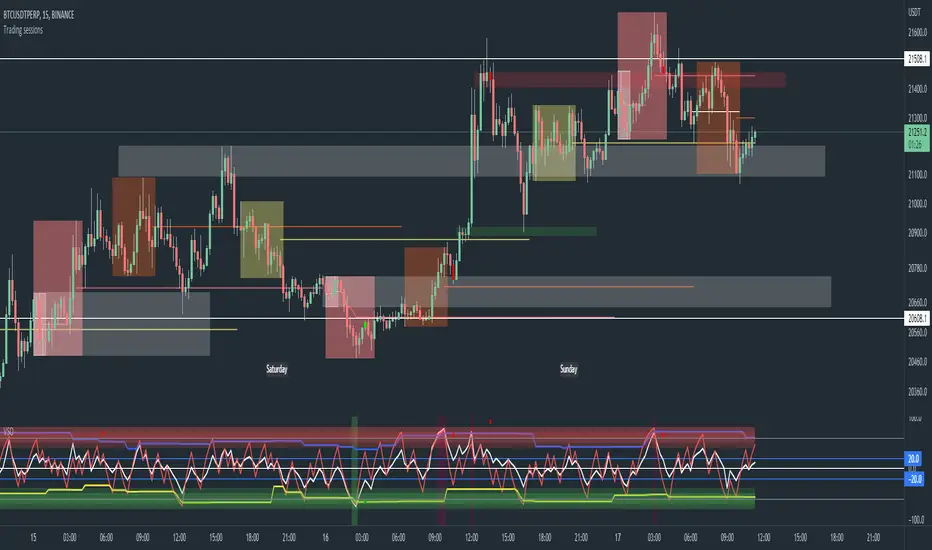
Trading sessions, Ichimoku and Classic Pivots█ OVERVIEW
This a self contained intraday trading style for crypto/forex made to be on and traded on 15-min.
This Script Creates a box around each major session to a trading range, include highlights for the first 12 15-min candles, classic Pivot points and ichimoku cloud.
█ CONCEPTS
1 — Session boxes and ranges are based of the times from Steve from Beat the market maker, and you have the option in setting to have an extension for the high/low until the start of the next box calculation.
2 — 12 candle window, this marks the first 3 hours after a open;
The first hour - stop hunt
The second hour - big moves
The third hour - tend continuation or reversal
3 — The Days of the weeks are labelled and coloured;
Weekends are in grey, ideally no trade days.
Monday, Tuesday, Thursday are green, to mark the week days
Wednesday is red to be mindful of mid week reversal
Friday is red to mark the end of week
4 — Ichimoku cloud, by default the only thing visible is the kumo cloud, but in setting you can turn the line back on. Ichimoku proves a great mark for areas to look for support and resistances.
5 — Lastly, you have classic pivots, by default they are extend to the right and on weekly, Each level act as support and resistance. Look for Bullish momentum at R3 for a larger moves to the upside.
Ichimoku and the pivot are here mainly for when you want to do higher time frame analysis.
█ OTHER SECTIONS
• HOW TO USE
Example of a trade
**Key thing to remember is London will set the high in a down trend and the low in an up trend
you can see the first hour look for stops and stopped at 50% of the range set coming into the session, the second hour a big move to the down side hitting 200% expansion then the third hour reversal stopping wick up then
back down from from London low. before continuing down.
• LIMITATIONS: I have not test this on Stock, as I have a different strategies for those market
• NOTES : I know a lot of people have moving averages on their chart, I have another separate one with all MA types, and it something that will not fit into one script, Other things you can add with this Bollinger bands, and
fib tool with 50%, 100%, 150% and 200%
Smart Money Decoded [GOLD]Title: Smart Money Decoded
Description:
Introduction
Smart Money Decoded is a comprehensive, institutional-grade visualization suite designed to simplify the complex world of Smart Money Concepts (SMC). While many indicators flood the chart with noise, this tool focuses on clarity, precision, and high-probability structure.
This script is built for traders who follow the "Inner Circle Trader" (ICT) methodologies but struggle to identify valid Zones, Displacement, and Liquidity Sweeps in real-time.
💎 Key Features & Logic
1. Refined Market Structure (BOS & CHoCH)
Instead of marking every minor pivot, this script uses a filtered Swing High/Low detection system.
HH/LL/LH/HL Labels: Only significant structure points are mapped.
BOS (Break of Structure): Marks trend continuations in the direction of the bias.
CHoCH (Change of Character): Marks potential trend reversals.
2. Advanced Order Blocks (with "Strict Mode")
Not all down-candles before an up-move are Order Blocks. This script separates the weak from the strong.
Standard OBs: Visualized with standard transparency.
⚡ SWEEP OBs (High Probability): Order Blocks that explicitly swept liquidity (Stop Hunt) before the reversal are highlighted with a thicker border, brighter color, and a ⚡ symbol. These are your high-probability "Turtle Soup" entries.
Strict Mode Toggle: In the settings, you can choose to hide all weak OBs and only see the ones that swept liquidity.
3. Dynamic Breaker Blocks
A true ICT Breaker is a failed Order Block that trapped liquidity.
This script automatically detects when a valid OB is mitigated (broken through) and projects it forward as a Breaker Block.
This ensures you are trading off valid flipped zones (Support becomes Resistance, Resistance becomes Support).
4. Fair Value Gaps (FVG)
Automatically detects Imbalances (Imbalance/Inefficiency).
Includes an ATR Filter to ignore tiny, insignificant gaps, keeping your chart clean.
Option to show the Consequent Encroachment (50% CE) level for precision entries.
5. Liquidity Zones (BSL / SSL)
Automatically plots Buy Side Liquidity (BSL) and Sell Side Liquidity (SSL) at key swing points.
Once price sweeps these levels, the zone is removed or marked as "Swept," helping you identify when the draw on liquidity has been met.
6. Institutional Data Panel
A dashboard in the top right corner displays:
Market Bias: Bullish/Bearish/Neutral based on structure.
Premium/Discount: Tells you if price is in the expensive (Premium) or cheap (Discount) part of the current dealing range.
Active Zones: Counts of current open arrays.
⚙️ How To Use This Indicator
Identify Bias: Look at the Structure Labels (HH/LL) and the Panel. Are we making Higher Highs?
Wait for the Trap: Look for a Liquidity Sweep (BSL/SSL taken) or a ⚡ Sweep OB.
Entry Confirmation: Watch for a return to a Fair Value Gap (FVG) or a retest of a Breaker Block (BRK).
Manage Risk: Use the visuals to place stops above/below invalidation points.
Customization:
Go to the settings to toggle "Strict Mode" for Order Blocks, change colors to match your theme, or adjust the lookback periods to fit your specific asset (Forex, Crypto, or Indices).
📚 Credits & Acknowledgments
This script is an educational tool based on the public teachings of Michael J. Huddleston (The Inner Circle Trader - ICT).
Concepts used: Order Blocks, Breakers, FVGs, Market Structure, Liquidity Pools.
Credit is fully given to ICT for originating these concepts and sharing them with the world.
⚠️ Disclaimer
This script is NOT affiliated with, endorsed by, or connected to Michael J. Huddleston (ICT) in any way. It is an independent coding project intended for educational purposes and visual assistance.
Trading involves substantial risk. This indicator does not guarantee profits. Always use proper risk management. Trust your analysis first, and use indicators as confluence.
#Smart Money Concepts, #SMC, #ICT,#Liquidity, #Market Structure, #Trend, #Price Action.

Ultimate Trend System — Flagship Full VersionUltimate Trend System — Flagship Full Version
The most complete intraday trend detection system, designed for traders who need fast and reliable directional signals.
🔥 Core Features
BUY / SELL / STOP signals
True Breakout Detection (high/low confirmation + volatility filter)
Fakeout Recognition (stop-hunt / liquidity sweep detection)
Dynamic Trend Strength Rating (0–3 stars, real-time updated)
SuperTrend + QQE + ATR + CHOP fusion model
Automatic Trend Background Coloring
Compact Info Panel (trend, momentum, volatility, regime)
Continuation-safe Pine v6 code (no line errors)
🚀 What This System Does
This indicator identifies:
The main trend direction
Trend strength
High-probability breakout zones
Areas to completely avoid trading
Fake breakouts caused by bots/liquidity sweeps
All signals update in real time and work extremely well for fast-moving assets such as Gold (MGC), Silver (SIL), Crude Oil, NASDAQ, and FX pairs.
⭐ Signal Logic
A BUY or SELL is triggered only when:
SuperTrend agrees
QQE momentum confirms
ATR expansion appears
Market regime (CHOP) allows trend following
This greatly filters noise and improves win rate.
📌 Ideal For
Scalpers (1m / 2m / 5m)
Intraday traders
Trend followers
Breakout traders

HTF Candles Pro by MurshidFx# HTF Candles Pro by MurshidFx
## Professional Trading Indicator for Multi-Timeframe Market Structure Analysis
**HTF Candles Pro** is an advanced, open-source trading indicator that synthesizes Higher Timeframe (HTF) candle visualization with CISD (Change in State of Delivery) detection, providing comprehensive market structure analysis across multiple timeframes. Designed for traders at all experience levels—from scalpers to swing traders—this tool enables precise alignment of trades with higher timeframe momentum while identifying critical market structure transitions.
---
## Core Functionality
This indicator integrates three essential analytical frameworks:
- **HTF Candle Visualization** – Inspired by the innovative work of Fadi x MMT's MTF Candles indicator
- **CISD Detection System** – Algorithmic identification of significant market structure reversals
- **Intelligent Session Level Management** – Automated consolidation of overlapping session markers for enhanced chart clarity
The result is a sophisticated yet streamlined analytical tool that delivers actionable market insights with minimal visual complexity.
---
## Feature Set
### Higher Timeframe Candle Analysis
Monitor higher timeframe price action seamlessly without chart switching. The indicator employs automatic HTF selection based on current timeframe, with manual override capability.
**Components:**
- **Primary HTF Display**: Automatically positioned adjacent to current price action
- **Secondary HTF Display**: Optional dual-timeframe analysis capability
- **Adaptive Time Labeling**: Context-aware formatting (intraday times, day names, week numbers)
- **Real-Time Countdown**: Optional timer displaying remaining time until HTF candle close
- **Customizable Color Schemes**: Full color customization for bullish and bearish candles
### CISD Detection (Change in State of Delivery)
The CISD system identifies critical inflection points where market structure undergoes directional change, signaling potential trend reversals or continuations.
**Mechanism:**
- **Market Structure Monitoring**: Continuous tracking of swing highs and lows
- **Liquidity Sweep Detection**: Identification of stop-hunt patterns preceding reversals
- **Reversal Confirmation**: Validation-based CISD level plotting upon structure break confirmation
- **Clear Visual Signals**: Bullish CISD (blue) and bearish CISD (red) demarcation
- **Optimized Display**: Default 5-bar line length (adjustable) minimizes chart clutter
**Technical Definition:**
CISD occurs when price breaches structure in one direction—typically sweeping liquidity and triggering stops—then reverses to break structure in the opposite direction, indicating a fundamental shift in market delivery bias.
### Intelligent Session Level Management
Eliminates visual clutter caused by overlapping session opens at identical price levels through automated consolidation.
**Functionality:**
- **Automatic Consolidation**: Merges multiple concurrent session opens into single reference lines
- **Combined Labeling**: Creates unified labels (e.g., "Week-Day Open," "4H-Day-Week Open")
- **Enhanced Clarity**: Maintains professional chart aesthetics while preserving all relevant information
**Supported Session Intervals:**
- 30-Minute Opens
- 4-Hour Opens
- Daily Opens
- Weekly Opens
- Monthly Opens
### Advanced Market Structure Tools
**Liquidity Sweep Identification:**
Highlights price wicks extending beyond previous HTF extremes that close within range—characteristic liquidity grab patterns.
**HTF Midpoint Reference:**
Displays the 50% retracement level of the most recent completed HTF candle, serving as a key reference for entries and profit targets.
**HTF Opening Price:**
Tracks current HTF candle open price, frequently functioning as dynamic support or resistance.
**Interval Demarcation:**
Visual separators defining HTF period boundaries for enhanced temporal clarity.
### Information Dashboard
Compact, customizable dashboard displaying:
- Current symbol and active timeframe
- HTF candle countdown timer
- Active trading session (Asia/London/New York)
- Current date and time
Flexible positioning: configurable for any chart corner.
---
## Default Configuration
Optimized settings for immediate professional-grade chart presentation:
- **Secondary HTF**: Disabled (enable for multi-timeframe comparative analysis)
- **CISD Bullish Color**: Blue (#0080ff) – optimal visibility with reduced eye strain
- **CISD Line Width**: 1 pixel – subtle yet discernible
- **CISD Line Length**: 5 bars – balanced visibility without excessive clutter
- **Session Opens**: Smart consolidation enabled – eliminates overlapping labels
---
## Application Strategies
### Trend Following
1. Monitor CISD confirmations aligned with HTF trend direction
2. Utilize HTF candle color for directional bias confirmation
3. Execute entries on pullbacks to HTF midpoint or open price levels
### Reversal Trading
1. Identify counter-trend CISD formations
2. Await HTF candle close confirming new directional bias
3. Use session opens as secondary confirmation levels
### Scalping
1. Trade exclusively in HTF candle direction
2. Employ lower timeframe CISD signals for precise entry timing
3. Target HTF midpoint or subsequent session open levels
### Structure-Based Trading
1. Mark liquidity sweep levels as potential reversal zones
2. Monitor CISD formations at key session opens
3. Confirm trend changes via HTF candle closes
---
## Customization Parameters
Comprehensive customization options:
- **Color Schemes**: Independent control of bull/bear candles, borders, CISD signals, session levels
- **Dimensional Settings**: Candle width, line thickness, label sizing
- **Display Quantities**: HTF candle count (1-10 range)
- **Positioning**: Candle offset, dashboard placement, label positioning
- **Line Styles**: Solid, dashed, or dotted rendering
- **Timeframe Selection**: Manual secondary HTF specification
---
## Attribution
**HTF Candle Visualization:**
The HTF candle rendering methodology draws inspiration from Fadi x MMT's "MTF Candles" indicator. Their elegant implementation of multi-timeframe candle visualization provided valuable reference for this development. Recognition and appreciation to their contribution to the TradingView community.
**CISD Detection:**
Proprietary CISD detection algorithm engineered to identify market structure transitions with high signal clarity and reduced false positive rate.
**Session Level Consolidation:**
Custom-developed intelligent grouping system addressing the common challenge of overlapping session labels at coincident price levels.
---
## Open Source License
This indicator is released as open source for the TradingView community. Permitted uses include:
- Implementation in live trading
- Educational study for Pine Script learning
- Personal modification and customization
- Distribution among trading communities
Community contributions, improvements, and derivative works are welcomed and encouraged.
---
## Implementation Guide
1. **Installation**: Click "Add to Chart"
2. **Configuration Access**: Open indicator settings panel
3. **Initial Use**: Default settings provide optimal starting configuration
4. **Optional Features**: Enable secondary HTF for multi-timeframe analysis
5. **Theme Integration**: Adjust color schemes to match chart aesthetics
---
## Best Practices
**Timeframe Optimization:**
- 1-5 minute charts: Optimal with 15m or 1H HTF
- 15-30 minute charts: Effective with 4H HTF
- 1-4 hour charts: Suitable for Daily HTF
- Daily charts: Best utilized with Weekly/Monthly HTF
**CISD Trading Guidelines:**
- Require CISD confirmation before position entry
- Prioritize CISD signals at significant levels (session opens, HTF midpoints)
- Confirm CISD direction aligns with HTF candle bias
- Apply contextual filtering—not all CISD signals warrant trades
**Session Open Strategy:**
- Weekly opens typically provide robust support/resistance
- Daily opens offer reliable intraday reference points
- 4-Hour opens effective for short-term scalping
- Consolidated labels (e.g., "Week-Day Open") indicate confluence zones with elevated significance
---
## Technical Specifications
**Performance Optimization:**
- Intelligent object management prevents TradingView rendering limits
- Efficient array processing for session consolidation
- Proper memory management through systematic object deletion
- Consistent performance across all timeframe ranges
**Compatibility:**
- Universal timeframe support
- Optimized for all market types (forex, stocks, crypto, futures)
- Minimal computational overhead
---
## Support & Development
**Feedback Channels:**
- Comment section for user feedback and suggestions
- Bug reports and feature requests welcomed
- Community-driven enhancement consideration
**Documentation:**
- Well-commented source code for learning purposes
- Clear section organization for easy navigation
- Comprehensive type definitions for structural clarity
- Educational value for market structure concept understanding
---
## Version Information
**Version:** 1.0 (Initial Release)
**License:** Open Source
**Category:** Multi-Timeframe Analysis | Market Structure
**Compatibility:** All Timeframes
**Language:** Pine Script v5
---
**For optimal results:**
- Provide feedback through comments
- Share with trading communities
- Submit enhancement suggestions
- Report technical issues for resolution
**Professional Support:**
Available through comment section for technical inquiries, implementation questions, and feature requests.
---
*Developed for the TradingView trading community | Professional-grade market structure analysis | Open source contribution*

Smart Money Flow Index (SMFI) - Advanced SMC [PhenLabs]📊Smart Money Flow Index (SMFI)
Version: PineScript™v6
📌Description
The Smart Money Flow Index (SMFI) is an advanced Smart Money Concepts implementation that tracks institutional trading behavior through multi-dimensional analysis. This comprehensive indicator combines volume-validated Order Block detection, Fair Value Gap identification with auto-mitigation tracking, dynamic Liquidity Zone mapping, and Break of Structure/Change of Character detection into a unified system.
Unlike basic SMC indicators, SMFI employs a proprietary scoring algorithm that weighs five critical factors: Order Block strength (validated by volume), Fair Value Gap size and recency, proximity to Liquidity Zones, market structure alignment (BOS/CHoCH), and multi-timeframe confluence. This produces a Smart Money Score (0-100) where readings above 70 represent optimal institutional setup conditions.
🚀Points of Innovation
Volume-Validated Order Block Detection – Only displays Order Blocks when formation candle exceeds customizable volume multiplier (default 1.5x average), filtering weak zones and highlighting true institutional accumulation/distribution
Auto-Mitigation Tracking System – Fair Value Gaps and Order Blocks automatically update status when price mitigates them, with visual distinction between active and filled zones preventing trades on dead levels
Proprietary Smart Money Score Algorithm – Combines weighted factors (OB strength 25%, FVG proximity 20%, Liquidity 20%, Structure 20%, MTF 15%) into single 0-100 confidence rating updating in real-time
ATR-Based Adaptive Calculations – All distance measurements use 14-period Average True Range ensuring consistent function across any instrument, timeframe, or volatility regime without manual recalibration
Dynamic Age Filtering – Automatically removes liquidity levels and FVGs older than configurable thresholds preventing chart clutter while maintaining relevant levels
Multi-Timeframe Confluence Integration – Analyzes higher timeframe bias with customizable multipliers (2-10x) and incorporates HTF trend direction into Smart Money Score for institutional alignment
🔧Core Components
Order Block Engine – Detects institutional supply/demand zones using characteristic patterns (down-move-then-strong-up for bullish, up-move-then-strong-down for bearish) with minimum volume threshold validation, tracks mitigation when price closes through zones
Fair Value Gap Scanner – Identifies price imbalances where current candle's low/high leaves gap with two-candle-prior high/low, filters by minimum size percentage, monitors 50% fill for mitigation status
Liquidity Zone Mapper – Uses pivot high/low detection with configurable lookback to mark swing points where stop losses cluster, extends horizontal lines to visualize sweep targets, manages lifecycle through age-based removal
Market Structure Analyzer – Tracks pivot progression to identify trend through higher-highs/higher-lows (bullish) or lower-highs/lower-lows (bearish), detects Break of Structure and Change of Character for trend/reversal confirmation
Scoring Calculation Engine – Evaluates proximity to nearest Order Blocks using ATR-normalized distance, assesses FVG recency and distance, calculates liquidity proximity with age weighting, combines structure bias and MTF trend into smoothed final score
🔥Key Features
Customizable Display Limits – Control maximum Order Blocks (1-10), Liquidity Zones (1-10), and FVG age (10-200 bars) to maintain clean charts focused on most relevant institutional levels
Gradient Strength Visualization – All zones render with transparency-adjustable coloring where stronger/newer zones appear more solid and weaker/older zones fade progressively providing instant visual hierarchy
Educational Label System – Optional labels identify each zone type (Bullish OB, Bearish OB, Bullish FVG, Bearish FVG, BOS) with color-coded text helping traders learn SMC concepts through practical application
Real-Time Smart Money Score Dashboard – Top-right table displays current score (0-100) with color coding (green >70, yellow 30-70, red <30) plus trend arrow for at-a-glance confidence assessment
Comprehensive Alert Suite – Configurable notifications for Order Block formation, Fair Value Gap detection, Break of Structure events, Change of Character signals, and high Smart Money Score readings (>70)
Buy/Sell Signal Integration – Automatically plots triangle markers when Smart Money Score exceeds 70 with aligned market structure and fresh Order Block detection providing clear entry signals
🎨Visualization
Order Block Boxes – Shaded rectangles extend from formation bar spanning high-to-low of institutional candle, bullish zones in green, bearish in red, with customizable transparency (80-98%)
Fair Value Gap Zones – Rectangular areas marking imbalances, active FVGs display in bright colors with adjustable transparency, mitigated FVGs switch to gray preventing trades on filled zones
Liquidity Level Lines – Dashed horizontal lines extend from pivot creation points, swing highs in bearish color (short targets above), swing lows in bullish color (long targets below), opacity decreases with age
Structure Labels – "BOS" labels appear above/below price when Break of Structure confirmed, colored by direction (green bullish, red bearish), positioned at 1% beyond highs/lows for visibility
Educational Info Panel – Bottom-right table explains key terminology (OB, FVG, BOS, CHoCH) and score interpretation (>70 high probability) with semi-transparent background for readability
📖Usage Guidelines
General Settings
Show Order Blocks – Default: On, toggles visibility of institutional supply/demand zones, disable when focusing solely on FVGs or Liquidity
Show Fair Value Gaps – Default: On, controls FVG zone display including active and mitigated imbalances
Show Liquidity Zones – Default: On, manages liquidity line visibility, disable on lower timeframes to reduce clutter
Show Market Structure – Default: On, toggles BOS/CHoCH label display
Show Smart Money Score – Default: On, controls score dashboard visibility
Order Block Settings
OB Lookback Period – Default: 20, Range: 5-100, controls bars scanned for Order Block patterns, lower values detect recent activity, higher values find older blocks
Min Volume Multiplier – Default: 1.5, Range: 1.0-5.0, sets minimum volume threshold as multiple of 20-period average, higher values (2.0+) filter for strongest institutional candles
Max Order Blocks to Display – Default: 3, Range: 1-10, limits simultaneous Order Blocks shown, lower settings (1-3) maintain focus on most recent zones
Fair Value Gap Settings
Min FVG Size (%) – Default: 0.3, Range: 0.1-2.0, defines minimum gap size as percentage of close price, lower values detect micro-imbalances, higher values focus on significant gaps
Max FVG Age (bars) – Default: 50, Range: 10-200, removes FVGs older than specified bars, lower settings (10-30) for scalping, higher (100-200) for swing trading
Show FVG Mitigation – Default: On, displays filled FVGs in gray providing visual history, disable to show only active untouched imbalances
Liquidity Zone Settings
Liquidity Lookback – Default: 50, Range: 20-200, sets pivot detection period for swing highs/lows, lower values (20-50) mark shorter-term liquidity, higher (100-200) identify major swings
Max Liquidity Age (bars) – Default: 100, Range: 20-500, removes liquidity lines older than specified bars, adjust based on timeframe
Liquidity Sensitivity – Default: 0.5, Range: 0.1-1.0, controls pivot detection sensitivity, lower values mark only major swings, higher values identify minor swings
Max Liquidity Zones to Display – Default: 3, Range: 1-10, limits total liquidity levels shown maintaining chart clarity
Market Structure Settings
Pivot Length – Default: 5, Range: 3-15, defines bars to left/right for pivot validation, lower values (3-5) create sensitive structure breaks, higher (10-15) filter for major shifts
Min Structure Move (%) – Default: 1.0, Range: 0.1-5.0, sets minimum percentage move required between pivots to confirm structure change
Multi-Timeframe Settings
Enable MTF Analysis – Default: On, activates higher timeframe trend analysis incorporation into Smart Money Score
Higher Timeframe Multiplier – Default: 4, Range: 2-10, multiplies current timeframe to determine analysis timeframe (4x on 15min = 1hour)
Visual Settings
Bullish Color – Default: Green (#089981), sets color for bullish Order Blocks, FVGs, and structure elements
Bearish Color – Default: Red (#f23645), defines color for bearish elements
Neutral Color – Default: Gray (#787b86), controls color of mitigated zones and neutral elements
Show Educational Labels – Default: On, displays text labels on zones identifying type (OB, FVG, BOS), disable once familiar with patterns
Order Block Transparency – Default: 92, Range: 80-98, controls Order Block box transparency
FVG Transparency – Default: 92, Range: 80-98, sets Fair Value Gap zone transparency independently from Order Blocks
Alert Settings
Alert on Order Block Formation – Default: On, triggers notification when new volume-validated Order Block detected
Alert on FVG Formation – Default: On, sends alert when Fair Value Gap appears enabling quick response to imbalances
Alert on Break of Structure – Default: On, notifies when BOS or CHoCH confirmed
Alert on High Smart Money Score – Default: On, alerts when Smart Money Score crosses above 70 threshold indicating high-probability setup
✅Best Use Cases
Order Block Retest Entries – After Break of Structure, wait for price retrace into fresh bullish Order Block with Smart Money Score >70, enter long on zone reaction targeting next liquidity level
Fair Value Gap Retracement Trading – When price creates FVG during strong move then retraces, enter as price approaches unfilled gap expecting institutional orders to continue trend
Liquidity Sweep Reversals – Monitor price approaching swing high/low liquidity zones against prevailing Smart Money Score trend, after stop hunt sweep watch for rejection into premium Order Block/FVG
Multi-Timeframe Confluence Setups – Identify alignment when current timeframe Order Block coincides with higher timeframe FVG plus MTF analysis showing matching trend bias
Break of Structure Continuations – After BOS confirms trend direction, trade pullbacks to nearest Order Block or FVG in direction of structure break using Smart Money Score >70 as entry filter
Change of Character Reversal Plays – When CHoCH detected indicating potential reversal, look for Smart Money Score pivot with opposing Order Block formation then enter on structure confirmation
⚠️Limitations
Lagging Pivot Calculations – Pivot-based features (Liquidity Zones, Market Structure) require bars to right of pivot for confirmation, meaning these elements identify levels retrospectively with delay equal to lookback period
Whipsaw in Ranging Markets – During choppy conditions, Order Blocks fail frequently and structure breaks produce false signals as Smart Money Score fluctuates without clear institutional bias, best used in trending markets
Volume Data Dependency – Order Block volume validation requires accurate volume data which may be incomplete on Forex pairs or limited in crypto exchange feeds
Subjectivity in Scoring Weights – Proprietary 25-20-20-20-15 weighting reflects general institutional behavior but may not optimize for specific instruments or market regimes, user cannot adjust factor weights
Visual Complexity on Lower Timeframes – Sub-hour timeframes generate excessive zones creating cluttered charts, requires aggressive display limit reduction and higher minimum thresholds
No Fundamental Integration – Indicator analyzes purely technical price action and volume without incorporating economic events, news catalysts, or fundamental shifts that override technical levels
💡What Makes This Unique
Unified SMC Ecosystem – Unlike indicators displaying Order Blocks OR FVGs OR Liquidity separately, SMFI combines all three institutional concepts plus market structure into single cohesive system
Proprietary Confidence Scoring – Rather than manual setup assessment, automated Smart Money Score quantifies probability by weighting five institutional dimensions into actionable 0-100 rating
Volume-Filtered Quality – Eliminates weak Order Blocks forming without institutional volume confirmation, ensuring displayed zones represent genuine accumulation/distribution
Adaptive Lifecycle Management – Automatically updates mitigation status and removes aged zones preventing trades on dead levels through continuous validity and age monitoring
Educational Integration – Built-in tooltips, labeled zones, and reference panel make indicator functional for both learning Smart Money Concepts and executing strategies
🔬How It Works
Order Block Detection – Scans for patterns where strong directional move follows counter-move creating last down-candle before rally (bullish OB) or last up-candle before sell-off (bearish OB), validates formations only when candle exhibits volume exceeding configurable multiple (default 1.5x) of 20-bar average volume
Fair Value Gap Identification – Compares current candle’s high/low against two-candles-prior low/high to detect price imbalances, calculates gap size as percentage of close and filters micro-gaps below minimum threshold (default 0.3%), monitors whether subsequent price fills 50% triggering mitigation status
Liquidity Zone Mapping – Employs pivot detection using configurable lookback (default 50 bars) to identify swing highs/lows where retail stops cluster, extends horizontal reference lines from pivot creation and applies age-based filtering to remove stale zones
Market Structure Analysis – Tracks pivot progression using structure-specific lookback (default 5 bars) to determine trend, confirms uptrend when new pivot high exceeds previous by minimum move percentage, detects Break of Structure when price breaks recent pivot level, flags Change of Character for potential reversals
Multi-Timeframe Confluence – When enabled, requests security data from higher timeframe (current TF × HTF multiplier, default 4x), compares HTF close against HTF 20-period MA to determine bias, contributes ±50 points to score ensuring alignment with institutional positioning on superior timeframe
Smart Money Score Calculation – Evaluates Order Block component via ATR-normalized distance producing max 100-point contribution weighted at 25%, assesses FVG factor through age penalty and distance at 20% weight, calculates Liquidity proximity at 20%, incorporates structure bias (±50-100 points) at 20%, adds MTF component at 15%, applies 3-period smoothing to reduce volatility
Visual Rendering and Lifecycle – Draws Order Block boxes, Fair Value Gap rectangles with color coding (green/red active, gray mitigated), extends liquidity dashed lines with fade-by-age opacity, plots BOS labels, displays Smart Money Score dashboard, continuously updates checking mitigation conditions and removing elements exceeding age/display limits
💡Note:
The Smart Money Flow Index combines multiple Smart Money Concepts into unified institutional order flow analysis. For optimal results, use the Smart Money Score as confluence filter rather than standalone entry signal – scores above 70 indicate high-probability setups but should be combined with risk management, higher timeframe bias, and market regime understanding.

Trishul Tap Signals (v6) — Liquidity Sweep + Imbalanced RetestTrishul Tap Signals — Liquidity Sweep + Imbalanced Retest
Type: Signal-only indicator (non-repainting)
Style: Price-action + Liquidity + Trend-following
Best for: Intraday & Swing Trading — any liquid market (stocks, futures, crypto, FX)
Timeframes: Any (5m–1D recommended)
Concept
The Trishul Tap setup is a liquidity-driven retest play inspired by order-flow and Smart Money Concepts.
It identifies one-sided impulse candles that also sweep liquidity (grab stops above/below a recent swing), then waits for price to retest the origin of that candle to enter in the trend direction.
Think of it as the three points of a trident:
Trend filter — Only signals with the prevailing trend.
Liquidity sweep — Candle takes out a recent swing high/low (stop-hunt).
Imbalanced retest — Price taps the candle’s open/low (bull) or open/high (bear).
Bullish Setup
Trend Filter: Price above EMA(200).
Impulse Candle:
Green close.
Upper wick ≥ (wickRatio × lower wick).
Lower wick ≤ (oppWickMaxFrac × full range).
Liquidity Sweep: Candle’s high exceeds the highest high of the last sweepLookback bars (excluding current).
Tap Entry: Buy signal triggers when price later taps the candle’s low or open (user choice) within expireBars.
Bearish Setup
Trend Filter: Price below EMA(200).
Impulse Candle:
Red close.
Lower wick ≥ (wickRatio × upper wick).
Upper wick ≤ (oppWickMaxFrac × full range).
Liquidity Sweep: Candle’s low breaks the lowest low of the last sweepLookback bars (excluding current).
Tap Entry: Sell signal triggers when price later taps the candle’s high or open (user choice) within expireBars.
Inputs
Trend EMA Length: Default 200.
Sweep Lookback: Number of bars for liquidity sweep check (default 20).
Wick Ratio: Required size ratio of dominant wick to opposite wick (default 2.0).
Opposite Wick Max %: Opposite wick must be ≤ this fraction of the candle’s range (default 25%).
Tap Tolerance (ticks): How close price must come to the level to count as a tap.
Expire Bars: Max bars after setup to allow a valid tap.
One Signal per Level: If ON, a base is “consumed” after first signal.
Plot Tap Levels: Show horizontal lines for active bases.
Show Setup Labels: Mark the origin sweep candle.
Plots & Visuals
EMA Trend Line — trend filter reference.
Tap Levels —
Green = bullish base (origin candle’s low/open).
Red = bearish base (origin candle’s high/open).
Labels — Show where the setup candle formed.
Signals —
BUY: triangle-up below bar at bullish tap.
SELL: triangle-down above bar at bearish tap.
Alerts
Two built-in conditions:
BUY Signal (Trishul Tap) — triggers on bullish tap.
SELL Signal (Trishul Tap) — triggers on bearish tap.
Set via Alerts panel → Condition = this indicator → Choose signal type.
How to Trade It
Use in liquid markets with clean price structure.
Confirm with HTF structure, volume spikes, or other confluence if desired.
Place stop just beyond the tap level (or ATR-based).
Target 1–2R or trail behind structure.
Why It Works
Liquidity sweep traps traders entering late (breakout buyers or panic sellers) and forces them to exit in the opposite direction, fueling your entry.
Wick imbalance confirms directional aggression by one side.
Trend filter keeps you aligned with the market’s dominant flow.
Retest entry lets you enter at a better price with reduced risk.
Non-Repainting
Setups form only on confirmed bar closes.
Signals trigger only on later bars that tap the stored level.
No lookahead functions are used.
Disclaimer
This script is for educational purposes only and does not constitute financial advice. Test thoroughly in a simulator or demo before using in live markets. Trading involves risk.
