Sniper Perfect: Institutional Flow & Adaptive Risk ProtocolOverview Sniper Perfect is an advanced trend-following system designed to filter out "fakeouts" and institutional traps using a multi-layered verification protocol. It combines Volume Flow (VFI), Volatility (CHOP), and Momentum (RSI) to ensure entry only occurs in high-probability setups.
Key Features
🛡️ The Triple Filter Protocol
Strict Choppiness Filter: Uses a strict CHOP threshold (40). If the market is moving sideways, the algorithm locks all new entries to prevent whipsaws.
RSI Extremes Protection: Prevents FOMO buying at tops (Overbought > 70) and panic selling at bottoms (Oversold < 30).
Conflict Zone Detection: Identifies divergence between Price action and Money Flow. If price rises but institutional money exits, the background turns Gray and trading is disabled.
🔒 Adaptive Risk Management
Heat-Breathing Stop Loss: The SL distance adjusts dynamically based on market Volume and Volatility ("Heat").
Ratchet Mechanism: A mechanical lock ensures the Stop Loss can ONLY move in the direction of profit. It never loosens, guaranteeing that paper profits are protected.
📊 Live Dashboard A real-time panel in the bottom-right corner displays:
VFI Flow: Positive/Negative money flow.
Market Status: Active vs. Locked (Choppy).
RSI Status: Neutral, Overbought, or Oversold.
Visual Guide
🟢 Lime Zone: Clean Bullish Trend.
🔴 Red Zone: Clean Bearish Trend.
🟠 Orange Zone: High Choppiness (Stay Out).
🟣 'X' Marker: Exact price where the Stop Loss was triggered.
Disclaimer: For educational and research purposes only. Always manage your risk.
"stop loss"に関するスクリプトを検索

Sniper PerfectOverview Sniper Perfect is an advanced trend-following system designed to filter out "fakeouts" and institutional traps using a multi-layered verification protocol. It combines Volume Flow (VFI), Volatility (CHOP), and Momentum (RSI) to ensure entry only occurs in high-probability setups.
Key Features
🛡️ The Triple Filter Protocol
Strict Choppiness Filter: Uses a strict CHOP threshold (40). If the market is moving sideways, the algorithm locks all new entries to prevent whipsaws.
RSI Extremes Protection: Prevents FOMO buying at tops (Overbought > 70) and panic selling at bottoms (Oversold < 30).
Conflict Zone Detection: Identifies divergence between Price action and Money Flow. If price rises but institutional money exits, the background turns Gray and trading is disabled.
🔒 Adaptive Risk Management
Heat-Breathing Stop Loss: The SL distance adjusts dynamically based on market Volume and Volatility ("Heat").
Ratchet Mechanism: A mechanical lock ensures the Stop Loss can ONLY move in the direction of profit. It never loosens, guaranteeing that paper profits are protected.
📊 Live Dashboard A real-time panel in the bottom-right corner displays:
VFI Flow: Positive/Negative money flow.
Market Status: Active vs. Locked (Choppy).
RSI Status: Neutral, Overbought, or Oversold.
Visual Guide
🟢 Lime Zone: Clean Bullish Trend.
🔴 Red Zone: Clean Bearish Trend.
🟠 Orange Zone: High Choppiness (Stay Out).
🟣 'X' Marker: Exact price where the Stop Loss was triggered.
Disclaimer: For educational and research purposes only. Always manage your risk.

YCGH Ultimate Stocks Breakout Sniper📈 YCGH Ultimate Stocks Breakout Sniper
Overview
A sophisticated momentum-based breakout strategy designed to capture high-probability directional moves during volatility expansion phases. This system identifies breakout opportunities when price decisively breaks through established ranges, combining multiple technical filters to enhance signal quality and minimize false breakouts.
🎯 Strategy Features
Core Methodology:
Proprietary breakout detection algorithm
Multi-layered confirmation filters for signal validation
Adaptive trailing stops for profit protection
Systematic risk management with daily drawdown controls
Key Components:
✅ Volatility Expansion Filter - Only trades during periods of elevated market volatility to avoid choppy, range-bound conditions
✅ Optional Trend Alignment - Configurable trend filter (EMA/SMA/RMA/WMA) to align entries with broader market direction
✅ ROC Momentum Filter - Daily rate-of-change filter to capture strong momentum days (optional)
✅ Comprehensive Exit Strategy:
Fixed stop-loss (default 2%)
Take-profit targets (default 9%)
Dynamic trailing stops (2% activation, 0.5% offset)
✅ Flexible Direction Trading:
Auto-detect mode: Long+Short for perpetuals, Long-only for spot/equities
Manual override options available
Suitable for both crypto and stock markets
📊 Market Applicability
Optimized for: Cryptocurrency perpetual contracts and equity markets (1H-4H timeframes)
Also effective on: Futures and high-liquidity spot markets
The strategy adapts to different market regimes through configurable volatility and trend filters, making it versatile across various trading instruments and timeframes.
⚙️ Risk Management
Position Sizing: Percentage-based allocation with leverage support
Intraday Loss Limit: Maximum 10% drawdown protection (configurable)
Realistic Cost Modeling: 0.025% commission + 1 tick slippage
No Pyramiding: Single position management for controlled risk exposure
📈 Performance Visualization
Includes a comprehensive monthly returns table displaying:
Year-by-year performance breakdown
Monthly profit/loss percentages
Visual color-coding (green for profits, red for losses)
Clean, modern design with transparent styling
🔐 Access & Pricing
This is a PROTECTED, invite-only strategy.
The source code is not open-source and requires paid access for usage.
How to Get Access:
📧 Email: brijamohanjha@gmail.com
Include in your email:
Your TradingView username
Markets/assets you plan to trade
Preferred timeframe
What You'll Receive:
Full strategy access with invite-only permissions
Complete parameter documentation
Setup and optimization guidance
Implementation support
⚠️ Important Disclosures
Backtesting Parameters:
Commission: 0.025% per trade
Slippage: 1 tick
Results reflect realistic trading conditions
Risk Warning:
Past performance does not guarantee future results. This strategy involves substantial risk and may not be suitable for all investors. Users should thoroughly understand the risks and customize parameters based on their risk tolerance and market conditions.
📞 Contact for Access
Email: brijamohanjha@gmail.com
For questions about functionality, pricing, optimization, or market-specific settings, please reach out via email.
Note: This is a premium, paid strategy. Access is granted manually after consultation and payment confirmation.

黃金1KDual Indicator Collaborative Verification
Bollinger Stochastic System: Combines Bollinger Band breakouts with stochastic oscillator overbought/oversold conditions to accurately capture reversal opportunities
Dynamic Trend Channels: ATR-based adaptive channel system that tracks market trend strength and direction in real-time
Dual Signal Confirmation: Two independent systems working together to significantly improve signal reliability
⏰ Intelligent Time Management
Scheduled Closing Mechanism: Automatic position closing at fixed time daily (05:45 exchange time) to lock profits and avoid overnight risks
Exchange Time Zone Adaptation: Full support for GMT+8 time zone, precisely matching Asian trading sessions
Cross-day Logic Processing: Comprehensive trading day switching mechanism ensuring strategy continuity
🛡️ Rigorous Money Management
Fixed Percentage Stop Loss: 0.35% fixed stop loss per trade to strictly control single loss
Optimized Risk-Reward Ratio: 1:3.4 profit-to-loss ratio ensuring long-term positive expected returns
Automatic Position Sizing: 2% account equity-based position calculation for steady compound growth
📊 Advanced Visualization
Dynamic Channel Drawing: Real-time display of trend channel support/resistance and future price predictions
Long/Short Signal Marking: Clear entry markers with price labels for intuitive display
Real-time Alert System: Built-in trading signal notifications ensuring no missed opportunities
Technical Architecture
Indicator Fusion Logic
Trend Confirmation: FTC channels determine primary trend direction
Entry Timing: BBSR system provides precise entry points at channel boundaries
Signal Filtering: Dual conditions ensure entries only on high-quality signals

EMA Trend Pro [Hedging & Fixed Risk]
This strategy is a comprehensive trend-following system designed to capture significant market movements while strictly managing risk. It combines multiple Exponential Moving Averages (EMAs) for trend identification, ADX for trend strength filtering, and Volume confirmation to reduce false signals.
Key Features:
Hedging Mode Compatible: The script is designed to handle Long and Short positions independently. This is ideal for markets where trends can reverse quickly or for traders who prefer hedging logic (requires hedging=true in strategy settings).
Professional Risk Management: Unlike standard strategies that use fixed contract sizes, this script calculates Position Size based on Risk. You can define a fixed risk per trade (e.g., 1% of equity or $100 fixed risk). The script automatically adjusts the lot size based on the Stop Loss distance (ATR).
Multi-Stage Take Profit: The strategy scales out positions at 3 different levels (TP1, TP2, TP3) to lock in profits while letting the remaining position ride the trend.
Strategy Logic:
Trend Identification:
Long Entry: EMA 7 > EMA 14 > EMA 21 > EMA 144 (Bullish Alignment).
Short Entry: EMA 7 < EMA 14 < EMA 21 < EMA 144 (Bearish Alignment).
Filters:
ADX Filter: Entries are only taken if ADX (14) > Threshold (default 20) to ensure the market is trending, avoiding chopping ranging markets.
Volume Filter: Current volume must exceed the 20-period SMA volume by 10% to confirm momentum.
Exits & Trade Management:
Stop Loss: Dynamic SL based on ATR (e.g., 1.8x ATR).
Breakeven: Once TP1 is hit, the Stop Loss is automatically moved to Breakeven to protect capital.
Take Profits:
TP1: 1x Risk Distance (30% pos)
TP2: 2x Risk Distance (50% pos)
TP3: 3x Risk Distance (Remaining pos)
Settings Guide:
Risk Type: Choose between "Percent" (of equity) or "Fixed Amount" (USD).
Risk Value: Input your desired risk (e.g., 1.0 for 1% risk).
Fee %: Set your exchange's Taker fee (e.g., 0.05 or 0.06) for accurate backtesting.
ADX Threshold: Adjust to filter out noise (Higher = Stricter trend requirement).
Disclaimer: This script is for educational and backtesting purposes only. Past performance does not guarantee future results. Please use proper risk management.

15m ORB + FVG Strategy (ChadAnt)Core Logic
The indicator's logic revolves around three main phases:
1. Defining the 15-Minute Opening Range (ORB)
The script calculates the highest high (rangeHigh) and lowest low (rangeLow) that occurred during the first 15 minutes of the trading day.
This time window is defined by the sessionStr input, which defaults to 0930-0945 (exchange time).
The high and low of this range are plotted as small gray dots once the session ends (rangeSet = true).
2. Identifying a Fair Value Gap (FVG) Setup
After the 15-minute range is set, the indicator waits for a breakout of either the range high or range low.
A "Strict FVG breakout" requires two conditions on the first candle that closes beyond the range:
The candle before the breakout candle ( bars ago) must have been inside the range.
The breakout candle ( bar ago) must have closed outside the range.
A Fair Value Gap (FVG) must form on the most recent three candles (the current bar and the two previous bars).
Bullish FVG (Long Setup): The low of the current bar (low) is greater than the high of the bar two periods prior (high ). This FVG represents a price inefficiency that the trade expects to fill.
Bearish FVG (Short Setup): The high of the current bar (high) is less than the low of the bar two periods prior (low ).
If a valid FVG setup occurs, the indicator marks a pending setup and draws a colored box to highlight the FVG area (Green for Bullish FVG, Red for Bearish FVG).
3. Trade Entry and Management
If a pending setup is identified, the trade is structured as a re-entry trade into the FVG zone:
Entry Price: Set at the outer boundary of the FVG, which is the low of the current bar for a Long setup, or the high of the current bar for a Short setup.
Stop Loss (SL): Set at the opposite boundary of the FVG, which is the low for a Long setup, or the high for a Short setup.
The trade is triggered (tradeActive = true) once the price retraces to the pendingEntry level.
Risk/Reward (RR) Targets: Three Take Profit (TP) levels are calculated based on the distance between the Entry and Stop Loss:
$$\text{Risk} = | \text{Entry} - \text{SL} |$$
$$\text{TP}n = \text{Entry} \pm (\text{Risk} \times \text{RR}n)$$
where $n$ is 1, 2, or 3, corresponding to the input $\text{RR}1$, $\text{RR}2$, and $\text{RR}3$ values (defaults: 1.0, 1.5, and 2.0).
Trade Lines: Upon triggering, lines for the Entry, Stop Loss, and three Take Profit levels are drawn on the chart for a specified length (lineLength).
A crucial feature is the directional lock (highBroken / lowBroken):
If the price breaks a range level (e.g., simpleBrokeHigh) but without a valid FVG setup, the corresponding directional flag (e.g., highBroken) is set to true permanently for the day.
This prevents the indicator from looking for any subsequent trade setups in that direction for the rest of the day, suggesting that the initial move, without an FVG, exhausted the opportunity.
Open-source script
In true TradingView spirit, the creator of this script has made it open-source, so that traders can review and verify its functionality. Kudos to the author! While you can use it for free, remember that republishing the code is subject to our House Rules.
ChadAnt
Disclaimer
The information and publications are not meant to be, and do not constitute, financial, investment, trading, or other types of advice or recommendations supplied

ATR Trend + RSI Pullback Strategy [Profit-Focused]This strategy is designed to catch high-probability pullbacks during strong trends using a combination of ATR-based volatility filters, RSI exhaustion levels, and a trend-following entry model.
Strategy Logic
Rather than relying on lagging crossovers, this model waits for RSI to dip into oversold zones (below 40) while price remains above a long-term EMA (default: 200). This setup captures pullbacks in strong uptrends, allowing traders to enter early in a move while controlling risk dynamically.
To avoid entries during low-volatility conditions or sideways price action, it applies a minimum ATR filter. The ATR also defines both the stop-loss and take-profit levels, allowing the model to adapt to changing market conditions.
Exit logic includes:
A take-profit at 3× the ATR distance
A stop-loss at 1.5× the ATR distance
An optional early exit if RSI crosses above 70, signaling overbought conditions
Technical Details
Trend Filter: 200 EMA – must be rising and price must be above it
Entry Signal: RSI dips below 40 during an uptrend
Volatility Filter: ATR must be above a user-defined minimum threshold
Stop-Loss: 1.5× ATR below entry price
Take-Profit: 3.0× ATR above entry price
Exit on Overbought: RSI > 70 (optional early exit)
Backtest Settings
Initial Capital: $10,000
Position Sizing: 5% of equity per trade
Slippage: 1 tick
Commission: 0.075% per trade
Trade Direction: Long only
Timeframes Tested: 15m, 1H, and 30m on trending assets like BTCUSD, NAS100, ETHUSD
This model is tuned for positive P&L across trending environments and volatile markets.
Educational Use Only
This strategy is for educational purposes only and should not be considered financial advice. Past performance does not guarantee future results. Always validate performance on multiple markets and timeframes before using it in live trading.

LiquiBreak — Semi-Automatic Breakout, Gap & Trend-Filter StrategLiquiBreak is a semi-automatic breakout + gap detection strategy that combines pivots, a volatility filter and an optional Supertrend direction check to generate entry signals. It can optionally place take-profit and stop-loss orders in points. Use it to highlight high-probability breakout/gap setups and to automate exits when you want — otherwise treat its signals as trade alerts that require your confirmation.
📌 LiquiBreak — Semi-Automatic Breakout, Gap & Trend Strategy
1. Overview
1. LiquiBreak is a semi-automatic breakout + gap strategy designed to catch high-quality moves with volatility confirmation.
2. Uses pivot-based support/resistance , gap detection , Supertrend filtering , and optional automatic TP/SL in points .
3. Works on all assets and timeframes, especially effective on XAUUSD, Indices, Crypto and FX pairs .
---
2. What This Script Detects
1. Breakouts above resistance and below support during strong volatility.
2. Bullish & bearish gap patterns confirmed with momentum sequences.
3. Dynamic volatility zones based on normalized ATR ranges.
4. Optional Supertrend trend direction for filtering bad signals.
5. Automatic TP/SL orders when enabled.
---
3. Recommended Indicators to Combine With
To increase accuracy and reduce false breakouts:
1. Supertrend (included) – best for trend direction.
2. EMA 9/21 or EMA 20/50 – confirms trend strength & pullbacks.
3. RSI or Stoch RSI – avoid overbought/oversold breakouts.
4. VWAP – institutional bias & fair value zones.
5. CPR / Pivot Points – confluence with breakout levels.
6. MACD – trend confirmation on higher timeframe.
7. Volume Profile (optional) – find breakout liquidity zones.
These indicators help filter low-quality signals without affecting the script’s core logic.
---
4. Key Features
1. Volatility-based pivot support & resistance .
2. Reliable breakout confirmation using real-time volatility strength.
3. Strong gap pattern detection with ATR threshold.
4. Optional Supertrend confirmation for safer entries.
5. Point-based Take Profit / Stop Loss .
6. Toggle on/off: Longs, Shorts, TP, SL .
7. Semi-automatic execution — not fully automated.
8. Clean, optimized structure for stability and speed.
---
5. Inputs / Settings
1. Pivot / Levels Period – defines structural S/R levels.
2. Volatility Filter (%) – prevents low-quality signals.
3. TP Points – automatic take-profit target.
4. SL Points – automatic stop-loss.
5. Enable TP / Enable SL – full exit control.
6. Allow Long / Allow Short – direction control.
7. Supertrend Filter – filter weak counter-trend trades.
---
6. How to Use the Strategy
1. Select timeframe & tune pivot/volatility settings.
2. Enable/disable automatic TP/SL based on your style.
3. Turn ON Supertrend for safer trend-based trades.
4. Confirm signals using EMA, RSI, VWAP, Volume or CPR.
5. Watch for high-volatility breakouts near key levels.
6. Use multiple timeframe analysis for stronger confirmation.
---
7. Important Warning (User Must Monitor Trades)
⚠ This script is NOT a fully automatic bot.
1. You MUST monitor the chart while using this strategy.
2. You MUST manually close trades if market conditions change.
3. Auto TP/SL helps, but during news events or fast markets, slippage may occur.
4. Treat this script as a signal + entry assistant , not a fire-and-forget system.
---
8. Best Practices
1. Works best on XAUUSD, NAS100, BTC, ETH, EURUSD .
2. Avoid major news unless experienced.
3. Increase volatility filter during choppy markets.
4. Use M15–H1 for clean breakouts; M5 for scalping.
5. For beginners: keep TP/SL enabled for safety.
6. Backtest first → then paper trade → then live trade.
---
9. Disclaimer
1. For educational and research purposes only .
2. Not financial advice.
3. User is fully responsible for their trades and risk.
4. Past performance does not guarantee future results.

XAUUSD 9-Grid Scalper (9-levels, 3pt TP)📈 Overview
The XAUUSD 9-Grid Scalper is a precision-based intraday strategy designed for gold scalping around key 9-based price zones. Gold (XAUUSD) often reacts strongly to levels that are multiples of 9, and this script builds a dynamic grid of 18 levels around the current price to capture short-term momentum moves.
This strategy uses 9-point take profits (TP) and configurable stop-loss levels, allowing for fast in-and-out scalps within volatile gold sessions. It’s optimized for short-term traders who focus on 1M–5M charts.
⚙️ Core Logic
Dynamic 9-Multiples Grid: Automatically plots 18 nearby levels spaced by multiples of 9.
Entry Signals:
Long when price breaks above a 9-level.
Short when price breaks below a 9-level.
Take Profit: Fixed at 9 points (configurable).
Stop Loss: Adjustable for flexible risk management.
Backtest-Ready: Uses strategy() for full performance analytics (win rate, profit factor, drawdown).
💡 Best Use Cases
Ideal for gold scalpers during London and New York sessions.
Works best on 1M–5M timeframes with high volatility.
Combine with volume or trend filters (e.g., RSI, MA slope) for improved accuracy.
🧠 Customization Options
Number of grid levels (default: 18)
Take profit & stop loss distance (default: 9pt TP)
Display toggle for 9-grid visualization
Optional filters for session time or volatility
⚠️ Disclaimer
This strategy is for educational and research purposes only.
Past performance does not guarantee future results. Always test on demo before trading live.

Turtle Strategy - Triple EMA Trend with ADX and ATRDescription
The Triple EMA Trend strategy is a directional momentum system built on the alignment of three exponential moving averages and a strong ADX confirmation filter. It is designed to capture established trends while maintaining disciplined risk management through ATR-based stops and targets.
Core Logic
The system activates only under high-trend conditions, defined by the Average Directional Index (ADX) exceeding a configurable threshold (default: 43).
A bullish setup occurs when the short-term EMA is above the mid-term EMA, which in turn is above the long-term EMA, and price trades above the fastest EMA.
A bearish setup is the mirror condition.
Execution Rules
Entry:
• Long when ADX confirms trend strength and EMA alignment is bullish.
• Short when ADX confirms trend strength and EMA alignment is bearish.
Exit:
• Stop Loss: 1.8 × ATR below (for longs) or above (for shorts) the entry price.
• Take Profit: 3.3 × ATR in the direction of the trade.
Both parameters are configurable.
Additional Features
• Start/end date inputs for controlled backtesting.
• Selective activation of long or short trades.
• Built-in commission and position sizing (percent of equity).
• Full visual representation of EMAs, ADX, stop-loss, and target levels.
This strategy emphasizes clean trend participation, strict entry qualification, and consistent reward-to-risk structure. Ideal for swing or medium-term testing across trending assets.

SHALOM TRADING HUB – Bollinger Band SystemSHALOM TRADING HUB – Bollinger Band System (Strategy)
All-in-one BB system with both Breakout and Mean-Reversion modes.
Automatic ENTRY / EXIT / STOP-LOSS, optional Mid-Band Exit, ATR or % risk, and built-in alerts. Backtest-ready.
What it does
Bollinger Bands: Basis = SMA(length); Upper/Lower = ±(mult × StDev).
Signals
Breakout mode
LONG → price crosses above Upper
SHORT → price crosses below Lower
Mean-Reversion mode
LONG → price re-enters above Lower
SHORT → price re-enters below Upper
Risk / Exits
ATR mode: SL = ATR × Mult, TP = SL × Risk:Reward
% mode: SL = %Stop, TP = %Take Profit
Optional Mid-Band (Basis) cross exit.
Visuals: BB lines + active Entry / SL / TP overlays + last-bar price labels.
Alerts: Breakout / Mean-Reversion signals and TP/SL hits.
Inputs (Settings)
Source, Length, Multiplier – BB calculation.
Signal Mode – Breakout or Mean Reversion.
Use ATR Stop/Target? – On = ATR; Off = %.
ATR Length, ATR Mult (SL), Risk:Reward (TP)
% Stop, % Take Profit (when ATR is Off)
Also exit on Mid-Band cross? – On/Off.
Alerts only on bar close? – Filters to confirmed bars.
Entry / Exit / Stop
Entry: Auto when the chosen signal condition triggers.
Stop-Loss: Placed from ATR or % settings.
Take-Profit: Set by R:R or % settings.
Mid-Band Exit (optional):
LONG → exit if close < Basis
SHORT → exit if close > Basis
Alerts (How-to)
Add the strategy to the chart → click Alerts (⚠️).
Condition: “SHALOM BB System” → choose:
BB Breakout LONG / SHORT
BB Mean-Reversion LONG / SHORT
Long TP Hit / Long SL Hit / Short TP Hit / Short SL Hit
Choose Once per bar or Once per bar close.
Backtest Tips
Match timeframe to your instrument.
Tune ATR/Mult, R:R, % to volatility.
Session filter (e.g., 09:20–15:20 IST) can be added easily in code.
Default pyramiding = 0; raise if you want multiple entries.

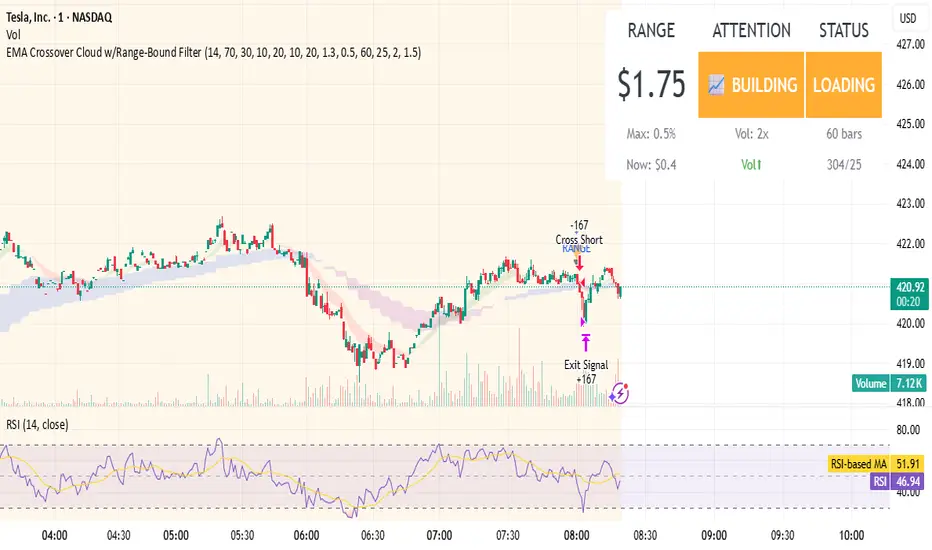
EMA Crossover Cloud w/Range-Bound FilterA focused 1-minute EMA crossover trading strategy designed to identify high-probability momentum trades while filtering out low-volatility consolidation periods that typically result in whipsaw losses. Features intelligent range-bound detection and progressive market attention alerts to help traders manage focus and avoid overtrading during unfavorable conditions.
Key Features:
EMA Crossover Signals: 10/20 EMA crossovers with volume surge confirmation (1.3x 20-bar average)
Range-Bound Filter: Automatically detects when price is consolidating in tight ranges (0.5% threshold) and blocks trading signals during these periods
Progressive Consolidation Stages: Visual alerts progress through Range Bound (red) → Coiling (yellow) → Loading (orange) → Trending (green) to indicate market compression and potential breakout timing
Market Attention Gauge: Helps manage focus between active trading and other activities with states: Active (watch close), Building (check frequently), Quiet (check occasionally), Dead (handle other business)
Smart RSI Exits: Cloud-based and RSI extreme level exits with conservative stop losses
Dual Mode Operation: Separate settings allow full backtesting performance while providing visual stay-out warnings for manual trading
How to Use:
Entry Signals: Trade aqua up-triangles (long) and orange down-triangles (short) when they appear with volume confirmation
Stay-Out Warnings: Ignore gray "RANGE" triangles - these indicate crossovers during range-bound periods that should be avoided
Monitor Top-Right Display:
Range: Current 60-bar dollar range
Attention: Market activity level for focus management
Status: Consolidation stage (trade green/yellow, avoid red, prepare for orange)
Position Sizing: Default 167 shares per signal, optimized for the crossover frequency
Alerts: Enable consolidation stage alerts and market attention alerts for automated notifications
Recommended Settings:
Timeframe: 1-minute charts
Symbol: Optimized for volatile stocks like TSLA
"Apply Filter to Backtest": Keep OFF for realistic backtesting, ON to see filtered results
Risk Management:
The strategy includes built-in overtrading protection by identifying and blocking trades during low-volatility periods. The progressive consolidation alerts help identify when markets are "loading" for significant moves, allowing traders to position appropriately for higher-probability setups.
RSI DCA StrategyThis strategy combines RSI oversold signals with a Dollar-Cost Averaging (DCA) buying approach.
Trigger:
When the RSI (Relative Strength Index) crosses below 30, the strategy marks an oversold condition.
DCA Entry:
Once triggered, the strategy executes up to three consecutive daily entries (1 per day), splitting the predefined capital equally (configurable by user).
Position Management:
Take Profit at a configurable % above the average entry price.
Stop Loss at a configurable % below the average entry price.
Exit Conditions:
The strategy automatically exits either on reaching Take Profit or Stop Loss.
Visualization:
RSI plotted with oversold line (30).
Take Profit and Stop Loss lines displayed after entry.
Performance Reporting:
Includes an optional monthly performance table for evaluating results by month.
Note:
This strategy is for testing RSI-based mean reversion with staggered entries. It is not financial advice and should be optimized and validated for each market or timeframe before practical use.

Imbalance No SL📊 Strategy Name: Imbalance No SL
This strategy specially trades on price jumps (true imbalances) in the market, takes advantage of momentum only, and as soon as the opposite signal and profit is received, the trade is closed immediately.
Imbalance No SL strategy specially generates buy and sell signals based on "Imbalance" logic, without any fixed Stop Loss.
🔍 Core Logic
Imbalance Detection
Bullish Imbalance : When the low of the current candle is above the high of the previous candle.
(i.e. a jump type gap occurred in the market – demand is high, price went straight up)
Bearish Imbalance : When the high of the current candle is below the low of the previous candle.
(i.e. the market suddenly fell down)
Creating Visual Box and Label on Signal:
As soon as bullish imbalance is found, green box & IMB BULL label is displayed on the chart.
Bearish has red box & IMB BEAR label.
Trade Entry Logic
BUY on Bullish Imbalance: If there is already a buy or neutral position, then a new “BUY” signal will fire.
SELL on Bearish Imbalance: If already in sell or neutral position, then new “SELL” signal will fire.
You can set quantity/lot size from ‘qty’ input field.
Trade Average Calculation
Buy/Sell maintains average price and their count (so that if averaging is done then correct P&L is calculated).
Trade Exit Logic (Profit Booking/Signal Reverse)
If your buy is going on and bearish imbalance is formed + price is above your average, then buy will be closed (profit condition).
If sell is going on and bullish imbalance is formed + price is below average, then sell will be closed.
Chart Cleaning/Management
Only keep the label and box of the latest signal on the chart, old boxes/labels are automatically deleted.
Alert
You can get alert on bullish or bearish signal (by using alert feature of TradingView).
✅ Simple Explanation for User
This strategy buys or sells directly at the gap (imbalance).
Whenever there is a clear signal of momentum in the market (breakout of the gap), then the trade entry takes place.
When there is an imbalance in the opposite direction and profit is made, the system closes the trade (closes).
There is no fixed stop-loss, risk management is handled by trade averaging/close.
You will know at every point on the visually chart that at which bar the buy, sell and exit took place.
⚠️ What to remember?
If the market is in trend then this script gives very good signals.
In choppy/sideways market, some loss trades can also come because there is no SL.
Big profit or big loss – both depend on the imbalance signal and market speed.

No Wick Strategy (No-wick candles) — by Sh1n1gam1**No Wick Strategy - Momentum Trading System**
This strategy identifies and trades "no wick" or "minimal wick" candles, which often indicate strong directional momentum and conviction in the market.
**STRATEGY CONCEPT:**
The No Wick Strategy capitalizes on candles that show strong directional commitment - bullish candles with little to no bottom wick (buyers in control from the start) and bearish candles with little to no top wick (sellers dominating from the open).
**HOW IT WORKS:**
📈 **LONG ENTRIES:**
- Identifies bullish candles with minimal/no bottom wick
- Places buy limit order slightly below the signal candle's open
- Enters only during specified trading session
📉 **SHORT ENTRIES:**
- Identifies bearish candles with minimal/no top wick
- Places sell limit order slightly above the signal candle's close
- Enters only during specified trading session
**KEY FEATURES:**
✅ Customizable trading session (New York timezone)
✅ Flexible wick threshold (0% for strict, up to X% for flexibility)
✅ ATR-based stop loss for dynamic risk management
✅ Configurable risk-reward ratio via TP multiplier
✅ Auto-cancellation of unfilled orders after X bars
✅ Body size filters (minimum and maximum)
✅ Visual signals and pending order levels
✅ Position status display
**RISK MANAGEMENT:**
- Stop Loss: Based on ATR multiplier
- Take Profit: Multiple of stop loss distance
- One position at a time
- No pyramiding or position flipping
**RECOMMENDED TIMEFRAMES:**
- M1 and M5 for scalping
- M15 and H1 for day trading
- H4 and Daily for swing trading
**MARKETS:**
Suitable for forex pairs, indices (NQ, ES), commodities, and liquid stocks.
**DEFAULT SETTINGS:**
- Trading Session: 09:30-11:00 ET (NY morning session)
- ATR SL Multiplier: 1.5
- TP Multiplier: 2.0 (2:1 RR ratio)
- Wick Threshold: 5%
- Order Cancellation: 5 bars
**TIPS FOR OPTIMIZATION:**
1. Adjust trading session to match your market's most active hours
2. Test different wick thresholds (0-10%) based on market volatility
3. Optimize body size filters for your specific instrument
4. Backtest different ATR multipliers for your risk tolerance
5. Consider market conditions - works best in trending markets
**IMPORTANT NOTES:**
- Uses limit orders for better entry prices
- Does not close opposing positions (no position flipping)
- Respects trading session boundaries strictly
- All times are in America/New_York timezone
**AUTHOR:** Sh1n1gam1
**VERSION:** 1.0
**SUPPORT:** Comments and suggestions welcome!
Happy Trading! 📊

Supertrend EMA Vol Strategy V5### Supertrend EMA Strategy V5
**Overview**
This is a trend-following strategy designed for cryptocurrency markets like BTC/USD on daily timeframes, combining the Supertrend indicator for dynamic trailing stops with an EMA filter for trend confirmation. It aims to capture strong uptrends while avoiding counter-trend trades, with optional volume filtering for high-conviction entries and ATR-based stop-loss to manage risk. Ideal for long-only setups in bullish assets, it visually highlights trends with green/red bands and fills for easy interpretation. Backtested on BTC from 2024-2025, it shows potential for outperforming buy-and-hold in trending markets, but always use with proper risk management—past performance isn't indicative of future results.
**Key Features**
- **Supertrend Core**: Uses ATR to plot adaptive uptrend (green) and downtrend (red) lines, flipping on closes beyond prior bands for buy/sell signals.
- **EMA Trend Filter**: Entries require price above the EMA (default 21-period) for longs, ensuring alignment with the broader trend.
- **Volume Confirmation**: Optional filter only allows entries when volume exceeds its EMA (default 20-period), reducing false signals in low-activity periods.
- **Risk Controls**: Built-in ATR-multiplier stop-loss (default 2x) to cap losses; exits on Supertrend flips for trailing profits.
- **Visuals**: Green/red lines and highlighter fills for up/down trends, plus buy/sell labels and circles for signals.
- **Customizable Inputs**: Tweak ATR period (default 10), multiplier (default 3), EMA length, start date, long/short toggles, SL, and volume filter.
- **Alerts**: Built-in for buy/sell and direction changes.
**How to Use**
1. Add to your TradingView chart (e.g., BTC/USD 1D).
2. Adjust inputs: Start with defaults for trend-following; increase multiplier for fewer trades/higher win rate. Enable volume filter for volatile assets.
3. Monitor signals: Green "Buy" for long entries (if close > EMA and conditions met); red "Sell" for exits.
4. Backtest in Strategy Tester: Focus on equity curve, win rate (~50-60% in tests), and drawdown (<15% with SL).
5. Live Trading: Use small position sizes (1-2% risk per trade); combine with your analysis. Shorts disabled by default for bull-biased markets.

Gemini Trend Following SystemStrategy Description: The Gemini Trend Following System
Core Philosophy
This is a long-term trend-following system designed for a position trader or a patient swing trader, not a day trader. The fundamental goal is to capture the majority of a stock's major, multi-month or even multi-year uptrend.
The core principle is: "Buy weakness in a confirmed uptrend, and sell only when the uptrend's structure is fundamentally broken."
It operates on the belief that it's more profitable to ride a durable trend than to chase short-term breakouts or worry about daily price fluctuations. It prioritizes staying in a winning trade over frequent trading.
The Three Pillars of the Strategy
The script's logic is built on three distinct pillars, processed in order:
1. The Regime Filter: "Is This Stock in a Healthy Uptrend?"
Before even considering a trade, the script acts as a strict gatekeeper. It will only "watch" a stock if it meets all the criteria of a healthy, long-term uptrend. This is the most important part of the strategy as it filters out weak or speculative stocks.
A stock passes this filter if:
The 50-day Simple Moving Average (SMA) is above the 200-day SMA. This is the classic definition of a "Golden Cross" state, indicating the medium-term trend is stronger than the long-term trend—a hallmark of a bull market for the stock.
The stock's performance over the last year is positive. The Rate of Change (ROC) must be above a minimum threshold (e.g., 15%). This ensures we are only looking at stocks that have already demonstrated significant strength.
The 200-day SMA itself is rising. This is a crucial check to ensure the very foundation of the trend is solid and not flattening out or beginning to decline.
If a stock doesn't meet these conditions, the script ignores it completely.
2. The Entry Trigger: "When to Buy the Dip"
Once a stock is confirmed to be in a healthy uptrend, the script does not buy immediately. Instead, it patiently waits for a point of lower risk and higher potential reward—a pullback.
The entry trigger is a specific, two-step sequence:
The stock price first dips and closes below its 50-day SMA. This signifies a period of temporary weakness or profit-taking.
The price then recovers and closes back above the 50-day SMA within a short period (10 bars).
This sequence is a powerful signal. It suggests that institutional buyers view the 50-day SMA as a key support level and have stepped in to defend it, overpowering the sellers. The entry occurs at this point of confirmed support, marking the likely resumption of the uptrend. On the chart, this event is highlighted with a teal background.
3. The Exit Strategy: "When is the Trend Over?"
The exit logic is designed to keep you in the trade as long as possible and only sell when the trend's character has fundamentally changed. It uses a dual-exit system:
Primary Exit (Trend Failure): The main reason to sell is a "Death Cross"—when the 50-day SMA crosses below the 200-day SMA. This is a robust, albeit lagging, signal that the long-term uptrend is over and a bearish market structure is taking hold. This exit condition is designed to ignore normal market corrections and only trigger when the underlying trend has truly broken. On the chart, this is highlighted with a maroon background.
Safety-Net Exit (Catastrophic Stop-Loss): To protect against a sudden market crash or a company-specific disaster, a "safety-net" stop-loss is placed at the time of entry. This stop is set far below the entry price, typically underneath the 200-day SMA. It is a "just-in-case" measure that should only be triggered in a severe and rapid decline, protecting your capital from an unexpected black swan event.
Who is This Strategy For?
Position Traders: Investors who are comfortable holding a stock for many months to over a year.
Patient Swing Traders: Traders who want to capture large price swings over weeks and months, not days.
Investors using a Rules-Based Approach: Anyone looking to apply a disciplined, non-emotional system to their long-term portfolio.
Ideal Market Conditions
This strategy excels in markets with clear, durable trends. It performs best on strong, leading stocks during a sustained bull market. It will underperform significantly or generate losses in choppy, sideways, or range-bound markets, where the moving averages will frequently cross back and forth, leading to "whipsaw" trades.

ICT OTE Strategy Futures PublicICT OTE Strategy
This strategy automates a classic ICT (Inner Circle Trader) setup that aims to enter a trade on a retracement after a confirmed Break of Structure (BOS). It is designed to identify high-probability setups by waiting for the market to show its hand before looking for an entry within a "discount" or "premium" array.
The entire process is automated, from identifying the market structure to managing the trade with a dynamic stop loss.
How It Works
Break of Structure (BOS): The strategy first waits for a strong, validated swing to break a previous, weaker swing high or low. This confirms the market's intended direction.
Identify Retracement Leg: After a BOS, the strategy identifies the most recent price leg that led to the break.
Auto-Fibonacci: It automatically draws a Fibonacci retracement over this leg, from the start of the move (1.0) to the end (0.0).
Trade Entry: A limit order is placed at a user-defined Fibonacci level (defaulting to 0.508), anticipating a price pullback.
After a bullish BOS, it looks to BUY the retracement.
After a bearish BOS, it looks to SELL the retracement.
Risk Management:
Stop Loss is placed at the start of the leg (the 1.0 level).
Take Profit is placed at a user-defined level (defaulting to the 0.0 level).
Includes an option to move the stop loss to break-even after the trade has moved a certain distance in profit.
How to Use
Swing Settings: Adjust the "Entry Swing" and "Validator" strengths to match the volatility and timeframe of the asset you are trading. Higher numbers will result in fewer, more significant setups.
Session Filter: Use the "Trading Sessions" filter to align the strategy with ICT's "killzone" concept, ensuring trades are only taken during high-volume periods like the New York session.
Backtest: Use the Strategy Tester to optimize the "FIB Entry Level," "Take Profit Level," and "Min Trade Range" to find the best settings for your specific market and timeframe.

RCI 2 Dashboards ✅ Strategy: RCI 2 Dashboards BY Sonu JAIN
This advanced strategy is built around the Rank Correlation Index (RCI), a unique momentum oscillator, and combines it with a comprehensive suite of powerful indicators to identify high-probability trading opportunities. The strategy’s core strength lies in its ability to filter signals using up to 12 different conditions for both long and short trades.
To make the decision-making process clear and intuitive, the strategy features two dynamic, customizable dashboards right on your chart. The first dashboard gives you a live, detailed breakdown of which conditions are met, while the second provides a real-time overview of the strategy’s performance.
How It Works
The strategy generates entry signals based on RCI crossovers and crossunders. These signals are then filtered by a customizable combination of other indicators to confirm the trade.
Long Entry:
The RCI crosses over its moving average.
All enabled long-side filters are met.
Short Entry:
The RCI crosses under its moving average.
All enabled short-side filters are met.
Key Features
RCI Crossover Logic: The core of the strategy is an RCI crossover/crossunder with a customizable moving average (MA). You can choose from SMA, EMA, SMMA (RMA), WMA, or VWMA.
12 Optional Filters: This strategy goes far beyond a simple RCI signal. You can enable or disable a wide range of filters to refine your entries. These include:
Trend: Supertrend, Parabolic SAR (SAR), and Vortex Indicator.
Volatility: Keltner Channels (KC) and Bollinger Bands (BB).
Momentum: Woodies CCI, Money Flow Index (MFI), and Relative Strength Index (RSI).
Volume: On-Balance Volume (OBV) and simple Volume analysis.
Directional Strength: Average Directional Index (ADX).
Timing: A time-of-day filter to trade only during specific market hours.
Dual Dashboards:
Detailed Condition Dashboard: This dashboard shows you exactly which of the 12 filters are currently met with a simple ✓ or ✗. This provides instant clarity on why a trade is or isn't being considered.
Performance Dashboard: This dashboard displays key performance metrics in real-time, including net profit, win rate, profit factor, max drawdown, and current/max winning and losing streaks. It also provides details on the most recent trade, such as entry, stop-loss, and exit prices.
Customizable Stop Loss: The strategy includes a fixed percentage-based stop loss for both long and short positions, which you can easily configure in the settings.
Trade Direction Control: You can choose to trade "Long Only," "Short Only," or "Long & Short," giving you complete control over your trading bias.
This strategy is a powerful tool for traders who want to build a robust, multi-filtered system. The included dashboards make it an excellent educational tool for understanding how different indicators work together to form a complete trading plan. You can use it to backtest and optimize your own unique combination of indicators to find the perfect setup for your market and timeframe.

ICT OTE StrategyStrategy Overview
This strategy is designed to automate a specific trading setup based on the concepts of Inner Circle Trader (ICT). Its primary goal is to identify significant market structure swings, frame a Fibonacci retracement over the most recent price leg, and execute a trade when the price pulls back to a key user-defined level. It is a counter-trend entry strategy, meaning it looks to enter a trade during a pullback within an established trend.
How It Works: Step-by-Step
1. Swing Detection:
The strategy first identifies significant swing highs and swing lows.
A swing high is confirmed only if it's higher than a specific number of bars to its left and right (defined by "Left Strength" and "Right Strength" in the settings).
The same logic applies to swing lows, which must be lower than the bars around them. This filtering ensures only structurally important turning points are considered.
2. Defining the Trading Range:
Once a new swing is confirmed, the strategy defines the most recent dealing range.
If a new swing high forms, the range is drawn from the previous swing low up to this new high. This is considered a bullish leg.
If a new swing low forms, the range is drawn from the previous swing high down to this new low. This is considered a bearish leg.
3. Fibonacci Retracement & Trade Setup:
An automatic Fibonacci retracement tool is drawn over this newly defined dealing range. The 0.0 level is placed at the end of the move, and the 1.0 level is at the beginning.
The strategy then prepares to enter a trade based on this range.
4. Trade Execution:
Entry: A limit order is placed at a specific Fibonacci level within the range, waiting for the price to retrace. The default entry is the 0.618 level, but this can be changed in the settings.
For a bullish leg, it places a LONG (Buy) order, anticipating that the price will bounce from the retracement level.
For a bearish leg, it places a SHORT (Sell) order, anticipating that the price will be rejected from the retracement level.
Stop Loss: The Stop Loss is automatically placed at the 1.0 level of the Fibonacci range. This is the point where the original trade idea is invalidated.
Take Profit: The Take Profit is automatically placed at the 0.0 level of the Fibonacci range. This is the target at the end of the price leg.
Key Features & Customization
Automated Trade Logic: The entire process, from identifying the setup to placing the entry, stop loss, and take profit, is fully automated.
Visual Aid: The script draws the swing points and the Fibonacci retracement on the chart, so you can visually confirm the setups the strategy is taking.
Customizable Entry: You can change the "Entry Level" in the settings to test different Fibonacci levels, such as the Optimal Trade Entry (OTE) at 0.705.
Toggle Visuals: You can turn the Fibonacci drawing on or off to keep your chart clean while still allowing the strategy to run in the background.

NQ Phantom Scalper Pro# 👻 NQ Phantom Scalper Pro
**Advanced VWAP Mean Reversion Strategy with Volume Confirmation**
## 🎯 Strategy Overview
The NQ Phantom Scalper Pro is a sophisticated mean reversion strategy designed specifically for Nasdaq 100 (NQ) futures scalping. This strategy combines Volume Weighted Average Price (VWAP) bands with intelligent volume spike detection to identify high-probability reversal opportunities during optimal market hours.
## 🔧 Key Features
### VWAP Band System
- **Dynamic VWAP Bands**: Automatically adjusting standard deviation bands based on intraday volatility
- **Multiple Band Levels**: Configurable Band #1 (entry trigger) and Band #2 (profit target reference)
- **Flexible Anchoring**: Choose from Session, Week, Month, Quarter, or Year-based VWAP calculations
### Volume Intelligence
- **Volume Spike Detection**: Only triggers entries when volume exceeds SMA by configurable multiplier
- **Relative Volume Display**: Real-time volume strength indicator in info panel
- **Optional Volume Filter**: Can be disabled for testing alternative setups
### Advanced Time Management
- **12-Hour Format**: User-friendly time inputs (9 AM - 4 PM default)
- **Lunch Filter**: Automatically avoids low-liquidity lunch period (12-2 PM)
- **Visual Time Zones**: Color-coded background for active/inactive periods
- **Market Hours Focus**: Optimized for peak NQ trading sessions
### Smart Risk Management
- **ATR-Based Stops**: Volatility-adjusted stop losses using Average True Range
- **Dual Exit Strategy**: VWAP mean reversion + fixed profit targets
- **Adjustable Risk-Reward**: Configurable target ratio to opposite VWAP band
- **Position Sizing**: Percentage-based equity allocation
### Optional Trend Filter
- **EMA Trend Alignment**: Optional trend filter to avoid counter-trend trades
- **Configurable Period**: Adjustable EMA length for trend determination
- **Toggle Functionality**: Enable/disable based on market conditions
## 📊 How It Works
### Entry Logic
**Long Entries**: Triggered when price touches lower VWAP band + volume spike during active hours
**Short Entries**: Triggered when price touches upper VWAP band + volume spike during active hours
### Exit Strategy
1. **VWAP Mean Reversion**: Early exit when price returns to VWAP center line
2. **Profit Target**: Fixed target based on percentage to opposite VWAP band
3. **Stop Loss**: ATR-based protective stop
### Visual Elements
- **VWAP Center Line**: Blue line showing volume-weighted fair value
- **Green Bands**: Entry trigger levels (Band #1)
- **Red Bands**: Extended levels for target reference (Band #2)
- **Orange EMA**: Trend filter line (when enabled)
- **Background Colors**: Yellow (lunch), Gray (after hours), Clear (active trading)
- **Info Panel**: Real-time metrics display
## ⚙️ Recommended Settings
### Timeframes
- **Primary**: 1-5 minute charts for scalping
- **Validation**: Test on 15-minute for swing applications
### Market Conditions
- **Best Performance**: Ranging/choppy markets with good volume
- **Trend Markets**: Enable trend filter to avoid counter-trend trades
- **High Volatility**: Increase ATR multiplier for stops
### Session Optimization
- **Pre-Market**: Generally avoided (low volume)
- **Morning Session**: 9:30 AM - 12:00 PM (high activity)
- **Lunch Period**: 12:00 PM - 2:00 PM (filtered by default)
- **Afternoon Session**: 2:00 PM - 4:00 PM (good volume)
- **After Hours**: Generally avoided (wide spreads)
## ⚠️ Risk Disclaimer
This strategy is for educational purposes only and does not constitute financial advice. Past performance does not guarantee future results. Trading futures involves substantial risk of loss and is not suitable for all investors. Users should:
- Thoroughly backtest on historical data
- Start with small position sizes
- Understand the risks of leveraged trading
- Consider transaction costs and slippage
- Never risk more than you can afford to lose
## 📈 Performance Tips
1. **Volume Threshold**: Adjust volume multiplier based on average NQ volume patterns
2. **Band Sensitivity**: Modify band multipliers for different volatility regimes
3. **Time Filters**: Customize trading hours based on your timezone and preferences
4. **Trend Alignment**: Use trend filter during strong directional markets
5. **Risk Management**: Always maintain consistent position sizing and risk parameters
**Version**: 6.0 Compatible
**Asset**: Optimized for NASDAQ 100 Futures (NQ)
**Style**: Mean Reversion Scalping
**Frequency**: High-Frequency Trading Ready

WaverVanir Alpha Reversal Scalper [ETF Eval Bot]🧠 Strategy Overview:
The WaverVanir Alpha Reversal Scalper is a precision-engineered futures trading bot designed to pass prop firm evaluations, specifically Elite Trader Funding (ETF) via Tradovate integration.
This scalping engine was developed after analyzing over 100+ evaluation trades, and is powered by institutional logic, volume behavior, and adaptive VWAP-based confluence.
🔍 Core Logic:
Directional Bias: Trades long only based on VWAP slope confirmation (to avoid funding-damaging shorts)
Entry Conditions:
Price deviates below VWAP standard deviation
Volume spike exceeds 1.5× 20-period average
Bullish reversal wick detected (smart money pattern)
Exit Management:
Stop Loss: 10-tick precision SL below local low
Take Profit: 2.5R static or dynamic trailing stop
Session Filter: Trades only between 9:00–14:00 ET, avoiding lunch and close traps
📊 Backtest Summary (ESU2025)
Metric Result
Net Profit $9,487.50
Profit Factor 1.66 (longs)
Sharpe Ratio 0.03
Sortino Ratio 0.042
Winning Bias Long-Only
Max Drawdown Under $3,000
Commissions $0 (sim tested)
🧪 Tested across March–July 2025 on CME Mini ES (ESU2025)
🔒 Short trades disabled after review: Net −$7,312.50 loss on shorts alone
✅ Profit factor improves > 60% post-optimization
🔄 Recent Optimizations
❌ Disabled unprofitable short setups
✅ VWAP slope filter added for institutional alignment
✅ Trailing stop logic added (activates after 1.5R)
⏱️ Session filter to reduce market noise
🧠 Designed For:
Passing ETF funding challenges quickly
Avoiding drawdown breaches with controlled risk
Running on TradingView with direct Tradovate integration
🚀 Execution-Ready
This bot runs natively on TradingView. Simply:
Add the Pine Script to your chart
Use a tradable symbol (e.g., ESU2025)
Create an alert using “Order fills”
✅ Enable auto-trading to Tradovate
📡 Learn More
🔗 Powered by VolanX Protocol, the AI-driven infrastructure layer of
🌐 WaverVanir International LLC – where institutional logic meets retail precision.
—
🧠 Want to upgrade this bot to include macros, adaptive entries, or launch in NQ/CL?
💬 Drop a comment or message — let’s build your funding empire.
#ES #Futures #ETF #Funding #PropFirm #TradingBot #VWAP #VolumeProfile #AlphaScalper #WaverVanir #VolanX

HMA Crossover + ATR + Curvature (Long & Short)📏 Hull Moving Averages (Trend Filters)
- fastHMA = ta.hma(close, fastLength)
- slowHMA = ta.hma(close, slowLength)
These two HMAs act as dynamic trend indicators:
- A bullish crossover of fast over slow HMA signals a potential long setup.
- A bearish crossunder triggers short interest.
⚡️ Curvature (Acceleration Filter)
- curv = ta.change(ta.change(fastHMA))
This calculates the second-order change (akin to the second derivative) of the fast HMA — effectively the acceleration of the trend. It serves as a filter:
- For long entries: curv > curvThresh (positive acceleration)
- For short entries: curv < -curvThresh (negative acceleration)
It helps eliminate weak or stagnating moves by requiring momentum behind the crossover.
📈 Volatility-Based Risk Management (ATR)
- atr = ta.atr(atrLength)
- stopLoss = atr * atrMult
- trailStop = atr * trailMult
These define your:
- Initial stop loss: scaled to recent volatility using ATR and atrMult.
- Trailing stop: also ATR-scaled, to lock in gains dynamically as price moves favorably.
💰 Position Sizing via Risk Percent
- capital = strategy.equity
- riskCapital = capital * (riskPercent / 100)
- qty = riskCapital / stopLoss
This dynamically calculates the position size (qty) such that if the stop loss is hit, the loss does not exceed the predefined percentage of account equity. It’s a volatility-adjusted position sizing method, keeping your risk consistent regardless of market conditions.
📌 Execution Logic
- Long Entry: on bullish HMA crossover with rising curvature.
- Short Entry: on bearish crossover with falling curvature.
- Exits: use ATR-based trailing stops.
- Position is closed when trend conditions reverse (e.g., bearish crossover exits the long).
This framework gives you:
- Trend-following logic (via HMAs)
- Momentum confirmation (via curvature)
- Volatility-aware execution and exits (via ATR)
- Risk-controlled dynamic sizing
Want to get surgical and test what happens if we use curvature on the difference between HMAs instead? That might give some cool insights into trend strength transitions.
