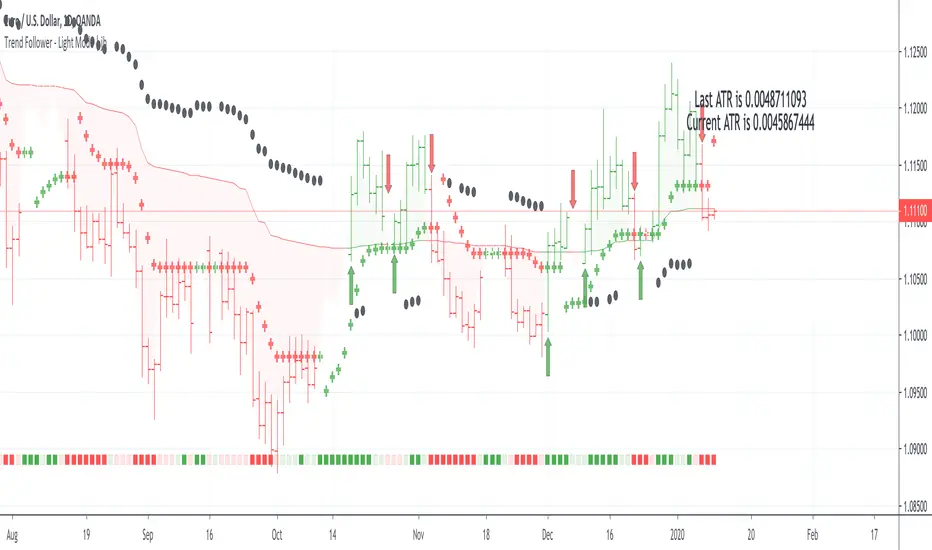
Trend Follower - Light Mode | jhFollow up script for my Trend Follower script.
I'm used to dark mode, so I coded a few key plots in white, so those are changed into black on the script.
Notably:
- > 1 ATR in black dots along the baseline
- Current and previous ATR text labels to the right of the price
- A text label spacing input that allows you to adjust the spacing for text label from price.
This is a trend following system that combines 3 indicators which provide different functionalities, also a concept conceived by VP's No Nonsense FX / NNFX method.
1. Baseline
The main baseline filter is an indicator called Modular Filter created by Alex Grover
- www.tradingview.com
- Alex Grover - Modular Filter
-------
That's the moving average like baseline following price, filtering long and short trends and providing entry signals when the price crosses the baseline.
Entry signal indicated with arrows.
2. Volume/Volatility, I will called it Trend Strength
The next indicator is commonly known as ASH, Absolute Strength Histogram.
This indicator was shared by VP as a two line cross trend confirmation indicator, however I discovered an interesting property when I modified the calculation of the histogram.
- Alex Grover Absolute Strength
-------
My modification and other info here
- Absolute Strength Histogram v2
-------
I simplified the display of the trend strength by plotting squares at the bottom of the chart.
- Lighted Squares shows strength
- Dimmed Squares shows weakness
3. Second Confirmation / Exits / Trailing Stop
Finally the last indicator is my usage of QQE (Qualitative Quantitative Estimation), demonstrated in my QQE Trailing Line Indicator
- QQE Trailing Line for Trailing Stop
-------
Three usages of this amazing indicator, serving as :
- Second trend confirmation
- Exit signal when price crosses the trailing line
- Trailing stop when you scaled out the second trade
This indicator is plotted with crosses.
Additional plots and information
Bar Color
- Green for longs, Red for shorts, White when the baseline direction conflicts with the QQE trailing line direction
- When it's white, it's usually ranging and not trending, ASH will also keep you off ranging periods.
-------
ATR Filter
- White circles along the baseline, they will show up if the price has moved more than one ATR from the baseline
- The default allowance is 1 ATR.
-------
The previous and current ATR value
- Label on the right side of the chart showing the previous and current value of ATR
"text"に関するスクリプトを検索

Strategy Death To The Bear Simple strategy for the indicator "Death To The Bear".
Simple rules:
- Entry according to the selected weapons.
- Take profit 1 (TP1) in% of daily ATR (can be set, default 20%)
- Active Stop in Breakeven when I take profit in TP1.
- Take profit 2 (TP1) in% of daily ATR (can be set, default 30%)
* Pyramidization can be changed from the configuration (maximum number of tickets to average your price)
* Many do not like to pyramid, but I can assure you that with good management, and good choice of the instrument and time frame, you will get good money.
Note: at the request of some people who cannot see the EMOJI in the configuration you can choose TEXT.
Thumbs up

Kinetic EMA & Volume with State EngineKinetic EMA & Volume with State Engine (EMVOL)
1. Introduction & Concept
The EMVOL indicator converts a dense family of EMA signals and volume flows into a compact “state engine”. Instead of looking at individual EMA lines or simple crossovers, the script treats each EMA as part of a kinetic vector field and classifies the market into interpretable states:
- Trend direction and strength (from a grid of prime‑period EMAs).
- Volume regime (expansion, contraction, climax, dry‑up).
- Order‑flow bias via delta (buy versus sell volume).
- A combined scenario label that summarises how these three layers interact.
The goal is educational: to help traders see that moving averages and volume become more meaningful when observed as a structure, not as isolated lines. EMVOL is therefore designed as a real‑time teaching tool, not as an automatic signal generator.
2. Volume Settings
Group: “Volume Settings”
A. Calculation Method
- Geometry (Source File) – Default mode.
Buy and sell volume are estimated from each candle’s geometry: the close is compared to the high/low range and the bar’s total volume is split proportionally between buyers and sellers. This approximation works on any TradingView plan and does not require lower‑timeframe data.
- Intrabar (Precise) – Reconstructs buy/sell volume using a lower timeframe via requestUpAndDownVolume(). The script asks TradingView for historical intrabar data (e.g., 15‑second bars) and builds buy/sell volume and delta from that stream. This mode can produce a more accurate view of order flow, but coverage is limited by your account’s history limits and the symbol’s available lower‑timeframe data.
B. Intrabar Resolution (If Precise)
- Intrabar Resolution (If Precise) – Selected only when the calculation method is “Intrabar (Precise)”. It defines which lower timeframe (for example 15S, 30S, 1m) is used to compute up/down volume. Smaller intrabar timeframes may give smoother and more granular deltas, but require more historical depth from the platform.
When “Intrabar (Precise)” is active, the dashboard’s extended section shows the resolution and the number of bars for which precise volume has been successfully retrieved, in the format:
- Mode: Intrabar (15S) – where N is the count of bars with valid high‑resolution volume data.
In Geometry mode this counter simply reflects the processed bars in the current session.
3. Kinetic Vector Settings
Group: “Kinetic Vector”
A. Vector Window
- Vector Window – Controls the temporal smoothing applied to the aggregated vectors (trend, volume, delta, etc.). Internally, each bar’s vector value is averaged with a simple moving window of this length.
- Shorter windows make the state engine more reactive and sensitive to local swings.
- Longer windows make the states more stable and better suited to higher‑timeframe structure.
B. Max Prime Period
- Max Prime Period – Sets the largest prime number used in the EMA grid. The engine builds a family of EMAs on prime lengths (2, 3, 5, 7, …) up to this limit and converts their slopes into angles.
- A higher limit increases the number of long‑horizon EMAs in the grid and makes the vectors sensitive to broader structure.
- A lower limit focuses the analysis on short- and medium‑term behaviour.
C. Price Source
- Price Source – The price series from which the kinetic EMA grid is built (e.g., Close, HLC3, OHLC4). Changing the source modifies the context that the state engine is reading but does not change the core logic.
4. State Engine Settings
Group: “State Engine Settings”
These inputs define how the continuous vectors are translated into discrete states.
A. Trend Thresholds
- Strong Trend Threshold – Value above which the trend vector is treated as “extreme bullish” and below which it is “extreme bearish”.
- Weak Trend Threshold – Inner boundary between neutral and directional conditions.
Roughly:
- |trend| < weak → Neutral trend state.
- weak < |trend| ≤ strong → Bullish/Bearish.
- |trend| > strong → Extreme Bullish/Extreme Bearish.
B. Volume Thresholds
- Volume Climax Threshold – Upper bound at which volume is considered “climax” (unusually expanded participation).
- Volume Expansion Threshold – Boundary for normal expansion versus contraction.
Conceptually:
- Volume above “expansion” indicates increasing activity.
- Volume near or above “climax” marks extreme participation.
- Negative values below the symmetric thresholds map to contraction and extreme dry‑up (liquidity vacuum) states.
C. Delta Thresholds
- Strong Delta Threshold – Cut‑off for extreme buying or selling dominance in delta.
- Weak Delta Threshold – Threshold for mild buy/sell bias versus neutral order flow.
Combined with the sign of the delta vector, these thresholds classify order flow as:
- Extreme Buy, Buy‑Dominant, Neutral, Sell‑Dominant, Extreme Sell.
D. State Hysteresis Bars
- State Hysteresis Bars – Minimum number of bars for which a new state must persist before the engine commits to the change. This prevents the dashboard from flickering during fast spikes and emphasises persistent market behaviour.
- Smaller values switch states quickly; larger values demand more confirmation.
5. Visual Interface
Group: “Visual Interface”
A. Ribbon Base Color
- Ribbon Base Color – Base hue for the multi‑layer EMA ribbon drawn around price. The script plots a dense grid of hidden EMAs and fills the gaps between them to form a semi‑transparent band. Narrow, overlapping bands hint at compression; wider separation hints at dispersion across EMA horizons.
B. Show Dashboard
- Show Dashboard – Toggles the on‑chart table which summarises the current state engine output. Disable this if you only want to keep the EMA ribbon and volume‑based structure on the price chart.
C. Color Theme
- Color Theme – Switch between a dark and light style for the dashboard background and text colours so that the table matches your chart theme.
D. Table Position
- Table Position – Places the dashboard at any corner or edge of the chart (Top / Middle / Bottom × Left / Centre / Right).
E. Table Size
- Table Size – Changes the dashboard’s text size (Tiny, Small, Normal, Large). Use a larger size on high‑resolution screens or when streaming.
F. Show Extended Info
- Show Extended Info – Adds diagnostic rows under the main state summary:
- Mode / Primes / Vector – Shows the current calculation mode (Geometry / Intrabar), the selected intrabar resolution and coverage in bars ( ), how many prime periods are active, and the vector window.
- Values – Displays the current aggregated vectors:
- P: price vector
- V: volume vector
- B: buy‑volume vector
- S: sell‑volume vector
- D: delta vector
Values are bounded between ‑1 and +1.
- Volume Stats – Prints the last bar’s raw buy volume, sell volume and delta as formatted numbers.
- Footer – A final row with the symbol and current time: #SYMBOL | HH:MM.
These extended rows are meant for inspecting how the engine is behaving under the hood while you scroll the chart and compare different assets or timeframes.
6. Language Settings
Group: “Language Settings”
- Select Language – Switches the entire dashboard between English and Turkish.
The underlying calculations and scenario logic are identical; only the labels, titles and comments in the table are translated.
7. Dashboard Structure & Reading Guide
The table summarises the current situation in a few rows:
1. System Header – Shows the script name and the active calculation method (“Geometry” or “Intrabar”).
2. Scenario Title – High‑level description of the current combined scenario (e.g., “Trending Buy Confirmed”, “Sideways Balanced”, “Bull Trap”, “Blow‑Off Top”). The background colour is derived from the scenario family (trending, compression, exhaustion, anomaly, etc.).
3. Bias / Trend Line – States the dominant trend bias derived from the trend vector (Extreme Bullish, Bullish, Neutral, Bearish, Extreme Bearish).
4. Signal / Consideration Line – A short sentence giving qualitative guidance about the current state (for example: continuation risk, exhaustion risk, trap‑like behaviour, or compression). This is deliberately phrased as a consideration, not as a direct trading signal.
5. Trend / Volume / Delta Rows – Three separate rows explain, in plain language, how the trend, volume regime and delta are classified at this bar.
6. Extended Info (optional) – Mode / primes / vector settings, current vector values, and last‑bar volume statistics, as described above.
Together, these rows are meant to be read as a narrative of what price, volume and order‑flow are doing, not as mechanical instructions.
8. State Taxonomy
The state engine organizes market behaviour in three stages.
8.1 Trend States (from the Price Vector)
- Extreme Bullish Trend – The prime‑grid price vector is strongly upward; most EMAs are aligned to the upside.
- Bullish Trend – Upward bias is present, but less extreme.
- Neutral Trend – EMAs are mixed or flat; price is effectively sideways relative to the grid.
- Bearish Trend – Downward bias, with the EMA grid sloping down.
- Extreme Bearish Trend – Strong downside alignment across the grid.
8.2 Volume Regime States (from the Volume Vector)
- Volume Climax (Buy‑Side) – Strong positive volume vector; participation is unusually high in the current direction.
- Volume Expansion – Activity above normal but below the climax threshold.
- Neutral Volume – No major expansion or contraction versus recent history.
- Volume Contraction – Activity is drying up compared with the past.
- Extreme Dry‑Up / Liquidity Vacuum – Very low participation; the market is thin and prone to slippage.
8.3 Delta Behaviour States (from the Delta Vector)
- Extreme Buy Delta – Buying pressure dominates strongly.
- Buy‑Dominant Delta – Buy volume exceeds sell volume, but not at an extreme.
- Neutral Delta – Buy and sell flows are roughly balanced.
- Sell‑Dominant Delta – Selling pressure dominates.
- Extreme Sell Delta – Aggressive, one‑sided selling.
8.4 Combined Scenario State s
EMVOL uses the three base states above to generate a single scenario label. These scenarios are designed to be read as context, not as entry or exit signals.
Trending Scenarios
1. Trending Buy Confirmed
- Bullish or extreme bullish trend, supported by expanding or climax volume and buy‑side delta.
- Educational idea: a healthy uptrend where both participation and order flow agree with the direction.
2. Trending Buy – Weak Volume
- Bullish trend, but volume is neutral, contracting or in dry‑up while delta is still buy‑side.
- Educational idea: price is advancing, yet participation is thinning; trend continuation becomes more fragile.
3. Trending Sell Confirmed
- Bearish or extreme bearish trend, with expanding or climax volume and sell‑side delta.
- Educational idea: strong downtrend with both volume and order‑flow confirmation.
4. Trending Sell – Weak Volume
- Bearish trend, but volume is neutral, contracting or very low while delta remains sell‑side.
- Educational idea: downside continues but with limited participation; vulnerable to short‑covering.
Sideways / Range Scenarios
5. Sideways Balanced
- Neutral trend, neutral delta, neutral volume.
- Classic range environment; low directional edge, suitable for observation and context rather than trend trading.
6. Sideways with Buy Pressure
- Neutral trend, but buy‑side delta is dominant or extreme.
- Range with latent accumulation: price may still appear sideways, but buyers are quietly more active.
7. Sideways with Sell Pressure
- Neutral trend with dominant or extreme sell‑side delta.
- Distribution‑like environment where price chops while sellers are gradually more aggressive.
Exhaustion & Volume Extremes
8. Exhaustion – Buy Risk
- Extreme bullish trend, volume climax and strong buy‑side delta.
- Educational idea: very strong up‑move where both participation and delta are already stretched; risk of exhaustion or blow‑off.
9. Exhaustion – Sell Risk
- Extreme bearish trend, volume dry‑up and strong sell‑side delta.
- Suggests one‑sided selling into increasingly thin liquidity.
10. Volume Climax (Buy)
- Neutral trend, neutral delta, but volume at climax levels.
- Often associated with a “big event” bar where participation spikes without a clear directional commitment.
11. Volume Climax (Sell / Dry‑Up)
- Neutral trend and neutral delta, while the volume vector indicates an extreme dry‑up.
- Highlights a stand‑still episode: very limited interest from both sides, increasing the sensitivity to future impulses.
Divergences
12. Divergence – Bullish Context
- Bullish or extreme bullish trend, but delta has faded back to neutral.
- Price trend continues while order‑flow conviction softens; can precede pauses or complex corrections.
13. Divergence – Bearish Context
- Bearish or extreme bearish trend with a neutral delta.
- Downtrend persists, but selling pressure no longer dominates as clearly.
Consolidation & Compression
14. Consolidation
- Default state when no specific pattern dominates and the market is broadly balanced.
- Educational use: treat this as a “no strong edge” label; focus on structure rather than direction.
15. Breakout Imminent
- Neutral trend with contracting volume.
- Compression phase where energy is building up; often precedes transitions into trending or shock scenarios.
Traps & Hidden Divergences
16. Bull Trap
- Bullish trend, with neutral or contracting volume and sell‑side delta.
- Price appears strong, but order‑flow shifts against it; often seen near fake breakouts or failing rallies.
17. Bear Trap
- Bearish trend, neutral or contracting volume, but buy‑side delta.
- Downtrend “looks” intact, while buyers become more aggressive underneath the surface.
18. Hidden Bullish Divergence
- Bullish trend, contracting volume, but strong buy‑side delta.
- Educational idea: price dips or slows while aggressive buyers step in, often inside an ongoing uptrend.
19. Hidden Bearish Divergence
- Bearish trend, volume expansion and strong sell‑side delta.
- Reinforced downside pressure even if price is temporarily retracing.
Reversal & Transition Patterns
20. Reversal to Bearish
- Neutral trend, volume climax and strong sell‑side delta.
- Suggests that heavy selling appears at the top of a move, turning a previously neutral or rising context into potential downside.
21. Reversal to Bullish
- Neutral trend, extreme volume dry‑up and strong buy‑side delta.
- Often associated with selling exhaustion where buyers start to take control.
22. Indecision Spike
- Neutral trend with extreme volume (climax or dry‑up) but neutral delta.
- Crowd participation changes sharply while order‑flow remains undecided; treat as an informational spike rather than a direction.
Extended Compression & Acceleration
23. Coiling Phase
- Neutral trend, contracting volume, and delta that is neutral or only mildly one‑sided.
- Extended compression where price, volume and delta all contract into a tightly coiled range, often preceding a strong move.
24. Bullish Acceleration
- Bullish trend with volume expansion and strong buy‑side delta.
- Uptrend not only continues but gains kinetic strength; educationally, this illustrates how trend, volume and delta align in the strongest phases of a move.
25. Bearish Acceleration
- Bearish trend with volume expansion and strong sell‑side delta.
- Mirror image of Bullish Acceleration on the downside.
Trend Exhaustion & Climax Reversal
26. Bull Exhaustion
- Bullish or extreme bullish trend, with contraction or dry‑up in volume and buy‑side or neutral delta.
- The move has already travelled far; participation fades while price is still elevated.
27. Bear Exhaustion
- Bearish or extreme bearish trend, with volume climax or contraction and sell‑side or neutral delta.
- Down‑move may be approaching a point where additional selling pressure has diminishing impact.
28. Blow‑Off Top
- Extreme bullish trend, volume climax and extreme buy delta all at once.
- Classic blow‑off behaviour: price, volume and order‑flow are simultaneously stretched in the same direction.
29. Selling Climax Reversal
- Extreme bearish trend with extreme volume dry‑up and extreme sell‑side delta.
- Marks a very aggressive capitulation phase that can precede major rebounds.
Advanced VSA / Anomaly Scenarios
30. Absorption
- Typically neutral trend with expanding or climax volume and extreme delta (either buy or sell).
- Educational focus: large participants are aggressively absorbing liquidity from the opposite side, while price remains relatively contained.
31. Distribution
- Scenario where volume remains elevated while directional conviction weakens and the trend slows.
- Represents potential “selling into strength” or “buying into weakness”, depending on the active side.
32. Liquidity Vacuum
- Combination of thin liquidity (extreme dry‑up) with a directional trend or strong delta.
- Highlights environments where even small orders can move price disproportionately.
33. Anomaly / Shock Event
- Triggered when the vector z‑scores detect rare combinations of price, volume and delta behaviour that deviate from their own historical distribution.
- Intended as a warning label for unusual events rather than a specific tradeable pattern.
9. Educational Usage Notes
- EMVOL does not produce mechanical “buy” or “sell” commands. Instead, it classes each bar into an interpretable state so that traders can study how trends, volume and order‑flow interact over time.
- A common exercise is to overlay your usual EMA crossovers, support/resistance or price patterns and observe which EMVOL scenarios appear around entries, exits, traps and climaxes.
- Because the vectors are normalized (bounded between ‑1 and +1) and then discretized, the same conceptual states can be compared across different symbols and timeframes.
10. Disclaimer & Educational Purpose
This indicator is provided strictly as an educational and analytical tool. Its purpose is to help visualise how price, volume and order‑flow interact; it is not designed to function as a stand‑alone trading system.
Please note:
1. No Automated Strategy – The script does not implement a complete trading strategy. Scenario labels and dashboard messages are descriptive and should not be followed as unconditional entry or exit signals.
2. No Financial Advice – All information produced by this indicator is general market analysis. It must not be interpreted as investment, financial or trading advice, or as a recommendation to buy or sell any instrument.
3. Risk Warning – Trading and investing involve substantial risk, including the risk of loss. Always perform your own analysis, use appropriate position sizing and risk management, and consult a qualified professional if needed. You are solely responsible for any decisions made using this tool.
4. Data Precision & Platform Limits – The “Intrabar (Precise)” mode depends on the availability of high‑resolution historical data at the chosen intrabar timeframe. If your TradingView plan or the symbol’s history does not provide sufficient depth, this mode may only partially cover the visible chart. In such cases, consider switching to “Geometry (Source File)” for a fully populated view.

猛の掟・初動完成版//@version=5
indicator("猛の掟・初動スクリーナー_完成版", overlay=true)
// =============================
// 入力パラメータ
// =============================
emaLenShort = input.int(5, "短期EMA", minval=1)
emaLenMid = input.int(13, "中期EMA", minval=1)
emaLenLong = input.int(26, "長期EMA", minval=1)
macdFastLen = input.int(12, "MACD Fast", minval=1)
macdSlowLen = input.int(26, "MACD Slow", minval=1)
macdSignalLen = input.int(9, "MACD Signal", minval=1)
macdZeroTh = input.float(0.2, "MACDゼロライン近辺とみなす許容値", step=0.05)
volMaLen = input.int(5, "出来高平均日数", minval=1)
volMinRatio = input.float(1.3, "出来高倍率(初動判定しきい値)", step=0.1)
volStrongRatio = input.float(1.5, "出来高倍率(本物/三点シグナル用)", step=0.1)
highLookback = input.int(60, "直近高値の参照本数", minval=10)
pullbackMin = input.float(5.0, "押し目最小 ", step=0.5)
pullbackMax = input.float(15.0, "押し目最大 ", step=0.5)
breakLookback = input.int(15, "レジブレ後とみなす本数", minval=1)
wickBodyMult = input.float(2.0, "ピンバー:下ヒゲが実体の何倍以上か", step=0.5)
// ★ シグナル表示 ON/OFF
showMou = input.bool(true, "猛シグナルを表示")
showKaku = input.bool(true, "確シグナルを表示")
// =============================
// 基本指標計算
// =============================
emaShort = ta.ema(close, emaLenShort)
emaMid = ta.ema(close, emaLenMid)
emaLong = ta.ema(close, emaLenLong)
= ta.macd(close, macdFastLen, macdSlowLen, macdSignalLen)
volMa = ta.sma(volume, volMaLen)
volRatio = volMa > 0 ? volume / volMa : 0.0
recentHigh = ta.highest(high, highLookback)
prevHigh = ta.highest(high , highLookback)
pullbackPct = recentHigh > 0 ? (recentHigh - close) / recentHigh * 100.0 : 0.0
// ローソク足
body = math.abs(close - open)
upperWick = high - math.max(open, close)
lowerWick = math.min(open, close) - low
// =============================
// A:トレンド条件
// =============================
emaUp = emaShort > emaShort and emaMid > emaMid and emaLong > emaLong
goldenOrder = emaShort > emaMid and emaMid > emaLong
aboveEma2 = close > emaLong and close > emaLong
trendOK = emaUp and goldenOrder and aboveEma2
// =============================
// B:MACD条件
// =============================
macdGC = ta.crossover(macdLine, macdSignal)
macdNearZero = math.abs(macdLine) <= macdZeroTh
macdUp = macdLine > macdLine
macdOK = macdGC and macdNearZero and macdUp
// =============================
// C:出来高条件
// =============================
volInitOK = volRatio >= volMinRatio // 8条件用
volStrongOK = volRatio >= volStrongRatio // 三点シグナル用
volumeOK = volInitOK
// =============================
// D:ローソク足パターン
// =============================
isBullPinbar = lowerWick > wickBodyMult * body and lowerWick > upperWick and close >= open
isBullEngulf = close > open and open < close and close > open
isBigBullCross = close > emaShort and close > emaMid and open < emaShort and open < emaMid and close > open
candleOK = isBullPinbar or isBullEngulf or isBigBullCross
// =============================
// E:価格帯(押し目&レジブレ)
// =============================
pullbackOK = pullbackPct >= pullbackMin and pullbackPct <= pullbackMax
isBreakout = close > prevHigh and close <= prevHigh
barsSinceBreak = ta.barssince(isBreakout)
afterBreakZone = barsSinceBreak >= 0 and barsSinceBreak <= breakLookback
afterBreakPullbackOK = afterBreakZone and pullbackOK and close > emaShort
priceOK = pullbackOK and afterBreakPullbackOK
// =============================
// 8条件の統合
// =============================
allRulesOK = trendOK and macdOK and volumeOK and candleOK and priceOK
// =============================
// 最終三点シグナル
// =============================
longLowerWick = lowerWick > wickBodyMult * body and lowerWick > upperWick
macdGCAboveZero = ta.crossover(macdLine, macdSignal) and macdLine > 0
volumeSpike = volStrongOK
finalThreeSignal = longLowerWick and macdGCAboveZero and volumeSpike
buyConfirmed = allRulesOK and finalThreeSignal
// =============================
// 描画
// =============================
plot(emaShort, color=color.new(color.yellow, 0), title="EMA 短期(5)")
plot(emaMid, color=color.new(color.orange, 0), title="EMA 中期(13)")
plot(emaLong, color=color.new(color.blue, 0), title="EMA 長期(26)")
// シグナル表示(ON/OFF付き)
plotshape(showMou and allRulesOK, title="猛の掟 8条件クリア候補", location=location.belowbar, color=color.new(color.lime, 0), text="猛")
plotshape(showKaku and buyConfirmed, title="猛の掟 最終三点シグナル確定", location=location.belowbar, color=color.new(color.yellow, 0), text="確")
// =============================
// アラート条件
// =============================
alertcondition(allRulesOK, title="猛の掟 8条件クリア候補", message="猛の掟 8条件クリア候補シグナル発生")
alertcondition(buyConfirmed, title="猛の掟 最終三点シグナル確定", message="猛の掟 最終三点シグナル=買い確定")

Stochastic + MACD Alignment Signals//@version=5
indicator("Stochastic + MACD Alignment Signals", overlay=true)
// ————— INPUTS —————
stochLength = input.int(14, "Stoch Length")
k = input.int(3, "K Smoothing")
d = input.int(3, "D Smoothing")
macdFast = input.int(12, "MACD Fast Length")
macdSlow = input.int(26, "MACD Slow Length")
macdSignal = input.int(9, "MACD Signal Length")
emaLen = input.int(21, "EMA Filter Length")
// ————— CALCULATIONS —————
// Stochastic
kRaw = ta.stoch(close, high, low, stochLength)
kSmooth = ta.sma(kRaw, k)
dSmooth = ta.sma(kSmooth, d)
// MACD
macd = ta.ema(close, macdFast) - ta.ema(close, macdSlow)
signal = ta.ema(macd, macdSignal)
hist = macd - signal
// EMA Filter
ema = ta.ema(close, emaLen)
// ————— SIGNAL CONDITIONS —————
// BUY CONDITIONS
stochBull = ta.crossover(kSmooth, dSmooth) and kSmooth < 20
macdBull = ta.crossover(macd, signal) or (hist > 0)
emaBull = close > ema
buySignal = stochBull and macdBull and emaBull
// SELL CONDITIONS
stochBear = ta.crossunder(kSmooth, dSmooth) and kSmooth > 80
macdBear = ta.crossunder(macd, signal) or (hist < 0)
emaBear = close < ema
sellSignal = stochBear and macdBear and emaBear
// ————— PLOTTING SIGNALS —————
plotshape(buySignal, title="BUY", style=shape.labelup,
color=color.new(color.green, 0), size=size.large, text="BUY")
plotshape(sellSignal, title="SELL", style=shape.labeldown,
color=color.new(color.red, 0), size=size.large, text="SELL")
// ————— OPTIONAL ALERTS —————
alertcondition(buySignal, title="Buy Signal", message="Stoch + MACD Alignment BUY")
alertcondition(sellSignal, title="Sell Signal", message="Stoch + MACD Alignment SELL")
Golden Cross RSI Daily Helper (US Stocks)//@version=5
indicator("Golden Cross RSI Daily Helper (US Stocks)", overlay=true, timeframe="D", timeframe_gaps=true)
//========= الإعدادات الأساسية =========//
emaFastLen = input.int(50, "EMA سريع (اتجاه قصير المدى)")
emaSlowLen = input.int(200, "EMA بطيء (اتجاه طويل المدى)")
rsiLen = input.int(14, "فترة RSI")
rsiMin = input.float(40.0, "حد RSI الأدنى للدخول", 0.0, 100.0)
rsiMax = input.float(60.0, "حد RSI الأعلى للدخول", 0.0, 100.0)
slBufferPerc = input.float(1.5, "نسبة البفر لوقف الخسارة (%) أسفل/أعلى EMA200", 0.1, 5.0)
rrRatio = input.float(2.0, "نسبة العائد إلى المخاطرة (R:R)", 1.0, 5.0)
//========= حساب المؤشرات =========//
emaFast = ta.ema(close, emaFastLen)
emaSlow = ta.ema(close, emaSlowLen)
rsiVal = ta.rsi(close, rsiLen)
// اتجاه السوق
trendUp = emaFast > emaSlow
trendDown = emaFast < emaSlow
// ارتداد السعر من EMA50 أو EMA200 تقريبياً
bounceFromEmaFast = close > emaFast and low <= emaFast
bounceFromEmaSlow = close > emaSlow and low <= emaSlow
bounceLong = bounceFromEmaFast or bounceFromEmaSlow
bounceFromEmaFastShort = close < emaFast and high >= emaFast
bounceFromEmaSlowShort = close < emaSlow and high >= emaSlow
bounceShort = bounceFromEmaFastShort or bounceFromEmaSlowShort
// فلتر RSI
rsiOk = rsiVal >= rsiMin and rsiVal <= rsiMax
//========= شروط الدخول =========//
// شراء
longSignal = trendUp and bounceLong and rsiOk
// بيع
shortSignal = trendDown and bounceShort and rsiOk
//========= حساب وقف الخسارة والأهداف =========//
// نستخدم سعر إغلاق شمعة الإشارة كسعر دخول افتراضي
entryPriceLong = close
entryPriceShort = close
// وقف الخسارة حسب EMA200 + البفر
slLong = emaSlow * (1.0 - slBufferPerc / 100.0)
slShort = emaSlow * (1.0 + slBufferPerc / 100.0)
// المسافة بين الدخول ووقف الخسارة
riskLong = math.max(entryPriceLong - slLong, syminfo.mintick)
riskShort = math.max(slShort - entryPriceShort, syminfo.mintick)
// هدف الربح حسب R:R
tpLong = entryPriceLong + rrRatio * riskLong
tpShort = entryPriceShort - rrRatio * riskShort
//========= الرسم على الشارت =========//
// رسم المتوسطات
plot(emaFast, title="EMA 50", color=color.new(color.blue, 0), linewidth=2)
plot(emaSlow, title="EMA 200", color=color.new(color.orange, 0), linewidth=2)
// تلوين الخلفية حسب الاتجاه
bgcolor(trendUp ? color.new(color.green, 92) : trendDown ? color.new(color.red, 92) : na)
// إشارة شراء
plotshape(
longSignal,
title = "إشارة شراء",
style = shape.triangleup,
location = location.belowbar,
size = size.large,
color = color.new(color.green, 0),
text = "BUY")
// إشارة بيع
plotshape(
shortSignal,
title = "إشارة بيع",
style = shape.triangledown,
location = location.abovebar,
size = size.large,
color = color.new(color.red, 0),
text = "SELL")
// رسم SL و TP عند ظهور الإشارة
slPlotLong = longSignal ? slLong : na
tpPlotLong = longSignal ? tpLong : na
slPlotShort = shortSignal ? slShort : na
tpPlotShort = shortSignal ? tpShort : na
plot(slPlotLong, title="وقف خسارة شراء", color=color.new(color.red, 0), style=plot.style_linebr)
plot(tpPlotLong, title="هدف شراء", color=color.new(color.green, 0), style=plot.style_linebr)
plot(slPlotShort, title="وقف خسارة بيع", color=color.new(color.red, 0), style=plot.style_linebr)
plot(tpPlotShort, title="هدف بيع", color=color.new(color.green, 0), style=plot.style_linebr)
//========= إعداد التنبيهات =========//
alertcondition(longSignal, title="تنبيه إشارة شراء", message="إشارة شراء: ترند صاعد + ارتداد من EMA + RSI في المنطقة المسموحة.")
alertcondition(shortSignal, title="تنبيه إشارة بيع", message="إشارة بيع: ترند هابط + ارتداد من EMA + RSI في المنطقة المسموحة.")

Market Structure Shift (MSS) [Sword & Shield]MARKET STRUCTURE SHIFT (MSS)
A clean and focused indicator for identifying Market Structure Shifts in price action.
════════════════════════════════════════════════════════════════════════════════
WHAT IS MARKET STRUCTURE SHIFT (MSS)?
════════════════════════════════════════════════════════════════════════════════
A Market Structure Shift occurs when price breaks a significant swing high or swing low,
indicating a potential change in market direction. This indicator automatically detects
and plots these key levels.
BULLISH MSS: Price breaks above a previous swing high
BEARISH MSS: Price breaks below a previous swing low
════════════════════════════════════════════════════════════════════════════════
FEATURES
════════════════════════════════════════════════════════════════════════════════
CLEAN DISPLAY
- Shows only the last 2 MSS by default (1 bullish + 1 bearish)
- Keeps charts clean and focused on recent structure
- Automatically removes old MSS when new ones appear
CUSTOMIZABLE DETECTION
- Adjustable swing detection (left/right bars)
- Choose break confirmation method (Close or Wick)
- Fixed-length lines (no infinite extension by default)
SMART FILTERING
- Only plots one MSS per direction until opposite MSS occurs
- Prevents duplicate signals in the same direction
- Clear visual distinction between bullish (blue) and bearish (red)
CLEAN LABELS
- Text labels positioned above lines
- No background tooltips for cleaner appearance
- Color-matched to their respective MSS lines
════════════════════════════════════════════════════════════════════════════════
SETTINGS
════════════════════════════════════════════════════════════════════════════════
SWING DETECTION
- Swing Left Bars (default: 2)
- Swing Right Bars (default: 2)
- Higher values = more significant swings detected
BREAK CONFIRMATION
- Close: MSS confirmed when candle closes beyond level
- Wick: MSS confirmed when wick touches beyond level
DISPLAY OPTIONS
- Show Only Last 2 MSS: ON by default (keeps chart clean)
- Extend lines to the right: OFF by default (fixed-length lines)
- Line bars (when not extended): 50 bars (customizable)
════════════════════════════════════════════════════════════════════════════════
HOW IT WORKS
════════════════════════════════════════════════════════════════════════════════
DETECTION LOGIC
1. Identifies swing highs and swing lows using pivot detection
2. Monitors price action for breaks of these levels
3. Confirms break based on selected method (Close or Wick)
4. Plots MSS line at the broken level
FILTERING LOGIC
- Only one MSS per direction is allowed consecutively
- Example: If bullish MSS appears, no new bullish MSS until bearish MSS occurs
- This prevents multiple signals in trending markets
DISPLAY LOGIC
- When "Show Only Last 2 MSS" is enabled:
• Only the most recent bullish MSS is shown
• Only the most recent bearish MSS is shown
• Old MSS are automatically deleted when new ones appear
- When disabled: All historical MSS remain visible
════════════════════════════════════════════════════════════════════════════════
USAGE EXAMPLES
════════════════════════════════════════════════════════════════════════════════
FOR TREND IDENTIFICATION
- Bullish MSS = Potential uptrend beginning
- Bearish MSS = Potential downtrend beginning
- Use in conjunction with other indicators for confirmation
FOR ENTRY SIGNALS
- Wait for MSS to confirm trend change
- Enter on pullback to MSS level
- Use MSS as support/resistance
FOR SCALPING (Lower Timeframes)
- Swing Left/Right Bars: 2-3 (more sensitive)
- Break Confirmation: Close (more reliable)
- Show Only Last 2 MSS: ON (cleaner charts)
FOR SWING TRADING (Higher Timeframes)
- Swing Left/Right Bars: 5-10 (more significant swings)
- Break Confirmation: Close (avoid false breaks)
- Show Only Last 2 MSS: ON or OFF based on preference
════════════════════════════════════════════════════════════════════════════════
VISUAL DESIGN
════════════════════════════════════════════════════════════════════════════════
LINES
- Dashed style for easy identification
- Blue for bullish MSS
- Red for bearish MSS
- Fixed length (50 bars default) for cleaner appearance
LABELS
- "MSS" text positioned above each line
- No background for clean display
- Color-matched to line color
- Small size to avoid chart clutter
════════════════════════════════════════════════════════════════════════════════
CREDITS & LICENSE
════════════════════════════════════════════════════════════════════════════════
© Sword & Shield
This Pine Script code is subject to the terms of the Mozilla Public License 2.0
mozilla.org

XAUUSD 1m SMC Zones (BOS + Flexible TP Modes + Trailing Runner)//@version=6
strategy("XAUUSD 1m SMC Zones (BOS + Flexible TP Modes + Trailing Runner)",
overlay = true,
initial_capital = 10000,
pyramiding = 10,
process_orders_on_close = true)
//━━━━━━━━━━━━━━━━━━━
// 1. INPUTS
//━━━━━━━━━━━━━━━━━━━
// TP / SL
tp1Pips = input.int(10, "TP1 (pips)", minval = 1)
fixedSLpips = input.int(50, "Fixed SL (pips)", minval = 5)
runnerRR = input.float(3.0, "Runner RR (TP2 = SL * RR)", step = 0.1, minval = 1.0)
// Daily risk
maxDailyLossPct = input.float(5.0, "Max daily loss % (stop trading)", step = 0.5)
maxDailyProfitPct = input.float(20.0, "Max daily profit % (stop trading)", step = 1.0)
// HTF S/R (1H)
htfTF = input.string("60", "HTF timeframe (minutes) for S/R block")
// Profit strategy (Option C)
profitStrategy = input.string("Minimal Risk | Full BE after TP1", "Profit Strategy", options = )
// Runner stop mode (your option 4)
runnerStopMode = input.string( "BE only", "Runner Stop Mode", options = )
// ATR trail settings (only used if ATR mode selected)
atrTrailLen = input.int(14, "ATR Length (trail)", minval = 1)
atrTrailMult = input.float(1.0, "ATR Multiplier (trail)", step = 0.1, minval = 0.1)
// Pip size (for XAUUSD: 1 pip = 0.10 if tick = 0.01)
pipSize = syminfo.mintick * 10.0
tp1Points = tp1Pips * pipSize
slPoints = fixedSLpips * pipSize
baseQty = input.float (1.0, "Base order size" , step = 0.01, minval = 0.01)
//━━━━━━━━━━━━━━━━━━━
// 2. DAILY RISK MANAGEMENT
//━━━━━━━━━━━━━━━━━━━
isNewDay = ta.change(time("D")) != 0
var float dayStartEquity = na
var bool dailyStopped = false
equityNow = strategy.initial_capital + strategy.netprofit
if isNewDay or na(dayStartEquity)
dayStartEquity := equityNow
dailyStopped := false
dailyPnL = equityNow - dayStartEquity
dailyPnLPct = dayStartEquity != 0 ? (dailyPnL / dayStartEquity) * 100.0 : 0.0
if not dailyStopped
if dailyPnLPct <= -maxDailyLossPct
dailyStopped := true
if dailyPnLPct >= maxDailyProfitPct
dailyStopped := true
canTradeToday = not dailyStopped
//━━━━━━━━━━━━━━━━━━━
// 3. 1H S/R ZONES (for direction block)
//━━━━━━━━━━━━━━━━━━━
htOpen = request.security(syminfo.tickerid, htfTF, open)
htHigh = request.security(syminfo.tickerid, htfTF, high)
htLow = request.security(syminfo.tickerid, htfTF, low)
htClose = request.security(syminfo.tickerid, htfTF, close)
// Engulf logic on HTF
htBullPrev = htClose > htOpen
htBearPrev = htClose < htOpen
htBearEngulf = htClose < htOpen and htBullPrev and htOpen >= htClose and htClose <= htOpen
htBullEngulf = htClose > htOpen and htBearPrev and htOpen <= htClose and htClose >= htOpen
// Liquidity sweep on HTF previous candle
htSweepHigh = htHigh > ta.highest(htHigh, 5)
htSweepLow = htLow < ta.lowest(htLow, 5)
// Store last HTF zones
var float htResHigh = na
var float htResLow = na
var float htSupHigh = na
var float htSupLow = na
if htBearEngulf and htSweepHigh
htResHigh := htHigh
htResLow := htLow
if htBullEngulf and htSweepLow
htSupHigh := htHigh
htSupLow := htLow
// Are we inside HTF zones?
inHtfRes = not na(htResHigh) and close <= htResHigh and close >= htResLow
inHtfSup = not na(htSupLow) and close >= htSupLow and close <= htSupHigh
// Block direction against HTF zones
longBlockedByZone = inHtfRes // no buys in HTF resistance
shortBlockedByZone = inHtfSup // no sells in HTF support
//━━━━━━━━━━━━━━━━━━━
// 4. 1m LOCAL ZONES (LIQUIDITY SWEEP + ENGULF + QUALITY SCORE)
//━━━━━━━━━━━━━━━━━━━
// 1m engulf patterns
bullPrev1 = close > open
bearPrev1 = close < open
bearEngulfNow = close < open and bullPrev1 and open >= close and close <= open
bullEngulfNow = close > open and bearPrev1 and open <= close and close >= open
// Liquidity sweep by previous candle on 1m
sweepHighPrev = high > ta.highest(high, 5)
sweepLowPrev = low < ta.lowest(low, 5)
// Local zone storage (one active support + one active resistance)
// Quality score: 1 = engulf only, 2 = engulf + sweep (we only trade ≥2)
var float supLow = na
var float supHigh = na
var int supQ = 0
var bool supUsed = false
var float resLow = na
var float resHigh = na
var int resQ = 0
var bool resUsed = false
// New resistance zone: previous bullish candle -> bear engulf
if bearEngulfNow
resLow := low
resHigh := high
resQ := sweepHighPrev ? 2 : 1
resUsed := false
// New support zone: previous bearish candle -> bull engulf
if bullEngulfNow
supLow := low
supHigh := high
supQ := sweepLowPrev ? 2 : 1
supUsed := false
// Raw "inside zone" detection
inSupRaw = not na(supLow) and close >= supLow and close <= supHigh
inResRaw = not na(resHigh) and close <= resHigh and close >= resLow
// QUALITY FILTER: only trade zones with quality ≥ 2 (engulf + sweep)
highQualitySup = supQ >= 2
highQualityRes = resQ >= 2
inSupZone = inSupRaw and highQualitySup and not supUsed
inResZone = inResRaw and highQualityRes and not resUsed
// Plot zones
plot(supLow, "Sup Low", color = color.new(color.lime, 60), style = plot.style_linebr)
plot(supHigh, "Sup High", color = color.new(color.lime, 60), style = plot.style_linebr)
plot(resLow, "Res Low", color = color.new(color.red, 60), style = plot.style_linebr)
plot(resHigh, "Res High", color = color.new(color.red, 60), style = plot.style_linebr)
//━━━━━━━━━━━━━━━━━━━
// 5. MODERATE BOS (3-BAR FRACTAL STRUCTURE)
//━━━━━━━━━━━━━━━━━━━
// 3-bar swing highs/lows
swHigh = high > high and high > high
swLow = low < low and low < low
var float lastSwingHigh = na
var float lastSwingLow = na
if swHigh
lastSwingHigh := high
if swLow
lastSwingLow := low
// BOS conditions
bosUp = not na(lastSwingHigh) and close > lastSwingHigh
bosDown = not na(lastSwingLow) and close < lastSwingLow
// Zone “arming” and BOS validation
var bool supArmed = false
var bool resArmed = false
var bool supBosOK = false
var bool resBosOK = false
// Arm zones when first touched
if inSupZone
supArmed := true
if inResZone
resArmed := true
// BOS after arming → zone becomes valid for entries
if supArmed and bosUp
supBosOK := true
if resArmed and bosDown
resBosOK := true
// Reset BOS flags when new zones are created
if bullEngulfNow
supArmed := false
supBosOK := false
if bearEngulfNow
resArmed := false
resBosOK := false
//━━━━━━━━━━━━━━━━━━━
// 6. ENTRY CONDITIONS (ZONE + BOS + RISK STATE)
//━━━━━━━━━━━━━━━━━━━
flatOrShort = strategy.position_size <= 0
flatOrLong = strategy.position_size >= 0
longSignal = canTradeToday and not longBlockedByZone and inSupZone and supBosOK and flatOrShort
shortSignal = canTradeToday and not shortBlockedByZone and inResZone and resBosOK and flatOrLong
//━━━━━━━━━━━━━━━━━━━
// 7. ORDER LOGIC – TWO PROFIT STRATEGIES
//━━━━━━━━━━━━━━━━━━━
// Common metrics
atrTrail = ta.atr(atrTrailLen)
// MINIMAL MODE: single trade, BE after TP1, optional trailing
// HYBRID MODE: two trades (Scalp @ TP1, Runner @ TP2)
// Persistent tracking
var float longEntry = na
var float longTP1 = na
var float longTP2 = na
var float longSL = na
var bool longBE = false
var float longRunEntry = na
var float longRunTP1 = na
var float longRunTP2 = na
var float longRunSL = na
var bool longRunBE = false
var float shortEntry = na
var float shortTP1 = na
var float shortTP2 = na
var float shortSL = na
var bool shortBE = false
var float shortRunEntry = na
var float shortRunTP1 = na
var float shortRunTP2 = na
var float shortRunSL = na
var bool shortRunBE = false
isMinimal = profitStrategy == "Minimal Risk | Full BE after TP1"
isHybrid = profitStrategy == "Hybrid | Scalp TP + Runner TP"
//━━━━━━━━━━ LONG ENTRIES ━━━━━━━━━━
if longSignal
if isMinimal
longEntry := close
longSL := longEntry - slPoints
longTP1 := longEntry + tp1Points
longTP2 := longEntry + slPoints * runnerRR
longBE := false
strategy.entry("Long", strategy.long)
supUsed := true
supArmed := false
supBosOK := false
else if isHybrid
longRunEntry := close
longRunSL := longRunEntry - slPoints
longRunTP1 := longRunEntry + tp1Points
longRunTP2 := longRunEntry + slPoints * runnerRR
longRunBE := false
// Two separate entries, each 50% of baseQty (for backtest)
strategy.entry("LongScalp", strategy.long, qty = baseQty * 0.5)
strategy.entry("LongRun", strategy.long, qty = baseQty * 0.5)
supUsed := true
supArmed := false
supBosOK := false
//━━━━━━━━━━ SHORT ENTRIES ━━━━━━━━━━
if shortSignal
if isMinimal
shortEntry := close
shortSL := shortEntry + slPoints
shortTP1 := shortEntry - tp1Points
shortTP2 := shortEntry - slPoints * runnerRR
shortBE := false
strategy.entry("Short", strategy.short)
resUsed := true
resArmed := false
resBosOK := false
else if isHybrid
shortRunEntry := close
shortRunSL := shortRunEntry + slPoints
shortRunTP1 := shortRunEntry - tp1Points
shortRunTP2 := shortRunEntry - slPoints * runnerRR
shortRunBE := false
strategy.entry("ShortScalp", strategy.short, qty = baseQty * 50)
strategy.entry("ShortRun", strategy.short, qty = baseQty * 50)
resUsed := true
resArmed := false
resBosOK := false
//━━━━━━━━━━━━━━━━━━━
// 8. EXIT LOGIC – MINIMAL MODE
//━━━━━━━━━━━━━━━━━━━
// LONG – Minimal Risk: 1 trade, BE after TP1, runner to TP2
if isMinimal and strategy.position_size > 0 and not na(longEntry)
// Move to BE once TP1 is touched
if not longBE and high >= longTP1
longBE := true
// Base SL: BE or initial SL
float dynLongSL = longBE ? longEntry : longSL
// Optional trailing after BE
if longBE
if runnerStopMode == "Structure trail" and not na(lastSwingLow) and lastSwingLow > longEntry
dynLongSL := math.max(dynLongSL, lastSwingLow)
if runnerStopMode == "ATR trail"
trailSL = close - atrTrailMult * atrTrail
dynLongSL := math.max(dynLongSL, trailSL)
strategy.exit("Long Exit", "Long", stop = dynLongSL, limit = longTP2)
// SHORT – Minimal Risk: 1 trade, BE after TP1, runner to TP2
if isMinimal and strategy.position_size < 0 and not na(shortEntry)
if not shortBE and low <= shortTP1
shortBE := true
float dynShortSL = shortBE ? shortEntry : shortSL
if shortBE
if runnerStopMode == "Structure trail" and not na(lastSwingHigh) and lastSwingHigh < shortEntry
dynShortSL := math.min(dynShortSL, lastSwingHigh)
if runnerStopMode == "ATR trail"
trailSLs = close + atrTrailMult * atrTrail
dynShortSL := math.min(dynShortSL, trailSLs)
strategy.exit("Short Exit", "Short", stop = dynShortSL, limit = shortTP2)
//━━━━━━━━━━━━━━━━━━━
// 9. EXIT LOGIC – HYBRID MODE
//━━━━━━━━━━━━━━━━━━━
// LONG – Hybrid: Scalp + Runner
if isHybrid
// Scalp leg: full TP at TP1
if strategy.opentrades > 0
strategy.exit("LScalp TP", "LongScalp", stop = longRunSL, limit = longRunTP1)
// Runner leg
if strategy.position_size > 0 and not na(longRunEntry)
if not longRunBE and high >= longRunTP1
longRunBE := true
float dynLongRunSL = longRunBE ? longRunEntry : longRunSL
if longRunBE
if runnerStopMode == "Structure trail" and not na(lastSwingLow) and lastSwingLow > longRunEntry
dynLongRunSL := math.max(dynLongRunSL, lastSwingLow)
if runnerStopMode == "ATR trail"
trailRunSL = close - atrTrailMult * atrTrail
dynLongRunSL := math.max(dynLongRunSL, trailRunSL)
strategy.exit("LRun TP", "LongRun", stop = dynLongRunSL, limit = longRunTP2)
// SHORT – Hybrid: Scalp + Runner
if isHybrid
if strategy.opentrades > 0
strategy.exit("SScalp TP", "ShortScalp", stop = shortRunSL, limit = shortRunTP1)
if strategy.position_size < 0 and not na(shortRunEntry)
if not shortRunBE and low <= shortRunTP1
shortRunBE := true
float dynShortRunSL = shortRunBE ? shortRunEntry : shortRunSL
if shortRunBE
if runnerStopMode == "Structure trail" and not na(lastSwingHigh) and lastSwingHigh < shortRunEntry
dynShortRunSL := math.min(dynShortRunSL, lastSwingHigh)
if runnerStopMode == "ATR trail"
trailRunSLs = close + atrTrailMult * atrTrail
dynShortRunSL := math.min(dynShortRunSL, trailRunSLs)
strategy.exit("SRun TP", "ShortRun", stop = dynShortRunSL, limit = shortRunTP2)
//━━━━━━━━━━━━━━━━━━━
// 10. RESET STATE WHEN FLAT
//━━━━━━━━━━━━━━━━━━━
if strategy.position_size == 0
longEntry := na
shortEntry := na
longBE := false
shortBE := false
longRunEntry := na
shortRunEntry := na
longRunBE := false
shortRunBE := false
//━━━━━━━━━━━━━━━━━━━
// 11. VISUAL ENTRY MARKERS
//━━━━━━━━━━━━━━━━━━━
plotshape(longSignal, title = "Long Signal", style = shape.triangleup,
location = location.belowbar, color = color.lime, size = size.tiny, text = "L")
plotshape(shortSignal, title = "Short Signal", style = shape.triangledown,
location = location.abovebar, color = color.red, size = size.tiny, text = "S")

MTF OB & FVG detector w/ Alerts v2# MTF Order Blocks & Fair Value Gaps Detector with Alerts v2
## Overview
This indicator combines **Multi-Timeframe Order Blocks (OB)** and **Fair Value Gaps (FVG)** detection with integrated bounce alerts. It displays Order Blocks and Fair Value Gaps across multiple timeframes simultaneously and generates real-time alerts when price bounces from these critical zones.
## Key Features
### 🎯 Multi-Timeframe Order Blocks Detection
- **Volumetric Analysis**: Each Order Block displays total volume and dominant side percentage
- **Multiple Timeframes**: Supports 1min, 3min, 5min, 15min, and 60min timeframes
- **Smart Combining**: Automatically merges overlapping Order Blocks from different timeframes into powerful confluence zones
- **Dynamic Extension**: Order Blocks extend until broken, providing clear visual guidance
- **Volume Distribution**: Shows bullish vs bearish volume breakdown with percentage
### 📊 Fair Value Gaps (FVG) Detection
- **Lightweight Processing**: Works on current chart timeframe only for optimal performance
- **Volume Metrics**: Displays FVG volume and dominant side percentage
- **Mitigation Tracking**: Automatically tracks when FVGs are filled or broken
- **Customizable Mitigation Source**: Choose between close price or high/low wicks
### 🔔 Comprehensive Alert System
- **Bounce Alerts**: Get notified when price bounces from OB or FVG zones
- **New Formation Alerts**: Alerts when new Order Blocks or Fair Value Gaps form
- **Combined Zone Alerts**: Special alerts when multiple Order Blocks merge into strong confluence zones
- **Customizable Thresholds**: Set minimum number of combined OBs required for strong zone alerts
### 🎨 Visual Customization
- **Inverted Color Schemes**: Optional inverted colors for both OB and FVG
- OB: Choose between traditional (Bullish=Blue, Bearish=Red) or inverted (Bullish=Red, Bearish=Blue)
- FVG: Choose between Bullish=Orange/Bearish=Aqua or inverted
- **Clean Labels**: Shows timeframe, zone type, volume, and dominant percentage
- **Combined Tags**: Optional labels for merged zones
- **Adjustable Extension**: Control how far zones extend into the future
## How It Works
### Order Blocks
Order Blocks identify institutional trading zones where large players have placed significant orders. The indicator:
1. Detects swing highs/lows using configurable swing length
2. Identifies the last opposing candle before a strong move
3. Analyzes volume distribution (bullish vs bearish)
4. Tracks zone validity until price breaks through
5. Combines overlapping zones from multiple timeframes
### Fair Value Gaps
Fair Value Gaps represent price imbalances that often get filled. The indicator:
1. Identifies 3-candle patterns with gaps between candles
2. Filters gaps by size percentile to show only significant ones
3. Calculates volume distribution within the gap
4. Tracks mitigation when price returns to fill the gap
5. Extends gaps dynamically until filled
### Bounce Detection
The indicator detects bounces using a two-step process:
1. **Touch Phase**: Tracks when price enters a zone (touchedInside flag)
2. **Bounce Phase**: Confirms bounce when price exits the zone in the expected direction
- Bullish zones: Price closes above top after touching inside
- Bearish zones: Price closes below bottom after touching inside
## Settings Guide
### General Configuration
- **Show Historic Zones**: Display invalidated/broken zones
- **Zone Invalidation**: Choose between wick or close for break detection
- **Combine Overlapping Order Blocks**: Merge OBs from different timeframes
- **Swing Length**: Controls sensitivity (smaller = more OBs, larger = fewer OBs)
- **Zone Count**: Choose from High/Medium/Low/One per timeframe
- **Invert Colors OB**: Swap bullish/bearish color scheme
### Alert Settings
- **Enable Alerts**: Master switch for all alerts
- **Alert on Bullish/Bearish Bounce**: Choose which bounce directions to monitor
- **Alert on New OB Formation**: Get notified when new Order Blocks form
- **Alert on Combined OBs**: Alerts for strong confluence zones
- **Min OBs for Strong Zone Alert**: Threshold for combined zone alerts (default: 2)
### Fair Value Gaps
- **Show Fair Value Gaps**: Toggle FVG display
- **FVG Mitigation Source**: Choose close or high/low for mitigation detection
- **Bullish/Bearish FVG**: Enable/disable each type
- **Invert FVG Colors**: Swap FVG color scheme
### Multi-Timeframe
- **Show Lower Timeframes**: Display OBs from timeframes lower than chart
- **Individual Timeframe Toggles**: Enable/disable 1min, 3min, 5min, 15min, 60min
### Style
- **Text Color**: Customize label text color
- **Extend Zones**: Set extension length in bars (default: 40)
- **Show Tag**: Display combined indicator in merged zone labels
## Usage Tips
### For Day Trading
- Enable 1min, 3min, and 5min timeframes
- Use "High" zone count for more trading opportunities
- Watch for bounces from combined zones (highest probability)
### For Swing Trading
- Enable 15min, 60min, and higher timeframes
- Use "Medium" or "Low" zone count for major zones only
- Focus on combined zones with 3+ timeframes
### For Scalping
- Use current timeframe only (disable MTF)
- Enable both OB and FVG
- Set up alerts for quick bounce notifications
### Alert Setup
1. Click "Create Alert" in TradingView
2. Choose from available alert conditions:
- **Bullish Bounce (OB/FVG)**: Long entry opportunities
- **Bearish Bounce (OB/FVG)**: Short entry opportunities
- **New OB Formation**: Early zone identification
- **Strong Combined Zone**: High-probability confluence areas
3. Set alert frequency to "Once Per Bar Close" to avoid false signals
## Technical Details
### Performance Optimizations
- Maximum 100 boxes/labels for efficient rendering
- Lightweight FVG processing on current timeframe only
- Dynamic memory management with array size limits
- Selective rendering of active zones only
### Calculations
- **ATR Multiplier**: Zones exceeding 3.5x ATR are filtered out
- **Volume Percentage**: `max(bullVol, bearVol) / totalVolume × 100`
- **FVG Size Filter**: Uses 100th percentile of last 1000 gaps
- **Overlap Detection**: Uses intersection/union ratio for combining zones
## Credits & License
This indicator combines and enhances concepts from:
- "Volumized Order Blocks" methodology
- "Volumatic Fair Value Gaps" approach
**License**: Mozilla Public License 2.0 (MPL-2.0)
## Disclaimer
This indicator is provided for **educational and informational purposes only**. Trading involves substantial risk of loss and is not suitable for every investor. Past performance is not indicative of future results. Always do your own research and consult with a licensed financial advisor before making trading decisions.
## Version History
**v2 (Current)**
- Combined OB and FVG into single indicator
- Added comprehensive alert system
- Improved performance with lightweight FVG processing
- Enhanced bounce detection with touch-inside logic
- Added volume metrics to zone labels
- Implemented dynamic zone extension until broken
- Added combined zone detection with configurable thresholds
---
### Chart Examples
The indicator displays:
- **Red Zones** (Inverted): Bullish Order Blocks / Bearish FVGs
- **Blue Zones** (Inverted): Bearish Order Blocks / Bullish FVGs
- **Orange Zones** (Inverted): Bullish Fair Value Gaps
- **Aqua Zones** (Inverted): Bearish Fair Value Gaps
Each zone shows:
- Timeframe label (e.g., "5m", "15m", "1H")
- Zone type (OB or FVG)
- Total volume in millions (e.g., "12.5M")
- Dominant side percentage (e.g., "85%")
**Example Label**: ` 5m & 15m OB 45.2M (78%)`
- Combined zone from 5min and 15min timeframes
- Order Block type
- 45.2 million total volume
- 78% volume on dominant side
---
## Support & Updates
For issues, suggestions, or questions, please leave a comment on the indicator page.
**Author**: © rasukaru666
**Compatible with**: TradingView Pine Script v6

猛の掟・初動スクリーナー_完成版//@version=5
indicator("猛の掟・初動スクリーナー_完成版", overlay=true)
// =============================
// 入力パラメータ
// =============================
emaLenShort = input.int(5, "短期EMA", minval=1)
emaLenMid = input.int(13, "中期EMA", minval=1)
emaLenLong = input.int(26, "長期EMA", minval=1)
macdFastLen = input.int(12, "MACD Fast", minval=1)
macdSlowLen = input.int(26, "MACD Slow", minval=1)
macdSignalLen = input.int(9, "MACD Signal", minval=1)
macdZeroTh = input.float(0.2, "MACDゼロライン近辺とみなす許容値", step=0.05)
volMaLen = input.int(5, "出来高平均日数", minval=1)
volMinRatio = input.float(1.3, "出来高倍率(初動判定しきい値)", step=0.1)
volStrongRatio = input.float(1.5, "出来高倍率(本物/三点シグナル用)", step=0.1)
highLookback = input.int(60, "直近高値の参照本数", minval=10)
pullbackMin = input.float(5.0, "押し目最小 ", step=0.5)
pullbackMax = input.float(15.0, "押し目最大 ", step=0.5)
breakLookback = input.int(15, "レジブレ後とみなす本数", minval=1)
wickBodyMult = input.float(2.0, "ピンバー:下ヒゲが実体の何倍以上か", step=0.5)
// ★ シグナル表示 ON/OFF
showMou = input.bool(true, "猛シグナルを表示")
showKaku = input.bool(true, "確シグナルを表示")
// =============================
// 基本指標計算
// =============================
emaShort = ta.ema(close, emaLenShort)
emaMid = ta.ema(close, emaLenMid)
emaLong = ta.ema(close, emaLenLong)
= ta.macd(close, macdFastLen, macdSlowLen, macdSignalLen)
volMa = ta.sma(volume, volMaLen)
volRatio = volMa > 0 ? volume / volMa : 0.0
recentHigh = ta.highest(high, highLookback)
prevHigh = ta.highest(high , highLookback)
pullbackPct = recentHigh > 0 ? (recentHigh - close) / recentHigh * 100.0 : 0.0
// ローソク足
body = math.abs(close - open)
upperWick = high - math.max(open, close)
lowerWick = math.min(open, close) - low
// =============================
// A:トレンド条件
// =============================
emaUp = emaShort > emaShort and emaMid > emaMid and emaLong > emaLong
goldenOrder = emaShort > emaMid and emaMid > emaLong
aboveEma2 = close > emaLong and close > emaLong
trendOK = emaUp and goldenOrder and aboveEma2
// =============================
// B:MACD条件
// =============================
macdGC = ta.crossover(macdLine, macdSignal)
macdNearZero = math.abs(macdLine) <= macdZeroTh
macdUp = macdLine > macdLine
macdOK = macdGC and macdNearZero and macdUp
// =============================
// C:出来高条件
// =============================
volInitOK = volRatio >= volMinRatio // 8条件用
volStrongOK = volRatio >= volStrongRatio // 三点シグナル用
volumeOK = volInitOK
// =============================
// D:ローソク足パターン
// =============================
isBullPinbar = lowerWick > wickBodyMult * body and lowerWick > upperWick and close >= open
isBullEngulf = close > open and open < close and close > open
isBigBullCross = close > emaShort and close > emaMid and open < emaShort and open < emaMid and close > open
candleOK = isBullPinbar or isBullEngulf or isBigBullCross
// =============================
// E:価格帯(押し目&レジブレ)
// =============================
pullbackOK = pullbackPct >= pullbackMin and pullbackPct <= pullbackMax
isBreakout = close > prevHigh and close <= prevHigh
barsSinceBreak = ta.barssince(isBreakout)
afterBreakZone = barsSinceBreak >= 0 and barsSinceBreak <= breakLookback
afterBreakPullbackOK = afterBreakZone and pullbackOK and close > emaShort
priceOK = pullbackOK and afterBreakPullbackOK
// =============================
// 8条件の統合
// =============================
allRulesOK = trendOK and macdOK and volumeOK and candleOK and priceOK
// =============================
// 最終三点シグナル
// =============================
longLowerWick = lowerWick > wickBodyMult * body and lowerWick > upperWick
macdGCAboveZero = ta.crossover(macdLine, macdSignal) and macdLine > 0
volumeSpike = volStrongOK
finalThreeSignal = longLowerWick and macdGCAboveZero and volumeSpike
buyConfirmed = allRulesOK and finalThreeSignal
// =============================
// 描画
// =============================
plot(emaShort, color=color.new(color.yellow, 0), title="EMA 短期(5)")
plot(emaMid, color=color.new(color.orange, 0), title="EMA 中期(13)")
plot(emaLong, color=color.new(color.blue, 0), title="EMA 長期(26)")
// シグナル表示(ON/OFF付き)
plotshape(showMou and allRulesOK, title="猛の掟 8条件クリア候補", location=location.belowbar, color=color.new(color.lime, 0), text="猛")
plotshape(showKaku and buyConfirmed, title="猛の掟 最終三点シグナル確定", location=location.belowbar, color=color.new(color.yellow, 0), text="確")
// =============================
// アラート条件
// =============================
alertcondition(allRulesOK, title="猛の掟 8条件クリア候補", message="猛の掟 8条件クリア候補シグナル発生")
alertcondition(buyConfirmed, title="猛の掟 最終三点シグナル確定", message="猛の掟 最終三点シグナル=買い確定")

CRR Auto 50% Candle A line at 50% of the candle
If a candle is larger than the minimum size you define (minSizePerc),
then calculate the midpoint of the candle (midLevel) and draw a horizontal line:
From the current candle to 44 bars to the right (or the number you choose).
Green if the candle is bullish, red if it is bearish.
2. Signal arrows
If it's a large bullish candle → green arrow pointing up with the text “50”.
If it's a large bearish candle → red arrow pointing down with the text “50”.
3. What is it for?
It marks the 50% level of important candles, which is often:
A mitigation zone.
A level where the price usually returns before continuing.
An institutional equilibrium point.
🧠 In simple terms:
It detects strong candles, draws their 50% level into the future, and marks them with arrows indicating whether they are bullish or bearish. Ideal for SMC.

RiskCraft - Advanced Risk Management SystemRiskCraft – Risk Intelligence Dashboard
Trade like you actually respect risk
"I know the setup looks good… but how much am I actually risking right now?"
RiskCraft is an open-source Pine Script v6 indicator that keeps risk transparent directly on the chart. It is not a signal generator; it is a risk desk that calculates size, frames volatility, and reminds you when your behaviour drifts away from the plan.
Core utilities
Calculates professional-style position sizing in real time.
Reads volatility and market regime before position size is confirmed.
Adjusts risk based on the trader’s emotional state and confidence inputs.
Maps session risk across Asian, London, and New York hours.
Draws exactly one stop line and one target line in the preferred direction.
Provides rotating education tips plus contextual warnings when risk escalates.
It is intentionally conservative and keeps you in the game long enough for any separate entry logic to matter.
---
Chart layout checklist
Use a clean chart on a liquid symbol (e.g., AMEX:SPY or major FX pairs).
Main RiskCraft dashboard placed on the right edge.
Session Risk box on the left with UTC time visible.
Floating risk badge above price.
Stop/target guide lines enabled.
Education panel visible in the bottom-right corner.
---
1. On-chart components
Right-side dashboard : account risk %, position size/value, stop, target, risk/reward, regime, trend strength, emotional state, behavioural score, correlation, and preferred trade direction.
Session Risk box : highlights active session (Asian, London, NY), current UTC time, and risk label (High/Med/Low) per session.
Floating risk badge : keeps actual account risk percent visible with colour-coded wording from Ultra Cautious to Very Aggressive.
Stop/target lines : exactly one dashed stop and one dashed target aligned with the preferred bias.
Education panel : rotates core principles and AI-style warnings tied to volatility, risk %, and behaviour flags.
---
2. Volatility engine – ATR with context 📈
atr = ta.atr(atrLength)
atrPercent = (atr / close) * 100
atrSMA = ta.sma(atr, atrLength)
volatilityRatio = atr / atrSMA
isHighVol = volatilityRatio > volThreshold
ATR vs ATR SMA shows how wild price is relative to recent history.
Volatility ratio above the threshold flips isHighVol , which immediately trims risk.
An ATR percentile rank over the last 100 bars indicates calm versus chaotic regimes.
Daily ATR sampling via request.security() gives higher time-frame context for intraday sessions.
When volatility spikes the script dials position size down automatically instead of cheering for maximum exposure.
---
3. Market regime radar – Danger or Drift 🌊
ema20 = ta.ema(close, 20)
ema50 = ta.ema(close, 50)
ema200 = ta.ema(close, 200)
trendScore = (close > ema20 ? 1 : -1) +
(ema20 > ema50 ? 1 : -1) +
(ema50 > ema200 ? 1 : -1)
= ta.dmi(14, 14)
Regimes covered:
Danger : high volatility with weak trend.
Volatile : volatility elevated but structure still directional.
Choppy : low ADX and noisy action.
Trending : directional flows without extreme volatility.
Mixed : anything between.
Each regime maps to a 1–10 risk score and a multiplier that feeds the final position size. Danger and Choppy clamp size; Trending restores normal risk.
---
4. Behaviour engine – trader inputs matter 🧠
You provide:
Emotional state : Confident, Neutral, FOMO, Revenge, Fearful.
Confidence : slider from 1 to 10.
Toggle for behavioural adjustment on/off.
Behind the scenes:
Each state triggers an emotional multiplier .
Confidence produces a confidence multiplier .
Combined they form behavioralFactor and a 0–100 Behavioural Score .
High-risk emotions or low conviction clamp the final risk. Calm inputs allow normal size. The dashboard prints both fields to keep accountability on-screen.
---
5. Correlation guardrail – avoid stacking identical risk 📊
Optional correlation mode compares the active symbol to a reference (default AMEX:SPY ):
corrClose = request.security(correlationSymbol, timeframe.period, close)
priceReturn = ta.change(close) / close
corrReturn = ta.change(corrClose) / corrClose
correlation = calcCorrelation()
Absolute correlation above the threshold applies a correlation multiplier (< 1) to reduce size.
Dashboard row shows the live correlation and reference ticker.
When disabled, the row simply echoes the current symbol, keeping the table readable.
---
6. Position sizing engine – heart of the script 💰
baseRiskAmount = accountSize * (baseRiskPercent / 100)
adjustedRisk = baseRiskAmount * behavioralFactor *
regimeAdjustment * volAdjustment *
correlationAdjustment
finalRiskAmount = math.min(adjustedRisk,
accountSize * (maxRiskCap / 100))
stopDistance = atr * atrStopMultiplier
takeProfit = atr * atrTargetMultiplier
positionSize = stopDistance > 0 ? finalRiskAmount / stopDistance : 0
positionValue = positionSize * close
Outputs shown on the dashboard:
Position size in units and value in currency.
Actual risk % back on account after adjustments.
Risk/Reward derived from ATR-based stop and target.
---
7. Intelligent trade direction – bias without signals 🎯
Direction score ingredients:
EMA stack alignment.
Price versus EMA20.
RSI momentum relative to 50.
MACD line vs signal.
Directional Movement (DI+/DI–).
The resulting Trade Direction row prints LONG, SHORT, or NEUTRAL. No orders are generated—this is guidance so you only risk capital when the structure supports it.
---
8. Stop/target guide lines – two lines only ✂️
if showStopLines
if preferLong
// long stop below, target above
else if preferShort
// short stop above, target below
Lines refresh each bar to keep clutter low.
When the direction score is neutral, no lines appear.
Use them as visual anchors, not auto-orders.
---
9. Session Risk map – global volatility clock 🌍
Tracks Asian, London, and New York windows via UTC.
Computes average ATR per session versus global ATR SMA.
Labels each session High/Med/Low and colours the cells accordingly.
Top row shows the active session plus current UTC time so you always know the regime you are trading.
One glance tells you whether you are trading quiet drift or the part of the day that hunts stops.
---
10. Floating risk badge – honesty above price 🪪
Text ranges from Ultra Cautious through Very Aggressive.
Colour matches the risk palette inputs (High/Med/Low).
Updates on the last bar only, keeping historical clutter off the chart.
Account risk becomes impossible to ignore while you stare at price.
---
11. Education engine & warnings 📚
Rotates evergreen principles (risk 1–2%, journal trades, respect plan).
Triggers contextual warnings when volatility and risk % conflict.
Flags when emotional state = FOMO or Revenge.
Highlights sub-standard risk/reward setups.
When multiple danger flags stack, an AI-style warning overrides the tip text so you can course-correct before capital is exposed.
---
12. Alerts – hard guard rails 🚨
Excessive Risk Alert : actual risk % crosses custom threshold.
High Volatility Alert : ATR behaviour signals danger regime.
Emotional State Warning : FOMO or Revenge selected.
Poor Risk/Reward Alert : risk/reward drops below your standard.
All alerts reinforce discipline; none suggest entries or exits.
---
13. Multi-market behaviour 🕒
Intraday (1m–1h): session box and badge react quickly; ideal for scalpers needing constant risk context.
Higher time frames (1D–1W): dashboard shifts slowly, supporting swing planning.
Asset classes confirmed in validation: crypto majors, large-cap equities, indices, major FX pairs, and liquid commodities.
Risk logic is price-based, so it adapts across markets without bespoke tuning.
15. Key inputs & recommended defaults
Account Size : 10,000 (modify to match actual account; min 100).
Base Risk % : 1.0 with a Maximum Risk Cap of 2.5%.
ATR Period : 14, Stop Multiplier 2.0, Target Multiplier 3.0.
High Vol Threshold : 1.5 for ATR ratio.
Behavioural Adjustment : enabled by default; disable for fixed risk.
Correlation Check : optional; default symbol AMEX:SPY , threshold 0.7.
Display toggles : main dashboard, risk badge, session map, education panel, and stop lines can be individually disabled to reduce clutter.
16. Usage notes & limits
Indicator mode only; no automated entries or exits.
Trade history panel intentionally disabled (requires strategy context).
Correlation analysis depends on additional data requests and may lag slightly on illiquid symbols.
Session timing uses UTC; adjust expectations if you trade localized instruments.
HTF ATR sampling uses daily data, so bar replay on lower charts may show brief data gaps while HTF loads.
What does everyone think RISK really means?

SuperTrend Basit BY İNCEBACAK//@version=5
indicator("SuperTrend Basit v5", overlay=true)
// === Girdi ayarları ===
factor = input.float(3.0, "ATR Katsayısı")
atrPeriod = input.int(10, "ATR Periyodu")
// === Hesaplamalar ===
= ta.supertrend(factor, atrPeriod)
// === Çizim ===
bodyColor = direction == 1 ? color.new(color.lime, 0) : color.new(color.red, 0)
bgcolor(direction == 1 ? color.new(color.lime, 85) : color.new(color.red, 85))
plot(supertrend, color=bodyColor, linewidth=2, title="SuperTrend Çizgisi")
// === Al/Sat sinyali ===
buySignal = ta.crossover(close, supertrend)
sellSignal = ta.crossunder(close, supertrend)
plotshape(buySignal, title="AL", location=location.belowbar, color=color.lime, style=shape.triangleup, size=size.small, text="AL")
plotshape(sellSignal, title="SAT", location=location.abovebar, color=color.red, style=shape.triangledown, size=size.small, text="SAT")
Momentum Permission + Pivot Entry (v1.4 CLEAN ENTRY)//@version=5
indicator("Momentum Permission + Pivot Entry (v1.4 CLEAN ENTRY)", overlay=true)
// ─────────── INPUTS ───────────
pivotLookback = input.int(3, "Pivot Lookback")
smaLen = input.int(50, "SMA Length")
relVolTh = input.float(1.3, "RelVol Threshold")
// ─────────── TREND + MOMENTUM — BASICS ───────────
vwapLine = ta.vwap
smaLine = ta.sma(close, smaLen)
relVol = volume / ta.sma(volume, 10)
pivotLow = ta.lowest(low, pivotLookback) == low
trendUp = close > smaLine
aboveVWAP = close > vwapLine
greenCandle = close > open
// ─────────── PERMISSION (Context Only) ───────────
permitSignal = trendUp and (relVol > relVolTh)
// ─────────── ENTRY LOGIC — ONE CLEAN SIGNAL ───────────
rawEntry = permitSignal and aboveVWAP and pivotLow and greenCandle
// Anti-spam: only first signal in a move
entrySignal = rawEntry and not rawEntry
// ─────────── VISUAL SHAPES (Clean) ───────────
plotshape(permitSignal, style=shape.triangleup, color=color.lime, size=size.tiny, location=location.bottom, text="PERMIT")
plotshape(entrySignal, style=shape.triangleup, color=color.aqua, size=size.small, text="ENTRY")
// ─────────── TREND VISUALS ───────────
plot(vwapLine, "VWAP", color=color.blue, linewidth=2)
plot(smaLine, "SMA50", color=color.orange, linewidth=2)

Momentum Permission + VWAP + RelVol (Clean)//@version=5
indicator("Momentum Permission + VWAP + RelVol (Clean)", overlay=true)
// ──────────────────────────────────────────────
// Inputs
// ──────────────────────────────────────────────
smaLength = input.int(50, "SMA Length")
relVolThresh = input.float(1.3, "Relative Volume Threshold")
// ──────────────────────────────────────────────
// Core Calculations
// ──────────────────────────────────────────────
sma50 = ta.sma(close, smaLength)
vwap = ta.vwap(close)
relVol = volume / ta.sma(volume, 10)
crossUp = ta.crossover(close, sma50)
// Trend conditions
aboveSMA = close > sma50
aboveVWAP = close > vwap
relStrong = relVol > relVolThresh
// ──────────────────────────────────────────────
// One-Time Daily Trend Permission Logic
// ──────────────────────────────────────────────
var bool permission = false
// Reset permission at start of each session
if ta.change(time("D"))
permission := false
trendStart = crossUp and aboveVWAP and relStrong and not permission
if trendStart
permission := true
// ──────────────────────────────────────────────
// Entry Trigger Logic (Breakout Continuation)
// ──────────────────────────────────────────────
entryTrigger = (
permission and
aboveSMA and
aboveVWAP and
relStrong and
close > high // breakout of prior candle high
)
// ──────────────────────────────────────────────
// Plots
// ──────────────────────────────────────────────
// Trend filters
plot(sma50, title="SMA50", color=color.orange, linewidth=2)
plot(vwap, title="VWAP", color=color.new(color.blue, 0), linewidth=2)
// Permission (one-time trend start)
plotshape(
trendStart,
title="Trend Permission",
style=shape.triangleup,
location=location.belowbar,
color=color.new(color.green, 0),
size=size.large,
text="PERMIT"
)
// Entry trigger (continuation entry)
plotshape(
entryTrigger,
title="Entry Trigger",
style=shape.triangleup,
location=location.abovebar,
color=color.new(color.aqua, 0),
size=size.normal,
text="ENTRY"
)

SPX Breadth – Stocks Above 200-day SMA//@version=6
indicator("SPX Breadth – Stocks Above 200-day SMA",
overlay = false,
max_lines_count = 500,
max_labels_count = 500)
//–––––––––––––––––––––––––––––––––––––––––––––––––––––––––––––––––––––––––––––
// Inputs
group_source = "Source"
breadthSymbol = input.symbol("SPXA200R", "Breadth symbol", group = group_source)
breadthTf = input.timeframe("", "Timeframe (blank = chart)", group = group_source)
group_params = "Parameters"
totalStocks = input.int(500, "Total stocks in index", minval = 1, group = group_params)
smoothingLen = input.int(10, "SMA length", minval = 1, group = group_params)
//–––––––––––––––––––––––––––––––––––––––––––––––––––––––––––––––––––––––––––––
// Breadth series (symbol assumed to be percent 0–100)
string tf = breadthTf == "" ? timeframe.period : breadthTf
float rawPct = request.security(breadthSymbol, tf, close) // 0–100 %
float breadthN = rawPct / 100.0 * totalStocks // convert to count
float breadthSma = ta.sma(breadthN, smoothingLen)
//–––––––––––––––––––––––––––––––––––––––––––––––––––––––––––––––––––––––––––––
// Regime levels (0–20 %, 20–40 %, 40–60 %, 60–80 %, 80–100 %)
float lvl0 = 0.0
float lvl20 = totalStocks * 0.20
float lvl40 = totalStocks * 0.40
float lvl60 = totalStocks * 0.60
float lvl80 = totalStocks * 0.80
float lvl100 = totalStocks * 1.0
p0 = plot(lvl0, "0%", color = color.new(color.black, 100))
p20 = plot(lvl20, "20%", color = color.new(color.red, 0))
p40 = plot(lvl40, "40%", color = color.new(color.orange, 0))
p60 = plot(lvl60, "60%", color = color.new(color.yellow, 0))
p80 = plot(lvl80, "80%", color = color.new(color.green, 0))
p100 = plot(lvl100, "100%", color = color.new(color.green, 100))
// Colored zones
fill(p0, p20, color = color.new(color.maroon, 80)) // very oversold
fill(p20, p40, color = color.new(color.red, 80)) // oversold
fill(p40, p60, color = color.new(color.gold, 80)) // neutral
fill(p60, p80, color = color.new(color.green, 80)) // bullish
fill(p80, p100, color = color.new(color.teal, 80)) // very strong
//–––––––––––––––––––––––––––––––––––––––––––––––––––––––––––––––––––––––––––––
// Plots
plot(breadthN, "Stocks above 200-day", color = color.orange, linewidth = 2)
plot(breadthSma, "Breadth SMA", color = color.white, linewidth = 2)
// Optional label showing live value
var label infoLabel = na
if barstate.islast
label.delete(infoLabel)
string txt = "Breadth: " +
str.tostring(breadthN, format.mintick) + " / " +
str.tostring(totalStocks) + " (" +
str.tostring(rawPct, format.mintick) + "%)"
infoLabel := label.new(bar_index, breadthN, txt,
style = label.style_label_left,
color = color.new(color.white, 20),
textcolor = color.black)

RVol based Support & Resistance ZonesDescription:
This indicator is designed to help traders identify significant price levels based on institutional volume. It monitors two higher timeframes (defined by the user) simultaneously. When a candle on these higher timeframes exhibits unusually high volume—known as high Relative Volume (RVol)—the indicator automatically draws a "Zone of Interest" box on your current chart.
These zones are defined by:
Up candle : from candle open to low of candle
Down candle : from candle open to high of candle
Key Features:
Multi-Timeframe Monitoring: You can trade on a lower timeframe (e.g., 5-minute) while the indicator monitors the 30-minute and 1-hour charts for volume spikes.
RVol Boxes: Automatically draws boxes extending from high-volume candles.
Up Candles: Box covers Low to Open.
Down Candles: Box covers High to Open.
Live Dashboard: A neat, color-coded table displays the current Volume, Average Volume, and RVol percentage for your watched timeframes.
Real-Time vs. Confirmed: Choose whether to see boxes appear immediately as volume spikes (Live) or only after the candle has closed and confirmed the volume (Candle Close).
Settings Guide:
1. General Settings
Relative Volume Length: The number of past candles used to calculate the "Average Volume." (Default is 20).
Max Days Back to Draw: To keep your chart clean, this limits how far back in history the script looks for high-volume zones. (e.g., set to 5 to only see zones created in the last 5 days).
Draw Mode:
- Live (Real-time): Draws the box immediately if the current developing candle hits the volume threshold. (Note: The box may disappear if the volume average shifts before the candle closes).
- Candle Close: The box only appears once the candle has finished and permanently confirmed the volume spike.
2. Table Settings
Show Info Table: Toggles the dashboard on or off.
Text Size & Position: Customise where the table appears on your screen and how large the text is.
Colours: Fully customisable colours for the Table Header (Top row) and Data Rows (Bottom rows).
3. Timeframe 1 & 2 Settings
You have two identical sections to configure two different timeframes (e.g., 30m and 1H).
Timeframe: The chart interval to monitor (e.g., "30" for 30 minutes, "60" for 1 Hour, "240" for 4 Hours).
Threshold %: The "Trigger" for drawing a box based on relative candle volume in that timeframe.
Example:
100% = Candle Volume is equal to the average volume for the specified timeframe.
200% = Candle Volume is 2x the average volume for the specified timeframe.
300% = Candle Volume is 3x the average volume for the specified timeframe.
Box & Edge Colour: Distinct colours for each timeframe so you can easily tell which timeframe created the zone.

Volumetric Inverse Fair Value Gap (IFVG) [Kodexius]The Volumetric Inverse Fair Value Gap (IFVG) indicator detects and visualizes inverse fair value gaps (IFVGs) zones where previous inefficiencies in price (fair value gaps) are later invalidated or “inverted.”
Unlike traditional FVG indicators, this tool integrates volume-based analysis to quantify the bullish, bearish, and overall strength of each inversion. It visually represents these metrics within a dynamically updating box on the chart, giving traders deeper insight into market reactions when liquidity imbalances are filled and reversed.
Features
Inverse fair value gap detection
The script identifies bullish and bearish fair value gaps, stores them as pending zones, and turns them into inverse fair value gaps when price trades back through the gap in the opposite direction. Each valid inversion becomes an active IFVG zone on the chart.
Sensitivity control with ATR filter and strict mode
A minimum gap size based on ATR is used to filter out small and noisy gaps. Strict mode can be enabled so that any wick contact between the relevant candles prevents the gap from being accepted as a fair value gap. This lets you decide how clean and selective the zones should be.
Show Last N Boxes control
The indicator can keep only the most recent N IFVG zones visible. Older zones are removed from the chart once the number of active objects exceeds the user setting. This prevents clutter on higher timeframes or long histories and keeps attention on the most relevant recent zones.
Ghost box for the original gap
When the ghost option is enabled, the script draws a faint box that marks the original fair value gap from which the inverse zone came. This makes it easy to see where the initial imbalance appeared and how price later inverted that area.
Volumetric bull, bear and strength metrics
For each IFVG, the script estimates how much of the bar volume is associated with buying and how much with selling, then computes bull percentage, bear percentage and a strength score that uses a percentile rank of volume. These values are stored with the IFVG object and drive the visualization inside the zone.
Three band visual layout inside each IFVG
Each active IFVG is drawn as a container with three horizontal sections. The top band represents the bull percentage, the middle band the bear percentage and the bottom band the strength metric. The width of each bar reflects its respective value so you can read the structure of the zone at a glance.
Customizable colors and label text
Colors for bull, bear, strength, the empty background area, the ghost box and label text can be adjusted in the inputs. This allows you to match the indicator to different chart themes or highlight specific aspects such as strength or direction.
Automatic invalidation and cleanup
When price clearly closes beyond the IFVG in a way that breaks the logic of that zone, the script marks it as inactive and deletes all boxes and labels linked to it. Only valid and active IFVGs remain on the chart, which keeps the display clean and focused.
Calculations
1. Detecting Fair Value Gaps (FVGs)
A fair value gap is identified when price action leaves an imbalance between candle wicks. Depending on the mode:
Bullish FVG: When low > high
Bearish FVG: When high < low
Optionally, the strict mode ensures wicks do not touch.
The gap’s significance is filtered using the ATR multiplier input to exclude minor noise.
Once detected, FVGs are stored as pending zones until inverted by opposite movement (price crossing through).
bool bull_cond = strict_mode ? (low > high ) : (close > high )
bool bear_cond = strict_mode ? (high < low ) : (close < low )
float gap_size = 0.0
if bull_cond and close > open
gap_size := low - high
if bear_cond and close < open
gap_size := low - high
2. Creating IFVGs (Inversions)
When price later moves through a previous FVG in the opposite direction, an Inverse FVG (IFVG) is created.
For example:
A previous bearish FVG becomes bullish IFVG if price moves upward through it.
A previous bullish FVG becomes bearish IFVG if price moves downward through it.
The IFVG is initialized with structural boundaries (top, bottom) and timestamp metadata to anchor visualization.
if not p.is_bull_gap and close > p.top
inverted := true
to_bull := true
if p.is_bull_gap and close < p.btm
inverted := true
to_bull := false
3. Volume Metrics (Bull, Bear, Strength)
Each IFVG calculates buy and sell volumes from the current bar’s price spread and total volume.
Bull % = proportion of upward (buy) volume
Bear % = proportion of downward (sell) volume
Strength % = normalized percentile rank of total volume
These are obtained through a custom function that estimates directional volume contribution:
calc_metrics(float o, float h, float l, float c, float v) =>
float rng = h - l
float buy_v = 0.0
if rng == 0
buy_v := v * 0.5
else
if c >= o
buy_v := v * ((math.abs(c - o) + (math.min(o, c) - l)) / rng)
else
buy_v := v * ((h - math.max(o, c)) / rng)
float sell_v = v - buy_v
float total = buy_v + sell_v
float p_bull = total > 0 ? buy_v / total : 0
float p_bear = total > 0 ? sell_v / total : 0
float p_str = ta.percentrank(v, 100) / 100.0

STRAT - MTF Dashboard + FTFC + Reversals v2.7# STRAT Indicator - Complete Description
## Overview
A comprehensive multi-timeframe STRAT trading system indicator that combines market structure analysis, flip levels, Full Timeframe Continuity (FTFC), and reversal pattern detection across 12 timeframes.
## Core Features
### 1. **Multi-Timeframe STRAT Dashboard**
- Displays STRAT combos (1, 2u, 2d, 3) across 12 timeframes: 1m, 5m, 15m, 30m, 1H, 4H, 12H, Daily, Weekly, Monthly, Quarterly, Yearly
- Color-coded directional bias (green/red/doji)
- Inside bars (●) and Outside bars (●) highlighted
- Current timeframe marked with ★
### 2. **HTF Flip Levels with Smart Grouping**
- Displays higher timeframe (HTF) flip levels (open prices) as labels on the right side
- Automatically groups multiple timeframes at the same price level (e.g., "★ 1H/4H/D")
- Current timeframe flip level always displayed with ★ marker
- Color-coded: Green (above price) / Red (below price)
### 3. **Full Timeframe Continuity (FTFC)**
- User-selectable 4 timeframes for FTFC analysis (default: D, W, M, Q)
- Green line: FTFC Up (highest open of 4 timeframes)
- Red line: FTFC Down (lowest open of 4 timeframes)
- Identifies when price is above/below all 4 timeframe opens
### 4. **Hammer & Shooting Star Detection**
- **Hammer Pattern**: Long lower wick (≥2x body), small upper wick, signals potential bottom reversal
- **Shooting Star Pattern**: Long upper wick (≥2x body), small lower wick, signals potential top reversal
- Scans last 100 bars (adjustable) and marks ALL historical patterns
- Chart markers: 🔨 (Hammer) below bars, 🔻 (Shooting Star) above bars
- Dashboard column shows reversal patterns for each timeframe
- Adjustable wick-to-body ratio sensitivity (1.5 to 5.0)
### 5. **Debug Tables**
- **FTFC Debug**: Shows close vs. 4 timeframe opens, confirms all-green/all-red conditions
- **Reversal Debug**: Real-time analysis of current bar - body size, wick measurements, ratios, and pattern qualification
## Settings
### Display Settings
- Dashboard position (9 options: top-left to bottom-right)
- Dashboard text size (tiny to huge)
- Label offset and text size
- Toggle individual features on/off
### FTFC Settings
- Select 4 custom timeframes for continuity analysis
- Default: Daily, Weekly, Monthly, Quarterly
### Reversal Settings
- **Wick to Body Ratio**: Sensitivity for pattern detection (default 2.0)
- **Lookback Bars**: How many historical bars to scan (default 100, max 500)
- Show/hide reversal markers on chart
- Show/hide reversal debug table
## Use Cases
1. **Momentum Trading**: Identify STRAT setups (2-2, 2-1-2 reversals, 3-bar plays) across multiple timeframes
2. **Swing Trading**: Use HTF flip levels as support/resistance and FTFC for trend confirmation
3. **Reversal Trading**: Catch hammer/shooting star patterns at key levels for counter-trend entries
4. **Multi-Timeframe Analysis**: Confirm alignment across timeframes before entering trades
## How to Use
### For STRAT Traders
- Look for 2-1-2 reversal setups in the dashboard
- Watch for inside bars (●) at HTF flip levels for breakout trades
- Use outside bars (●) to identify potential volatility expansion
### For Reversal Traders
- 🔨 Hammers after downtrends = potential long entries
- 🔻 Shooting stars after uptrends = potential short entries
- Combine with HTF flip levels for high-probability setups
### For Trend Followers
- FTFC green line above = bullish structure
- FTFC red line below = bearish structure
- Enter when price breaks and holds above/below FTFC levels
## Visual Elements
- **Green Labels**: HTF flip levels above current price (resistance)
- **Red Labels**: HTF flip levels below current price (support)
- **Lime Line**: FTFC Up (highest timeframe open)
- **Red Line**: FTFC Down (lowest timeframe open)
- **🔨 Icon**: Hammer pattern (potential reversal up)
- **🔻 Icon**: Shooting Star pattern (potential reversal down)
- **★ Symbol**: Current timeframe or multiple timeframes grouped
## Performance Notes
This indicator performs 12 multi-timeframe security calls and may take 15-30 seconds to calculate on initial load. This is normal for comprehensive MTF analysis.
## Version
v2.7 - Simplified reversal detection, current TF labeling, optimized performance
---
**Perfect for**: STRAT traders, multi-timeframe analysts, reversal pattern traders, swing traders looking for high-probability setups with confluence across timeframes.

One for AllOne for All (OFA) - Complete ICT Analysis Suite
Version 3.3.0 by theCodeman
📊 Overview
One for All (OFA) is a comprehensive TradingView indicator designed for traders who follow Inner Circle Trader (ICT) concepts. This all-in-one tool combines essential ICT analysis features—sessions, kill zones, previous period levels, and higher timeframe candles with Fair Value Gaps (FVGs) and Volume Imbalances (VIs)—into a single, highly customizable indicator. Whether you're a beginner learning ICT concepts or an experienced trader refining your edge, OFA provides the visual structure needed for precise market analysis and execution.
✨ Key Features
- 🏷️ Customizable Watermark**: Display your trading identity with customizable titles, subtitles, symbol info, and full style control
- 🌍 Trading Sessions**: Visualize Asian, London, and New York sessions with high/low lines, range boxes, and open/close markers
- 🎯 Kill Zones**: Highlight 5 critical ICT kill zones with precise timing and visual boxes
- 📈 Previous Period H/L**: Track Daily, Weekly, and Monthly highs/lows with customizable styles and lookback periods
- 🕐 Higher Timeframe Candles**: Display up to 5 HTF timeframes with OHLC trace lines, timers, and interval labels
- 🔍 FVG & VI Detection**: Automatically detect and visualize Fair Value Gaps and Volume Imbalances on HTF candles
- ⚙️ Universal Timezone Support**: Works globally with GMT-12 to GMT+14 timezone selection
- 🎨 Full Customization**: Control colors, styles, visibility, and layout for every feature
🚀 How to Use
Watermark Setup
The watermark overlay helps you identify your charts and maintain focus on your trading principles:
1. Enable/disable watermark via "Show Watermark" toggle
2. Customize the title (default: "Name") to display your trading name or account identifier
3. Set up to 3 subtitles (default: "Patience", "Confidence", "Execution") as trading reminders
4. Choose position (9 locations available), size, color, and transparency
5. Toggle symbol and timeframe display as needed
Use Case: Display your trading principles or account name for multi-monitor setups or content creation.
Trading Sessions Analysis
Sessions define market character and liquidity availability:
1. Enable "Show All Sessions" to visualize all three sessions
2. Adjust timezone to match your local market (default: UTC-5 for EST)
3. Customize session times if needed (defaults cover standard hours)
4. Enable session range boxes to see consolidation zones
5. Use session high/low lines to identify key levels for the current session
6. Enable open/close markers to track session transitions
Use Case: Identify which session you're trading in, track session highs/lows for liquidity, and anticipate session transition volatility.
Kill Zones Trading
Kill zones are ICT's high-probability trading windows:
1. Enable individual kill zones or use "Show All Kill Zones"
2. **Asian Kill Zone** (2000-0000 GMT): Early positioning and smart money accumulation
3. **London Kill Zone** (0300-0500 GMT): European market opening volatility
4. **NY AM Kill Zone** (0930-1100 EST): Post-NYSE open expansion
5. **NY Lunch Kill Zone** (1200-1300 EST): Midday consolidation or manipulation
6. **NY PM Kill Zone** (1330-1600 EST): Afternoon positioning and closes
7. Customize colors and times to match your trading style
8. Set max days display to control historical visibility (default: 30 days)
Use Case: Focus entries during high-probability windows. Watch for liquidity sweeps at kill zone openings and institutional positioning.
Previous Period High/Low Levels
Previous period levels act as magnetic price targets and support/resistance:
1. Enable Daily (PDH/PDL), Weekly (PWH/PWL), or Monthly (PMH/PML) levels individually
2. Set lookback period (how many previous periods to display)
3. Choose line style: Solid (current emphasis), Dashed (standard), or Dotted (subtle)
4. Customize colors per timeframe for visual hierarchy
5. Adjust line width (1-5) for visibility preference
6. Enable gradient effect to fade older periods
7. Position labels left or right based on chart layout
8. Customize label text for your preferred notation
Use Case: Identify key levels where price is likely to react. Daily levels work on intraday timeframes, Weekly on daily charts, Monthly for swing trading.
Higher Timeframe (HTF) Candles
HTF candles reveal the larger market context while trading lower timeframes:
1. Enable up to 5 HTF slots simultaneously (default: 5m, 15m, 1H, 4H, Daily)
2. Choose display mode: "Below Chart" (stacked rows) or "Right Side" (compact column)
3. Customize timeframe, colors (bull/bear), and titles for each slot
4. **OHLC Trace Lines**: Visual lines connecting HTF candle levels to chart bars
5. **HTF Timer**: Countdown showing time remaining until HTF candle close
6. **Interval Labels**: Display day of week (Daily+) or time (intraday) on each candle
7. For Daily candles: Choose open time (Midnight, 8:30, 9:30) to match your market structure preference
Use Case: Trade lower timeframes while respecting higher timeframe structure. Watch for HTF candle closes to confirm directional bias.
FVG & VI Detection
Fair Value Gaps and Volume Imbalances highlight inefficiencies that price often revisits:
1. **Fair Value Gaps (FVGs)**: Detected when HTF candle wicks don't overlap between 3 consecutive candles
- Bullish FVG: Gap between candle 1 high and candle 3 low (green box by default)
- Bearish FVG: Gap between candle 1 low and candle 3 high (red box by default)
2. **Volume Imbalances (VIs)**: Similar detection but focuses on body gaps
- Bullish VI: Gap between candle 1 close and candle 3 open
- Bearish VI: Gap between candle 1 open and candle 3 close
3. Enable FVG/VI detection per HTF slot individually
4. Customize colors and transparency for each imbalance type
5. Boxes appear on chart at formation and remain visible as retracement targets
**Use Case**: Identify high-probability retracement zones. Price often returns to fill FVGs and VIs before continuing the trend. Use as entry zones or profit targets.
🎨 Customization
OFA is built for flexibility. Every feature includes extensive customization options:
Visual Customization
- **Colors**: Independent color control for every element (sessions, kill zones, lines, labels, FVGs, VIs)
- **Transparency**: Adjust box and label transparency (0-100%) for clean charts
- **Line Styles**: Choose Solid, Dashed, or Dotted for previous period lines
- **Sizes**: Control text size, line width, and box borders
- **Positions**: Place watermark in 9 positions, labels left/right
Layout Control
- **HTF Display Mode**: "Below Chart" for detailed analysis, "Right Side" for space efficiency
- **Drawing Limits**: Set max days for sessions/kill zones to manage chart clutter
- **Lookback Periods**: Control how many previous periods to display (1-10)
- **Gradient Effects**: Enable fading for older previous period lines
Timing Adjustments
- **Timezone**: Universal GMT offset selector (-12 to +14) for global markets
- **Session Times**: Customize each session's start/end times
- **Kill Zone Times**: Adjust kill zone windows to match your market's characteristics
- **Daily Open**: Choose Midnight, 8:30, or 9:30 for Daily HTF candle open time
💡 Best Practices
1. Start Simple: Enable one feature at a time to learn how each element affects your analysis
2. Match Your Timeframe: Use Daily levels on intraday charts, Weekly on daily charts, HTF candles one or two levels above your trading timeframe
3. Kill Zone Focus: Concentrate your trading activity during kill zones for higher probability setups
4. HTF Confirmation: Wait for HTF candle closes before committing to directional bias
5. FVG/VI Entries: Look for price to return to unfilled FVGs/VIs for entry opportunities with favorable risk/reward
6. Customize Colors: Use a consistent color scheme that matches your chart theme and reduces visual fatigue
7. Reduce Clutter: Disable features you're not actively using in your current trading plan
8. Session Context: Understand which session controls the market—trade with session direction or anticipate reversals at session transitions
⚙️ Settings Guide
OFA organizes settings into logical groups for easy navigation:
- **═══ WATERMARK ═══**: Title, subtitles, position, style, symbol/timeframe display
- **═══ SESSIONS ═══**: Enable/disable sessions, times, colors, high/low lines, boxes, markers
- **═══ KILL ZONES ═══**: Individual kill zone toggles, times, colors, max days display
- **═══ PREVIOUS H/L - DAILY ═══**: Daily high/low lines, style, color, lookback, labels
- **═══ PREVIOUS H/L - WEEKLY ═══**: Weekly high/low lines, style, color, lookback, labels
- **═══ PREVIOUS H/L - MONTHLY ═══**: Monthly high/low lines, style, color, lookback, labels
- **═══ HTF CANDLES ═══**: Global display mode, layout settings
- **═══ HTF SLOT 1-5 ═══**: Individual HTF configuration (timeframe, colors, title, FVG/VI detection, trace lines, timer, interval labels)
Each setting includes tooltips explaining its function. Hover over any input for detailed guidance.
📝 Final Notes
One for All (OFA) represents a complete ICT analysis toolkit in a single indicator. By combining watermark customization, session visualization, kill zone highlighting, previous period levels, and higher timeframe candles with FVG/VI detection, OFA eliminates the need for multiple indicators cluttering your chart.
**Version**: 3.3.0
**Author**: theCodeman
**Pine Script**: v6
**License**: Mozilla Public License 2.0
Start with default settings to learn the indicator's structure, then customize extensively to match your personal trading style. Remember: tools provide information, but your edge comes from disciplined execution of a proven strategy.
Happy Trading! 📈

Buffett Quality Filter (TTM)//@version=6
indicator("Buffett Quality Filter (TTM)", overlay = true, max_labels_count = 500)
// 1. Get financial data (TTM / FY / FQ)
// EPS (TTM) for P/E
eps = request.financial(syminfo.tickerid, "EARNINGS_PER_SHARE_BASIC", "TTM")
// Profitability & moat (annual stats)
roe = request.financial(syminfo.tickerid, "RETURN_ON_EQUITY", "FY")
roic = request.financial(syminfo.tickerid, "RETURN_ON_INVESTED_CAPITAL", "FY")
// Margins (TTM – rolling 12 months)
grossMargin = request.financial(syminfo.tickerid, "GROSS_MARGIN", "TTM")
netMargin = request.financial(syminfo.tickerid, "NET_MARGIN", "TTM")
// Balance sheet safety (quarterly)
deRatio = request.financial(syminfo.tickerid, "DEBT_TO_EQUITY", "FQ")
currentRat = request.financial(syminfo.tickerid, "CURRENT_RATIO", "FQ")
// Growth (1-year change, TTM)
epsGrowth1Y = request.financial(syminfo.tickerid, "EARNINGS_PER_SHARE_BASIC_ONE_YEAR_GROWTH", "TTM")
revGrowth1Y = request.financial(syminfo.tickerid, "REVENUE_ONE_YEAR_GROWTH", "TTM")
// Free cash flow (TTM) and shares to build FCF per share for P/FCF
fcf = request.financial(syminfo.tickerid, "FREE_CASH_FLOW", "TTM")
sharesOut = request.financial(syminfo.tickerid, "TOTAL_SHARES_OUTSTANDING", "FQ")
fcfPerShare = (not na(fcf) and not na(sharesOut) and sharesOut != 0) ? fcf / sharesOut : na
// 2. Valuation ratios from price
pe = (not na(eps) and eps != 0) ? close / eps : na
pFcf = (not na(fcfPerShare) and fcfPerShare > 0) ? close / fcfPerShare : na
// 3. Thresholds (Buffett-style, adjustable)
minROE = input.float(15.0, "Min ROE %")
minROIC = input.float(12.0, "Min ROIC %")
minGM = input.float(30.0, "Min Gross Margin %")
minNM = input.float(8.0, "Min Net Margin %")
maxDE = input.float(0.7, "Max Debt / Equity")
minCurr = input.float(1.3, "Min Current Ratio")
minEPSG = input.float(8.0, "Min EPS Growth 1Y %")
minREVG = input.float(5.0, "Min Revenue Growth 1Y %")
maxPE = input.float(20.0, "Max P/E")
maxPFCF = input.float(20.0, "Max P/FCF")
// 4. Individual conditions
cROE = not na(roe) and roe > minROE
cROIC = not na(roic) and roic > minROIC
cGM = not na(grossMargin) and grossMargin > minGM
cNM = not na(netMargin) and netMargin > minNM
cDE = not na(deRatio) and deRatio < maxDE
cCurr = not na(currentRat) and currentRat > minCurr
cEPSG = not na(epsGrowth1Y) and epsGrowth1Y > minEPSG
cREVG = not na(revGrowth1Y) and revGrowth1Y > minREVG
cPE = not na(pe) and pe < maxPE
cPFCF = not na(pFcf) and pFcf < maxPFCF
// 5. Composite “Buffett Score” (0–10) – keep it on ONE line to avoid line-continuation errors
score = (cROE ? 1 : 0) + (cROIC ? 1 : 0) + (cGM ? 1 : 0) + (cNM ? 1 : 0) + (cDE ? 1 : 0) + (cCurr ? 1 : 0) + (cEPSG ? 1 : 0) + (cREVG ? 1 : 0) + (cPE ? 1 : 0) + (cPFCF ? 1 : 0)
// Strictness
minScoreForPass = input.int(7, "Min score to pass (0–10)", minval = 1, maxval = 10)
passes = score >= minScoreForPass
// 6. Visuals
bgcolor(passes ? color.new(color.green, 80) : na)
plot(score, "Buffett Score (0–10)", color = color.new(color.blue, 0))
// Info label on last bar
var label infoLabel = na
if barstate.islast
if not na(infoLabel)
label.delete(infoLabel)
infoText = str.format(
"Buffett score: {0}\nROE: {1,number,#.0}% | ROIC: {2,number,#.0}%\nGM: {3,number,#.0}% | NM: {4,number,#.0}%\nP/E: {5,number,#.0} | P/FCF: {6,number,#.0}\nD/E: {7,number,#.00} | Curr: {8,number,#.00}",
score, roe, roic, grossMargin, netMargin, pe, pFcf, deRatio, currentRat)
infoLabel := label.new(bar_index, high, infoText,
style = label.style_label_right,
color = color.new(color.black, 0),
textcolor = color.white,
size = size.small)

Forex indicator By petran Elevate your market analysis with this powerful, all-in-one visual toolkit designed for discretionary traders across Forex, indices, and commodities (metals).
Core Features:
Trading Sessions Overlay: Clear visual bands highlighting the Asian, London, and New York trading sessions directly on your chart. Never miss a market open or a session overlap again.
Smart Daily Levels: Automatically plots the most essential reference points from the previous day:
PDH / PDL (Previous Day High/Low) – Key support and resistance.
PWH / PWL (Previous Week High/Low) – Higher timeframe context.
DO (Day Open) – A crucial intraday pivot level.
Motivational Watermark: A unique and customizable text overlay at the top of your screen. Display your favorite trading quote, rule, or reminder to maintain the right mindset during the trading day.
Clean & Customizable: Designed for clarity. Adjust colors, session times, and watermark text to fit your personal trading style and chart aesthetics.
Why Traders Choose This Indicator:
Saves Time: No more manually drawing sessions or calculating yesterday's levels.
Improves Discipline: The visual sessions and watermark help you trade only during your planned times and follow your rules.
Universal Application: Works seamlessly on any liquid market where session activity and daily ranges matter.
Perfect for traders who rely on price action, session-based strategies, and need a clean, informative chart environment.
