Confluence Zone BuilderWhat It Does
The Confluence Zone Builder is a technical analysis indicator that identifies high-probability price levels by detecting where multiple technical factors align (converge) at the same price area. These "confluence zones" represent levels where price is statistically more likely to react - either bouncing (support/resistance) or breaking through (breakout targets).
How It Works
1. Multi-Factor Analysis
The indicator calculates key technical levels from various sources:
Fibonacci Retracements (23.6%, 38.2%, 50%, 61.8%, 78.6%) - Support/resistance levels based on recent price swings
Fibonacci Extensions (127.2%, 141.4%, 161.8%, 200%, 261.8%) - Breakout targets beyond the current range (both bullish and bearish)
Pivot Points (Classic pivots: P, R1-R3, S1-S3) - Daily/weekly reference points traders watch
Moving Averages (EMA 20, 50 and SMA 100, 200) - Dynamic support/resistance that institutions track
VWAP - Volume-weighted average price, popular among institutional traders
Psychological Levels - Round numbers that attract orders
Previous Period Levels - Prior day/week high, low, and close
2. Proximity Clustering
When multiple factors fall within a defined proximity range (default 0.5%), they're grouped together into a single "confluence zone." This prevents cluttering the chart with dozens of individual lines.
3. Weighted Scoring System
Not all technical factors are equal. The indicator assigns importance weights:
Key Fibonacci levels (61.8%) and major MAs (200, 50) get higher weights (2.0-2.5x)
Pivot points and VWAP get medium weights (1.5x)
Minor factors get lower weights (1.0x)
The total score reflects both the number of factors and their importance.
4. Historical Validation
The indicator analyzes the last 50 bars (customizable) to track:
Touches: How many times price reached each zone
Rejections: Times price bounced off the zone (✅)
Breaks: Times price broke through the zone (❌)
Win Rate: Percentage of times the zone held (rejections ÷ touches)
5. Dynamic Adjustment
Zones aren't static - they adapt based on how price interacts with them:
Strengthens (+0.5 per rejection, +0.2 per touch): Zones that repeatedly hold become more important
Weakens (-0.8 per break): Zones that fail to hold lose credibility
Visual Indicators:
Thick solid lines = Strong zones (more rejections than breaks)
Dashed lines = Weak zones (more breaks than rejections)
Color-coded by score: Blue (low), Yellow (medium), Red (high)
What You Gain From Using It
For Support/Resistance Trading:
High-probability entries: Enter at zones with high confluence scores and strong historical win rates
Better risk management: Place stops beyond strong confluence zones that are likely to hold
Reduced false signals: Multi-factor confirmation reduces reliance on single indicators
For Breakout Trading:
Target identification: Fibonacci extensions provide profit targets beyond current ranges
Breakout confirmation: Weak zones (dashed lines, low win rates) are easier to break - ideal for breakout entries
False breakout avoidance: Strong zones (thick lines, high win rates) require more confirmation before entering
For Position Management:
Exit planning: Take profits at high-confluence zones ahead
Stop placement: Use strong zones as logical stop-loss levels
Trade filtering: Higher probability setups occur at stronger zones
Key Advantages:
Objective confluence detection - No manual line drawing needed
Data-driven validation - Historical performance shows which zones actually matter
Adaptive intelligence - Zones strengthen/weaken based on real price action
Clean visualization - Top zones only, with compact labels showing score and factors
Customizable - Adjust weights, components, and thresholds to your trading style
Bottom Line:
Instead of guessing which technical level matters most, this indicator does the heavy lifting - analyzing multiple factors, validating them historically, and highlighting only the zones where price is most likely to react. It's like having confluence analysis automated with statistical backing.
"track"に関するスクリプトを検索

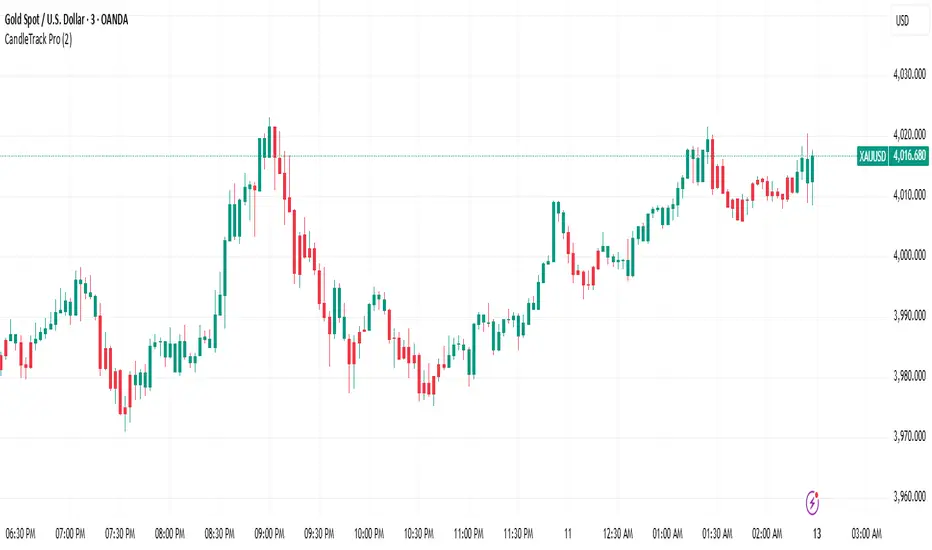
CandleTrack Pro | Pure Price Action Trend Detection📖 CandleTrack Pro | Pure Price Action Trend Detection
CandleTrack Pro is a clean, non-repainting trend detection tool built purely on price action logic.
It uses a dynamic ATR-based trailing system to detect trend shifts while keeping the chart visually simple.
🧠 How It Works
Tracks volatility using ATR.
Identifies trend shifts when price crosses trailing stops.
Highlights bullish and bearish bars visually for easy reading.
⚙️ Inputs
ATR Sensitivity: Controls how fast the trend adapts.
Use High/Low for Stop: Enables candle wick–based structure tracking.
📊 Ideal For
Traders who want a minimalist price action view with clear trend direction — no clutter, no lagging oscillators.
⚠️ Disclaimer
This script is for educational and technical analysis purposes only.
It is not financial advice. Always confirm setups using your own judgment and risk management.
Advanced Chandelier Exit with S/R [Alpha Extract]Advanced Chandelier Exit with S/R is a precision-crafted trailing stop and market structure detection system that fuses advanced Chandelier Exit logic with intelligent, multi-timeframe support and resistance tracking. This indicator delivers adaptive trend detection, volatility-aware exit positioning, and real-time structural mapping in a clean, responsive format. By combining directional filtering, pivot zone detection, and customizable styling, Advanced Chandelier Exit with S/R is designed to give traders reliable context, strong risk management, and visually intuitive confirmation signals across all timeframes and asset classes.
🔶 Adaptive Trailing Stop Architecture
At the core of Advanced Chandelier Exit with S/R is a refined Chandelier Exit mechanism that dynamically calculates trailing stops based on recent highs and lows, ATR volatility, and trend sensitivity. The system features directional memory, anchoring the stop to maintain position until a confirmed trend break occurs. This method prevents premature flips and keeps the trade aligned with sustained momentum.
longStop := close > longStop ? math.max(longStop, longStop ) : longStop
shortStop := close < shortStop ? math.min(shortStop, shortStop ) : shortStop
🔶 Volatility-Weighted Filtering
To reduce noise and improve reaction quality, Advanced Chandelier Exit with S/R includes an optional volatility normalization filter. This system adjusts ATR output based on how elevated it is relative to its own average, effectively down-weighting erratic price moves while maintaining responsiveness in directional phases.
volatilityFilter = enableVolatilityFilter ? ta.sma(baseATR, length) / baseATR : 1.0
atr = mult * baseATR * sensitivity * volatilityFilter
🔶 Trend Strength-Aware State Transitions
Trend flips in Advanced Chandelier Exit with S/R are not based solely on price crossing the stop level. Instead, the system includes a momentum-derived trend strength filter that validates the legitimacy of directional shifts. This guards against weak reversals and gives stronger confidence in breakout moves.
priceChange = math.abs(close - close )
avgPriceChange = ta.sma(priceChange, length)
trendStrength = math.min(priceChange / avgPriceChange * 100, 200)
🔶 Multi-Timeframe Support & Resistance Zones
Advanced Chandelier Exit with S/R embeds a sophisticated pivot-based structure mapping engine that automatically identifies significant price reaction levels and tracks their validity over time. It filters redundant zones, removes invalidated levels, and renders real-time support and resistance overlays based on market structure.
if isUniqueLevel(ph, resistanceLevels)
array.unshift(resistanceLevels, ph)
if isUniqueLevel(pl, supportLevels)
array.unshift(supportLevels, pl)
🔶 Dynamic Visual Encoding
The indicator uses strength-scaled fills, customizable colors, and line styling to convey directional bias with clarity. Color opacity intensifies as trend strength increases, offering intuitive context at a glance. Dynamic background fills mark trend states, while S/R zones are rendered with user-defined transparency for clean integration.
🔶 Signal Detection and Alerts
Directional signals are generated upon confirmed flips between long and short regimes, validated by stop crosses and strength filters. Additionally, the indicator provides S/R breakout alerts, identifying when price breaks through a key structural level.
🔶 Performance and Customization Optimizations
Advanced Chandelier Exit with S/R is built with modularity and efficiency in mind. It supports full customization of stop logic, volatility sensitivity, structural lookback, S/R zone filtering, and visual display. The use of array-based data structures for S/R levels ensures consistent performance even across high-activity assets and longer lookback periods.
Advanced Chandelier Exit with S/R represents the next evolution in trailing stop and structure-aware trading tools. By blending the proven logic of the Chandelier Exit system with intelligent trend strength filters and robust S/R detection, it becomes more than just a stop indicator—it becomes a complete trade management companion. Traders benefit from fewer false flips, clearer directional bias, and precise structural overlays that reinforce both breakout and reversal strategies. Whether used for swing entries, intraday positioning, or zone-based re-entries, Advanced Chandelier Exit with S/R empowers traders with responsive, intelligent logic that adapts to market conditions without compromise.

Fractals & SweepThe Fractals & Sweep indicator is designed to identify key market structure points (fractals) and detect potential liquidity sweeps around those areas. It visually highlights both Bill Williams fractals and regular fractals, and alerts the user when the market sweeps liquidity above or below the most recent fractal levels.
Fractal Recognition:
Detects both bullish (low) and bearish (high) fractals on the price chart.
Users can choose between:
Bill Williams fractal logic (default), or
Regular fractal logic (when the “Filter Bill Williams Fractals” option is enabled).
Fractals are plotted directly on the chart as red downward triangles for highs and green upward triangles for lows.
Fractal Tracking:
The indicator stores the most recent high and low fractal levels to serve as reference points for potential sweep detection.
Sweep Detection:
A bearish sweep is triggered when the price wicks above the last fractal high but closes below it — suggesting a liquidity grab above resistance.
A bullish sweep is triggered when the price wicks below the last fractal low but closes above it — suggesting a liquidity grab below support.
When a sweep occurs, the indicator draws a horizontal line from the previous fractal point to the current bar.
Alert System:
Custom alerts notify the trader when a bearish sweep or bullish sweep occurs, allowing for timely reactions to potential reversals or liquidity traps.

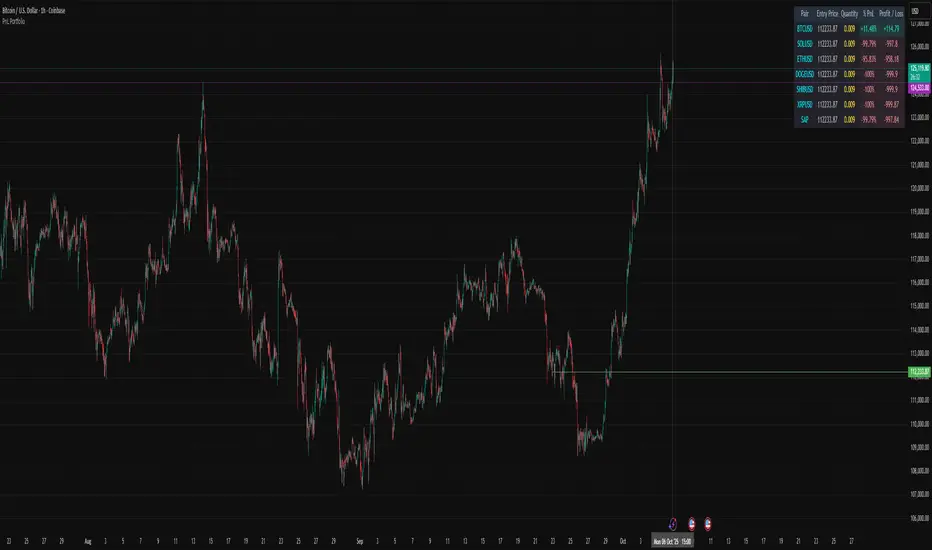
PnL PortfolioThis script allows you to input the details for up to 20 active positions across various trading pairs or markets. Stop manually calculating your trades—get instant, real-time feedback on your performance.
Key Features:
Multi-Pair Tracking: Monitor up to 20 unique symbols simultaneously.
Required Inputs: Easily define the Symbol, Entry Price, and Position Quantity (size) for each trade in the indicator settings.
Real-Time PnL: Instantly calculates and displays two critical metrics based on the current market price:
% PnL (Percentage Profit/Loss)
Absolute Profit/Loss (in currency)
Color-Coded Feedback: The PnL columns are color-coded (green/teal for profit, red/maroon for loss) for immediate visual confirmation of your trade health.
Customizable Layout: Choose where the dashboard table appears on your chart (top-left, top-right, bottom-left, or bottom-right) to keep your trading view clean.
This is an essential overlay for any trader managing multiple active positions and needing a consolidated, easy-to-read overview.
Realtime rVOL w/ Candle Highlight [Blk0ut]About This Script
Realtime rVOL Table + Candle Highlight (Presets, No Smoothing)
By Blk0ut
This tool visualizes real-time relative volume (rVOL) directly on your chart and in a compact table, helping traders identify where intraday participation deviates from the session’s baseline.
Unlike standard volume overlays, this script recalculates rVOL dynamically through the session and highlights candles when participation exceeds configurable thresholds — providing a clear picture of ignition zones, volume surges, and potential breakout conditions.
Core Features
-Realtime rVOL tracking: Displays the current bar’s relative volume ratio compared to a moving baseline of recent bars.
-Preset Profiles: Choose from four purpose-built profiles to quickly adjust the rVOL sensitivity to your trading horizon.
----------------------------------------------------------------------
*Opening Rush: 100-bar lookback, threshold 2.5*
*RTH 5m: 30-bar lookback, threshold 1.2*
*RTH 1hr: 50-bar lookback, threshold 1.5*
*RTH 1d+: 100-bar lookback, threshold 1.5*
----------------------------------------------------------------------
RTH-only filter: Option to limit the moving average baseline to regular market hours (09:30–16:00).
Candle highlighting: Optionally outlines candles when rVOL exceeds the active threshold to emphasize spikes visually in real time.
Table display: Compact dashboard showing current rVOL, raw volume, average baseline, and preset parameters.
How To Use
Select a preset that matches your timeframe or trading style.
Scalpers and open traders can use RTH 5m or Opening Rush.
Position or swing traders may prefer RTH 1hr or RTH 1d+.
Watch for rVOL readings above the threshold (and colored candle outlines). These often correspond to momentum ignition, news impact, or institutional activity.
Combine with VWAP, ORB, or intraday key levels for best confirmation.
Notes
The table automatically adapts to your chart corner choice.
Highlight thresholds can follow the preset or be set manually.
Color intensity tiers (High/Medium/Low) can be tuned in settings.
Designed for intraday and session-based traders who rely on live volume context rather than end-of-day stats.

Current Price (Customizable) by DRtradeCurrent Price Line & Dynamic Label (Fully Customizable)
The ultimate tool for clear, real-time price visualization.
This powerful, lightweight indicator draws a clean horizontal line at the current market price, updating instantly with every price tick. Unlike other current price line scripts, this tool ensures you always see where the price is right now and provides full control over every visual element.
Key Features:
- Real-Time Tracking: The line moves dynamically with price ticks within the current candle, eliminating lag and providing true current market price awareness.
- Line Extension Control: Choose to extend: Left, Right, or Both. Helpful for scalpers and options traders
- Visual Customizations: Color, Style, Size, Width, etc.
- Label Positioning: Left of Candle, Above Candle, or Right of Candle
All customization options are available in the indicator's settings menu.
Ping me with feature reqeusts.

BOCS Channel Scalper Strategy - Automated Mean Reversion System# BOCS Channel Scalper Strategy - Automated Mean Reversion System
## WHAT THIS STRATEGY DOES:
This is an automated mean reversion trading strategy that identifies consolidation channels through volatility analysis and executes scalp trades when price enters entry zones near channel boundaries. Unlike breakout strategies, this system assumes price will revert to the channel mean, taking profits as price bounces back from extremes. Position sizing is fully customizable with three methods: fixed contracts, percentage of equity, or fixed dollar amount. Stop losses are placed just outside channel boundaries with take profits calculated either as fixed points or as a percentage of channel range.
## KEY DIFFERENCE FROM ORIGINAL BOCS:
**This strategy is designed for traders seeking higher trade frequency.** The original BOCS indicator trades breakouts OUTSIDE channels, waiting for price to escape consolidation before entering. This scalper version trades mean reversion INSIDE channels, entering when price reaches channel extremes and betting on a bounce back to center. The result is significantly more trading opportunities:
- **Original BOCS**: 1-3 signals per channel (only on breakout)
- **Scalper Version**: 5-15+ signals per channel (every touch of entry zones)
- **Trade Style**: Mean reversion vs trend following
- **Hold Time**: Seconds to minutes vs minutes to hours
- **Best Markets**: Ranging/choppy conditions vs trending breakouts
This makes the scalper ideal for active day traders who want continuous opportunities within consolidation zones rather than waiting for breakout confirmation. However, increased trade frequency also means higher commission costs and requires tighter risk management.
## TECHNICAL METHODOLOGY:
### Price Normalization Process:
The strategy normalizes price data to create consistent volatility measurements across different instruments and price levels. It calculates the highest high and lowest low over a user-defined lookback period (default 100 bars). Current close price is normalized using: (close - lowest_low) / (highest_high - lowest_low), producing values between 0 and 1 for standardized volatility analysis.
### Volatility Detection:
A 14-period standard deviation is applied to the normalized price series to measure price deviation from the mean. Higher standard deviation values indicate volatility expansion; lower values indicate consolidation. The strategy uses ta.highestbars() and ta.lowestbars() to identify when volatility peaks and troughs occur over the detection period (default 14 bars).
### Channel Formation Logic:
When volatility crosses from a high level to a low level (ta.crossover(upper, lower)), a consolidation phase begins. The strategy tracks the highest and lowest prices during this period, which become the channel boundaries. Minimum duration of 10+ bars is required to filter out brief volatility spikes. Channels are rendered as box objects with defined upper and lower boundaries, with colored zones indicating entry areas.
### Entry Signal Generation:
The strategy uses immediate touch-based entry logic. Entry zones are defined as a percentage from channel edges (default 20%):
- **Long Entry Zone**: Bottom 20% of channel (bottomBound + channelRange × 0.2)
- **Short Entry Zone**: Top 20% of channel (topBound - channelRange × 0.2)
Long signals trigger when candle low touches or enters the long entry zone. Short signals trigger when candle high touches or enters the short entry zone. This captures mean reversion opportunities as price reaches channel extremes.
### Cooldown Filter:
An optional cooldown period (measured in bars) prevents signal spam by enforcing minimum spacing between consecutive signals. If cooldown is set to 3 bars, no new long signal will fire until 3 bars after the previous long signal. Long and short cooldowns are tracked independently, allowing both directions to signal within the same period.
### ATR Volatility Filter:
The strategy includes a multi-timeframe ATR filter to avoid trading during low-volatility conditions. Using request.security(), it fetches ATR values from a specified timeframe (e.g., 1-minute ATR while trading on 5-minute charts). The filter compares current ATR to a user-defined minimum threshold:
- If ATR ≥ threshold: Trading enabled
- If ATR < threshold: No signals fire
This prevents entries during dead zones where mean reversion is unreliable due to insufficient price movement.
### Take Profit Calculation:
Two TP methods are available:
**Fixed Points Mode**:
- Long TP = Entry + (TP_Ticks × syminfo.mintick)
- Short TP = Entry - (TP_Ticks × syminfo.mintick)
**Channel Percentage Mode**:
- Long TP = Entry + (ChannelRange × TP_Percent)
- Short TP = Entry - (ChannelRange × TP_Percent)
Default 50% targets the channel midline, a natural mean reversion target. Larger percentages aim for opposite channel edge.
### Stop Loss Placement:
Stop losses are placed just outside the channel boundary by a user-defined tick offset:
- Long SL = ChannelBottom - (SL_Offset_Ticks × syminfo.mintick)
- Short SL = ChannelTop + (SL_Offset_Ticks × syminfo.mintick)
This logic assumes channel breaks invalidate the mean reversion thesis. If price breaks through, the range is no longer valid and position exits.
### Trade Execution Logic:
When entry conditions are met (price in zone, cooldown satisfied, ATR filter passed, no existing position):
1. Calculate entry price at zone boundary
2. Calculate TP and SL based on selected method
3. Execute strategy.entry() with calculated position size
4. Place strategy.exit() with TP limit and SL stop orders
5. Update info table with active trade details
The strategy enforces one position at a time by checking strategy.position_size == 0 before entry.
### Channel Breakout Management:
Channels are removed when price closes more than 10 ticks outside boundaries. This tolerance prevents premature channel deletion from minor breaks or wicks, allowing the mean reversion setup to persist through small boundary violations.
### Position Sizing System:
Three methods calculate position size:
**Fixed Contracts**:
- Uses exact contract quantity specified in settings
- Best for futures traders (e.g., "trade 2 NQ contracts")
**Percentage of Equity**:
- position_size = (strategy.equity × equity_pct / 100) / close
- Dynamically scales with account growth
**Cash Amount**:
- position_size = cash_amount / close
- Maintains consistent dollar exposure regardless of price
## INPUT PARAMETERS:
### Position Sizing:
- **Position Size Type**: Choose Fixed Contracts, % of Equity, or Cash Amount
- **Number of Contracts**: Fixed quantity per trade (1-1000)
- **% of Equity**: Percentage of account to allocate (1-100%)
- **Cash Amount**: Dollar value per position ($100+)
### Channel Settings:
- **Nested Channels**: Allow multiple overlapping channels vs single channel
- **Normalization Length**: Lookback for high/low calculation (1-500, default 100)
- **Box Detection Length**: Period for volatility detection (1-100, default 14)
### Scalping Settings:
- **Enable Long Scalps**: Toggle long entries on/off
- **Enable Short Scalps**: Toggle short entries on/off
- **Entry Zone % from Edge**: Size of entry zone (5-50%, default 20%)
- **SL Offset (Ticks)**: Distance beyond channel for stop (1+, default 5)
- **Cooldown Period (Bars)**: Minimum spacing between signals (0 = no cooldown)
### ATR Filter:
- **Enable ATR Filter**: Toggle volatility filter on/off
- **ATR Timeframe**: Source timeframe for ATR (1, 5, 15, 60 min, etc.)
- **ATR Length**: Smoothing period (1-100, default 14)
- **Min ATR Value**: Threshold for trade enablement (0.1+, default 10.0)
### Take Profit Settings:
- **TP Method**: Choose Fixed Points or % of Channel
- **TP Fixed (Ticks)**: Static distance in ticks (1+, default 30)
- **TP % of Channel**: Dynamic target as channel percentage (10-100%, default 50%)
### Appearance:
- **Show Entry Zones**: Toggle zone labels on channels
- **Show Info Table**: Display real-time strategy status
- **Table Position**: Corner placement (Top Left/Right, Bottom Left/Right)
- **Color Settings**: Customize long/short/TP/SL colors
## VISUAL INDICATORS:
- **Channel boxes** with semi-transparent fill showing consolidation zones
- **Colored entry zones** labeled "LONG ZONE ▲" and "SHORT ZONE ▼"
- **Entry signal arrows** below/above bars marking long/short entries
- **Active TP/SL lines** with emoji labels (⊕ Entry, 🎯 TP, 🛑 SL)
- **Info table** showing position status, channel state, last signal, entry/TP/SL prices, and ATR status
## HOW TO USE:
### For 1-3 Minute Scalping (NQ/ES):
- ATR Timeframe: "1" (1-minute)
- ATR Min Value: 10.0 (for NQ), adjust per instrument
- Entry Zone %: 20-25%
- TP Method: Fixed Points, 20-40 ticks
- SL Offset: 5-10 ticks
- Cooldown: 2-3 bars
- Position Size: 1-2 contracts
### For 5-15 Minute Day Trading:
- ATR Timeframe: "5" or match chart
- ATR Min Value: Adjust to instrument (test 8-15 for NQ)
- Entry Zone %: 20-30%
- TP Method: % of Channel, 40-60%
- SL Offset: 5-10 ticks
- Cooldown: 3-5 bars
- Position Size: Fixed contracts or 5-10% equity
### For 30-60 Minute Swing Scalping:
- ATR Timeframe: "15" or "30"
- ATR Min Value: Lower threshold for broader market
- Entry Zone %: 25-35%
- TP Method: % of Channel, 50-70%
- SL Offset: 10-15 ticks
- Cooldown: 5+ bars or disable
- Position Size: % of equity recommended
## BACKTEST CONSIDERATIONS:
- Strategy performs best in ranging, mean-reverting markets
- Strong trending markets produce more stop losses as price breaks channels
- ATR filter significantly reduces trade count but improves quality during low volatility
- Cooldown period trades signal quantity for signal quality
- Commission and slippage materially impact sub-5-minute timeframe performance
- Shorter timeframes require tighter entry zones (15-20%) to catch quick reversions
- % of Channel TP adapts better to varying channel sizes than fixed points
- Fixed contract sizing recommended for consistent risk per trade in futures
**Backtesting Parameters Used**: This strategy was developed and tested using realistic commission and slippage values to provide accurate performance expectations. Recommended settings: Commission of $1.40 per side (typical for NQ futures through discount brokers), slippage of 2 ticks to account for execution delays on fast-moving scalp entries. These values reflect real-world trading costs that active scalpers will encounter. Backtest results without proper cost simulation will significantly overstate profitability.
## COMPATIBLE MARKETS:
Works on any instrument with price data including stock indices (NQ, ES, YM, RTY), individual stocks, forex pairs (EUR/USD, GBP/USD), cryptocurrency (BTC, ETH), and commodities. Volume-based features require data feed with volume information but are optional for core functionality.
## KNOWN LIMITATIONS:
- Immediate touch entry can fire multiple times in choppy zones without adequate cooldown
- Channel deletion at 10-tick breaks may be too aggressive or lenient depending on instrument tick size
- ATR filter from lower timeframes requires higher-tier TradingView subscription (request.security limitation)
- Mean reversion logic fails in strong breakout scenarios leading to stop loss hits
- Position sizing via % of equity or cash amount calculates based on close price, may differ from actual fill price
- No partial closing capability - full position exits at TP or SL only
- Strategy does not account for gap openings or overnight holds
## RISK DISCLOSURE:
Trading involves substantial risk of loss. Past performance does not guarantee future results. This strategy is for educational purposes and backtesting only. Mean reversion strategies can experience extended drawdowns during trending markets. Stop losses may not fill at intended levels during extreme volatility or gaps. Thoroughly test on historical data and paper trade before risking real capital. Use appropriate position sizing and never risk more than you can afford to lose. Consider consulting a licensed financial advisor before making trading decisions. Automated trading systems can malfunction - monitor all live positions actively.
## ACKNOWLEDGMENT & CREDITS:
This strategy is built upon the channel detection methodology created by **AlgoAlpha** in the "Smart Money Breakout Channels" indicator. Full credit and appreciation to AlgoAlpha for pioneering the normalized volatility approach to identifying consolidation patterns. The core channel formation logic using normalized price standard deviation is AlgoAlpha's original contribution to the TradingView community.
Enhancements to the original concept include: mean reversion entry logic (vs breakout), immediate touch-based signals, multi-timeframe ATR volatility filtering, flexible position sizing (fixed/percentage/cash), cooldown period filtering, dual TP methods (fixed points vs channel percentage), automated strategy execution with exit management, and real-time position monitoring table.

Seasonality con números RAMÓN SEGOVIAMonthly Bands – Colored Monthly Stripes for Statistical Analysis
Short Description
This indicator paints vertical background stripes by calendar month on your chart, making it easy to run statistical/seasonality analysis, compare monthly performance, and visually identify recurring patterns across assets and timeframes.
How It Works
Detects each new month and applies a background band spanning from the first to the last candle of that month.
Alternates colors automatically so consecutive months are easy to distinguish, or use a single uniform color for a clean look.
Optional: add dotted lines at the start/end of each month for precise separation.
Inputs / Settings
Color mode: alternating (odd/even months) or single.
Colors & opacity of the bands.
Border style: none / solid / dotted.
Highlight specific months: e.g., “Jan, Apr, Oct” with a different color.
Labels option: show month & year abbreviations at the top/bottom of the chart.
Drawing zone: full background vs. price-only area (to avoid covering lower indicators).
Typical Use Cases
Seasonality studies: identify historically bullish/bearish months.
Visual backtesting: segment the chart by months to evaluate strategy performance.
Context tracking: quickly locate reports, monthly closes, or economic cycles.
Compatibility
Works on all timeframes, including intraday (each band covers the full calendar month).
Lightweight and visual-only; doesn’t interfere with price or indicators.
Pro Tips
Combine with monthly returns (%) or candle counters to quantify each stripe.
Use labels when preparing clean presentations or trade journal screenshots.
Notes
This is a visual tool only, not a buy/sell signal generator.
Default settings are optimized for clarity and minimal clutter.

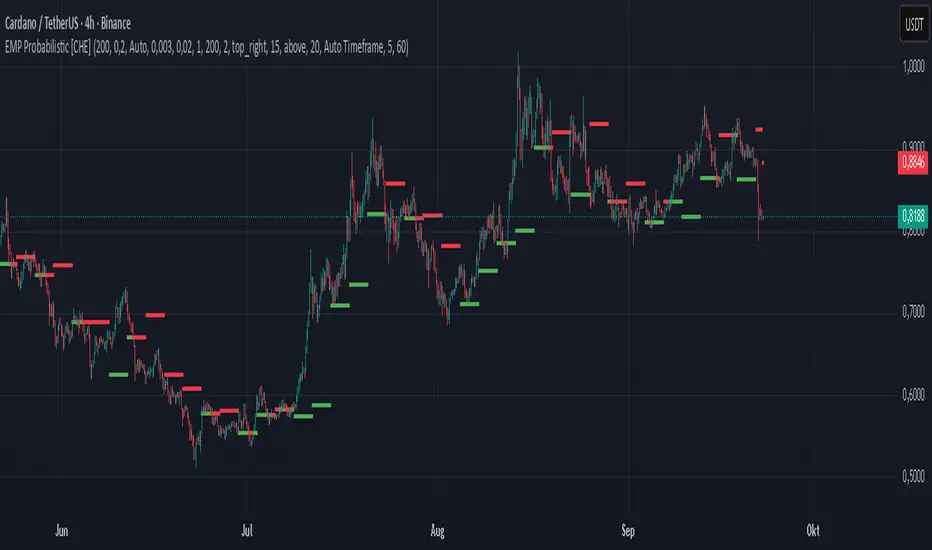
EMP Probabilistic [CHE]Part 1 — For Traders (Practical Overview, no formulas)
What this tool does
EMP Probabilistic \ turns raw price action into a clean, probability-aware map. It builds two adaptive bands around the session open of a higher timeframe you choose (called the S-timeframe) and highlights a robust median threshold. At a glance you know:
Where price has recently tended to stay,
Whether current momentum sits above or below the median, and
A live Long vs. Short probability based on recent outcomes.
Why it improves decisions
Objective context in any regime: The nonparametric band comes straight from recent market behavior, without assuming a particular distribution.
Volatility-aware risk lens: The parametric band adapts to current volatility, helping you judge stretch and room for continuation or snap-back.
No lookahead: All stats update only after an S-bar is finished. That means the panel reflects information you truly had at that time.
How to read the chart
Orange band = empirical, distribution-free range derived from recent session returns (nonparametric).
Teal band = volatility-scaled range around the session open (parametric).
Median dots: green when close is above the median threshold, red when below.
Info panel: shows the active S-timeframe, window sizes, live coverage for both bands, the internal width parameter and volatility estimate, plus a one-line summary.
Probability label: “Long XX% • Short YY%” — a simple read on the recent balance of up vs. down S-bars.
How to use it (quick start)
1. Choose S-timeframe with Auto, Multiplier, or Manual. “Auto” scales your chart TF up to a sensible higher step.
2. Set alpha to control how tight the inner band should be. A typical value gives you a comfortable center zone without cutting off healthy trends.
3. Trade the context:
Trend-following: Prefer longs when price holds above the median; prefer shorts when it stays below.
Mean-reversion: Fade moves near the outer edges during ranges; look for reversion back toward the median.
Breakout filter: Require closes that push and hold beyond the volatility band for momentum plays; avoid noise when price chops inside the middle of the orange band.
Risk management made practical
Size positions relative to the teal band width to keep risk consistent across instruments and regimes.
For stops, many traders set them just beyond the opposite orange bound or use a fraction of the teal band.
Watch the panel’s coverage readouts and Brier score; when they deteriorate, the market may be shifting — reduce size or demand stronger confirmation.
Suggested presets
Scalping (Crypto/FX): Auto S-TF, alpha around a fifth, calibration window near two hundred, RS volatility, metrics window near two hundred.
Intraday Futures: Multiplier 3–5× your chart TF; similar alpha and window sizes; RS volatility is a solid default.
Swing/Equities: S-TF at least daily; test both RS and GK volatility modes; keep windows on the larger side for stability.
What makes it different
Two complementary lenses: a distribution-free read of recent behavior and a volatility-scaled read for risk and stretch.
Self-calibrating width: the parametric band quietly nudges its internal multiplier so actual coverage tracks your target.
Clean UX: grouped inputs, tooltips, an info panel that tells you what’s going on, and a simple median bias you can act on.
Repainting & timing
The logic updates only when the S-bar closes. On lower-timeframe charts you’ll see intrabar flips of the dot color — that’s just live price moving around. For strict signals, confirm on S-bar close.
Friendly note (not financial advice)
Use this as a context engine. It won’t predict the future, but it will keep you on the right side of probability and volatility more often, which is exactly where consistency starts.
Part 2 — Under the Hood (Conceptual, no formulas)
Data and timeframe design
The script works on a higher S-timeframe you select. It fetches the open, high, low, close, and time of that S-bar. Internally, it only updates its rolling windows after an S-bar has finished. It then pushes the previous S-bar’s statistics into its arrays. That design removes lookahead and keeps the metrics out-of-sample relative to the current S-bar.
Nonparametric band (distribution-free)
The orange band comes from the empirical distribution of recent session-level close-minus-open moves. The script keeps a rolling window, sorts a safe copy, and reads three key points: a lower bound, a median, and an upper bound. Because it’s based purely on observed outcomes, it adapts naturally to skew, fat tails, and regime shifts without assuming any particular shape. The orange range shows “where price has tended to live” lately on the chosen S-timeframe.
Parametric band (volatility-scaled)
The teal band models log-space variability around the session open using one of two well-known OHLC volatility estimators: Rogers–Satchell or Garman–Klass. Each estimator contributes a per-bar variance figure; the script averages these across the rolling window to form a current volatility scale. It then builds a symmetric band around the session open in price space. This gives you a volatility-aware notion of stretch that complements the distribution-free orange band.
Self-calibration of band width
The teal band has an internal width multiplier. After each completed S-bar the script checks whether the realized move stayed inside that band. If the band was too tight, the multiplier is nudged upward; if it was too loose, it’s eased downward. A simple learning rate governs how quickly it adapts. Over time this keeps the realized inside-coverage close to the target implied by your alpha setting, without you having to hand-tune anything.
Long/Short probability and calibration quality
The Long vs. Short probability is a transparent statistic: it’s just the recent fraction of up sessions in the rolling window. It is not a complex model — and that’s the point. You get an honest, intuitive read on directional tendency.
To monitor how well this simple probability lines up with reality, the script tracks a Brier-style score over a separate metrics window. Lower is better: it means your recent probability read has matched outcomes more closely.
Coverage tracking for both bands
The panel reports coverage for the orange band (nonparametric) and the teal band (parametric). These are rolling averages of how often recent S-bar moves landed inside each band. Watching these two numbers tells you whether market behavior still aligns with the recent distribution and with the current volatility model.
Why it doesn’t repaint
Because the arrays update only when an S-bar closes and only push the previous bar’s stats, the panel and metrics reflect information you had at the time. Intrabar visuals can change while a bar is forming — that’s expected — but the decision framework itself is anchored to completed S-bars.
Performance and practicality
The heaviest step is sorting a copy of the window for the nonparametric band. With typical window sizes this stays responsive on TradingView. The volatility estimators and rolling averages are lightweight. Inputs are grouped with clear tooltips so you can tune without hunting.
Limitations and good practice
In thin or gappy markets the bands can jump; consider a larger window or a higher S-timeframe.
During violent regime shifts, shorten the window and increase the learning rate slightly so the teal band catches up faster — but don’t overdo it, or you’ll chase noise.
The Long/Short probability is intentionally simple; it’s a context indicator, not a standalone signal factory. Combine it with structure, volume, or your execution rules.
Takeaway
Under the hood, the script blends empirical behavior and volatility scaling, then self-calibrates so the teal band’s real-world coverage stays near your target. You get clarity, consistency, and a dashboard that tells you when its own assumptions are holding up — exactly what you need to trade with confidence.
Disclaimer
The content provided, including all code and materials, is strictly for educational and informational purposes only. It is not intended as, and should not be interpreted as, financial advice, a recommendation to buy or sell any financial instrument, or an offer of any financial product or service. All strategies, tools, and examples discussed are provided for illustrative purposes to demonstrate coding techniques and the functionality of Pine Script within a trading context.
Any results from strategies or tools provided are hypothetical, and past performance is not indicative of future results. Trading and investing involve high risk, including the potential loss of principal, and may not be suitable for all individuals. Before making any trading decisions, please consult with a qualified financial professional to understand the risks involved.
By using this script, you acknowledge and agree that any trading decisions are made solely at your discretion and risk.
Best regards and happy trading
Chervolino
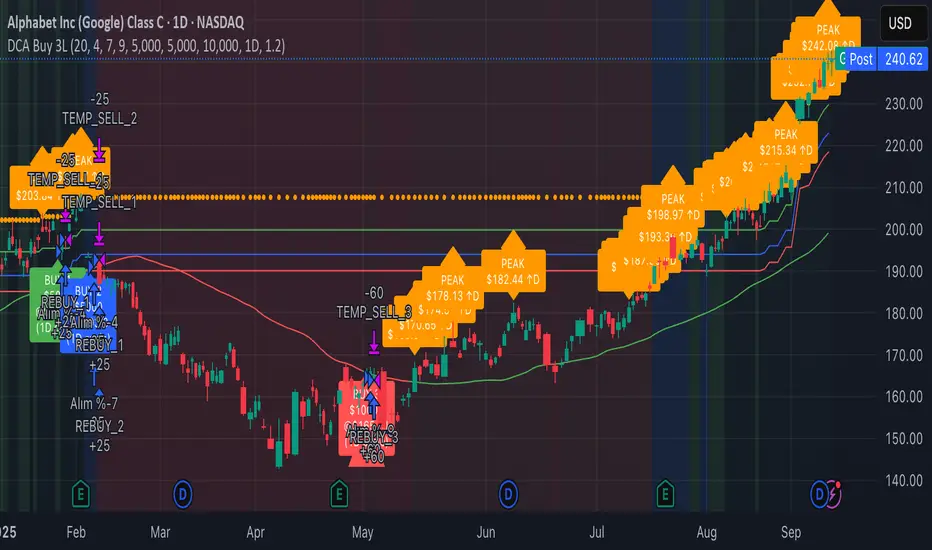
3-Level DCA Buy Strategy🎯 3-Level DCA Buy Strategy - Smart Dollar Cost Averaging
Professional DCA strategy that systematically accumulates positions during market dips. Enhanced with daily trend analysis for intelligent accumulation.
🚀 Key Features
- 3-Level Buying System: Automatic purchases at 5%, 10%, 15% drops from cycle highs
- Daily Trend Analysis: 1-day timeframe trend confirmation
- Smart Peak Detection: 100-period lookback for meaningful peaks
- Volume Filter: Optional volume confirmation system
- USD-Based Positions: Fixed dollar amounts per level
- Never Sells: Pure accumulation philosophy (buy-only)
📊 How It Works
1. Peak Identification: Detects highest price in last 100 periods
2. Daily Trend Check: Confirms price above 50 SMA on 1D timeframe
3. Drop Tracking: Calculates percentage drops from cycle high
4. Systematic Buying: Executes predetermined amounts at each level
5. Cycle Reset: Renews buy permissions when new peaks form
⚙️ Default Settings
- Buy Levels: 5%, 10%, 15% drops
- Position Sizes: $100, $150, $200
- Peak Period: 100 bars
- Higher Timeframe: 1 Day (1D)
- Pyramiding: 500 order capacity
🎨 Visual Elements
- Orange Circles: Mark cycle highs
- Colored Lines: Green/Blue/Red buy levels
- Triangle Signals: Buy point indicators
- Live Panel: Real-time statistics
- Background Colors: Trend and drop level indicators
🔔 Alert System
- Instant notifications for each buy level
- New peak detection alerts
- Major drop warnings (>20%)
- Daily trend change notifications
💡 Ideal Use Cases
- Crypto Accumulation: Bitcoin, Ethereum and major altcoins
- Stock DCA: Long-term portfolio building
- Volatile Markets: Capitalizing on price fluctuations
- Emotional Trading Prevention: Automated and disciplined buying
📈 Strategy Logic
This strategy follows the "buy the dip" philosophy. It waits during market rises and systematically builds positions during declines. Only buys when daily trend is bullish, providing protection during major bear markets.
⚠️ Important Notes
- Buy-only strategy - never sells positions
- Requires sufficient capital for multiple entries
- Most effective in trending and volatile markets
- Always backtest before live trading
- Risk management is your responsibility
🛠️ Customization Options
All parameters are fully customizable: drop percentages, position amounts, timeframes, visual elements and more. Suitable for both beginner and experienced investors.
🎯 Publishing Feature
Note: Strategy includes temporary 1-day sell cycle for TradingView publishing requirements. This feature can be disabled for normal DCA mode operation.
⭐ If you find this strategy helpful, please like and follow! Visit the profile for more trading tools.
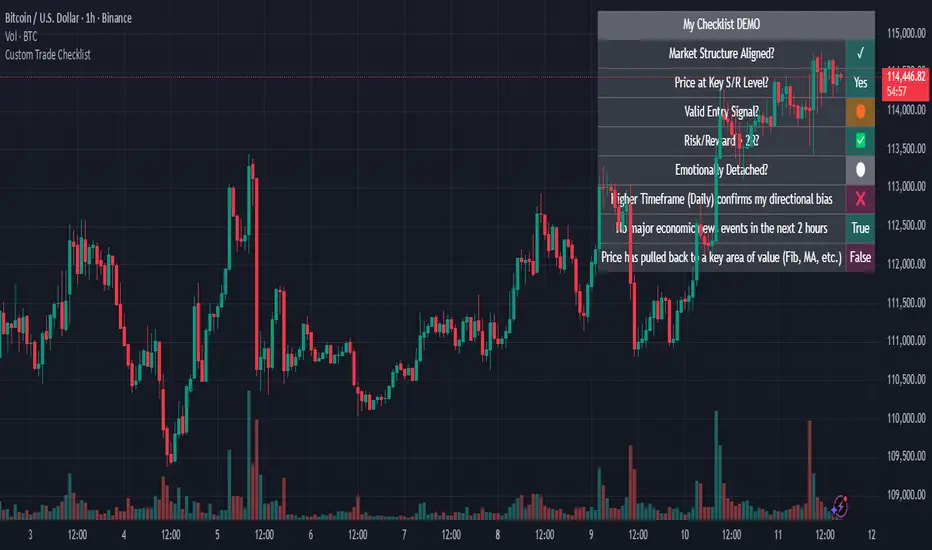
Custom Trade Checklist by [YSFX]# Custom Trade Checklist: Your On-Chart Trading Co-Pilot
## Overview
Ever taken a trade based on impulse, only to realize you forgot a key step in your analysis? The Custom Trade Checklist is a simple yet powerful on-chart utility designed to help you remain disciplined and consistent with your trading strategy.
By externalizing your trading plan into a visible, interactive checklist, you can reduce emotional decision-making and systematically verify your criteria before entering or exiting a trade. This tool acts as your personal co-pilot, ensuring you follow your rules on every single trade.
## Key Features
✅ Fully Customizable Rules: Define up to 10 unique checklist items tailored to your specific trading strategy. Examples include "Market Structure Aligned?", "RSI Oversold?", "News Events Checked?", or "Risk/Reward > 2:1?".
⚪ Dynamic Status Tracking: Use a simple dropdown menu in the settings to mark each rule with intuitive symbols like:
✅ / ✓ - Completed / True
❌ / ✕ - Failed / False
🟡 - Pending / Caution
⚪ - Neutral / Not Checked
And many more for complete flexibility.
📋 Clean & Minimalist Display: The checklist is presented in a clean, unobtrusive table that can be positioned in any corner of your chart, ensuring it provides guidance without cluttering your analysis.
⚙️ Flexible Configuration:
Choose the maximum number of entries to display.
Optionally hide disabled checklist items to keep your view focused on what's active.
Customize the table title to match your strategy (e.g., "Pre-Trade Checklist", "Swing Trade Rules").
🎨 Complete Color Control: Personalize every aspect of the table's appearance. You can independently set the colors for the title, text, background, border, and each individual status symbol to perfectly match your chart's theme.
## How to Use
Add the Indicator to your chart.
Open the Settings Panel by clicking the gear icon (⚙️) on the indicator.
Define Your Rules:
Go through Entry 1 to Entry 10.
For each rule you want to use, check the box to enable it.
In the text field, write your rule (e.g., "Price above 200 EMA").
Update Your Status: Before placing a trade, go back into the settings and update the status dropdown for each rule based on your analysis.
Customize Appearance:
Under the "General" tab, change the table title and position.
Under the "Colors" tab, adjust the colors to your liking.
## Who Is This For?
This tool is perfect for:
Discretionary Traders who need to enforce a consistent set of rules.
New Traders looking to build good habits and internalize their trading plan.
Systematic Traders who want a final pre-flight check before executing a trade.
Anyone working on improving their trading psychology and reducing impulsive actions.
This indicator does not generate signals or trading advice; it is a utility to support the trader's own process and discipline. We hope it helps you achieve greater consistency in your trading journey!
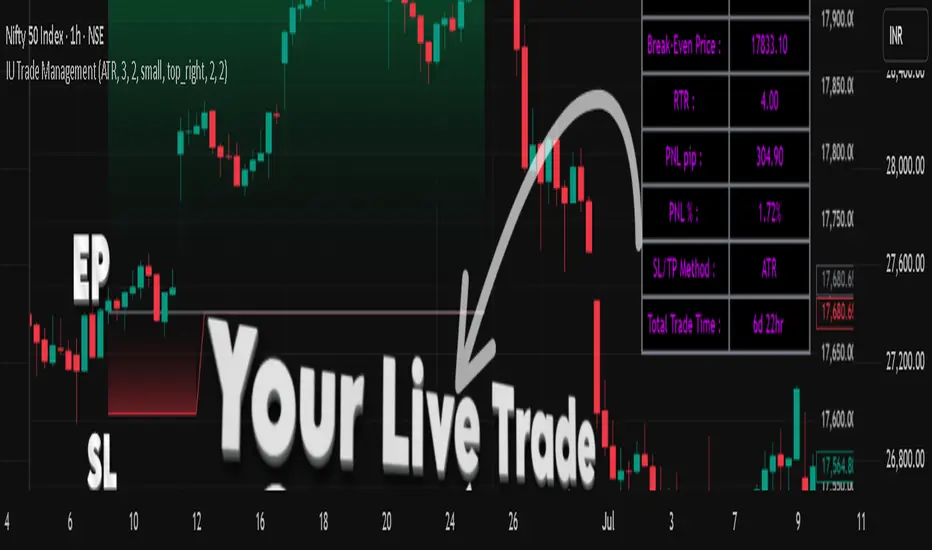
IU Trade ManagementDESCRIPTION
IU Trade Management is a powerful utility tool designed to help traders manage their trades with precision and clarity. It provides automated Stop Loss, Take Profit, and Break Even calculations using multiple customizable methods. Along with clear SL/TP plotting on the chart, it also displays a detailed trade status table that tracks every important detail including entry price, SL/TP levels, break-even, PNL, and trade duration. This tool is perfect for traders who want to manage risk and rewards visually and systematically.
USER INPUTS :
-Entry Candle Time: Default 20 Jul 2021 00:00 +0300 (select the candle from which the trade begins)
- Entry Price: Default 2333 (define the price at which the trade is executed)
- Trade Direction: Default Long (choose between Long or Short)
- SL/TP Method: Default ATR (options: ATR, Points/Pips, Percentage %, Standard Deviation, Highest/Lowest, Previous High/Low)
- Risk to Reward: Default 3 (set custom risk-to-reward ratio)
- Use Break Even: Default false (option to enable break-even)
- Plot Break Even Line: Default false (option to display BE line)
- RTR of Break Even Point: Default 2 (factor used for BE calculation)
SL/TP Method Specific Inputs:
- ATR Length: Default 14
- ATR Factor: Default 2
- Points/Pips: Default 100
- Percentage: Default 1%
- Standard Deviation Length: Default 20
- Standard Deviation Factor: Default 2
- Highest/Lowest Length: Default 10
Trade Status Table Settings:
- Show Trade Status: Default true
- Table Size: Default small (options: normal, tiny, small, large)
- Table Position: Default top right
- Frame Width: Default 2
- Table Color: Default black
- Frame Color: Default gray
- Border Width: Default 2
- Border Color: Default gray
- Text Color: Default purple (RGB 212, 0, 255)
HOW TO USE THE INDICATOR:
1. Set the entry candle time and entry price manually.
2. Select whether the trade is Long or Short.
3. Choose the preferred SL/TP calculation method (ATR, Percentage, Points, STD, High/Low, Previous High/Low).
4. Define your risk-to-reward ratio and enable break-even if required.
5. The indicator will automatically plot your Entry, Stop Loss, Take Profit, and Break Even levels on the chart.
6. A detailed trade management table will appear, showing trade direction, SL, TP, PNL (points and %), SL/TP method, and total trade time.
WHY IT IS UNIQUE:
- Offers multiple methods to calculate SL and TP (ATR, Percentage, Points, Standard Deviation, High/Low, Previous High/Low)
- Built-in Break Even functionality for risk-free trade management
- Real-time PNL tracking in both points and percentage
- Trade status table for complete transparency on all trade details
- Visual plotting of SL, TP, and Entry with color-coded zones for clarity
HOW USER CAN BENEFIT FROM IT :
- Helps traders manage risk and reward with discipline
- Eliminates guesswork by automating SL and TP levels
- Provides clear visual guidance on trade exits and risk management
- Enhances decision-making with live trade tracking and performance statistics
- Suitable for manual traders as a trade manager and for strategy developers as a risk management reference
Interval Highlighter with High/Low AlertsInterval Highlighter with High/Low Alerts
Overview:
This Pine Script indicator enhances chart analysis by highlighting specific time intervals and marking the highest and lowest prices within those periods. It supports three customizable modes:
Date Range: Highlight a user-defined period with background shading and plot the highest and lowest prices.
Days of the Week: Highlight specific weekdays with background colors and plot the highest and lowest prices for each day.
Intraday Interval: Highlight a specific intraday time range (e.g., 12:30 PM to 4:30 PM) with background shading and plot the highest and lowest prices within that interval.
Alerts are triggered when the price touches any of the highlighted high or low levels, providing real-time notifications for potential trading opportunities.
High and low lines extend to the right and remain visible after the interval ends. This ensures they act as actionable reference points for alerts between intervals, allowing users to monitor critical levels until a new interval of the same category forms.
Features:
Customizable Time Intervals: Define specific date ranges, weekdays, or intraday intervals to highlight on the chart.
High/Low Tracking: Automatically plots the highest and lowest prices within the defined intervals.
Real-Time Alerts: Set up alerts to notify when the price touches any of the highlighted high or low levels.
Actionable Lines: High/low lines remain visible after interval completion to serve as reference points for alerts.
Visual Enhancements: Customize background colors and line styles for each interval type.
Usage:
Apply the indicator to your chart.
Configure the desired modes (Date Range, Days of the Week, Intraday Interval) in the settings.
Customize the appearance settings to match your preferences.
Set up alerts based on the highlighted high/low levels.
Disclaimer:
This indicator is designed to assist in identifying potential areas of interest based on historical high and low levels within specified intervals. It is not intended as a standalone trading signal. Users should employ additional technical analysis tools and conduct thorough research before making trading decisions.

Momentum Index [BigBeluga]The Momentum Index is an innovative indicator designed to measure the momentum of price action by analyzing the distribution of positive and negative momentum values over a defined period. By incorporating delta-based calculations and smoothing techniques, it provides traders with a clear and actionable representation of market momentum dynamics.
🔵 Key Features:
Delta-Based Momentum Analysis:
Calculates the momentum of price by comparing its current state to its value from a defined number of bars back.
Inside a loop, it evaluates whether momentum values are above or below zero, producing a delta value that reflects the net momentum direction and intensity.
Double EMA Smoothing:
Smooths the raw delta-based momentum values with a double EMA filter, reducing noise and providing a clearer trend signal.
tmi(len) =>
sum = 0.0
sum1 = 0.0
above = 0.0
below = 0.0
src_ = src - src
for i = 0 to len
sum := sum + (src_ > nz(src_ ) ? 1 : -1)
sum1 := sum1 + (sum > 0 ? 1 : -1)
sum1 := emaEma(sum1, 10)
for i = 1 to len
above := above + (sum1 > 0 ? 1 : 0)
below := below + (sum1 > 0 ? 0 : 1)
Directional Momentum Signals:
Generates momentum shift signals and displays them on both the oscillator and the main chart:
- △ Aqua Triangles: Represent upward momentum shifts.
- ▽ Red Triangles: Represent downward momentum shifts.
Dynamic Gradient Display:
Highlights momentum zones with gradient fills:
- Aqua shades for positive momentum (above zero).
- Red shades for negative momentum (below zero).
Dashboard Display:
A dashboard summarizing the count of momentum values above and below zero for the defined period (Sentiment Length e.g. 100), helping traders assess market sentiment at a glance.
🔵 How It Works:
The indicator takes price momentum as its source and evaluates the number of momentum values above and below zero within a defined period.
The delta calculation aggregates this information, providing a net representation of the prevailing market momentum.
A double EMA filter is applied to the delta values, smoothing the momentum line and enhancing signal clarity.
Momentum shifts are highlighted with visual signals on the oscillator and price chart, while the gradient display provides a visual representation of intensity.
🔵 Use Cases:
Momentum Tracking: Identify whether market momentum is predominantly bullish or bearish.
Signal Confirmation: Use chart-based signals to confirm potential trend reversals or continuation.
Analyze Market Strength: Leverage the dashboard to quickly assess the distribution of momentum over the chosen period.
Overbought/Oversold Conditions: Utilize gradient zones to detect areas of momentum extremes and possible price exhaustion.
Momentum Index offers a refined approach to analyzing momentum dynamics, combining delta-based calculations with smoothing techniques and intuitive visuals, making it an essential tool for traders looking to anticipate market movements effectively.

Optimized ADX DI CCI Strategy### Key Features:
- Combines ADX, DI+/-, CCI, and RSI for signal generation.
- Supports customizable timeframes for indicators.
- Offers multiple exit conditions (Moving Average cross, ADX change, performance-based stop-loss).
- Tracks and displays trade statistics (e.g., win rate, capital growth, profit factor).
- Visualizes trades with labels and optional background coloring.
- Allows countertrading (opening an opposite trade after closing one).
1. **Indicator Calculation**:
- **ADX and DI+/-**: Calculated using the `ta.dmi` function with user-defined lengths for DI and ADX smoothing.
- **CCI**: Computed using the `ta.cci` function with a configurable source (default: `hlc3`) and length.
- **RSI (optional)**: Calculated using the `ta.rsi` function to filter overbought/oversold conditions.
- **Moving Averages**: Used for CCI signal smoothing and trade exits, with support for SMA, EMA, SMMA (RMA), WMA, and VWMA.
2. **Signal Generation**:
- **Buy Signal**: Triggered when DI+ > DI- (or DI+ crosses over DI-), CCI > MA (or CCI crosses over MA), and optional ADX/RSI filters are satisfied.
- **Sell Signal**: Triggered when DI+ < DI- (or DI- crosses over DI+), CCI < MA (or CCI crosses under MA), and optional ADX/RSI filters are satisfied.
3. **Trade Execution**:
- **Entry**: Long or short trades are opened using `strategy.entry` when signals are detected, provided trading is allowed (`allow_long`/`allow_short`) and equity is positive.
- **Exit**: Trades can be closed based on:
- Opposite signal (if no other exit conditions are used).
- MA cross (price crossing below/above the exit MA for long/short trades).
- ADX percentage change exceeding a threshold.
- Performance-based stop-loss (trade loss exceeding a percentage).
- **Countertrading**: If enabled, closing a trade triggers an opposite trade (e.g., closing a long opens a short).
4. **Visualization**:
- Labels are plotted at trade entries/exits (e.g., "BUY," "SELL," arrows).
- Optional background coloring highlights open trades (green for long, red for short).
- A statistics table displays real-time metrics (e.g., capital, win rates).
5. **Trade Tracking**:
- Tracks the number of long/short trades, wins, and overall performance.
- Monitors equity to prevent trading if it falls to zero.
### 2.3 Key Components
- **Indicator Calculations**: Uses `request.security` to fetch indicator data for the specified timeframe.
- **MA Function**: A custom `ma_func` handles different MA types for CCI and exit conditions.
- **Signal Logic**: Combines crossover/under checks with recent bar windows for flexibility.
- **Exit Conditions**: Multiple configurable exit strategies for risk management.
- **Statistics Table**: Updates dynamically with trade and capital metrics.
## 3. Configuration Options
The script provides extensive customization through input parameters, grouped for clarity in the TradingView settings panel. Below is a detailed breakdown of each setting and its impact.
### 3.1 Strategy Settings (Global)
- **Initial Capital**: Default `10000`. Sets the starting capital for backtesting.
- **Effect**: Determines the base equity for calculating position sizes and performance metrics.
- **Default Quantity Type**: `strategy.percent_of_equity` (50% of equity).
- **Effect**: Controls the size of each trade as a percentage of available equity.
- **Pyramiding**: Default `2`. Allows up to 2 simultaneous trades in the same direction.
- **Effect**: Enables multiple entries if conditions are met, increasing exposure.
- **Commission**: 0.2% per trade.
- **Effect**: Simulates trading fees, reducing net profit in backtesting.
- **Margin**: 100% for long and short trades.
- **Effect**: Assumes no leverage; adjust for margin trading simulations.
- **Calc on Every Tick**: `true`.
- **Effect**: Ensures real-time signal updates for precise execution.
### 3.2 Indicator Settings
- **Indicator Timeframe** (`indicator_timeframe`):
- **Options**: `""` (chart timeframe), `1`, `5`, `15`, `30`, `60`, `240`, `D`, `W`.
- **Default**: `""` (uses chart timeframe).
- **Effect**: Determines the timeframe for ADX, DI, CCI, and RSI calculations. A higher timeframe reduces noise but may delay signals.
### 3.3 ADX & DI Settings
- **DI Length** (`adx_di_len`):
- **Default**: `30`.
- **Range**: Minimum `1`.
- **Effect**: Sets the period for calculating DI+ and DI-. Longer periods smooth trends but reduce sensitivity.
- **ADX Smoothing Length** (`adx_smooth_len`):
- **Default**: `14`.
- **Range**: Minimum `1`.
- **Effect**: Smooths the ADX calculation. Longer periods produce smoother ADX values.
- **Use ADX Filter** (`use_adx_filter`):
- **Default**: `false`.
- **Effect**: If `true`, requires ADX to exceed the threshold for signals to be valid, filtering out weak trends.
- **ADX Threshold** (`adx_threshold`):
- **Default**: `25`.
- **Range**: Minimum `0`.
- **Effect**: Sets the minimum ADX value for valid signals when the filter is enabled. Higher values restrict trades to stronger trends.
### 3.4 CCI Settings
- **CCI Length** (`cci_length`):
- **Default**: `20`.
- **Range**: Minimum `1`.
- **Effect**: Sets the period for CCI calculation. Longer periods reduce noise but may lag.
- **CCI Source** (`cci_src`):
- **Default**: `hlc3` (average of high, low, close).
- **Effect**: Defines the price data for CCI. `hlc3` is standard, but users can choose other sources (e.g., `close`).
- **CCI MA Type** (`ma_type`):
- **Options**: `SMA`, `EMA`, `SMMA (RMA)`, `WMA`, `VWMA`.
- **Default**: `SMA`.
- **Effect**: Determines the moving average type for CCI signal smoothing. EMA is more responsive; VWMA weights by volume.
- **CCI MA Length** (`ma_length`):
- **Default**: `14`.
- **Range**: Minimum `1`.
- **Effect**: Sets the period for the CCI MA. Longer periods smooth the MA but may delay signals.
### 3.5 RSI Filter Settings
- **Use RSI Filter** (`use_rsi_filter`):
- **Default**: `false`.
- **Effect**: If `true`, applies RSI-based overbought/oversold filters to signals.
- **RSI Length** (`rsi_length`):
- **Default**: `14`.
- **Range**: Minimum `1`.
- **Effect**: Sets the period for RSI calculation. Longer periods reduce sensitivity.
- **RSI Lower Limit** (`rsi_lower_limit`):
- **Default**: `30`.
- **Range**: `0` to `100`.
- **Effect**: Defines the oversold threshold for buy signals. Lower values allow trades in more extreme conditions.
- **RSI Upper Limit** (`rsi_upper_limit`):
- **Default**: `70`.
- **Range**: `0` to `100`.
- **Effect**: Defines the overbought threshold for sell signals. Higher values allow trades in more extreme conditions.
### 3.6 Signal Settings
- **Cross Window** (`cross_window`):
- **Default**: `0`.
- **Range**: `0` to `5` bars.
- **Effect**: Specifies the lookback period for detecting DI+/- or CCI crosses. `0` requires crosses on the current bar; higher values allow recent crosses, increasing signal frequency.
- **Allow Long Trades** (`allow_long`):
- **Default**: `true`.
- **Effect**: Enables/disables new long trades. If `false`, only closing existing longs is allowed.
- **Allow Short Trades** (`allow_short`):
- **Default**: `true`.
- **Effect**: Enables/disables new short trades. If `false`, only closing existing shorts is allowed.
- **Require DI+/DI- Cross for Buy** (`buy_di_cross`):
- **Default**: `true`.
- **Effect**: If `true`, requires a DI+ crossover DI- for buy signals; if `false`, DI+ > DI- is sufficient.
- **Require CCI Cross for Buy** (`buy_cci_cross`):
- **Default**: `true`.
- **Effect**: If `true`, requires a CCI crossover MA for buy signals; if `false`, CCI > MA is sufficient.
- **Require DI+/DI- Cross for Sell** (`sell_di_cross`):
- **Default**: `true`.
- **Effect**: If `true`, requires a DI- crossover DI+ for sell signals; if `false`, DI+ < DI- is sufficient.
- **Require CCI Cross for Sell** (`sell_cci_cross`):
- **Default**: `true`.
- **Effect**: If `true`, requires a CCI crossunder MA for sell signals; if `false`, CCI < MA is sufficient.
- **Countertrade** (`countertrade`):
- **Default**: `true`.
- **Effect**: If `true`, closing a trade triggers an opposite trade (e.g., close long, open short) if allowed.
- **Color Background for Open Trades** (`color_background`):
- **Default**: `true`.
- **Effect**: If `true`, colors the chart background green for long trades and red for short trades.
### 3.7 Exit Settings
- **Use MA Cross for Exit** (`use_ma_exit`):
- **Default**: `true`.
- **Effect**: If `true`, closes trades when the price crosses the exit MA (below for long, above for short).
- **MA Length for Exit** (`ma_exit_length`):
- **Default**: `20`.
- **Range**: Minimum `1`.
- **Effect**: Sets the period for the exit MA. Longer periods delay exits.
- **MA Type for Exit** (`ma_exit_type`):
- **Options**: `SMA`, `EMA`, `SMMA (RMA)`, `WMA`, `VWMA`.
- **Default**: `SMA`.
- **Effect**: Determines the MA type for exit signals. EMA is more responsive; VWMA weights by volume.
- **Use ADX Change Stop-Loss** (`use_adx_stop`):
- **Default**: `false`.
- **Effect**: If `true`, closes trades when the ADX changes by a specified percentage.
- **ADX % Change for Stop-Loss** (`adx_change_percent`):
- **Default**: `5.0`.
- **Range**: Minimum `0.0`, step `0.1`.
- **Effect**: Specifies the percentage change in ADX (vs. previous bar) that triggers a stop-loss. Higher values reduce premature exits.
- **Use Performance Stop-Loss** (`use_perf_stop`):
- **Default**: `false`.
- **Effect**: If `true`, closes trades when the loss exceeds a percentage threshold.
- **Performance Stop-Loss (%)** (`perf_stop_percent`):
- **Default**: `-10.0`.
- **Range**: `-100.0` to `0.0`, step `0.1`.
- **Effect**: Specifies the loss percentage that triggers a stop-loss. More negative values allow larger losses before exiting.
## 4. Visual and Statistical Output
- **Labels**: Displayed at trade entries/exits with arrows (↑ for buy, ↓ for sell) and text ("BUY," "SELL"). A "No Equity" label appears if equity is zero.
- **Background Coloring**: Optionally colors the chart background (green for long, red for short) to indicate open trades.
- **Statistics Table**: Displayed at the top center of the chart, updated on timeframe changes or trade events. Includes:
- **Capital Metrics**: Initial capital, current capital, capital growth (%).
- **Trade Metrics**: Total trades, long/short trades, win rate, long/short win rates, profit factor.
- **Open Trade Status**: Indicates if a long, short, or no trade is open.
## 5. Alerts
- **Buy Signal Alert**: Triggered when `buy_signal` is true ("Cross Buy Signal").
- **Sell Signal Alert**: Triggered when `sell_signal` is true ("Cross Sell Signal").
- **Usage**: Users can set up TradingView alerts to receive notifications for trade signals.

Sequential Pattern Strength [QuantAlgo]🟢 Overview
The Sequential Pattern Strength indicator measures the power and sustainability of consecutive price movements by tracking unbroken sequences of up or down closes. It incorporates sequence quality assessment, price extension analysis, and automatic exhaustion detection to help traders identify when strong trends are losing momentum and approaching potential reversal or continuation points.
🟢 How It Works
The indicator's key insight lies in its sequential pattern tracking system, where pattern strength is measured by analyzing consecutive price movements and their sustainability:
if close > close
upSequence := upSequence + 1
downSequence := 0
else if close < close
downSequence := downSequence + 1
upSequence := 0
The system calculates sequence quality by measuring how "perfect" the consecutive moves are:
perfectMoves = math.max(upSequence, downSequence)
totalMoves = math.abs(bar_index - ta.valuewhen(upSequence == 1 or downSequence == 1, bar_index, 0))
sequenceQuality = totalMoves > 0 ? perfectMoves / totalMoves : 1.0
First, it tracks price extension from the sequence starting point:
priceExtension = (close - sequenceStartPrice) / sequenceStartPrice * 100
Then, pattern exhaustion is identified when sequences become overextended:
isExhausted = math.abs(currentSequence) >= maxSequence or
math.abs(priceExtension) > resetThreshold * math.abs(currentSequence)
Finally, the pattern strength combines sequence length, quality, and price movement with momentum enhancement:
patternStrength = currentSequence * sequenceQuality * (1 + math.abs(priceExtension) / 10)
enhancedSignal = patternStrength + momentum * 10
signal = ta.ema(enhancedSignal, smooth)
This creates a sequence-based momentum indicator that combines consecutive movement analysis with pattern sustainability assessment, providing traders with both directional signals and exhaustion insights for entry/exit timing.
🟢 Signal Interpretation
Positive Values (Above Zero): Sequential pattern strength indicating bullish momentum with consecutive upward price movements and sustained buying pressure = Long/Buy opportunities
Negative Values (Below Zero): Sequential pattern strength indicating bearish momentum with consecutive downward price movements and sustained selling pressure = Short/Sell opportunities
Zero Line Crosses: Pattern transitions between bullish and bearish regimes, indicating potential trend changes or momentum shifts when sequences break
Upper Threshold Zone: Area above maximum sequence threshold (2x maxSequence) indicating extremely strong bullish patterns approaching exhaustion levels
Lower Threshold Zone: Area below negative threshold (-2x maxSequence) indicating extremely strong bearish patterns approaching exhaustion levels

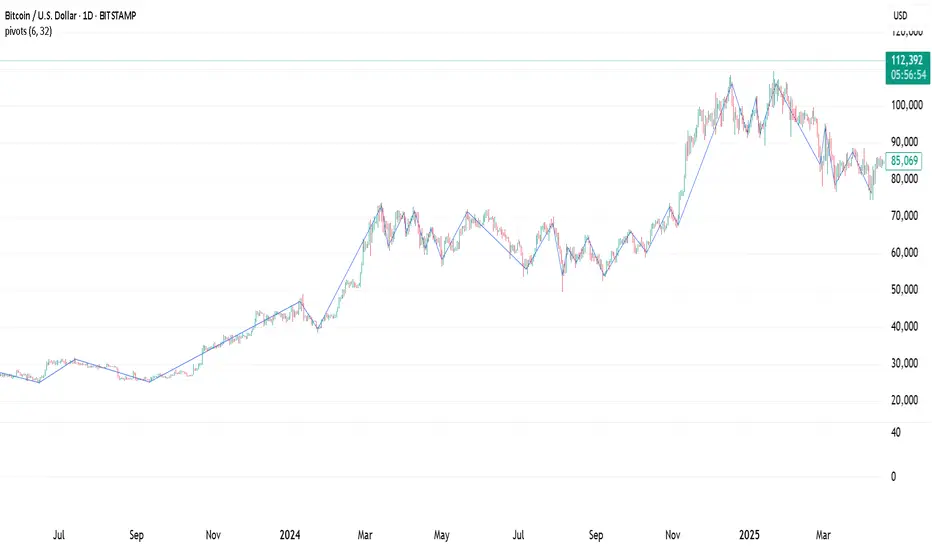
Pivot Points. High & Lows By Reversal PercentageLibrary "Pivot Points. High & Lows By Reversal Percentage" by Jal9000
This Pine Script library provides a robust function for identifying and tracking pivot points (reversal points) in price data, suitable for integration into custom trading indicators and strategies.
🛠️ Main Features:
- ✅ Identifies pivot highs and lows based on configurable price movement thresholds.
- ✅ Lightweight. No candle backtracing used. Much less computation heavy.
- ✅ Supports multiple calls (with different values) within a single script.
- ✅ Compatible with request.security for multi-timeframe analysis.
- ✅ Returns both confirmed and temporary pivots for flexible integration.
- ✅ Pinescript V5 and V6 compliant code.
Purpose:
The pivots library enables Pine Script developers to easily add pivot point detection to their scripts. It identifies significant price reversals by evaluating price movements against a minimum range threshold ( min_range_pct ) and confirming reversals based on a percentage ( reversal_pct ) of the prior trend’s magnitude. The library supports multiple simultaneous calls with different settings, making it ideal for multi-timeframe strategies.
How It Works:
The library’s f_calculatePivot function tracks price movements to detect pivot points:
Minimum Range Threshold : A potential pivot is considered if the price moves beyond the min_range_pct percentage of the current high (for a high pivot) or low (for a low pivot), ensuring sufficient movement.
Reversal Confirmation : A pivot is confirmed if the price reverses from the potential pivot by at least the reversal_pct percentage of the distance between the last confirmed pivot and the current potential pivot, measuring the retracement relative to the prior trend’s magnitude.
The function alternates between tracking highs (in an uptrend) and lows (in a downtrend), updating the trend when a pivot is confirmed.
State management uses an array of pivot_state objects, allowing independent calculations for different timeframes and min_range_pct values within the same script.
## Technical Reference
Functions:
f_calculatePivot(series float _high, series float _low, float _min_range_pct, float _reversal_pct) →
- Parameters:
_high : The high price series (e.g., high or math.max(open, close) ).
_low : The low price series (e.g., low or math.min(open, close) ).
_min_range_pct : The minimum percentage price movement to consider a potential pivot.
_reversal_pct : The percentage of the prior trend’s distance required to confirm a pivot.
- Returns:
A tuple containing:
isNewPivot : Boolean indicating if a new pivot was confirmed.
last_confirmed_pivot : The most recent confirmed pivot (type pivot ).
temp_pivot : The current temporary pivot (type pivot ).
Pivot type:
idx (series int) : Bar index of the pivot.
typ (series int) : Type of pivot ( PIVOT_HIGH or PIVOT_LOW ).
prc (series float) : Price of the pivot.
tme (series int) : Timestamp of the pivot.
Constants (internal):
TREND_LONG , TREND_SHORT : Trend direction indicators (1, -1).
PIVOT_HIGH , PIVOT_LOW : Pivot type indicators (1, -1).
✨ Example of Use:
//@version=5
indicator("Pivot Example", overlay=true)
import jal9000/pivots/1 as pivots
// Inputs
min_range_pct = input.float(20.0, 'Min Range %')
reversal_pct = input.float(30.0, 'Reversal %')
ignore_wick = input.bool(true, 'Ignore wick')
h = ignore_wick ? math.max(open, close) : high
l = ignore_wick ? math.min(open, close) : low
// Call the function with high, low, and input parameters
= pivots.f_calculatePivot(h, l, min_range_pct, reversal_pct)
// Variable to store previous confirmed pivot outside the function
var pivots.pivot prev_confirmed_pivot = na
// Draw the line if a new pivot is confirmed and previous pivot exists
if is_new_pivot
if not na(prev_confirmed_pivot) and not na(new_confirmed_pivot)
line.new(x1 = prev_confirmed_pivot.idx, y1 = prev_confirmed_pivot.prc, x2 = new_confirmed_pivot.idx, y2 = new_confirmed_pivot.prc, color = color.blue, width = 1)
prev_confirmed_pivot := new_confirmed_pivot
## Release Notes
v1
- Initial release of the pivots library with f_calculatePivot function for detecting pivot points and supporting multiple configurations and timeframes.
v2
- Code is Pinescript V6 ready. Remains identified as V5, but changing the version number is the only thing that is required to be v6.
Pivot Matrix & Multi-Timeframe Support-Resistance Analytics________________________________________
📘 Study Material for Pivot Matrix & Multi Timeframe Support-Resistance Analytics
(By aiTrendview — Educational Use Only)
________________________________________
🎯 Introduction
The Pivot Matrix & Multi Timeframe Support-Resistance Analytics indicator is designed to help traders visualize pivot points, support/resistance levels, VWAP, and volume flow analytics all in one place. Rather than giving explicit buy/sell calls, the dashboard provides reference insights so a learner may understand how different technical levels interact in real time.
This document explains its functionality step by step with formulas and usage guides.
________________________________________
1️⃣ Pivot System Logic
Pivot points are classic tools for mapping market support and resistance levels.
✦ How Calculated?
Using the Traditional Method:
• Pivot Point (PP):
PP=Highprev+Lowprev+Closeprev3PP = \frac{High_{prev} + Low_{prev} + Close_{prev}}{3}PP=3Highprev+Lowprev+Closeprev
• First Support/Resistance:
R1=2×PP−Lowprev,S1=2×PP−HighprevR1 = 2 \times PP - Low_{prev}, \quad S1 = 2 \times PP - High_{prev}R1=2×PP−Lowprev,S1=2×PP−Highprev
• Second Support/Resistance:
R2=PP+(Highprev−Lowprev),S2=PP−(Highprev−Lowprev)R2 = PP + (High_{prev} - Low_{prev}), \quad S2 = PP - (High_{prev} - Low_{prev})R2=PP+(Highprev−Lowprev),S2=PP−(Highprev−Lowprev)
• Third Levels:
R3=Highprev+2×(PP−Lowprev),S3=Lowprev−2×(Highprev−PP)R3 = High_{prev} + 2 \times (PP - Low_{prev}), \quad S3 = Low_{prev} - 2 \times (High_{prev} - PP)R3=Highprev+2×(PP−Lowprev),S3=Lowprev−2×(Highprev−PP)
• Similarly, R4/R5 and S4/S5 are extrapolated from extended range multipliers.
✦ How Used?
• Price above PP → bullish control bias.
• Price below PP → bearish control bias.
• R1–R5 levels act as resistances; S1–S5 act as supports.
Learners should watch how candles behave when approaching R/S zones to spot breakout vs. rejection conditions.
________________________________________
2️⃣ Multi Timeframe Logic
The indicator allows using daily-based pivot values (via request.security). This ensures alignment with institutional daily levels, not just intraday recalculations.
✦ Teaching Value
Understanding MTF pivots shows how markets respect higher timeframe levels (daily > intraday, weekly > daily). This helps learners grasp nested support-resistance structures.
________________________________________
3️⃣ VWAP (Volume Weighted Average Price)
Formula:
VWAPt=∑(Pricei×Volumei)∑(Volumei),Pricei=High+Low+Close3VWAP_t = \frac{\sum (Price_i \times Volume_i)}{\sum (Volume_i)}, \quad Price_i = \frac{High + Low + Close}{3}VWAPt=∑(Volumei)∑(Pricei×Volumei),Pricei=3High+Low+Close
Usage:
• VWAP is used as an institutional benchmark of fair value.
• Above VWAP = bullish flow.
• Below VWAP = bearish flow.
Learners should check whether price respects VWAP as a magnet or uses it as support/resistance.
________________________________________
4️⃣ Volume Flow Analysis
The script classifies buy volume, sell volume, and neutral volume.
• Buy Volume = if close > open.
• Sell Volume = if close < open.
• Neutral Volume = if close = open.
For daily tracking:
Buy%=DayBuyVolDayTotalVol×100,Sell%=DaySellVolDayTotalVol×100Buy\% = \frac{DayBuyVol}{DayTotalVol} \times 100, \quad Sell\% = \frac{DaySellVol}{DayTotalVol} \times 100Buy%=DayTotalVolDayBuyVol×100,Sell%=DayTotalVolDaySellVol×100
Usage for Learners:
• Dominant Buy% → accumulation/ bullish pressure.
• Dominant Sell% → distribution/ bearish pressure.
• Balanced → sideways liquidity building.
This teaches observation of order flow bias rather than relying only on price.
________________________________________
5️⃣ Dashboard Progress Bars & Colors
The script uses visual progress bars and dynamic colors for clarity. For example:
• VWAP Backgrounds: Green shades when price strongly above VWAP, Red when below.
• Volume Bars: More green blocks mean buying dominance, red means selling pressure.
This visual design turns concepts into easy-to-digest cues, useful for training.
________________________________________
6️⃣ Market Status Summary
Finally, the dashboard synthesizes all data points:
• Price vs Pivot (above or below).
• Price vs VWAP (above or below).
• Volume Pressure (buy side vs sell side).
Status Rule:
• If all three align bullish → Status box turns green.
• If mixed → Neutral grey.
• If bearish dominance → weaker tone.
Why Important?
This teaches learners that market conditions should align in confluence across indicators before confidence arises.
________________________________________
⚠️ Strict Disclaimer (aiTrendview)
The Pivot Matrix & Multi Timeframe Support-Resistance Analytics tool is developed by aiTrendview for strictly educational and research purposes.
❌ It does NOT provide buy/sell recommendations.
❌ It does NOT guarantee profits.
❌ Unauthorized use, copying, or redistribution of this code is prohibited.
⚠️ Trading Risk Warning:
• Trading involves high risk of financial loss.
• You may lose more than your capital.
• Past levels and indicators do not predict future outcomes.
This tool must be viewed as a visual education aid to practice technical analysis skills, not as trading advice.
________________________________________
✅ Now you have a step by step study guide:
• Pivot calculations explained
• VWAP with logic
• Volume breakdown
• Visual analytics
• Status confluence logic
• Disclaimer for compliance
________________________________________
⚠️ Warning:
• Trading financial markets involves substantial risk.
• You can lose more money than you invest.
• Past performance of indicators does not guarantee future results.
• This script must not be copied, resold, or republished without authorization from aiTrendview.
By using this material or the code, you agree to take full responsibility for your trading decisions and acknowledge that this is not financial advice.
________________________________________
⚠️ Disclaimer and Warning (From aiTrendview)
This Dynamic Trading Dashboard is created strictly for educational and research purposes on the TradingView platform. It does not provide financial advice, buy/sell recommendations, or guaranteed returns. Any use of this tool in live trading is completely at the user’s own risk. Markets are inherently risky; losses can exceed initial investment.
The intellectual property of this script and its methodology belongs to aiTrendview. Unauthorized reproduction, modification, or redistribution of this code is strictly prohibited. By using this study material or the script, you acknowledge personal responsibility for any trading outcomes. Always consult professional financial advisors before making investment decisions.

Advanced Volume Profile Pro Delta + POC + VAH/VAL# Advanced Volume Profile Pro - Delta + POC + VAH/VAL Analysis System
## WHAT THIS SCRIPT DOES
This script creates a comprehensive volume profile analysis system that combines traditional volume-at-price distribution with delta volume calculations, Point of Control (POC) identification, and Value Area (VAH/VAL) analysis. Unlike standard volume indicators that show only total volume over time, this script analyzes volume distribution across price levels and estimates buying vs selling pressure using multiple calculation methods to provide deeper market structure insights.
## WHY THIS COMBINATION IS ORIGINAL AND USEFUL
**The Problem Solved:** Traditional volume indicators show when volume occurs but not where price finds acceptance or rejection. Standalone volume profiles lack directional bias information, while basic delta calculations don't provide structural context. Traders need to understand both volume distribution AND directional sentiment at key price levels.
**The Solution:** This script implements an integrated approach that:
- Maps volume distribution across price levels using configurable row density
- Estimates delta (buying vs selling pressure) using three different methodologies
- Identifies Point of Control (highest volume price level) for key support/resistance
- Calculates Value Area boundaries where 70% of volume traded
- Provides real-time alerts for key level interactions and volume imbalances
**Unique Features:**
1. **Developing POC Visualization**: Real-time tracking of Point of Control migration throughout the session via blue dotted trail, revealing institutional accumulation/distribution patterns before they complete
2. **Multi-Method Delta Calculation**: Price Action-based, Bid/Ask estimation, and Cumulative methods for different market conditions
3. **Adaptive Timeframe System**: Auto-adjusts calculation parameters based on chart timeframe for optimal performance
4. **Flexible Profile Types**: N Bars Back (precise control), Days Back (calendar-based), and Session-based analysis modes
5. **Advanced Imbalance Detection**: Identifies and highlights significant buying/selling imbalances with configurable thresholds
6. **Comprehensive Alert System**: Monitors POC touches, Value Area entry/exit, and major volume imbalances
## HOW THE SCRIPT WORKS TECHNICALLY
### Core Volume Profile Methodology:
**1. Price Level Distribution:**
- Divides price range into user-defined rows (10-50 configurable)
- Calculates row height: `(Highest Price - Lowest Price) / Number of Rows`
- Distributes each bar's volume across price levels it touched proportionally
**2. Delta Volume Calculation Methods:**
**Price Action Method:**
```
Price Range = High - Low
Buy Pressure = (Close - Low) / Price Range
Sell Pressure = (High - Close) / Price Range
Buy Volume = Total Volume × Buy Pressure
Sell Volume = Total Volume × Sell Pressure
Delta = Buy Volume - Sell Volume
```
**Bid/Ask Estimation Method:**
```
Average Price = (High + Low + Close) / 3
Buy Volume = Close > Average ? Volume × 0.6 : Volume × 0.4
Sell Volume = Total Volume - Buy Volume
```
**Cumulative Method:**
```
Buy Volume = Close > Open ? Volume : Volume × 0.3
Sell Volume = Close ≤ Open ? Volume : Volume × 0.3
```
**3. Point of Control (POC) Identification:**
- Scans all price levels to find maximum volume concentration
- POC represents the price level with highest trading activity
- Acts as significant support/resistance level
- **Developing POC Feature**: Tracks POC evolution in real-time via blue dotted trail, showing how institutional interest migrates throughout the session. Upward POC migration indicates accumulation patterns, downward migration suggests distribution, providing early trend signals before price confirmation.
**4. Value Area Calculation:**
- Starts from POC and expands up/down to encompass 70% of total volume
- VAH (Value Area High): Upper boundary of value area
- VAL (Value Area Low): Lower boundary of value area
- Expansion algorithm prioritizes direction with higher volume
**5. Adaptive Range Selection:**
Based on profile type and timeframe optimization:
- **N Bars Back**: Fixed lookback period with performance optimization (20-500 bars)
- **Days Back**: Calendar-based analysis with automatic timeframe adjustment (1-365 days)
- **Session**: Current trading session or custom session times
### Performance Optimization Features:
- **Sampling Algorithm**: Reduces calculation load on large datasets while maintaining accuracy
- **Memory Management**: Clears previous drawings to prevent performance degradation
- **Safety Constraints**: Prevents excessive memory usage with configurable limits
## HOW TO USE THIS SCRIPT
### Initial Setup:
1. **Profile Configuration**: Select profile type based on trading style:
- N Bars Back: Precise control over data range
- Days Back: Intuitive calendar-based analysis
- Session: Real-time session development
2. **Row Density**: Set number of rows (30 default) - more rows = higher resolution, slower performance
3. **Delta Method**: Choose calculation method based on market type:
- Price Action: Best for trending markets
- Bid/Ask Estimate: Good for ranging markets
- Cumulative: Smoothed approach for volatile markets
4. **Visual Settings**: Configure colors, position (left/right), and display options
### Reading the Profile:
**Volume Bars:**
- **Length**: Represents relative volume at that price level
- **Color**: Green = net buying pressure, Red = net selling pressure
- **Intensity**: Darker colors indicate volume imbalances above threshold
**Key Levels:**
- **POC (Blue Line)**: Highest volume price - major support/resistance
- **VAH (Purple Dashed)**: Value Area High - upper boundary of fair value
- **VAL (Orange Dashed)**: Value Area Low - lower boundary of fair value
- **Value Area Fill**: Shaded region showing main trading range
**Developing POC Trail:**
- **Blue Dotted Lines**: Show real-time POC evolution throughout the session
- **Migration Patterns**: Upward trail indicates bullish accumulation, downward trail suggests bearish distribution
- **Early Signals**: POC movement often precedes price movement, providing advance warning of institutional activity
- **Institutional Footprints**: Reveals where smart money concentrated volume before final POC establishment
### Trading Applications:
**Support/Resistance Analysis:**
- POC acts as magnetic price level - expect reactions
- VAH/VAL provide intermediate support/resistance levels
- Profile edges show areas of low volume acceptance
**Developing POC Analysis:**
- **Upward Migration**: POC moving higher = institutional accumulation, bullish bias
- **Downward Migration**: POC moving lower = institutional distribution, bearish bias
- **Stable POC**: Tight clustering = balanced market, range-bound conditions
- **Early Trend Detection**: POC direction change often precedes price breakouts
**Entry Strategies:**
- Buy at VAL with POC as target (in uptrends)
- Sell at VAH with POC as target (in downtrends)
- Breakout plays above/below profile extremes
**Volume Imbalance Trading:**
- Strong buying imbalance (>60% threshold) suggests continued upward pressure
- Strong selling imbalance suggests continued downward pressure
- Imbalances near key levels provide high-probability setups
**Multi-Timeframe Context:**
- Use higher timeframe profiles for major levels
- Lower timeframe profiles for precise entries
- Session profiles for intraday trading structure
## SCRIPT SETTINGS EXPLANATION
### Volume Profile Settings:
- **Profile Type**: Determines data range for calculation
- N Bars Back: Exact number of bars (20-500 range)
- Days Back: Calendar days with timeframe adaptation (1-365 days)
- Session: Trading session-based (intraday focus)
- **Number of Rows**: Profile resolution (10-50 range)
- **Profile Width**: Visual width as chart percentage (10-50%)
- **Value Area %**: Volume percentage for VA calculation (50-90%, 70% standard)
- **Auto-Adjust**: Automatically optimizes for different timeframes
### Delta Volume Settings:
- **Show Delta Volume**: Enable/disable delta calculations
- **Delta Calculation Method**: Choose methodology based on market conditions
- **Highlight Imbalances**: Visual emphasis for significant volume imbalances
- **Imbalance Threshold**: Percentage for imbalance detection (50-90%)
### Session Settings:
- **Session Type**: Daily, Weekly, Monthly, or Custom periods
- **Custom Session Time**: Define specific trading hours
- **Previous Sessions**: Number of historical sessions to display
### Days Back Settings:
- **Lookback Days**: Number of calendar days to analyze (1-365)
- **Automatic Calculation**: Script automatically converts days to bars based on timeframe:
- Intraday: Accounts for 6.5 trading hours per day
- Daily: 1 bar per day
- Weekly/Monthly: Proportional adjustment
### N Bars Back Settings:
- **Lookback Bars**: Exact number of bars to analyze (20-500)
- **Precise Control**: Best for systematic analysis and backtesting
### Visual Customization:
- **Colors**: Bullish (green), Bearish (red), and level colors
- **Profile Position**: Left or Right side of chart
- **Profile Offset**: Distance from current price action
- **Labels**: Show/hide level labels and values
- **Smooth Profile Bars**: Enhanced visual appearance
### Alert Configuration:
- **POC Touch**: Alerts when price interacts with Point of Control
- **VA Entry/Exit**: Alerts for Value Area boundary interactions
- **Major Imbalance**: Alerts for significant volume imbalances
## VISUAL FEATURES
### Profile Display:
- **Horizontal Bars**: Volume distribution across price levels
- **Color Coding**: Delta-based coloring for directional bias
- **Smooth Rendering**: Optional smoothing for cleaner appearance
- **Transparency**: Configurable opacity for chart readability
### Level Lines:
- **POC**: Solid blue line with optional label
- **VAH/VAL**: Dashed colored lines with value displays
- **Extension**: Lines extend across relevant time periods
- **Value Area Fill**: Optional shaded region between VAH/VAL
### Information Table:
- **Current Values**: Real-time POC, VAH, VAL prices
- **VA Range**: Value Area width calculation
- **Positioning**: Multiple table positions available
- **Text Sizing**: Adjustable for different screen sizes
## IMPORTANT USAGE NOTES
**Realistic Expectations:**
- Volume profile analysis provides structural context, not trading signals
- Delta calculations are estimations based on price action, not actual order flow
- Past volume distribution does not guarantee future price behavior
- Combine with other analysis methods for comprehensive market view
**Best Practices:**
- Use appropriate profile types for your trading style:
- Day Trading: Session or Days Back (1-5 days)
- Swing Trading: Days Back (10-30 days) or N Bars Back
- Position Trading: Days Back (60-180 days)
- Consider market context (trending vs ranging conditions)
- Verify key levels with additional technical analysis
- Monitor profile development for changing market structure
**Performance Considerations:**
- Higher row counts increase calculation complexity
- Large lookback periods may affect chart performance
- Auto-adjust feature optimizes for most use cases
- Consider using session profiles for intraday efficiency
**Limitations:**
- Delta calculations are estimations, not actual transaction data
- Profile accuracy depends on available price/volume history
- Effectiveness varies across different instruments and market conditions
- Requires understanding of volume profile concepts for optimal use
**Data Requirements:**
- Requires volume data for accurate calculations
- Works best on liquid instruments with consistent volume
- May be less effective on very low volume or exotic instruments
This script serves as a comprehensive volume analysis tool for traders who need detailed market structure information with integrated directional bias analysis and real-time POC development tracking for informed trading decisions.

Fractal Circles#### FRACTAL CIRCLES ####
I combined 2 of my best indicators Fractal Waves (Simplified) and Circles.
Combining the Fractal and Gann levels makes for a very simple trading strategy.
Core Functionality
Gann Circle Levels: This indicator plots mathematical support and resistance levels based on Gann theory, including 360/2, 360/3, and doubly strong levels. The system automatically adjusts to any price range using an intelligent multiplier system, making it suitable for forex, stocks, crypto, or any market.
Fractal Wave Analysis: Integrates real-time trend analysis from both current and higher timeframes. Shows the current price range boundaries (high/low) and trend direction through dynamic lines and background fills, helping traders understand market structure.
Key Trading Benefits
Active Level Detection: The closest Gann level to current price is automatically highlighted in green with increased line thickness. This eliminates guesswork about which level is most likely to act as immediate support or resistance.
Real-Time Price Tracking: A customizable line follows current price with an offset to the right, projecting where price sits relative to upcoming levels. A gradient-filled box visualizes the exact distance between current price and the active Gann level.
Multi-Timeframe Context: View fractal waves from higher timeframes while maintaining current timeframe precision. This helps identify whether short-term moves align with or contradict longer-term structure.
Smart Alert System: Comprehensive alerts trigger when price crosses any Gann level, with options to monitor all levels or focus only on the active level. Reduces the need for constant chart monitoring while ensuring you never miss significant level breaks.
Practical Trading Applications
Entry Timing: Use active level highlighting to identify the most probable support/resistance for entries. The real-time distance box helps gauge risk/reward before entering positions.
Risk Management: Set stops based on Gann level breaks, particularly doubly strong levels which tend to be more significant. The gradient visualization makes it easy to see how much room price has before hitting key levels.
Trend Confirmation: Fractal waves provide immediate context about whether current price action aligns with broader market structure. Bullish/bearish background fills offer quick visual confirmation of trend direction.
Multi-Asset Analysis: The auto-scaling multiplier system works across all markets and timeframes, making it valuable for traders who monitor multiple instruments with vastly different price ranges.
Confluence Trading: Combine Gann levels with fractal wave boundaries to identify high-probability setups where multiple technical factors align.
This tool is particularly valuable for traders who appreciate mathematical precision in their technical analysis while maintaining the flexibility to adapt to real-time market conditions.
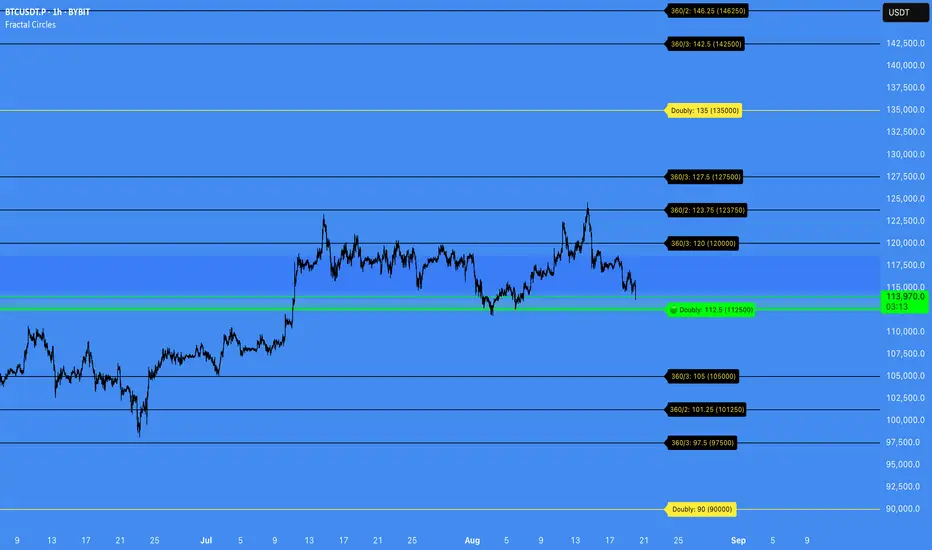
Swing Point Volume Z-ScoreSWING POINT VOLUME Z-SCORE INDICATOR
A volume analysis tool that identifies statistical volume spikes at swing points with optional higher timeframe confirmation.
This indicator uses Leviathan's method of swing detection. All credit to him for his amazing work (and any mistakes mine). I was also inspired by Trading Riot, who's Capitulation indicator gave me the idea to create this one.
WHAT IT DOES
This indicator combines three analytical approaches:
- Volume Z-score calculation to measure volume significance statistically
- Automatic swing point detection (higher highs, lower lows, etc.)
- Optional higher timeframe volume confirmation
The Z-score measures how many standard deviations current volume is from the average, helping identify when volume activity is genuinely elevated rather than relying on visual assessment.
VISUAL SYSTEM
The indicator uses a color-coded approach for quick assessment:
GREEN - Normal Activity (Z-Score 1.0-2.0)
Above-average volume levels
ORANGE - Elevated Activity (Z-Score 2.0-3.0)
High volume activity that may indicate increased interest
RED - Potential Institutional Activity (Z-Score 3.0+)
Very high volume levels that could suggest significant market participation
HIGHER TIMEFRAME CONFIRMATION
When enabled, the indicator checks volume on a higher timeframe:
- Checkmark symbol indicates HTF volume also shows elevation
- X symbol indicates HTF volume doesn't confirm
- Auto-selects appropriate higher timeframe or allows manual selection
KEY FEATURES
Statistical Approach: Uses Z-score methodology rather than arbitrary volume thresholds
Adaptive Thresholds: Can adjust based on market volatility conditions
Swing Focus: Concentrates analysis on structurally important price levels
Volume Trends: Shows whether volume is accelerating or decelerating
Success Tracking: Monitors how often HTF confirmation proves effective
DISPLAY OPTIONS
Basic Mode: Essential features with clean interface
Advanced Mode: Additional customization and analytics
Label Sizing: Four size options to fit different screen setups
Table Position: Moveable info table with transparency control
Custom Colors: Adjustable for different chart themes
PRACTICAL APPLICATIONS
May help identify:
- Volume spikes at support/resistance levels
- Potential accumulation or distribution zones
- Breakout confirmation with volume backing
- Areas where larger market participants might be active
Works on all liquid markets and timeframes, though generally more effective on 15-minute charts and higher.
USAGE NOTES
This is an analytical tool that highlights statistically significant volume events. It should be used as part of a broader analysis approach rather than as a standalone trading system.
The indicator works best when combined with:
- Price action analysis
- Support and resistance identification
- Trend analysis
- Proper risk management
Default settings are designed to work well across most instruments, but users can adjust parameters based on their specific needs and trading style.
TECHNICAL DETAILS
Built with Pine Script v5
Compatible with all TradingView subscription levels
Open source code available for review and learning
Works on stocks, forex, crypto, futures, and other liquid instruments
The statistical approach helps remove some subjectivity from volume analysis, though like all technical indicators, it should be used thoughtfully as part of a complete trading plan.
Razor Precision — Buy/SellRazor Precision Stock Action Indicator
The Razor Precision indicator is an advanced, multi-layered market analysis tool designed for traders who demand accuracy and alignment across multiple timeframes. It combines price action, moving average crossovers, volume confirmation, swing structure mapping, and indicator confluence (RSI, MACD, ATR, OBV) to generate actionable buy/sell strength ratings.
Key Features:
Price Action Detection: Identifies higher highs/lows (uptrend) and lower highs/lows (downtrend).
MA Crossover Momentum: Monitors 50/200 moving average crossovers to detect trend shifts.
Volume Surge Analysis: Confirms breakouts or pullbacks with significant volume spikes.
Swing Structure Tracking: Maps internal/external breaks to align with Smart Money Concepts.
Indicator Confluence: Aggregates signals from RSI, MACD, ATR, and OBV for precision confirmation.
Multi-Timeframe Alignment: Compares trends across 15m, 1H, 4H, and Daily charts for stacked or conflicting signals.
Strength Levels: Signals range from SELL, STRONG SELL, ULTRA STRONG SELL to BUY, STRONG BUY, ULTRA STRONG BUY.
Dynamic Table Display: Updates every 5 minutes or when overall action changes, showing per-timeframe analysis and the aggregated decision.
Ideal for swing traders, scalpers, and intraday momentum players who want high-confidence trade direction filtered through multiple technical layers.
