Psych Level ScreenerThis Script is intended for Pine Screener and is not designed as a indicator!!!
Pine Screener is something TradingView has recently added and is still only a Beta version.
Pine Screener itself is currently only available to members that are Premium and above.
What it does:
This screener will actively look for tickers that are close to Pysch level in your watchlist.
Psych level here refers to price levels that are round numbers such as 50,100,1000.
Users can specify the offset from a psych level (in %) and scanner will scan for tickers that are within the offset. For example if offset is set at 5% then it will scan for tickers that are within +/-5% of a ticker. (for $100 psych level it will scan for ticker in $95-105 range)
Once scan is completed you will be able to see:
- Current price of ticker
- Closest psych level for that ticker
- % and $ move required for it to hit that psych level
- Ticker's day range and Average range (with % of average range completed for the day)
- Ticker volume and average volume
Setting up:
www.tradingview.com
Above link will help you guide how to setup Pine screener.
Use steps below to guide you the setup for this specific screener:
1. Open Pine Screener (open new tab, select screener the "Pine")
2. At the top, click on "Choose Indicator" and select "Psych Level Screener"
3. At the top again, click "Indicator Psych Level Screener" and select settings.
4. Change setting to your needs. Hit Apply when done.
a)"% offset from Psych Level" will scan for any stocks in your watchlist which are +/- from the offset you chose for any given psych level. Default is 5. (e.g. If offset is 5%, it will scan for stocks that are between $95-$105 vs $100 psych level, $190-$210 for $200 psych level and so on)
b) ATR length is number of previous trading days you want to include in your calculation. Moving Average Type is calculation method.
c) Rvol length is number of previous trading days you want to include in your calculation.
5. On top left, click "Price within specified offset of Psych. Level" and select true. Then select "Scan" which is located at the top next to "Indicator Psych Level Screener". This will filter out all the stock that meets the condition.
6. At the end of the column on the right there is a "+" symbol. From there you can add/remove columns. 30min/1hr/4hr/1D Trend are disabled by default so if this is needed please enable them.
7. You can change the order of ticker by ascending and descending order of each column label if needed. Just click on the arrow that comes up when you move the cursor to any of the column items.
8. You can specify advanced filter settings based on the variables in the column. (e.g., set price range of stock to filter out further) To do so, click on the column variable name in interest, located above the screener table (or right below "scan") and select "manual setup".
How to read the column:
Current Price: Shows current price of the ticker when scan was done. Currently Pine Screener does NOT support pre/post-hours data so no PM and AH price.
Psych Level: Psych level the current price is near to.
% to Psych Level: Price movement in % necessary to get to the Psych level.
$ to Psych Level: Price movement in $ necessary to get to the Psych level.
DTR: Daily True Range of the stock. i.e. High - Low of the ticker on the day.
ATR: Average True Range of stock in the last x days, where x is a value selected in the setting. (See step 3 in Previous section)
DTR vs ATR: Amount of DTR a ticker has done in % with respect to ATR. (e.g., 90% means DTR is 90% of ATR)
Vol.: Volume of a ticker for the day. Currently Pine Screener does NOT support pre/post-hours data so no PM and AH volume.
Avg. Vol: Average volume of a ticker in the last x days, where x is a value selected in the setting. (See step 3 in Previous section)
Rvol: Relative volume in percentage, measured by the ratio of day's volume and average volume.
30min/1hr/4hr/1D Trend: Trend status to see if the chart is Bullish or Bearish on each of the time frame. Bullishness or Bearishness is defined by the price being over or under the 34/50 cloud on each of the time frame. Output of 1 is Bullish, -1 is Bearish. 0 means price is sitting inside the 34/50 cloud. Currently Pine Screener does NOT support pre/post-hours data so 34/50 cloud is based on regular trading hours data ONLY.
Some things user should be aware of:
- Pine Screener itself is currently only available to TradingView members with Premium Subscription and above. (I can't to anything about this as this is NOT set by me, I have no control) For more info: www.tradingview.com
- The Pine Screener itself is a Beta version and this screener can stop working anytime depending on changes made by TradingView themselves. (Again I cannot control this)
- Pine Screener can only run on Watchlists for now. (as of 03/31/2025) You will have to prepare your own watchlists. In a Watchlist no more than 1000 tickers may be added. (This is TradingView rules)
- Psych level included are currently 50 to 1500 in steps of 50. If you need a specific number please let me know. Will add accordingly.
- Unfortunately this screener does not update automatically, so please hit "scan" to get latest screener result.
- I cannot add 10min trend to the column as Pine Screener does NOT support 10min timeframe as of now. (03/31/2025)
- This code is only meant for Pine Screener. I do NOT recommend using this as an indicator.
- Currently Pine Screener does NOT support pre/post-hours data. So data such as Price, Volume and EMA values are based on market hours data ONLY! (If I'm wrong about this please correct me / let me know and will make look into and make changes to the code)
Other useful links about Pine Screener:
Quick overview of the Screener’s functionality: www.tradingview.com
what do you need to know before you start working? : www.tradingview.com
These links will go over the setting up with GIFs so is easier to understand.
-----------------------------------------------------------------------------------------------------------------
If there are other column variables that you think is worth adding please let me know! Will try add it to the screener!
If you have any questions let me know as well, will reply soon as I can!
Have a good trading day and hope it helps!
"tradingview+筹码结构"に関するスクリプトを検索

Strong Levels (with Proximity Alerts)█ OVERVIEW
The "Strong Levels (with Proximity Alerts)" indicator offers a fresh approach to identifying support and resistance levels, inspired by the RexDog Trading System (RDTS). It pinpoints significant price reversals using a unique filtering method that reduces noise and enhances reliability. Paired with customizable ATR-based proximity alerts, this indicator empowers traders to track critical price zones with precision.
█ FEATURES
- Rooted in RDTS :
Inspired by the RexDog Trading System (RDTS), it highlights major pivot points where price executed sharp turnarounds, ensuring levels carry true market weight.
- Second-Highest/Lowest Open/Close Method :
Resistance levels use the *second-highest open/close* near pivot highs, while support levels use the *second-lowest open/close* near pivot lows—skipping extreme wicks for cleaner, more dependable lines.
- ATR-Driven Proximity Alerts :
Customizable proximity thresholds, calculated using the Average True Range (ATR), warn traders when price approaches key levels—a standout feature not found in most support/resistance indicators.
- Flexible Customization :
- Magnitude : Tweak pivot sensitivity (default: 10).
- Line Colors : Set resistance (red by default), support (green), and proximity (yellow) lines.
- Line Options : Adjust line origins, transparency for breached levels, and the maximum number of levels shown.
- ATR Settings : Fine-tune proximity sensitivity with ATR length and multiplier.
█ HOW TO USE
1. Add to Chart :
Find "Strong Levels (with Proximity Alerts)" in TradingView’s indicator library and apply it.
2. Read the Lines :
- Red Lines : Resistance, derived from the second-highest open/close near pivot highs.
- Green Lines : Support, based on the second-lowest open/close near pivot lows.
- Yellow Dashed Lines : Proximity thresholds (optional), signaling when price nears a level.
3. Customize :
- Raise `Magnitude` for stronger levels or lower it for more detail.
- Adjust colors, transparency, and max levels to fit your preferences.
- Toggle proximity thresholds on/off based on your trading style.
- Enabling *Plot Line from Actual Pivot Bar* offers a cleaner chart but may mislead as lines plot into the past.
4. Set Alerts :
- Open TradingView’s alert menu (the three dots ... dropdown menu next in indicator list has an option "Add alert on ...") and choose "Approaching Level" or "Level Touched.".
- Don't forget to choose the right Trigger condition, which by default is "Only Once". I usually set it to "Once Per Bar".
- Tailor alert conditions to your needs.
█ LIMITATIONS
- Past-Based Levels :
- Relying on historical pivots, it may not always forecast future moves, especially in rapid markets.
- The 'Plot Line from Actual Pivot Bar' option while visually appealing can imply historical significance that didn’t exist at the time. Be mindful of that.
- Volatility Sensitivity :
High volatility widens ATR-based thresholds, which might trigger alerts too soon.
- Display Management :
A cap on max levels avoids clutter, but tweaking `Max Levels` may be needed across timeframes.
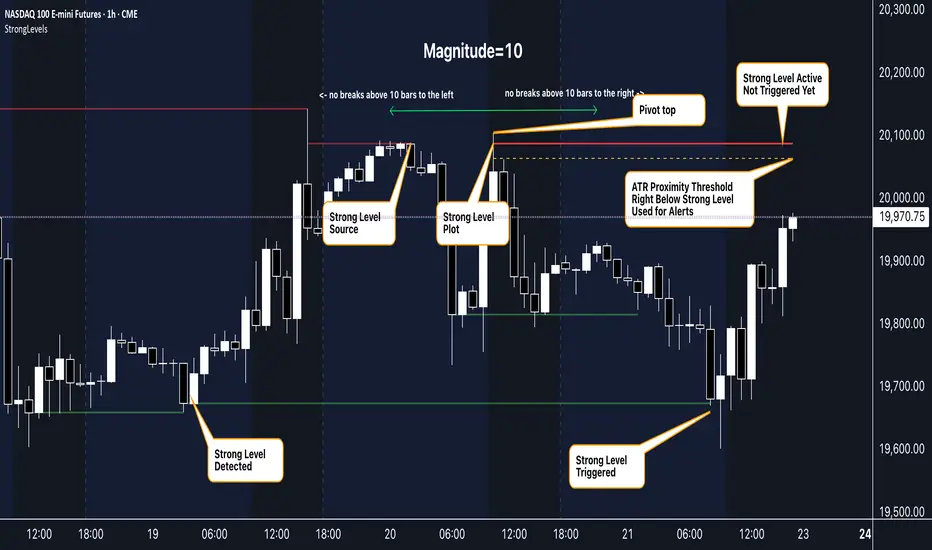
█ ACCOMPANYING CHART
The chart showcases the indicator’s unique edge:
- A pivot high and low are flagged, with nearby bars highlighted.
- Resistance is plotted at the *second-highest open/close* around the pivot high, bypassing the highest wick.
- Support is set at the *second-lowest open/close* near the pivot low, ignoring the deepest wick.
- Yellow dashed proximity lines illustrate how the indicator warns traders as price nears these zones.
- Annotations clarify how skipping extreme wicks creates cleaner, more actionable levels.
█ HOW TO USE
1. Add to Chart :
Locate "Strong Levels (with Proximity Alerts)" in TradingView’s indicator library and apply it to your chart.
2. Read the Lines :
- Red Lines**: Resistance levels, calculated from the second-highest open/close near pivot highs.
- Green Lines : Support levels, derived from the second-lowest open/close near pivot lows.
- Yellow Dashed Lines : Optional proximity thresholds, alerting you when price nears a level.
3. Customize :
- Increase `Magnitude` for stronger, less frequent levels or decrease it for more granularity.
- Modify colors, transparency, or the maximum number of levels to suit your style.
- Enable or disable proximity thresholds as needed.
4. Set Alerts :
- Access TradingView’s alert menu and select "Approaching Level" or "Level Touched."
- Adjust conditions to match your trading preferences.
5. My Personal Approach :
I prefer using this indicator on higher timeframes, like hourly or daily charts. I adjust my `Magnitude`, so it doesn't trigger too often and set my alerts to trigger "Once Per Bar". When price nears a level, I get an alert and I anticipate a reaction but avoid placing limit orders blindly. Instead, I switch to smaller timeframes and combine it with other tools for confirmation before making a trade. This saves me a lot of screen time, and allows me to focus when it matters.
Highs & Lows - Multi TimeFrame### **📌 HL-MWD (Highs & Lows - Multi Timeframe Indicator) – Community Release**
#### **🔹 Overview**
The **HL-MWD Indicator** is a **multi-timeframe support & resistance tool** that plots **historical highs and lows** from **daily, weekly, and monthly timeframes** onto an intraday chart. It helps traders **identify key levels of support and resistance** that have influenced price action over different timeframes.
This indicator is useful for **day traders, swing traders, and position traders** who rely on **multi-timeframe analysis** to spot critical price levels.
---
### **🔥 Key Features**
✅ **Plots Highs & Lows for Daily, Weekly, and Monthly Timeframes**
✅ **Customizable Lookback Periods for Each Timeframe**
✅ **Adjustable Line Colors, Styles (Solid, Dotted, Dashed), and Widths**
✅ **Extend Lines into the Future to Identify Key Price Levels**
✅ **Option to Display Price Labels for Each Level**
✅ **Gradient Option to Highlight Recent Highs & Lows (Disabled by Default)**
✅ **Compatible with Intraday, Daily, and Weekly Charts**
---
### **📈 How It Works**
- **Daily Highs & Lows:** Captures the **highest and lowest prices** within the selected lookback period (default: **14 bars**).
- **Weekly Highs & Lows:** Marks the **highest and lowest prices** within the chosen weekly lookback (default: **52 bars**).
- **Monthly Highs & Lows:** Displays the **high and low points** from the monthly timeframe (default: **36 bars**).
- **Extended Lines:** Project past highs and lows **into the future** to help identify **potential support & resistance zones**.
---
### **⚠️ TradingView Lookback Limitations**
🔹 **TradingView has a limit on how many historical bars can be accessed per timeframe**, which affects how far back the indicator can retrieve data.
🔹 **Intraday charts (e.g., 5m, 15m) have a limited number of past bars**, meaning:
- **You won’t be able to view 36 months' worth of monthly levels** on a **5-minute chart**, because TradingView doesn’t store that much data in lower timeframes.
- **If multiple timeframes (e.g., weekly + monthly) are enabled at the same time**, some historical data may **not be available on shorter timeframes**.
🔹 **Recommendation:**
- If using **monthly lookbacks (36 months+), view them on a daily or higher timeframe**.
- If using **weekly lookbacks (52 weeks+), higher intraday timeframes (e.g., 1-hour, 4-hour) are better suited**.
- **Lower timeframes (1m, 5m, 15m) may miss some levels** if TradingView's bar limit is exceeded.
---
### **⚙️ Customization Options**
| **Setting** | **Default Value** | **Description** |
|------------------|----------------|----------------|
| **Daily Lookback** | `14` | Number of bars used to calculate daily highs/lows. |
| **Weekly Lookback** | `52` | Number of bars used to calculate weekly highs/lows. |
| **Monthly Lookback** | `36` | Number of bars used to calculate monthly highs/lows. |
| **Line Colors** | Daily: `Blue` Weekly: `Green` Monthly: `Red` | Customizable colors for each timeframe. |
| **Line Style** | `Solid` | Options: Solid, Dashed, Dotted. |
| **Line Width** | `1` | Thickness of the plotted lines. |
| **Extend Line** | `1` | Controls how far the highs/lows extend into the future. |
| **Display Price Labels** | `Enabled` | Shows price labels on each level. |
---
### **🛠️ How to Use It**
- **Enable/disable different timeframes** based on your strategy.
- **Customize colors, line styles, and widths** to match your charting style.
- **Use extended lines to identify support & resistance zones.**
- **Watch price reactions at these levels** for potential entries, exits, and stop-loss placements.
---
### **🚀 Final Thoughts**
The **HL-MWD Indicator** is a **powerful multi-timeframe tool** that helps traders **visualize key support & resistance levels** from higher timeframes on an intraday chart.
⚠️ **However, TradingView’s lookback limits apply—so for longer-term levels, higher timeframes are recommended.**
📌 **Now published for the community!** Let me know if you need any last-minute tweaks! 🔥

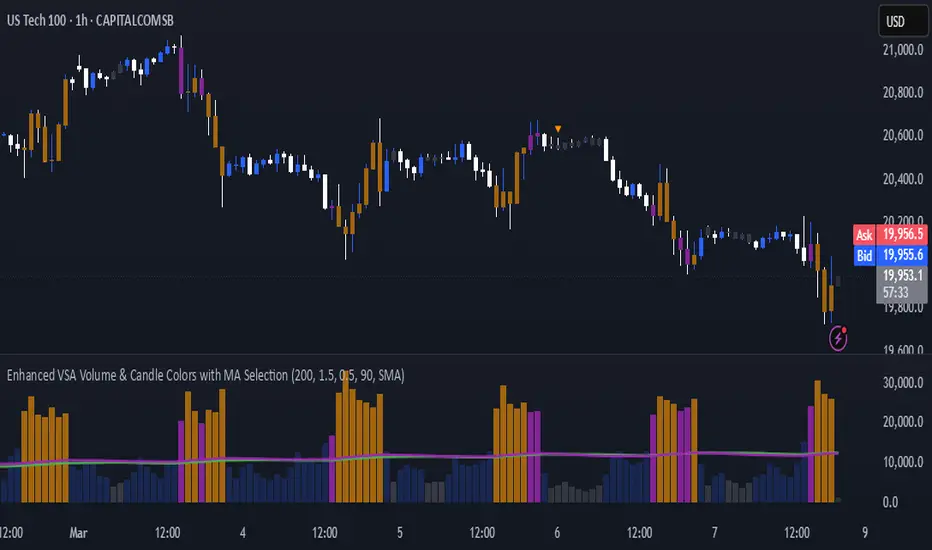
Enhanced VSA Volume & Candle Colors with MA SelectionOverview:
This script aims to enhance the visualization of volume spikes and price action by coloring volume bars and price candles dynamically based on the volume behavior. It allows traders to customize the type of volume moving average (SMA, EMA, or VWMA) used and apply various color schemes to highlight high, low, and extreme volume conditions. Additionally, alerts are generated when extreme or low-volume conditions occur.
---------------------------------------------------------------------------------------------------------------------
Key Features:
Customizable Volume Lookback Period:
The script allows users to define the period for calculating the moving average of volume (default: 200).
Volume Multiplier Settings:
High and low volume thresholds are defined using multipliers. Users can adjust these to customize how volume is categorized (default multipliers: 1.5 for high volume, 0.5 for low volume).
Percentile-Based Extreme Volume Detection:
The script calculates a percentile threshold for extreme volume (default: 90th percentile) based on the volume data, highlighting exceptionally high volume spikes.
Moving Average Selection:
Users can choose between Simple Moving Average (SMA), Exponential Moving Average (EMA), or Volume Weighted Moving Average (VWMA) to track volume trends over the selected lookback period.
Volume-Based Price Bar Coloring:
Price bars can be colored according to the volume conditions (high, low, or extreme). This feature can be toggled on or off.
Dynamic Transparency and Color Customization:
The script allows users to set custom colors for different volume conditions (high, low, neutral, extreme) and adjusts the transparency of volume bars based on the relative size of the volume.
Alerts:
Alerts can be set for when extreme volume spikes or low volume conditions are detected.
---------------------------------------------------------------------------------------------------------------------
Script Components:
Volume Histogram Plot:
Displays the volume bars with dynamic coloring based on the volume condition (high, low, or extreme). The color of the bars adjusts for clarity, with transparency based on volume levels.
Moving Average Plot:
Plots the selected volume moving average (SMA, EMA, or VWMA) to visualize the trend of volume over the chosen lookback period.
Smoothed Average Volume (EMA of Volume):
A smoothed EMA line is plotted to provide a clear representation of volume trends over time.
Price Bar Coloring:
If enabled, price bars are colored according to the current volume condition, providing immediate visual feedback to the trader.
---------------------------------------------------------------------------------------------------------------------
How It Can Be Used:
Volume Analysis for Entry/Exit Points: Traders can use the volume conditions (high, low, and extreme) to identify potential entry or exit points. High-volume bars often signal strong market activity, while low-volume bars may indicate consolidation or indecision.
Volume Confirmation for Trend Reversal: Extreme volume spikes can sometimes precede significant price movements. Traders can monitor these spikes for potential trend reversal signals.
Customizing Alerts: Alerts based on volume conditions help traders stay updated on important volume events without constantly monitoring the chart.
Color-Coded Price Action: The dynamic coloring of price bars makes it easier to identify periods of strong or weak market participation, allowing traders to make informed decisions quickly.
---------------------------------------------------------------------------------------------------------------------
Compliance with TradingView's House Rules:
No Promotion of Financial Products: The script does not promote any specific financial instruments or products, ensuring compliance with TradingView’s content guidelines.
Clear Functionality: The script provides clear, functional analysis tools without making unsupported claims about predicting market movements.
No Automated Trading: The script does not include any automated trading or order execution features, which complies with TradingView’s policy on non-automated scripts.
This breakdown ensures clarity on the script’s purpose, features, and how it might be used by traders. It's written in a way that fits TradingView's content guidelines, keeping the focus on providing valuable analytical tools rather than making promises or promoting any financial product.
FVG Radar [Mr_Rakun]The FVG Radar indicator is designed to automatically detect Fair Value Gaps (FVG) on your TradingView chart. It visually highlights bullish and bearish gaps with colored boxes and provides alerts when specific conditions are met.
How It Works
Fair Value Gap (FVG) Detection:
The script identifies gaps based on previous price action. A bullish FVG is recognized when there is a gap below a higher low candle, and a bearish FVG when there is a gap above a lower high candle.
Radar Area:
A yellow “Radar Area” box is drawn on the chart using upper and lower bands defined as a percentage above and below the current price. This area helps you visualize where the price is relative to these bands.
Alerts:
Alerts are triggered based on user-defined conditions:
When price crosses half of the gap (if the "Clear FVG When Price Reaches Half" option is enabled).
When price fully fills the gap (if the option is disabled).
The alert will only be activated after waiting a specified number of bars post-gap formation (as set by the "Wait X Bars After FVG Formation" parameter).
Input Parameters
Radar Upper Band (%):
Sets the upper threshold percentage relative to the current price for the radar area.
Radar Lower Band (%):
Sets the lower threshold percentage relative to the current price for the radar area.
Minimum FVG Size (%):
Determines the minimum size (as a percentage) for a gap to be recognized as a valid FVG.
Clear FVG When Price Reaches Half:
If enabled, the FVG will be cleared when the price reaches the midpoint of the gap. If disabled, the entire gap must be filled before it is cleared.
Wait X Bars After FVG Formation:
Specifies the number of bars to wait after an FVG is detected before triggering an alert. This delay helps to avoid premature alerts.
Bullish and Bearish FVG Colors and Opacity:
Customize the appearance of the FVG boxes for bullish (green) and bearish (red) gaps, including the opacity of these visual elements.
How to Use
Add the Indicator:
Load the FVG Radar indicator on your TradingView chart.
Customize Settings:
Adjust the input parameters based on your trading style and the market’s volatility. The radar area settings help you set your own visual reference for price deviations.
Monitor the Chart:
Watch for the colored boxes that represent FVGs. The boxes will display the size of the gap as a percentage.
Respond to Alerts:
When an alert is triggered after the specified number of bars, it indicates that the price has interacted with the gap. Use this information to guide your trading decisions.
Türkçe --------------------------------------------
FVG Radar göstergesi, TradingView grafiğinizde Fair Value Gap (FVG) – yani adil değer boşluklarını – otomatik olarak tespit etmek için tasarlanmıştır. Bu boşluklar, yükseliş ve düşüş boşluklarını farklı renkli kutularla vurgular ve belirli koşullar sağlandığında uyarılar verir.
Nasıl Çalışır
Fair Value Gap (FVG) Tespiti:
Gösterge, önceki fiyat hareketlerine dayalı olarak boşlukları belirler. Yükseliş boşluğu, düşük seviyenin yukarıdaki mumun altındaki boşlukla oluştuğu durumlarda; düşüş boşluğu ise, yüksek seviyenin aşağıdaki mumun üstünde boşluk oluştuğunda tespit edilir.
Radar Alanı:
Grafikte, mevcut fiyata göre belirlenen üst ve alt yüzde bantlarına dayalı olarak sarı renkte “Radar Alanı” kutusu çizilir. Bu alan, fiyatın bu bantlara göre nerede olduğunu görsel olarak anlamanıza yardımcı olur.
Uyarılar:
Kullanıcının belirlediği koşullara göre uyarılar verilir:
Fiyat, boşluğun yarısına ulaştığında (eğer "FVG'nin yarısına ulaştığında temizle" seçeneği etkinse).
Fiyat boşluğu tamamen doldurduğunda (seçenek devre dışı bırakıldığında).
Uyarı, boşluk oluşumundan sonra belirlenen bar sayısı kadar bekledikten sonra tetiklenir ("FVG Oluşumundan Sonra X Bar Bekle" parametresi).
Giriş Parametreleri
Radar Upper Band (%):
Mevcut fiyata göre radar alanı için üst eşik yüzdesini ayarlar.
Radar Lower Band (%):
Mevcut fiyata göre radar alanı için alt eşik yüzdesini ayarlar.
Minimum FVG Size (%):
Bir boşluğun geçerli bir FVG olarak tanınabilmesi için gereken minimum boyutu (yüzde olarak) belirler.
FVG'nin yarısına ulaştığında temizle:
Etkinse, fiyat boşluğun orta noktasına ulaştığında boşluk temizlenir. Devre dışı bırakılırsa, boşluğun tamamen doldurulması gerekir.
FVG Oluşumundan Sonra X Bar Bekle:
Bir FVG tespit edildikten sonra uyarı tetiklenmeden önce beklenmesi gereken bar sayısını belirler. Bu gecikme, erken uyarıların önüne geçmeyi amaçlar.
Yükseliş ve Düşüş FVG Renkleri ve Opaklık:
Yükseliş boşlukları (yeşil) ve düşüş boşlukları (kırmızı) için kutuların görünümünü ve opaklığını özelleştirmenize olanak tanır.
Nasıl Kullanılır
Göstergeyi Ekleyin:
FVG Radar göstergesini TradingView grafiğinize ekleyin.
Ayarları Özelleştirin:
Ticaret tarzınıza ve piyasanın oynaklığına göre giriş parametrelerini ayarlayın. Radar alanı ayarları, fiyat sapmalarını kendi görsel referansınızla tanımlamanıza yardımcı olur.
Grafiği İzleyin:
FVG’leri temsil eden renkli kutuları takip edin. Kutular, boşluğun yüzdelik büyüklüğünü gösterecektir.
Uyarılara Tepki Verin:
Belirlenen bar sayısı sonrasında tetiklenen uyarı, fiyatın boşluk ile etkileşime girdiğini gösterir. Bu bilgiyi, ticaret kararlarınızı yönlendirmek için kullanın.

Multi-indicator Signal Builder [Skyrexio]Overview
Multi-Indicator Signal Builder is a versatile, all-in-one script designed to streamline your trading workflow by combining multiple popular technical indicators under a single roof. It features a single-entry, single-exit logic, intrabar stop-loss/take-profit handling, an optional time filter, a visually accessible condition table, and a built-in statistics label. Traders can choose any combination of 12+ indicators (RSI, Ultimate Oscillator, Bollinger %B, Moving Averages, ADX, Stochastic, MACD, PSAR, MFI, CCI, Heikin Ashi, and a “TV Screener” placeholder) to form entry or exit conditions. This script aims to simplify strategy creation and analysis, making it a powerful toolkit for technical traders.
Indicators Overview
1. RSI (Relative Strength Index)
Measures recent price changes to evaluate overbought or oversold conditions on a 0–100 scale.
2. Ultimate Oscillator (UO)
Uses weighted averages of three different timeframes, aiming to confirm price momentum while avoiding false divergences.
3. Bollinger %B
Expresses price relative to Bollinger Bands, indicating whether price is near the upper band (overbought) or lower band (oversold).
4. Moving Average (MA)
Smooths price data over a specified period. The script supports both SMA and EMA to help identify trend direction and potential crossovers.
5. ADX (Average Directional Index)
Gauges the strength of a trend (0–100). Higher ADX signals stronger momentum, while lower ADX indicates a weaker trend.
6. Stochastic
Compares a closing price to a price range over a given period to identify momentum shifts and potential reversals.
7. MACD (Moving Average Convergence/Divergence)
Tracks the difference between two EMAs plus a signal line, commonly used to spot momentum flips through crossovers.
8. PSAR (Parabolic SAR)
Plots a trailing stop-and-reverse dot that moves with the trend. Often used to signal potential reversals when price crosses PSAR.
9. MFI (Money Flow Index)
Similar to RSI but incorporates volume data. A reading above 80 can suggest overbought conditions, while below 20 may indicate oversold.
10. CCI (Commodity Channel Index)
Identifies cyclical trends or overbought/oversold levels by comparing current price to an average price over a set timeframe.
11. Heikin Ashi
A type of candlestick charting that filters out market noise. The script uses a streak-based approach (multiple consecutive bullish or bearish bars) to gauge mini-trends.
12. TV Screener
A placeholder condition designed to integrate external buy/sell logic (like a TradingView “Buy” or “Sell” rating). Users can override or reference external signals if desired.
Unique Features
1. Multi-Indicator Entry and Exit
You can selectively enable any subset of 12+ classic indicators, each with customizable parameters and conditions. A position opens only if all enabled entry conditions are met, and it closes only when all enabled exit conditions are satisfied, helping reduce false triggers.
2. Single-Entry / Single-Exit with Intrabar SL/TP
The script supports a single position at a time. Once a position is open, it monitors intrabar to see if the price hits your stop-loss or take-profit levels before the bar closes, making results more realistic for fast-moving markets.
3. Time Window Filter
Users may specify a start/end date range during which trades are allowed, making it convenient to focus on specific market cycles for backtesting or live trading.
4. Condition Table and Statistics
A table at the bottom of the chart lists all active entry/exit indicators. Upon each closed trade, an integrated statistics label displays net profit, total trades, win/loss count, average and median PnL, etc.
5. Seamless Alerts and Automation
Configure alerts in TradingView using “Any alert() function call.”
The script sends JSON alert messages you can route to your own webhook.
The indicator can be integrated with Skyrexio alert bots to automate execution on major cryptocurrency exchanges
6. Optional MA/PSAR Plots
For added visual clarity, optionally plot the chosen moving averages or PSAR on the chart to confirm signals without stacking multiple indicators.
Methodology
1. Multi-Indicator Entry Logic
When multiple entry indicators are enabled (e.g., RSI + Stochastic + MACD), the script requires all signals to align before generating an entry. Each indicator can be set for crossovers, crossunders, thresholds (above/below), etc. This “AND” logic aims to filter out low-confidence triggers.
2. Single-Entry Intrabar SL/TP
One Position At a Time: Once an entry signal triggers, a trade opens at the bar’s close.
Intrabar Checks: Stop-loss and take-profit levels (if enabled) are monitored on every tick. If either is reached, the position closes immediately, without waiting for the bar to end.
3. Exit Logic
All Conditions Must Agree: If the trade is still open (SL/TP not triggered), then all enabled exit indicators must confirm a closure before the script exits on the bar’s close.
4. Time Filter
Optional Trading Window: You can activate a date/time range to constrain entries and exits strictly to that interval.
Justification of Methodology
Indicator Confluence: Combining multiple tools (RSI, MACD, etc.) can reduce noise and false signals.
Intrabar SL/TP: Capturing real-time spikes or dips provides a more precise reflection of typical live trading scenarios.
Single-Entry Model: Straightforward for both manual and automated tracking (especially important in bridging to bots).
Custom Date Range: Helps refine backtesting for specific market conditions or to avoid known irregular data periods.
How to Use
1. Add the Script to Your Chart
In TradingView, open Indicators , search for “Multi-indicator Signal Builder”.
Click to add it to your chart.
2. Configure Inputs
Time Filter: Set a start and end date for trades.
Alerts Messages: Input any JSON or text payload needed by your external service or bot.
Entry Conditions: Enable and configure any indicators (e.g., RSI, MACD) for a confluence-based entry.
Close Conditions: Enable exit indicators, along with optional SL (negative %) and TP (positive %) levels.
3. Set Up Alerts
In TradingView, select “Create Alert” → Condition = “Any alert() function call” → choose this script.
Entry Alert: Triggers on the script’s entry signal.
Close Alert: Triggers on the script’s close signal (or if SL/TP is hit).
Skyrexio Alert Bots: You can route these alerts via webhook to Skyrexio alert bots to automate order execution on major crypto exchanges (or any other supported broker).
4. Visual Reference
A condition table at the bottom summarizes active signals.
Statistics Label updates automatically as trades are closed, showing PnL stats and distribution metrics.
Backtesting Guidelines
Symbol/Timeframe: Works on multiple assets and timeframes; always do thorough testing.
Realistic Costs: Adjust commissions and potential slippage to match typical exchange conditions.
Risk Management: If using the built-in stop-loss/take-profit, set percentages that reflect your personal risk tolerance.
Longer Test Horizons: Verify performance across diverse market cycles to gauge reliability.
Example of statistic calculation
Test Period: 2023-01-01 to 2025-12-31
Initial Capital: $1,000
Commission: 0.1%, Slippage ~5 ticks
Trade Count: 468 (varies by strategy conditions)
Win rate: 76% (varies by strategy conditions)
Net Profit: +96.17% (varies by strategy conditions)
Disclaimer
This indicator is provided strictly for informational and educational purposes .
It does not constitute financial or trading advice.
Past performance never guarantees future results.
Always test thoroughly in demo environments before using real capital.
Enjoy exploring the Multi-Indicator Signal Builder! Experiment with different indicator combinations and adjust parameters to align with your trading preferences, whether you trade manually or link your alerts to external automation services. Happy trading and stay safe!

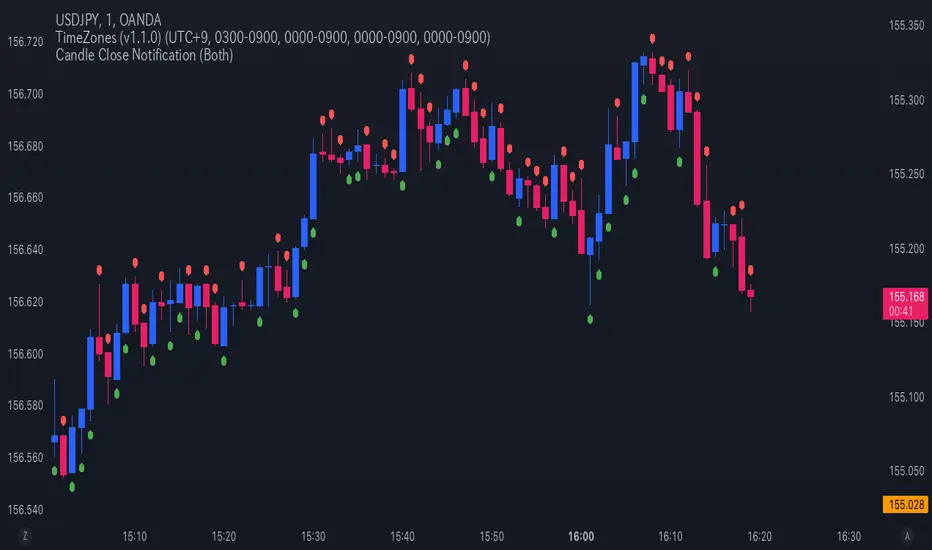
Candle Close NotificationCandle Close Notification Indicator - Specification
1. 概要 (Overview)
本インジケーターは、TradingView 上でローソク足が確定した際に、そのローソク足が陰線(Bearish)または陽線(Bullish)であった場合に通知を送信するものです。
また、該当するローソク足の上または下にマークを表示し、視覚的にも識別しやすくなっています。
This indicator for TradingView sends notifications when a candlestick closes as either a bearish (red) or bullish (green) candle. It also marks the corresponding candles on the chart for visual reference.
2. 機能 (Features)
2.1 通知機能 (Notification Function)
ローソク足の確定時に、以下の条件に基づき アラート(通知) を送信します。
「Both」(両方): 陰線・陽線のどちらでも通知
「Bearish」(陰線のみ): 陰線の時のみ通知
「Bullish」(陽線のみ): 陽線の時のみ通知
When a candlestick closes, an alert notification is sent based on the selected option:
"Both" (Default): Notifies for both bearish and bullish candles.
"Bearish": Notifies only bearish candles.
"Bullish": Notifies only bullish candles.
2.2 チャートマーク表示機能 (Chart Marking Function)
ローソク足が確定した際、以下のルールでマークを表示します。
陰線(Bearish) の場合、赤色の「下向きマーク」を表示(ローソク足の上)
陽線(Bullish) の場合、緑色の「上向きマーク」を表示(ローソク足の下)
When a candlestick closes, a marker appears according to the following rules:
Bearish candle → A red downward marker appears above the candle.
Bullish candle → A green upward marker appears below the candle.
3. 通知オプションの設定 (Setting Notification Options)
スクリプト内の notify_option の値を変更することで、通知の種類を設定できます。
Both(デフォルト) → 陰線・陽線両方通知
Bearish → 陰線のみ通知
Bullish → 陽線のみ通知
Modify the notify_option value in the script to customize notifications:
Both (Default) → Notifies for both bearish and bullish candles.
Bearish → Notifies only bearish candles.
Bullish → Notifies only bullish candles.
TradingView の アラート機能 を有効にすることで、通知を受け取ることができます。
Enable TradingView’s Alert function to receive notifications.
[GrandAlgo] Candlestick ThemesTransform your TradingView charts with Candlestick Themes, an indicator that customizes candlestick colors using a variety of stunning themes. Whether you’re seeking improved clarity, enhanced personalization, or a fresh visual appeal, this indicator has something for everyone.
Key Features
This indicator offers a wide selection of pre-defined themes:
TradingView Default: The classic, familiar look of TradingView charts.
GrandAlgo: Our exclusive brand theme, blending vibrancy and professionalism for an exceptional charting experience.
MetaTrader-Inspired Themes: Green on Black, Yellow on Black, and Black on White, designed to replicate the iconic MetaTrader aesthetics.
Green Black: A calming and balanced theme for focused trading.
Darkblue Red: A bold and impactful combination with rich tones.
Darkblue Black: A subtle, sleek palette perfect for minimalists.
Lightblue Red: A mix of warm and cool tones for balanced visuals.
Lightblue Red (Gradient): Adds smooth transitions for a modern feel.
Lightblue Black: Crisp and clean for improved readability.
Crimson to Calm: A gradient theme transitioning from bold to tranquil tones.
Robinhood: Inspired by the clean and vibrant look of the popular trading platform.
Warm & Cool Harmony: A seamless blend of warm and cool tones.
Valentine: Passionate reds and pinks for a romantic visual.
Christmas: Festive greens and reds to match the holiday spirit.
Grapes: A playful mix of purples and greens.
Desert: Warm, sandy hues inspired by desert landscapes.
Real Madrid: A sporty theme with iconic colors for fans.
This indicator ensures seamless integration with TradingView charts, offering personalized trading experience. Whether you're a seasoned trader or just starting, these themes will make your charts both functional and visually appealing.

ICT Digital open Daily DividersDescription for "ICT Digital Open Daily Dividers" TradingView Indicator
Overview
The "ICT Digital Open Daily Dividers" is a versatile and comprehensive TradingView Pine Script indicator designed for traders who utilize Institutional Order Flow methodologies, particularly in ICT (Inner Circle Trader) trading. This indicator provides a structured visual framework to assist traders in identifying key daily market sessions, critical opening prices, and distinguishing different trading days, especially focusing on the Sunday open, which is a crucial element in the ICT trading strategy.
Core Functionalities
Daily Vertical Lines: The script plots vertical lines at the start of each trading day, which helps to demarcate daily trading sessions. These lines are customizable, allowing traders to choose their color, style (solid, dashed, or dotted), and width. This feature helps in visually segmenting each trading day, making it easier to analyze daily price action patterns.
Sunday Open Differentiation: Unlike many other daily divider indicators, this script uniquely provides the option to highlight the Sunday open at 6 PM EST with distinct lines. This feature is especially valuable for ICT traders who consider the Sunday open as a critical reference point for weekly analysis. The color, style, and width of the Sunday open lines can be set separately, providing a clear visual distinction from regular weekday separators.
12 AM Open Toggle: For markets that are influenced by midnight opens, the indicator includes an option to shift the daily open line to 12 AM instead of the default 6 PM. This flexibility allows traders to adapt the indicator to different market dynamics or trading strategies.
Timezone Customization: The indicator allows traders to set the timezone for the open lines, ensuring that the vertical lines align accurately with the trader’s specific market hours, whether they follow New York time or any other timezone.
Session Time Filters: The script can hide or show specific trading session markers, such as the New York session open and close, which are pivotal for ICT traders. These markers help in focusing on the most active and liquid trading times.
Customizable Style Settings: The script includes comprehensive styling options for the plotted lines and session markers, allowing traders to personalize their charts to suit their visual preferences and improve clarity.
Day of the Week Labels: The indicator can plot labels for each day of the week, providing a quick reference to the day’s price action. This feature is particularly useful in reviewing weekly trading patterns and performance.
Use in ICT Trading
In ICT trading, the concept of the "open" is fundamental. The "ICT Digital Open Daily Dividers" indicator serves multiple purposes:
Market Structure Identification: By clearly marking daily opens, traders can easily identify market structure changes such as breakouts, retracements, or consolidations around these key levels.
Reference Points: The Sunday open is often a key level in ICT analysis, serving as a benchmark for assessing market direction for the upcoming week. This indicator’s ability to plot Sunday opens separately makes it uniquely suited for ICT strategies.
Time-based Analysis: ICT methodology often involves analyzing the market at specific times of the day. This indicator supports such analysis by marking significant session opens and closes.
Uniqueness and Advantages
The "ICT Digital Open Daily Dividers" stands out from other similar indicators due to its specialized features:
Sunday Open Highlighting: Few indicators offer the capability to specifically mark the Sunday open with distinct styling options.
Flexibility in Time Adjustments: With options to adjust the open time to either 6 PM or 12 AM, this indicator caters to a broader range of trading strategies and market conditions.
Enhanced Visualization: The wide range of customization options ensures that traders can tailor the indicator to their specific needs, enhancing the usability and visual clarity of their charts.
Compliance with TradingView's Pine Script Community Guidelines
The description adheres to TradingView's guidelines by being comprehensive, clear, and informative. It highlights the utility of the script, its unique features, and its application in trading strategies without making exaggerated claims about performance or profitability. The detailed customization options and unique functionalities are emphasized to differentiate this script from other standard daily divider indicators.

US/JP Factor/Sector Performance RankingThis indicator is designed to help you easily understand the strengths and weaknesses of different factors and sectors in the U.S. stock market. It looks at various ETFs, ranks their performance over a specific period (20 days by default), and shows the results visually.
= How the Ranking Works
The best-performing rank is shown as -1, with lower ranks as -2, -3, -4, and so on. This setup makes it easy to see rank order in TradingView’s default view.
If you turn on the “Inverse” setting, ranks will be shown as positive numbers in order (e.g., 1, 2, 3…). In this case, it’s recommended to reverse the TradingView scale for better understanding.
= How the Indicator Reacts to Market Conditions
- Normal Market Conditions
Certain factors or sectors often stay at the top rank. For example, during the rallies at the start of 2024 and in May, the Momentum factor performed well, showing a risk-on market environment.
On the other hand, sectors at the bottom rank also tend to stay in specific positions.
- Market Tops
Capital flows within sectors slow down, and top ranks begin to change frequently. This may suggest a market turning point.
- Bear Markets or High Volatility
Rankings become more chaotic in these conditions. These large changes can help you understand market sentiment and the level of volatility.
= Way of using the Indicator
You can use this indicator in the following ways:
- To apply sector rotation strategies.
- To build positions after volatile markets calm down.
- To take long positions on strong elements (higher ranks) and short positions on weaker ones (lower ranks).
= Things to Keep in Mind
It’s a Lagging Indicator
This indicator calculates rankings using the past 20 days of data. It doesn’t provide signals for the future but is a tool for analyzing past performance. To predict the market, you should combine this with other tools or leading indicators.
However, since trends in capital flows often continue, this indicator can help you spot those trends.
= Customization
This indicator is set up for U.S. and Japanese stock markets. However, you can customize it for other markets by changing the ticker and label description in the script.
==Japanese Description==
このインジケーターは、米国株市場におけるファクターやセクターの強弱を直感的に把握するために設計されています。
各ETFを参照し、特定期間(デフォルトでは20日間)のパフォーマンスを順位付けし、それを視覚的に表示します。
= インジケーターの特徴
- ランク付けの仕様
ランク1位は-1で表され、順位が下がるごとに-2、-3、-4…と減少します。この仕様により、TradingViewの標準状態でランクの高低を直感的に把握できるようにしました。
さらに、Inverse設定をONにすると、1位から順に正の値(例: 1, 2, 3…)で表示されるようになります。この場合、TradingViewのスケールを反転させることを推奨します。
= 市況とインジケーターの動き
- 平常時の市況
特定のファクターやセクターがランク1位を維持することが多いです。
例えば、2024年の年初や同年5月の上昇相場では、Momentumファクターが効果を発揮し、リスクオンの市場環境であったことを示しています。
一方、最下位に位置するセクターも特定の順位を維持する傾向があります。
- 天井圏の市況
セクター内の資金流入や流出が停滞し、上位ランクの変動が起こり始めます。これが市場の転換点を示唆する場合があります。
- 下落相場や荒れた市況
ランク順位が大きく乱れることが特徴です。この変動の大きさは、市況の雰囲気やボラティリティの高さを感じ取る材料として活用できます。
= 活用方法
このインジケーターは以下のような投資戦略に役立てることができます:
- セクターローテーションを活用した投資戦略
- 荒れた相場が落ち着いたタイミングでのポジション構築
- 強い要素(ランク上位)のロング、弱い要素(ランク下位)のショート
= 注意点
- 遅行指標であること
本インジケーターは、過去20日間のデータを基にランクを算出します。そのため、先行的なシグナルを提供するものではなく、過去のパフォーマンスに基づいた分析ツールです。市場を先回りするには、別途先行指標や分析を組み合わせる必要があります。
ただし、特定のファクターやセクターへの資金流入・流出が継続する傾向があるため、これを見極める手助けにはなります。
= カスタマイズについて
このインジケーターは米国・日本株市場に特化しています。ただし、他国のファクターやセクターのETFや指数が利用可能であれば、スクリプト内のtickerとlabel descriptionを変更することでカスタマイズが可能です。

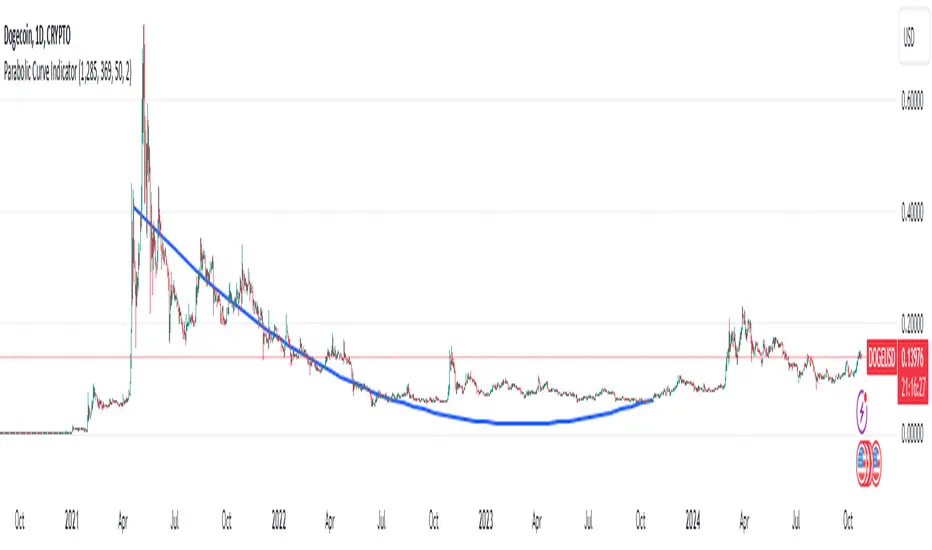
Parabolic (Brachistochrone) Curve IndicatorOverview of the Script
The script is designed to plot an approximation of the Brachistochrone curve between two points on a TradingView chart. The Brachistochrone curve represents the path of fastest descent under gravity between two points not aligned vertically. In physics, this curve is a segment of a cycloid.
Understanding the Brachistochrone Curve
Definition: The Brachistochrone curve is the curve along which a particle will descend from one point to another in the least time under gravity, without friction.
Mathematical Representation: The solution to the Brachistochrone problem is a cycloid, which is the curve traced by a point on the rim of a circular wheel as it rolls along a straight line.
Relevance to Trading: While the Brachistochrone curve originates from physics, plotting it on a price-time chart can offer a unique visual representation of the fastest possible movement between two price levels.
How the Script Works
Inputs
Start and End Bars:
startBar: The number of bars back from the current bar to define the starting point.
endBar: The number of bars back from the current bar to define the ending point.
Curve Customization:
numPoints: The number of points used to plot the curve (affects smoothness).
curveColor: The color of the curve.
curveWidth: The width of the curve lines.
Labels:
showTimeLabels: A toggle to display labels along the curve for reference.
Calculations
Determine Start and End Points:
The script calculates the coordinates (x_start, y_start, x_end, y_end) of the start and end points based on the specified bar offsets.
x_start and x_end correspond to bar indices (time).
y_start and y_end correspond to price levels.
Calculate Differences and Parameters:
Horizontal and Vertical Differences:
delta_x = x_end - x_start
delta_y = y_end - y_start
Ensure Descending Motion:
If the end point is higher than the start point (i.e., delta_y is positive), the script swaps the start and end points to ensure the curve represents a descent.
Cycloid Parameters:
Angle (theta): Calculated using theta = atan(delta_y / delta_x), representing the inclination of the curve.
Radius (R): The radius of the generating circle for the cycloid, calculated with R = delta_x / (π * cos(theta)).
Generate Points Along the Cycloid:
Parameter t: Varies from 0 to t_end, where t_end is set to π to represent half a cycloid (a common segment for the Brachistochrone).
Cycloid Equations:
Horizontal Component (x_t): x_t = R * (t - sin(t))
Vertical Component (y_t): y_t = R * (1 - cos(t))
Adjust Coordinates:
The script adjusts the cycloid coordinates to align with the chart's axes:
x_plot = x_start + x_t * cos(theta)
y_plot = y_start + y_t * sin(theta)
The x_plot values are converted to integer bar indices to match the chart's x-axis.
Plotting the Curve
Drawing Lines:
The script connects consecutive points using lines to form the curve.
It uses the line.new function, specifying the start and end coordinates of each line segment.
Adding Labels (Optional):
If showTimeLabels is enabled, the script places labels at intervals along the curve to indicate progress or parameter values.
Adjustments for Accurate Visualization
Handling Ascending Paths:
To adhere to the physical definition of the Brachistochrone curve, the script ensures that the ending point is below the starting point in terms of price.
If not, it swaps the points to represent a descending path.
Parameter Constraints:
The script ensures that calculations involving trigonometric functions remain within valid ranges to prevent mathematical errors (e.g., division by zero or invalid arguments for acos).
Scaling Considerations:
Adjustments are made to account for the differences in scaling between time (x-axis) and price (y-axis) on the chart.
The script maps spatial coordinates to the chart's axes appropriately.
Limitations and Considerations
Theoretical Nature:
The Brachistochrone curve is a theoretical concept from physics and doesn't necessarily predict actual price movements in financial markets.
Chart Scaling:
The visual appearance of the curve may be affected by the chart's scaling settings. Users may need to adjust the chart's zoom or scale to view the curve properly.
Data Range:
The start and end bars must be within the range of available data on the chart. If the specified bars are out of range, the script may not plot the curve.
Computational Limits:
TradingView imposes limits on the number of drawing objects (lines, labels) that can be displayed. The script accounts for this, but extremely high numPoints values may lead to performance issues.
Usage Instructions
Adding the Indicator:
The script is added to the chart as a custom indicator in TradingView's Pine Script Editor.
Configuring Inputs:
Start and End Bars: Users specify the bar offsets for the start and end points. It's important that the end point is below the start point in price to represent a descent.
Curve Customization: Users can adjust the number of points for smoothness and customize the curve's color and width.
Labels: Users can choose to display or hide labels along the curve.
Observing the Curve:
After configuring the inputs, the curve will be plotted between the two specified points.
Users can observe the curve to understand the theoretical fastest descent between the two price levels.
Potential Applications
Educational Tool:
The script serves as a visual aid to understand the properties of the Brachistochrone curve and cycloid.
Analytical Insights:
While not predictive, the curve might inspire new ways of thinking about price movements, momentum, or acceleration in markets.
Visualization:
It provides a unique way to visualize the relationship between time and price over a specific interval.
Conclusion
The script effectively adapts the mathematical concept of the Brachistochrone curve to a financial chart by carefully mapping spatial coordinates to time and price axes. By accounting for the unique characteristics of TradingView charts and implementing necessary mathematical adjustments, the script plots the curve between two user-defined points, offering a novel and educational visualization.
[3Commas] Signal BuilderSignal Builder is a tool designed to help traders create custom buy and sell signals by combining multiple technical indicators. Its flexibility allows traders to set conditions based on their specific strategy, whether they’re into scalping, swing trading, or long-term investing. Additionally, its integration with 3Commas bots makes it a powerful choice for those looking to automate their trades, though it’s also ideal for traders who prefer receiving alerts and making manual decisions.
🔵 How does Signal Builder work?
Signal Builder allows users to define custom conditions using popular technical indicators, which, when met, generate clear buy or sell signals. These signals can be used to trigger TradingView alerts, ensuring that you never miss a market opportunity. Additionally, all conditions are evaluated using "AND" logic, meaning signals are only activated when all user-defined conditions are met. This increases precision and helps avoid false signals.
🔵 Available indicators and recommended settings:
Signal Builder provides access to a wide range of technical indicators, each customizable to popular settings that maximize effectiveness:
RSI (Relative Strength Index): An oscillator that measures the relative strength of price over a specific period. Traders typically configure it with 14 periods, using levels of 30 (oversold) and 70 (overbought) to identify potential reversals.
MACD (Moving Average Convergence Divergence): A key indicator tracking the crossover between two moving averages. Common settings include 12 and 26 periods for the moving averages, with a 9-period signal line to detect trend changes.
Ultimate Oscillator: Combines three different time frames to offer a comprehensive view of buying and selling pressure. Popular settings are 7, 14, and 28 periods.
Bollinger Bands %B: Provides insight into where the price is relative to its upper and lower bands. Standard settings include a 20-period moving average and a standard deviation of 2.
ADX (Average Directional Index): Measures the strength of a trend. Values above 25 typically indicate a strong trend, while values below suggest weak or sideways movement.
Stochastic Oscillator: A momentum indicator comparing the closing price to its range over a defined period. Popular configurations include 14 periods for %K and 3 for %D smoothing.
Parabolic SAR: Ideal for identifying trend reversals and entry/exit points. Commonly configured with a 0.02 step and a 0.2 maximum.
Money Flow Index (MFI): Similar to RSI but incorporates volume into the calculation. Standard settings use 14 periods, with levels of 20 and 80 as oversold and overbought thresholds.
Commodity Channel Index (CCI): Measures the deviation of price from its average. Traders often use a 20-period setting with levels of +100 and -100 to identify extreme overbought or oversold conditions.
Heikin Ashi Candles: These candles smooth out price fluctuations to show clearer trends. Commonly used in trend-following strategies to filter market noise.
🔵 How to use Signal Builder:
Configure indicators: Select the indicators that best fit your strategy and adjust their settings as needed. You can combine multiple indicators to define precise entry and exit conditions.
Define custom signals: Create buy or sell conditions that trigger when your selected indicators meet the criteria you’ve set. For example, configure a buy signal when RSI crosses above 30 and MACD confirms with a bullish crossover.
TradingView alerts: Set up alerts in TradingView to receive real-time notifications when the conditions you’ve defined are met, allowing you to react quickly to market opportunities without constantly monitoring charts.
Monitor with the panel: Signal Builder includes a visual panel that shows active conditions for each indicator in real time, helping you keep track of signals without manually checking each indicator.
🔵 3Commas integration:
In addition to being a valuable tool for any trader, Signal Builder is optimized to work seamlessly with 3Commas bots through Webhooks. This allows you to automate your trades based on the signals you’ve configured, ensuring that no opportunity is missed when your defined conditions are met. If you prefer automation, Signal Builder can send buy or sell signals to your 3Commas bots, enhancing your trading process and helping you manage multiple trades more efficiently.
🔵 Example of use:
Imagine you trade in volatile markets and want to trigger a sell signal when:
Stochastic Oscillator indicates overbought conditions with the %K value crossing below 80.
Bollinger Bands %B shows the price has surpassed the upper band, suggesting a potential reversal.
ADX is below 20, indicating that the trend is weak and could be about to change.
With Signal Builder , you can configure these conditions to trigger a sell signal only when all are met simultaneously. Then, you can set up a TradingView alert to notify you as soon as the signal is activated, giving you the opportunity to react quickly and adjust your strategy accordingly.
👨🏻💻💭 If this tool helps your trading strategy, don’t forget to give it a boost! Feel free to share in the comments how you're using it or if you have any questions.
_________________________________________________________________
The information and publications within the 3Commas TradingView account are not meant to be and do not constitute financial, investment, trading, or other types of advice or recommendations supplied or endorsed by 3Commas and any of the parties acting on behalf of 3Commas, including its employees, contractors, ambassadors, etc.

3-Bar (Outside Bar) Scanner with Table Display# 3-Bar (Outside Bar) Scanner with Table Display
## Overview
The **3-Bar (Outside Bar) Scanner with Table Display** is a custom TradingView indicator designed for traders who utilize **The Strat** methodology. This indicator scans for **3-bar (Outside Bar)** patterns across multiple symbols and displays the results in a convenient table format directly on your chart.
## Purpose
- **Efficient Multi-Symbol Scanning**: Monitor up to four symbols simultaneously for 3-bar patterns without the need to switch between charts.
- **Real-Time Updates**: The table dynamically updates with new price data, providing immediate insights into potential trading opportunities.
- **Visual Clarity**: Displays whether a 3-bar is bullish ("3 Up") or bearish ("3 Down"), helping you quickly interpret market sentiment.
## How It Works
- **Data Retrieval**: The indicator uses `request.security()` to fetch high, low, open, and close prices for the specified symbols and timeframe.
- **3-Bar Detection**:
- **Outside Bar Criteria**: Checks if the current candle's high is higher than the previous candle's high and the current low is lower than the previous low.
- **Direction Determination**:
- **"3 Up"**: If the candle closes higher than it opens (bullish candle).
- **"3 Down"**: If the candle closes lower than it opens (bearish candle).
- **Table Display**:
- The table shows the **Symbol**, **Timeframe**, and **State** ("3 Up", "3 Down", or blank if no pattern detected).
- Customizable colors and positioning to fit your chart's aesthetics.
## Best Use Cases
- **Rapid Market Analysis**: Ideal for traders needing a quick overview of multiple assets for potential 3-bar setups.
- **Strategic Decision-Making**: Helps identify key reversal or continuation patterns in alignment with **The Strat** principles.
- **Scalable Monitoring**: By utilizing TradingView's multi-chart layouts, you can expand monitoring beyond four symbols.
## Instructions for Use
### Adding the Indicator to Your Chart
1. **Copy the Code**: Use the provided Pine Script code for the indicator.
2. **Create a New Indicator**:
- In TradingView, click on **Pine Editor** at the bottom of the platform.
- Paste the code into the editor.
3. **Save and Add to Chart**:
- Click **Save** and give your indicator a name.
- Click **Add to Chart** to apply it.
### Customizing the Inputs
- **Symbols**:
- **Symbol 1**: Leave blank to use the current chart's symbol or enter a specific symbol (e.g., `AAPL`).
- **Symbol 2 to Symbol 4**: Enter additional symbols or leave them blank.
- **Timeframe**: Select your desired timeframe (e.g., `D` for Daily, `60` for 60-minute).
- **Table Colors**:
- Customize header and data colors for better visibility against your chart background.
### Interpreting the Table
- **Symbol**: Displays the symbol without the exchange prefix for clarity.
- **Timeframe**: Shows the timeframe applied to the analysis.
- **State**:
- **"3 Up"**: A bullish outside bar where the candle closed higher than it opened.
- **"3 Down"**: A bearish outside bar where the candle closed lower than it opened.
- **Blank**: No 3-bar pattern detected on the latest candle.
### Monitoring More Than Four Symbols
- **Multi-Chart Layout**:
- Use TradingView's multi-chart feature to display multiple charts within a single workspace.
- Apply the indicator to each chart. For example:
- **Four-Chart Grid**: Monitor up to 16 symbols by setting up four charts, each with the indicator tracking four symbols.
- **Steps**:
1. Arrange your workspace into a multi-chart layout.
2. Add the indicator to each chart.
3. Input different symbols into the indicator on each chart.
## Example Usage
Suppose you want to monitor the following symbols on a Daily timeframe:
- **Symbol 1**: *(Leave blank to use the current chart's symbol, e.g., `SPY`)*
- **Symbol 2**: `AAPL`
- **Symbol 3**: `TSLA`
- **Symbol 4**: `AMZN`
After adding the indicator and entering these symbols:
- **SPY**: The table shows "3 Up" in the State column, indicating a bullish outside bar.
- **AAPL**: No 3-bar pattern detected; the State column is blank.
- **TSLA**: The table shows "3 Down," indicating a bearish outside bar.
- **AMZN**: The table shows "3 Up," indicating another bullish outside bar.
This setup allows you to quickly assess which symbols are exhibiting significant patterns that may warrant further analysis or action.
## Notes
- **Customization**: Feel free to adjust the table's position and colors to suit your preferences.
- **Limitations**:
- Be aware of TradingView's limitations on `request.security()` calls, which may vary based on your subscription plan.
- The indicator is designed to monitor up to four symbols per instance due to these limitations.
- **Scalability**:
- By using multi-chart layouts, you can effectively monitor more symbols without overloading a single chart.
- This approach allows you to scale up your monitoring capabilities to fit your trading strategy.
## Conclusion
The **3-Bar (Outside Bar) Scanner with Table Display** is a valuable tool for traders who utilize **The Strat** methodology. It streamlines the process of identifying key 3-bar patterns across multiple symbols and timeframes, enhancing your ability to make informed trading decisions quickly.
By integrating this indicator into your trading routine, you can:
- Stay alert to significant market movements.
- Reduce the time spent manually scanning charts.
- Increase efficiency in executing your trading strategy.
---
Feel free to share this indicator with the Strat community. Feedback and suggestions are welcome to further enhance its functionality. Happy trading!

MM Day Trader LevelsAs an intraday trader, there are certain key levels that I care about for short-term price action on every single chart. When I first began day trading, each morning I would painstakingly mark those key levels off on the charts I planned to trade each day. Depending on the number of charts I was watching, this would take up quite a bit of my time that I felt would have been much better spent doing other things. It also meant that those levels would often be left behind, and on later days I might be trading a symbol and get confused when a line appeared and I'd be paying attention to it only to later discover that it wasn't from prior day, but from some other day in the past when I had marked it off.
I looked all over TradingView to find indicators that did this automatically for me, and I found a lot of them. One by one I tried them, and inevitably I would always find that something was wrong with them. Often they didn't have all of the levels I wanted (so I would have to combine multiple indicators), but more often I found that the levels would be incorrect, or they would be buggy and not appear consistently, or they would not appear at the right time, or they would not work on futures! The list of problems went on and on. And the biggest issue I found was that nobody knew how to get session volume profile in an indicator.
So, over the course of a few years I figured out how to solve all of those problems and now I'm thrilled to present this free indicator for everyone like me who trades intraday and wants a clean consistent way to see the prior day levels that they care about automatically on every single chart (even futures). The levels the indicator provides are:
Yesterday High & Low
Value Area High & Low & Point of Control
Today's Open
Yesterday's Close (aka "Settlement" on futures)
Premarket High & Low (non-futures only)
Overnight High & Low (futures only)
These levels are extremely important, and I expect price to be reactive to them, so each level has a shaded background behind it so that the levels stand out against other lines you may have on your chart. I try to keep configuration as simple as possible, but there are configuration options that allow you to:
Hide any of the levels
Change the color for the levels
Shade the value area (or not)
Change the label text, size, type (basic label or plain text) and location (how far to the right of last candle to place the label
Adjust session volume profile value area volume & number of rows
The biggest advantage to this indicator over others on TradingView is how it handles session volume profile. When it comes to futures, TradingView does differentiate between regular trading hours and "electronic" trading hours on the charts, but their timeframes for those sessions are unusual, and they do not provide any programmatic way to differentiate between them. So, I created a whole new library for dealing with futures sessions that is fully integrated into both my Session Volume Profile library and this indicator, allowing me to bring you the best and only custom indicator available on TradingView that provides you with true regular session volume profile information across every type of symbol, including futures.
I'm incredibly proud of everything I've been able to provide with this indicator, and even more thrilled to say that I'm proud of how the indicator has been implemented. Once again releasing this indicator and all associated code for free and open source. I encourage you to take a look at the source code to see how it all works, take advantage of the free underlying libraries I created to make all of this possible: Session Library and Session Volume Profile Library.

4C Data Table SuiteOverview
The 4C Data Table Suite is a versatile TradingView indicator, designed for traders who focus on the critical role of prior bar levels in their strategy. By highlighting the high and low points of previous bars, this tool aids in pinpointing crucial support and resistance zones, which often act as psychological triggers for market participants. The unique feature of this indicator is its dual-color coding: it colors bars green for bullish closes and red for bearish closes in the Prior Bar Table, and for the current timeframe, it highlights whether the current price is above (green) or below (red) these levels.
Concepts
1 — This sophisticated indicator is not just about visual cues; it provides a rich tableau of data including:
• Current timeframe countdown to bar close
• GMT-adjusted clock for precise trade timing
• Real-time updates on market internals and volatility measures such as the NYSE TICK and ATR
2 — The configuration is highly customizable, allowing users to:
• Adjust the table's positioning and text size
• Choose color settings for text, background, and borders to suit their visual preference
• Toggle the display of various data components based on their trading needs
3 — The Prior Bar Table is particularly valuable for:
• Traders using prior bar levels as triggers for trade entries and exits
• Quick visual assessment of market sentiment
• Real-time decision-making supported by dynamic color coding based on current price movements relative to prior highs and lows
Features
• Prior Bar Levels Table: Visualizes high and low levels of prior bars with intuitive color coding, aiding traders in assessing market trends.
• Dynamic Color Coding: Updates colors based on the closure of the previous bar and current price positions relative to the past bar's highs and lows.
• Comprehensive Market Data: Includes a suite of essential data such as market internals, the prior bar’s range, and the latest price information.
• Customizable Visuals: Offers extensive options for customizing the appearance and data presented, ensuring the tool fits seamlessly into any trader's strategy.
How to Use
1. To add the indicator, search for "4C Data Table Suite" under indicators on TradingView and apply it to your chart.
2. Navigate to the indicator settings to customize the display properties, including table position, color schemes, and which data points to display.
3. Utilize the toggles within the "Prior Bar Levels Table" settings to adjust the visibility and behavior of the table, depending on your trading approach.
Limitations
• This indicator is optimized for use on time-based charts and may not perform as intended on tick charts or non-standard timeframes.
• The color coding is based on the closure of bars, which may not always reflect intrabar movements, potentially affecting real-time decision-making in highly volatile markets.
Notes
• Ensure your TradingView interface is set to the correct timezone settings to align the GMT clock accurately.
• The dynamic color updates are designed to provide at-a-glance insights but should be used in conjunction with other analysis tools for best results.
*If you find that the indicator is blocking some of the candles at the bottom of the screen, go to (Chart) Settings, Canvas, and then adjust the Bottom/Top margin by increasing the % Amount.
Thanks
Special thanks to the TradingView community and developers whose feedback and insights have helped refine the functionalities of the 4C Data Table Suite. Your collaborative spirit is what makes continuous improvement possible.

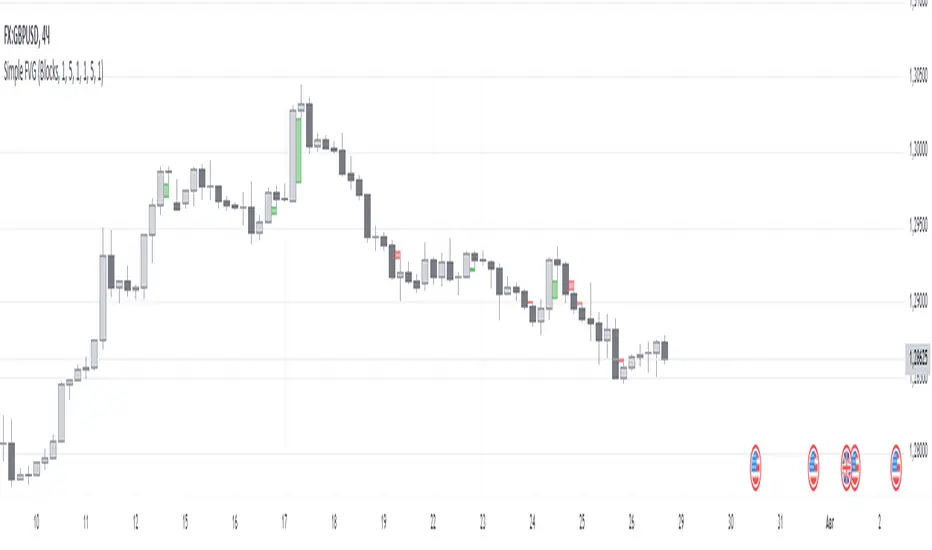
Simple FVGSimple FVG - Fair Value Gap Indicator
Overview:
The "Simple FVG" script is designed for use with TradingView to identify and visually display Fair Value Gaps (FVG) on a trading chart. This indicator highlights both bullish and bearish imbalances based on specific candlestick patterns, helping traders to quickly identify potential trading opportunities.
Key Features:
Bullish and Bearish Imbalances:
Bullish Imbalances: This script identifies bullish imbalances where the price exhibits a gap upward. The conditions for detecting a bullish imbalance are:
The high of the second candle is greater than the high of the first candle.
The low of the third candle is greater than the high of the first candle.
Bearish Imbalances: This script identifies bearish imbalances where the price exhibits a gap downward. The conditions for detecting a bearish imbalance are:
The low of the second candle is less than the low of the first candle.
The high of the third candle is less than the low of the first candle.
Customizable Display:
Bullish Blocks: Users can toggle the display of bullish imbalance blocks with customizable colors and border settings.
Bearish Blocks: Users can toggle the display of bearish imbalance blocks with customizable colors and border settings.
Color and Border Settings: Adjust the color, border color, and border width of the blocks for both bullish and bearish imbalances according to user preferences.
Visual Representation:
Drawing Blocks: The script draws filled boxes on the chart to represent identified imbalances. These blocks span from the start of the first candlestick to the end of the third candlestick, providing a clear visual indicator of the price gap.
How It Works:
Identification Logic:
The script analyzes three consecutive candles to determine if an imbalance exists.
It compares the highs and lows of these candles to establish bullish or bearish conditions.
Drawing Mechanism:
Once an imbalance condition is met, the script calculates the top and bottom levels of the imbalance block based on the high of the first candle and the low of the third candle for bullish imbalances, and vice versa for bearish imbalances.
It then draws these blocks on the chart using the specified colors and border settings.
Usage Instructions:
Add the Indicator:
Apply the "Simple FVG" indicator to your TradingView chart.
Customize Settings:
Use the input options to enable or disable the display of bullish and bearish blocks.
Adjust the colors and border settings for the imbalance blocks as needed.
Interpret Imbalances:
Look for the drawn blocks to identify potential areas where price imbalances have occurred.
Use this information to inform your trading decisions.
Originality and Value:
The "Simple FVG" script offers a unique approach to visualizing Fair Value Gaps by focusing on specific candlestick patterns. It provides traders with a tool to easily identify and analyze price imbalances, enhancing chart analysis and trading strategy development.
Chart Information:
Ensure to show the complete symbol, timeframe, and script name information on your chart for clarity and reference.
For further details and usage guidelines, refer to the TradingView House Rules.
Note: This script adheres to TradingView's guidelines for originality and usefulness, offering a practical tool for traders seeking to enhance their chart analysis.
This description adheres to TradingView's requirements by providing a detailed explanation of the script's functionality, how it works, and how users can benefit from it.
R-Squared Trend Strength and Direction [CHE] Introduction
TradingView is a web-based platform that allows traders and investors to conduct comprehensive technical analyses, develop trading strategies, and track market movements in real-time. One of the many features TradingView offers is the ability to create custom indicators using Pine Script. In this presentation, we will focus on the implementation and application of an R-Squared indicator for analyzing trend strength and direction, as well as using the T3 indicator for trend direction confirmation.
---
What is R-Squared?
R-Squared (R²), also known as the coefficient of determination, is a statistical measure that represents the proportion of the variance for a dependent variable that's explained by an independent variable(s). In technical analysis, R-Squared is used to quantify the clarity of a trend. A higher R-Squared indicates a clearer trend, less affected by random price fluctuations.
---
Pine Script: Implementing the R-Squared Indicator
Inputs:
- Source: The data source to be analyzed, such as the average of high and low prices.
- Period: The period length for calculating sums and R-Squared values.
Sum Calculations:
- Sum X and Sum XX: These sums relate to the indices of the selected period.
- Sum XY and Sum YY: These sums relate to the products of the indices and their respective price values.
- Sum Y: The sum of price values over the chosen period.
Q-Values Calculation:
- Q-values are used to calculate the R-Squared value, which indicates trend clarity.
Trend State:
- Based on the R-Squared value, a trend state is determined, indicating whether a clear trend is present. Specific threshold values are used to identify trend changes.
---
Using the T3 Indicator
The T3 indicator is used exclusively for confirming the trend direction in this strategy. It helps verify the direction of the trend identified by the R-Squared indicator.
T3 Indicator Calculation:
- The T3 indicator uses a series of exponential smoothings to smooth price movements and provide a clearer view of the trend direction.
- The T3 indicator confirms the trend direction indicated by the R-Squared indicator.
---
Functioning of the R-Squared and T3 Combination
1. Input Parameters:
- Define the data source and period length for calculating sums and R-Squared values.
2. Sum Calculations:
- Calculate various sums over the defined period needed to derive Q-values.
3. Q-Values Calculation:
- Derive Q1, Q2, and Q3 from the sums to calculate the R-Squared value.
4. Trend State:
- Use the R-Squared value to determine if a clear trend is present, utilizing threshold values to recognize trend changes.
5. Trend Direction Confirmation with T3:
- Calculate the T3 indicator to confirm the trend direction. The T3 is used solely for direction confirmation, not for clarity.
6. Long and Short Conditions:
- Define long and short entry conditions based on the combination of R-Squared and T3 indicators, and visualize them on the chart.
---
Conclusion
The R-Squared indicator is a powerful tool for analyzing the clarity of a trend. By integrating it into TradingView using Pine Script, traders can make informed decisions and optimize their trading strategies. The T3 indicator is used exclusively in this strategy to confirm the trend direction, enhancing the accuracy of trading signals.
---
Questions and Discussion
Are there any questions about the implementation or application of the R-Squared indicator in TradingView? How can we further improve this indicator or integrate it into existing strategies?
Best regards
Chervolino

[Suitable Hope] Crypto Upside Model 3.0The "Crypto Upside Model 3.0" indicator dynamically calculates the potential price of any cryptocurrency based on various percentages of Ethereum or Bitcoin's market capitalization.
By fetching and analyzing marketcap data from TradingView sources, it allows traders to visualize potential price targets if their chosen cryptocurrency reaches specific market dominance levels. This tool is designed for daily timeframe analysis and can be used to set informed price expectations and strategic investment goals, providing valuable insights for long-term investment planning.
Why using the Crypto Upside Model 3.0?
Strategic Planning: Helps traders and investors set realistic price targets and investment goals by visualizing potential market cap scenarios.
Informed Decision-Making: Provides a data-driven approach to understanding how a cryptocurrency might perform relative to major assets like Bitcoin and Ethereum.
Customizable Analysis: Allows users to choose different comparison assets (ETH or BTC) and visualize various market cap dominance percentages, offering tailored insights.
Daily Timeframe Focus: Ideal for swing traders and long-term investors who operate on a daily analysis timeframe, providing relevant and actionable data.
Bull Markets: Identify potential price targets if your cryptocurrency's market cap increases significantly.
Bear Markets: Assess how much value could be retained relative to major cryptocurrencies.
Strategic Entry/Exit Points: Use the visualized targets to plan entry or exit points in your trading strategy.
Comparative Advantage
Dynamic Adaptation: Unlike fixed indicators, this tool adapts to any active chart, making it versatile for multiple cryptocurrencies.
Market Cap Insights: Provides a unique perspective by linking price targets to market cap dominance, a critical factor in the crypto market.
User Instructions
Setup: Add the " Upside Model 3.0" indicator to your TradingView chart.
Configuration: Use the input settings to select the comparison cryptocurrency (ETH or BTC) and enable the desired market cap percentage plots.
Analysis: The indicator will display potential price targets based on the selected market cap percentages, providing a visual guide for setting price expectations.
Limitations
Marketcap Data Availability: The indicator relies on marketcap data from TradingView, which may not be available for all cryptocurrencies. If the data is unavailable, the indicator will not function for that asset. This tool is more likely to work with older, established cryptocurrencies, as marketcap data for newer cryptocurrencies may not yet be available.
Daily Timeframe Restriction: The indicator is designed to work exclusively on the daily timeframe, limiting its applicability for intraday trading.
Assumptions of Market Dynamics: The calculations assume a direct correlation between market dominance and price, which may not account for other market dynamics and external factors influencing prices.
Data Accuracy: The accuracy of the indicator depends on the reliability of the data provided by TradingView, which may sometimes experience delays or inaccuracies.
Currently available cryptocurrencies: Bitcoin, Ethereum, Solana, Binance Coin, Cardano, Ripple, Polkadot, Avalanche, Chainlink, Litecoin, Dogecoin, Terra, Uniswap, VeChain, Stellar, Internet Computer, Hedera, Filecoin, Monero, Aave, TRON, NEAR Protocol, Compound, Maker,... For all compatible cryptocurrencies, please consult CRYPTOCAP's documentation.
Final notes
Although various sources ask a payment or user data for similar kind of private indicators, this one is entirely free and open source. "Uncanny" isn't it? I hope this indicator will provide you value. Feel free to leave a message if you have any questions or constructive feedback.
Examples of how I use this indicator
When using ETH's historical price as a reference compared to Bitcoin's marketcap, we can notice that price generally has been held between the +-30% and 50% lines of BTC's marketcap. If history is repeating again, we can expect major resistances around the 50% looking ahead into the future. This for me would be a great area to potentially reduce my ETH spot position.
When using SOL's historical price action, we can notice that the 15% line of ETH's marketcap has been a top in the previous cycle. Today SOL (July 2024), is back at this level. Could this be a top again or could price break this 15% level and head perhaps towards 30% which currently sits around $260? Time will tell.
These are 2 simple example of how I interpret the data. I'm keen to hear what other findings with other pairs you can find.
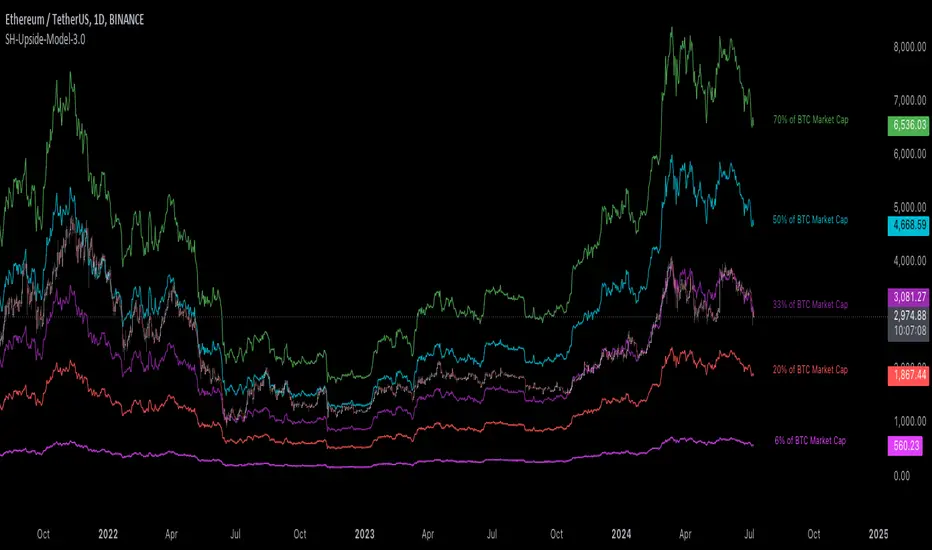
Volume, Volatility, and Momentum Metrics IndicatorVolume, Volatility, and Momentum Metrics Indicator
Welcome to our comprehensive TradingView indicator designed to provide traders with essential volume, volatility, and momentum metrics. This powerful tool is ideal for traders looking to enhance their market analysis by visualizing key indicators in a concise and easy-to-read format.
Key Features
1. Volume Metrics:
• Daily Dollar Volume: Understand the monetary value of the traded volume each day.
• Relative Volume (RVOL) Day: Compare the current volume to the previous day’s volume to gauge trading activity.
• Relative Volume (RVOL) 30D: Assess the average trading volume over the past 30 days.
• Relative Volume (RVOL) 90D: Evaluate the average trading volume over the past 90 days.
2. Volatility and Momentum Metrics:
• Average Daily Range (ADR) %: Measure the average daily price range as a percentage of the current price.
• Average True Range (ATR): Track the volatility by calculating the average true range over a specified period.
• Relative Strength Index (RSI): Determine the momentum by analyzing the speed and change of price movements.
3. Customizable Table Positions:
• Place the volume metrics table and the volatility/momentum metrics table in the bottom-left or bottom-right corners of your chart for optimal visibility and convenience.
Why Use This Indicator?
• Enhanced Market Analysis: Quickly assess volume trends, volatility, and momentum to make informed trading decisions.
• User-Friendly Interface: The clear and concise tables provide at-a-glance information without cluttering your chart.
• Customization Options: Choose where to display the tables to suit your trading style and preferences.
How It Works
This indicator uses advanced calculations to provide real-time data on trading volume, price range, and momentum. By displaying this information in separate, neatly organized tables, traders can easily monitor these critical metrics without diverting their focus from the main chart.
Who Can Benefit?
• Day Traders: Quickly gauge intraday trading activity and volatility.
• Swing Traders: Analyze longer-term volume trends and momentum to identify potential trade setups.
• Technical Analysts: Utilize comprehensive metrics to enhance technical analysis and trading strategies.
Get Started
To add this powerful indicator to your TradingView chart, simply search for “Volume, Volatility, and Momentum Metrics” in the TradingView public library, or use the provided link to add it directly to your chart. Enhance your trading analysis and make more informed decisions with our comprehensive TradingView indicator.

Median Analyst ConsensusThe Median Analyst Consensus Indicator provides an unbiased, easy-to-interpret view of market sentiment by leveraging TradingView's comprehensive financial data library. This tool displays the median 12-month price target and the percentage difference from the current price directly on your charts.
Key Features
1. Accurate Market Sentiment: By consolidating analyst ratings and price targets from multiple reputable sources like Bloomberg, Refinitiv (formerly Thomson Reuters), S&P Capital IQ, and Morningstar, this indicator displays the median analyst consensus. Using the median ensures outlier ratings don't skew the overall sentiment, providing a more robust representation.
2. Simplicity at a Glance: View the median 12-month price target and percentage difference from the current price directly on your chart. No need to juggle multiple reports - key insights are surfaced within your normal trading workflow.
3. Data-Driven Transparency: If no analyst data is available for a particular asset, the indicator will not display, ensuring you only see reliable information. The number of contributing analysts is also shown for context.
Why the Median?
The median is favored over the mean to minimize the impact of outlier ratings that could distort the consensus view. By taking the middle value across all analyst projections, the median provides a more stable, outlier-resistant measure of market sentiment.
Powered by TradingView Data
This indicator taps into TradingView's financial data library, which aggregates analyst ratings, estimates, and recommendations from leading institutional data providers. TradingView sources this data from firms like FactSet, Bloomberg, Refinitiv, S&P Capital IQ, and Morningstar, ensuring a comprehensive and trusted view of analyst sentiment.
The library provides variables like:
syminfo.recommendations_buy
syminfo.recommendations_sell
syminfo.target_price_median
syminfo.recommendations_buy_strong
syminfo.recommendations_sell_strong
The indicator calculates and displays the median of these analyst inputs.
Usage
The indicator displays:
The median 12-month price target across analysts
The percentage difference between the price target and current price
The number of contributing analyst estimates
If no analyst data is available, the indicator does not display, ensuring full transparency.
The Median Analyst Consensus Indicator provides an unbiased, easy-to-interpret view of market sentiment by leveraging TradingView's comprehensive financial data library. This tool offers a new perspective on potential trade opportunities directly on your charts.
Disclaimer
While the data is sourced from reputable providers, analyst forecasts should not be construed as investment recommendations. This indicator aims to synthesize market opinions, but investment decisions are solely your responsibility. As with any analytical tool, you should conduct your own research and risk assessments before executing any trades.
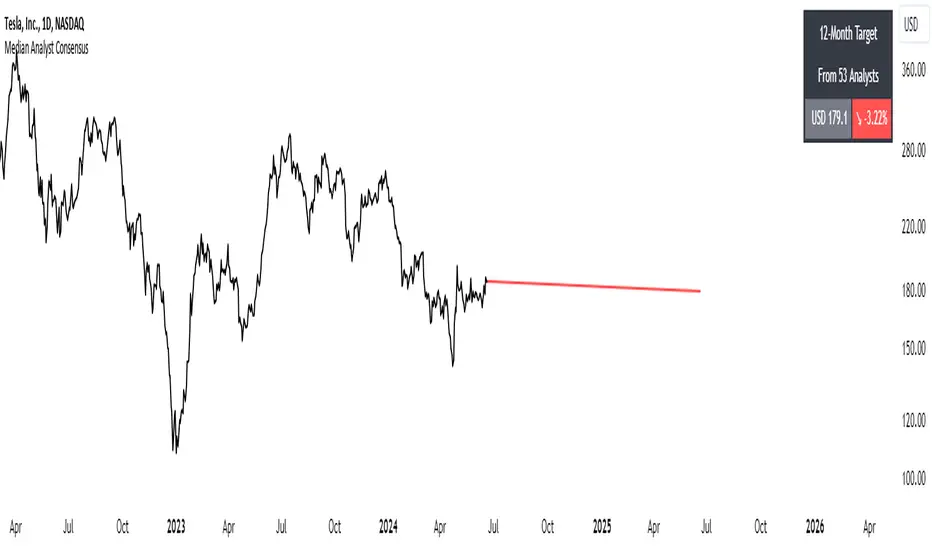
Cumulative Volume Delta LineThis script is a refined version of TradingView's Cumulative Volume Delta (CVD) indicator. It features a CVD line for lower time frames and automatically switches to a Simple Moving Average (SMA) line on daily time frames and higher. This functionality makes it easier to spot Volume Delta divergences on daily charts while maintaining utility on intraday time frames.
Key Features:
Line Chart and Oscillator Configuration: Unlike TradingView's standard CVD, this script can be configured as a line chart or an oscillator, enhancing flexibility and usability.
Line chart for easier divergence spotting: The line chart format is preferred for spotting divergences, providing a clearer visual representation compared to other formats.
Accurate Calculations: Many older community CVD scripts use approximate calculations that can be inaccurate. This script leverages TradingView's own calculations, which are the most accurate available without tick data feeds.
Intraday and Daily Adaptation: The Traditional CVD script is a per bar volume delta on Daily and higher timeframes and cumulative volume delta for intraday session timeframes which makes it very hard to spot divergences on higher timeframes. This script resolves that by using an SMA on daily time frames and higher.
Auto-Switching Feature: The script intelligently switches between the CVD line and the SMA line based on the active time frame. This feature can be toggled off if you prefer to use the CVD on all time frames or the SMA on all time frames.
Customizable Settings: Building on TradingView's CVD script, this version includes all the same settings in addition to the new auto-switch, SMA length etc.
About Volume Delta and Cumulative Volume Delta:
Volume Delta is the difference between the buying and selling volume within a specified period. It helps traders understand the net buying or selling pressure in the market. A positive volume delta indicates more buying activity, while a negative volume delta indicates more selling activity.
Cumulative Volume Delta (CVD) aggregates the volume delta over time to provide a running total. This cumulative approach helps traders see the overall buying and selling pressure trends, making it easier to identify potential reversals or continuations in the market trend.

Strategy / Connectable [Azullian]The connectable strategy serves as a foundational component in our indicator system on TradingView, designed for intuitive testing, visualization, and construction of trading strategies. In concert with the connectable signal filter , it forms a cohesive unit that allows for efficient signal processing and strategy implementation. This integration enables the strategy to receive and act on weighted signals from various connectable indicators, making it a versatile tool for both novice and experienced traders.
Let's review the separate parts of this indicator.
█ STRATEGY INPUTS
We've provided an input to connect a signal filter or indicators or chains (→) which is set to 'Close' by default.
An input has several controls:
• Input: Connect indicators or signal filter here, choose indicators with a compatible : Signal connector.
• SM - Signal Mode: Choose a trading direction compatible with the settings in your signal filter
█ POSITION INVESTMENT
Determine the percentage of your trading budget you would like to use in each position based on the strategy's profit or loss.
• LINVB - Loss Investment Base: Choose which base to use to determine the investment percentage when the strategy is in a loss.
○ Equity: Use the equity as the base for percentage calculation.
○ Initial capital: Use the initial capital as the base for percentage calculation.
• LINV% - Loss Investment Percentage: Set a percentage of the chosen investment base as the investment for a new position.
○ For example, when 10% in loss, and a initial capital of $100, and the investment base is set to equity with a percentage of 50%, your investment will be 50% of $90, $45.
• PINVB - Profit Investment Base: Choose which base to use to determine the investment percentage when the strategy is in profit.
○ Equity: Use the equity as the base for percentage calculation.
○ Initial capital: Use the initial capital as the base for percentage calculation.
• PINV% - Profit Investment Percentage: Set a percentage of the chosen investment base as the investment for a new position.
○ For example, when 10% in profit, and an initial capital of $100, and the investment base is set to equity with a percentage of 100%, your investment will be 100% of $110, $110.
• RISK% - Risk Percentage:
○ Determine how much of the calculated position investment is at risk when the stop-loss is hit.
- For example, 1% of $45 represents a maximum loss of $0.45.
○ Risk percentage works together with the stop loss and the max leverage.
• MXLVG - Maximum Leverage:
○ Investigate the trading rules for your trading pair and use the maximum allowed amount of leverage.
○ To determine the number of contracts to be bought or sold, considering the stop loss and the specified risk percentage, the maximum leverage available will constrain the amount of leverage utilized to ensure that the maximum risk threshold is not exceeded. For instance, suppose the stop loss is set at 1%, and the risk percentage is defined as 10%. Initially, the calculated leverage to be used would be 10. However, if there is a maximum leverage cap set at 5, it would constrain the calculated leverage of 10 to adhere to the maximum limit of 5.
█ EXIT STOP LOSS
Determine the Stop Loss price based on your selected configuration.
As the stop loss is an integral part of the ordered contracts calculation used in conjunction with the Risk and Max leverage, you'll always need to provide a stop loss price.
• SLB - Stop Loss Base: Choose a stop loss mode for calculating stop loss prices.
○ Risk: Determines the price using the Risk parameter (RISK%) and maximum leverage (MXLVG). In this case, SLB% will not have any impact.
○ Price Entry + Offset: Calculates the stop loss price based on a offset percentage (SLB%) from the entry price of the position.
• SLB% - Stop Loss Base Percentage: Define an offset percentage that will be applied in the price entry + offset stop loss mode.
• SLT - Stop Loss Trailing:
○ Fixed: The initial stop loss will be kept and no trailing stop loss will be applied.
○ Trail Price: Computes the trailing stop loss price based on an offset percentage (SLT%) from the closing price of the current candle.
- If a better stop loss price is calculated, it will be set as the new stop loss price.
○ Trail Incr: Adapts the trailing stop loss price based on the offset percentage (SLT%).
- Each price change in favor of your position will incrementally adapt the trailing stop loss with SLT%.
• SLT% - Stop Loss Trailing Percentage: This percentage serves as an offset or increment depending on your chosen trailing mode.
█ EXIT TAKE PROFIT
Determine the Take Profit price based on your selected configuration.
• TPB - Take Profit Base: Choose a take profit mode for calculating take profit prices.
○ Reward: Determines the take profit price using the Risk parameter (RISK%) and the calculated Stop Loss price and the set reward percentage (TPB%).
- For example: Risk 1%, Calculated Stop loss price: $90, Entry price: $100, Reward (TPB%): 2%, will result in a take profit price on $120.
○ Price Entry + Offset: Calculates the take profit price based on a offset percentage (TPB%) from the entry price of the position.
- For example: Entry price: $100, Offset (TPB%): 2%, will result in a take profit price on $102.
• TPB% - Take Profit Base Percentage: Define an offset percentage that will be applied in the price entry + offset take profit mode.
• TPT - Take Profit Trailing:
○ Fixed: The initial take profit will be kept and no trailing take profit will be applied.
○ Trail Price: Computes the trailing take profit price based on an offset percentage (TPT%) from the closing price of the current candle.
- If an applicable take profit price is calculated, it will be set as the new take profit price.
○ Trail Incr: Adapts the trailing take profit price based on the offset percentage (TPT%). Each price change against your position will incrementally adapt the trailing take profit with TPT%.
• TPT% - Take Profit Trailing Percentage: This percentage serves as an offset or increment depending on your chosen trailing mode.
█ STRATEGY CONDITIONS
Specify when the strategy is permitted to execute trades.
• DATE: Enable the Date Range filter to restrict entries to a specific date range.
○ START: Set a start date and hour to commence trading.
○ END: Set an end date and hour to conclude trading within the defined range.
■ VISUALS
• LINE: Activate a colored dashed diagonal line to visually connect the entry and exit points of positions.
• SLTP: Enable visualization of stop loss, take profit, and break-even levels.
• PNL: Enable Break-Even and Close Lines along with a colored area in between to visualize profit and loss.
• ☼: Brightness % : Adjust the opacity of the plotted trading visuals.
• P - Profit Color : Choose the color for profit-related elements.
• L - Loss Color: Choose the color for loss-related elements.
• B - Breakeven Color : Select the color for break-even points.
• EL - Long Color: Specify the color for long positions.
• ES - Short Color: Specify the color for short positions.
• TRADE LABELING: For better analysis we've labeled all entries and exits conform with the type of order your strategy has executed, some examples:
○ XL-TP-150: Exit Long - Take Profit - Position 150
○ XS-TP-154: Exit Short - Take Profit - Position 154
○ XL-SL-160: Exit Long - Stop Loss - Position 160
○ XS-SL-164: Exit Short - Stop Loss - Position 164
█ USAGE OF CONNECTABLE INDICATORS
■ Connectable chaining mechanism
Connectable indicators can be connected directly to the signal monitor, signal filter or strategy , or they can be daisy chained to each other while the last indicator in the chain connects to the signal monitor, signal filter or strategy. When using a signal filter you can chain the filter to the strategy input to make your chain complete.
• Direct chaining: Connect an indicator directly to the signal monitor, signal filter or strategy through the provided inputs (→).
• Daisy chaining: Connect indicators using the indicator input (→). The first in a daisy chain should have a flow (⌥) set to 'Indicator only'. Subsequent indicators use 'Both' to pass the previous weight. The final indicator connects to the signal monitor, signal filter, or strategy.
■ Set up the strategy with a signal filter and an RSI indicator
Let's connect the Strategy to a connectable signal filter and a connectable RSI indicator :
1. Load all relevant indicators
• Load RSI / Connectable
• Load Signal filter / Connectable
• Load Strategy / Connectable
2. Signal Filter: Connect the RSI to the Signal Filter
• Open the signal filter settings
• Choose one of the three input dropdowns (1→, 2→, 3→) and choose : RSI / Connectable: Signal Connector
• Toggle the enable box before the connected input to enable the incoming signal
3. Signal Filter: Update the filter signals settings if needed
• The default settings of the filter enable EL (Enter Long), XL (Exit Long), ES (Enter Short) and XS (Exit Short).
4. Signal Filter: Update the weight threshold settings if needed
• All connectable indicators load by default with a score of 6 for each direction (EL, XL, ES, XS)
• By default, weight threshold (TH) is set at 5. This allows each occurrence to score, as the default score in each connectable indicator is 1 point above the threshold. Adjust to your liking.
5. Strategy: Connect the strategy to the signal filter in the strategy settings
• Select the strategy input → and select the Signal filter: Signal connector
6. Strategy: Enable filter compatible directions
• Set the signal mode of the strategy to a compatible direction with the signal filter.
Now that everything is connected, you'll notice green spikes in the signal filter representing long signals, and red spikes indicating short signals. Trades will also appear on the chart, complemented by a performance overview. Your journey is just beginning: delve into different scoring mechanisms, merge diverse connectable indicators, and craft unique chains. Instantly test your results and discover the potential of your configurations. Dive deep and enjoy the process!
█ BENEFITS
• Adaptable Modular Design: Arrange indicators in diverse structures via direct or daisy chaining, allowing tailored configurations to align with your analysis approach.
• Streamlined Backtesting: Simplify the iterative process of testing and adjusting combinations, facilitating a smoother exploration of potential setups.
• Intuitive Interface: Navigate TradingView with added ease. Integrate desired indicators, adjust settings, and establish alerts without delving into complex code.
• Signal Weight Precision: Leverage granular weight allocation among signals, offering a deeper layer of customization in strategy formulation.
• Advanced Signal Filtering: Define entry and exit conditions with more clarity, granting an added layer of strategy precision.
• Clear Visual Feedback: Distinct visual signals and cues enhance the readability of charts, promoting informed decision-making.
• Standardized Defaults: Indicators are equipped with universally recognized preset settings, ensuring consistency in initial setups across different types like momentum or volatility.
• Reliability: Our indicators are meticulously developed to prevent repainting. We strictly adhere to TradingView's coding conventions, ensuring our code is both performant and clean.
█ COMPATIBLE INDICATORS
Each indicator that incorporates our open-source 'azLibConnector' library and adheres to our conventions can be effortlessly integrated and used as detailed above.
For clarity and recognition within the TradingView platform, we append the suffix ' / Connectable' to every compatible indicator.
█ COMMON MISTAKES AND CLARIFICATIONS
• Removing an indicator from a chain: Deleting a linked indicator and confirming the "remove study tree" alert will also remove all underlying indicators in the object tree. Before removing one, disconnect the adjacent indicators and move it to the object stack's bottom.
• Point systems: The azLibConnector provides 500 points for each direction (EL: Enter long, XL: Exit long, ES: Enter short, XS: Exit short) Remember this cap when devising a point structure.
• Flow misconfiguration: In daisy chains the first indicator should always have a flow (⌥) setting of 'indicator only' while other indicator should have a flow (⌥) setting of 'both'.
• Recalculate: While this strategy has undergone extensive testing, enabling recalculation options like 'After order is filled' or 'On every tick' may lead to unexpected behavior.
• Fill orders: The strategy is thoroughly tested, yet enabling fill order options such as 'Using bar magnifier', 'On bar close', or 'Using standard OHLC' might result in unexpected outcomes.
• Layout and abbreviations: To maintain a consistent structure, we use abbreviations for each input. While this may initially seem complex, you'll quickly become familiar with them. Each abbreviation is also explained in the inline tooltips.
• Optimized for crypto trading: While many principles are common across markets, this strategy is specifically optimized and tested for crypto trading.
• Inputs: Connecting a connectable indicator directly to the strategy delivers the raw signal without a weight threshold, meaning every signal will trigger a trade.
█ A NOTE OF GRATITUDE
Through years of exploring TradingView and Pine Script, we've drawn immense inspiration from the community's knowledge and innovation. Thank you for being a constant source of motivation and insight.
█ RISK DISCLAIMER
Azullian's content, tools, scripts, articles, and educational offerings are presented purely for educational and informational uses. Please be aware that past performance should not be considered a predictor of future results.

Stochastic / Connectable [Azullian]Advance your market analysis with the Stochastic Oscillator. Identify potential price reversals with precision, aiding in the creation of flexible and accurate strategies.
This connectable Stochastic indicator is part of an indicator system designed to help test, visualize and build strategy configurations without coding. Like all connectable indicators , it interacts through the TradingView input source, which serves as a signal connector to link indicators to each other. All connectable indicators send signal weight to the next node in the system until it reaches either a connectable signal monitor, signal filter and/or strategy.
█ UNIFORM SETTINGS AND A WAY OF WORK
Although connectable indicators may have specific weight scoring conditions, they all aim to follow a standardized general approach to weight scoring settings, as outlined below.
■ Connectable indicators - Settings
• 🗲 Energy: Energy applies an ATR multiplier to the plotted shapes on the chart. A higher value plots shapes farther away from the candle, enhancing visibility.
• ☼ Brightness: Brightness determines the opacity of the shape plotted on the chart, aiding visibility. Indicator weight also influences opacity.
• → Input: Use the input setting to specify a data source for the indicator. Here you can connect the indicator to other indicators.
• ⌥ Flow: Determine where you want to receive signals from:
○ Both: Weights from this indicator and the connected indicator will apply
○ Indicator only: Only weights from this indicator will apply
○ Input only: Only weights from the connected indicator will apply
• ⥅ Weight multiplier: Multiply all weights in the entire indicator by a given factor, useful for quickly testing different indicators in a granular setup.
• ⥇ Threshold: Set a threshold to indicate the minimum amount of weight it should receive to pass it through to the next indicator.
• ⥱ Limiter: Set a hard limit to the maximum amount of weight that can be fed through the indicator.
■ Connectable indicators - Weight scoring settings
▢ Weight scoring conditions
• SM – Signal mode: Enable specific conditions for weight scoring
○ All: All signals will be scored.
○ Entries only: Only entries will score.
○ Exits only: Only exits will score.
○ Entries & exits: Both entries and exits will score.
○ Zone: Continuous scoring for each candle within the zone.
• SP – Signal period: Defines a range of candles within which a signal can score.
• SC - Signal count: Specifies the number of bars to retrospectively examine and score.
○ Single: Score for a single occurrence
○ All occurrences: Score for all occurrences
○ Single + Threshold: Score for single occurrences within the signal period (SP)
○ Every + Threshold: Score for all occurrences within the signal period (SP)
▢ Weight scoring direction
• ES: Enter Short weight
• XL: Exit long weight
• EL: Enter Long weight
• XS: Exit Short weight
▢ Weight scoring values
• Weights can hold either positive or negative scores. Positive weights enhance a particular trading direction, while negative weights diminish it.
█ STOCHASTIC - INDICATOR SETTINGS
■ Main settings
• Enable/Disable Indicator: Toggle the entire indicator on or off.
• S - Source: Choose an alternative data source for the Stochastic calculation.
• T - Timeframe: Select an alternative timeframe for the Stochastic calculation.
• KL - %K Length: Define the number of bars or periods used in the calculation of the %K value.
• OB - Overbought Level: Determine the Stochastic value at which overbought conditions are met.
• OS - Oversold Level: Specify the Stochastic value at which oversold conditions are met.
• %K - %K Smoothing: DDefine the number of bars or periods used to smooth the %K value.
• %D - %D Smoothing: Define the number of bars or periods used to calculate and smooth the %D
■ Scoring functionality
• The Stochastic scores long entries when the %K line crosses above the %D line within the OS (oversold) area.
• The Stochastic scores long exits when the %K line crosses below the %D line after being in the OS (oversold) area.
• The Stochastic scores long zones for the duration the %K is above the %D line within the OS (oversold) area.
• The Stochastic scores short entries when the %K line crosses below the %D line within the OB (overbought) area.
• The Stochastic scores short exits when the %K line crosses above the %D line after being in the OB (overbought) area.
• The Stochastic scores short zones for the duration the %K is below the %D line within the OB (overbought) area.
█ PLOTTING
• Standard: Symbols (EL, XS, ES, XL) appear relative to candles based on set conditions. Their opacity and position vary with weight.
• Conditional Settings: A larger icon appears if global conditions are met. For instance, with a Threshold(⥇) of 12, Signal Period (SP) of 3, and Scoring Condition (SC) set to "EVERY", a Stochastic signaling over two times in 3 candles (scoring 6 each) triggers a larger icon.
█ USAGE OF CONNECTABLE INDICATORS
■ Connectable chaining mechanism
Connectable indicators can be connected directly to the signal monitor, signal filter or strategy , or they can be daisy chained to each other while the last indicator in the chain connects to the signal monitor, signal filter or strategy. When using a signal filter you can chain the filter to the strategy input to make your chain complete.
• Direct chaining: Connect an indicator directly to the signal monitor, signal filter or strategy through the provided inputs (→).
• Daisy chaining: Connect indicators using the indicator input (→). The first in a daisy chain should have a flow (⌥) set to 'Indicator only'. Subsequent indicators use 'Both' to pass the previous weight. The final indicator connects to the signal monitor, signal filter, or strategy.
■ Set up this indicator with a signal filter and strategy
The indicator provides visual cues based on signal conditions. However, its weight system is best utilized when paired with a connectable signal filter, signal monitor, or strategy .
Let's connect the Stochastic to a connectable signal filter and a strategy :
1. Load all relevant indicators
• Load Stochastic / Connectable
• Load Signal filter / Connectable
• Load Strategy / Connectable
2. Signal Filter: Connect the Stochastic to the Signal Filter
• Open the signal filter settings
• Choose one of the three input dropdowns (1→, 2→, 3→) and choose : Stochastic / Connectable: Signal Connector
• Toggle the enable box before the connected input to enable the incoming signal
3. Signal Filter: Update the filter signals settings if needed
• The default settings of the filter enable EL (Enter Long), XL (Exit Long), ES (Enter Short) and XS (Exit Short).
4. Signal Filter: Update the weight threshold settings if needed
• All connectable indicators load by default with a score of 6 for each direction (EL, XL, ES, XS)
• By default, weight threshold (TH) is set at 5. This allows each occurrence to score, as the default score in each connectable indicator is 1 point above the threshold. Adjust to your liking.
5. Strategy: Connect the strategy to the signal filter in the strategy settings
• Select a strategy input → and select the Signal filter: Signal connector
6. Strategy: Enable filter compatible directions
• Set the signal mode of the strategy to a compatible direction with the signal filter.
Now that everything is connected, you'll notice green spikes in the signal filter representing long signals, and red spikes indicating short signals. Trades will also appear on the chart, complemented by a performance overview. Your journey is just beginning: delve into different scoring mechanisms, merge diverse connectable indicators, and craft unique chains. Instantly test your results and discover the potential of your configurations. Dive deep and enjoy the process!
█ BENEFITS
• Adaptable Modular Design: Arrange indicators in diverse structures via direct or daisy chaining, allowing tailored configurations to align with your analysis approach.
• Streamlined Backtesting: Simplify the iterative process of testing and adjusting combinations, facilitating a smoother exploration of potential setups.
• Intuitive Interface: Navigate TradingView with added ease. Integrate desired indicators, adjust settings, and establish alerts without delving into complex code.
• Signal Weight Precision: Leverage granular weight allocation among signals, offering a deeper layer of customization in strategy formulation.
• Advanced Signal Filtering: Define entry and exit conditions with more clarity, granting an added layer of strategy precision.
• Clear Visual Feedback: Distinct visual signals and cues enhance the readability of charts, promoting informed decision-making.
• Standardized Defaults: Indicators are equipped with universally recognized preset settings, ensuring consistency in initial setups across different types like momentum or volatility.
• Reliability: Our indicators are meticulously developed to prevent repainting. We strictly adhere to TradingView's coding conventions, ensuring our code is both performant and clean.
█ COMPATIBLE INDICATORS
Each indicator that incorporates our open-source 'azLibConnector' library and adheres to our conventions can be effortlessly integrated and used as detailed above.
For clarity and recognition within the TradingView platform, we append the suffix ' / Connectable' to every compatible indicator.
█ COMMON MISTAKES, CLARIFICATIONS AND TIPS
• Removing an indicator from a chain: Deleting a linked indicator and confirming the "remove study tree" alert will also remove all underlying indicators in the object tree. Before removing one, disconnect the adjacent indicators and move it to the object stack's bottom.
• Point systems: The azLibConnector provides 500 points for each direction (EL: Enter long, XL: Exit long, ES: Enter short, XS: Exit short) Remember this cap when devising a point structure.
• Flow misconfiguration: In daisy chains the first indicator should always have a flow (⌥) setting of 'indicator only' while other indicator should have a flow (⌥) setting of 'both'.
• Hide attributes: As connectable indicators send through quite some information you'll notice all the arguments are taking up some screenwidth and cause some visual clutter. You can disable arguments in Chart Settings / Status line.
• Layout and abbreviations: To maintain a consistent structure, we use abbreviations for each input. While this may initially seem complex, you'll quickly become familiar with them. Each abbreviation is also explained in the inline tooltips.
• Inputs: Connecting a connectable indicator directly to the strategy delivers the raw signal without a weight threshold, meaning every signal will trigger a trade.
█ A NOTE OF GRATITUDE
Through years of exploring TradingView and Pine Script, we've drawn immense inspiration from the community's knowledge and innovation. Thank you for being a constant source of motivation and insight.
█ RISK DISCLAIMER
Azullian's content, tools, scripts, articles, and educational offerings are presented purely for educational and informational uses. Please be aware that past performance should not be considered a predictor of future results.