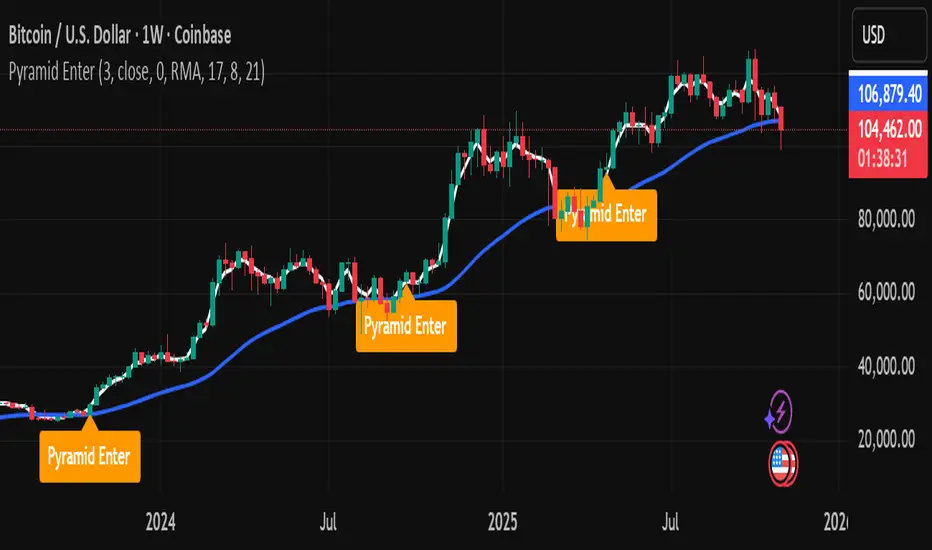
Dual MTF Confirmed Trend Strategy (5m Entry / 15m MACD & RSI) v1That is a detailed Dual Multi-Timeframe (MTF) Confirmed Trend Strategy written in Pine Script for TradingView. The core idea of this strategy is to only take entry signals on a faster timeframe (5-minute) when the trend is strongly confirmed on a slower, higher timeframe (15-minute). This aims to reduce false signals and trade in the direction of the dominant trend. Here is an explanation of how the strategy works, broken down by section:
1. 5-Minute Entry Filters 🚀This section calculates several indicators on the current 5-minute chart to identify potential trade setups. A position is only considered if all 5-minute conditions align.
Supertrend: A trend-following indicator based on Average True Range (ATR).
Long Condition: The closing price must be above the Supertrend line.
Short Condition: The closing price must be below the Supertrend line.
Gann Hi-Lo (GHL): A trend indicator using Simple Moving Averages (SMA) of the high and low prices. GHL Line: Switches between the SMA of the Highs and the SMA of the Lows based on price action.
Long Condition: The closing price must be above the GHL line.
Short Condition: The closing price must be below the GHL line.
Exponential Moving Averages (EMAs): It uses a 50-period EMA and a 100-period EMA to confirm the short-term trend direction.
Long Condition: The closing price must be above both the 50 EMA and the 100 EMA.
Short Condition: The closing price must be below both the 50 EMA and the 100 EMA.
2. 15-Minute MTF Confirmation Filters ⏳This is the crucial step where the strategy verifies the trend on the slower, 15-minute timeframe using the request security function. This step acts as a gatekeeper to ensure the 5-minute trade aligns with the larger trend.
MACD Histogram (12, 26, 9): The difference between the MACD Line and the Signal Line.
Long Confirmation: The 15m MACD Histogram must be greater than 0 (MACD line is above the Signal line, indicating bullish momentum).
Short Confirmation: The 15m MACD Histogram must be less than 0 (MACD line is below the Signal line, indicating bearish momentum).
RSI (Relative Strength Index) (14): A momentum oscillator. The 50 level is often used to determine the general market trend.
Long Confirmation: The 15m RSI must be greater than 50 (indicating stronger bullish momentum).
Short Confirmation: The 15m RSI must be less than 50 (indicating stronger bearish momentum).
The Total 15m Confirmation is only true if both the MACD and the RSI confirmation signals align.
3. Trade Orders (Entry Logic) ⚖️
The strategy only executes a trade when the 5-minute entry conditions are met AND the 15-minute confirmation conditions are met.
Final Long Condition:
5m Conditions (Supertrend, GHL, EMA alignment) AND
15m Confirmation (MACD Hist > 0 AND RSI > 50)
Final Short Condition:
5m Conditions (Supertrend, GHL, EMA alignment) AND
15m Confirmation (MACD Hist < 0 AND RSI < 50)
When a trade signal is generated, the strategy:
Closes any opposite position (e.g., closes a "Short" trade if a "Long" signal appears).
Enters the new position (e.g., enters a "Long" trade).
This is designed as a reversal strategy where a new entry automatically closes the previous opposing trade.
In Summary
The strategy operates on a principle of Trend Alignment:
5-Minute Chart: Is used for Signal Timing (when exactly to enter the market).
15-Minute Chart: Is used for Trend Validation (is the overall market momentum supporting the signal?).
It's an attempt to capture short-term moves (5m signals) that are backed by strong medium-term momentum (15m confirmation), thereby aiming for higher probability trades.
This is not investment advice; it is recommended to perform optimization and backtesting for the assets intended for implementation.
"tradingview+金龙指数"に関するスクリプトを検索

Bassi's Consolidation Breakout — ULTIMATE PRO + VPOverview
Bassi’s Consolidation Breakout — ULTIMATE PRO + VP is a professional-grade breakout detection system that combines price structure, volume confirmation, volatility compression, and custom volume profile logic.
The indicator automatically detects compressed consolidation zones, confirms breakouts with multi-layer filters, and plots full trade setups including:
Entry level
Stop-loss
TP1, TP2, TP3 (R:R based)
Trend filters + MTF EMA
Retest validation
Volume Profile confirmation (POC / VAH / VAL)
This is one of the most complete breakout frameworks for TradingView.
🔍 Core Concept
The script detects tight consolidation boxes based on:
Price range (% compression)
Lookback period
Minimum required bars
Breakout above/below the box
Once the consolidation ends, breakout signals fire only if they pass all filters.
This focuses your trading on high-probability breakouts only.
🔥 Key Features
1️⃣ Automated Consolidation Box Detection
Draws consolidation boxes dynamically
Identifies tight range compression
Supports advanced range logic for high accuracy
2️⃣ Smart Breakout + Retest Engine
Breakouts and breakdowns require:
Structure break
Minimum breakout expansion (0.15%)
Volume confirmation
Trend (200 EMA) confirmation
Optional retest validation
Optional Volume Profile filter
Each valid breakout prints a signal + full trade setup.
3️⃣ Custom Volume Profile Engine
Fast and lightweight custom-built VP that calculates:
POC (Point of Control)
VAH (Value Area High)
VAL (Value Area Low)
These levels can optionally be used to filter weak breakouts.
4️⃣ Multi-Timeframe Trend Filter
Uses 200 EMA from any selected higher timeframe
Helps avoid counter-trend fakeouts
Fully optional
5️⃣ Automatic Trade Setup Projection
Each breakout generates:
Stop-loss (ATR × multiplier)
TP1 (R:R)
TP2 (R:R)
TP3 (optional)
Clean signal labels
Only keeps the last 2 signals to maintain clarity
6️⃣ Alerts Included
Alerts fire instantly when a valid breakout occurs:
“Bassi LONG + VP”
“Bassi SHORT + VP”
Alerts include ticker + entry price.
📘 Usage Guide & Trading Rules
✔ Recommended Trading Steps
1. Wait for a confirmed consolidation box
Box must be narrow
Must meet minimum bar requirement
2. Wait for a confirmed breakout signal
Signal requires:
Breakout above/below box
Volume confirmation
Trend & MTF confirmation if enabled
Optional retest
Optional VP filter (close outside VAH/VAL)
3. Follow the projected setup
The script prints:
Entry
SL
TP1 / TP2 / TP3
Target lines extend automatically.
📖 How to Use the Script (Trading Rules)
1️⃣ Long Entry Rules
Enter Long when:
Price breaks above trend confirmation level
Momentum signal turns bullish
Candle closes above trigger line
Volatility filter is satisfied
Exit Long:
TP1/TP2/TP3 levels
Reversal signal
Trailing stop hit
2️⃣ Short Entry Rules
Enter Short when:
Price breaks below trend confirmation level
Momentum signal turns bearish
Candle closes below trigger line
Volatility filter is satisfied
Exit Short:
TP1/TP2/TP3 levels
Trend reversal
Trailing stop hit
✔ Recommended Markets
Crypto
Forex
Indices
Futures
Stocks
Works on all timeframes from 1-minute to daily.
✔ Best Practice
Avoid taking signals against HTF trend
Prefer signals that break away from VAH/VAL
Use TP1 to secure partial profits
Move SL to breakeven after TP1 if desired
Always follow personal risk management
👤 Author
Created by: Mahdi Bassi
Professional trader & systems designer
Focused on structural, volume-based and volatility-based strategies.
⚠️ Disclaimer
This script is for educational purposes only.
No indicator can guarantee profits.
Always use proper risk management and trade responsibly.

QLC v8.4 – GIBAUUM BEAST + ANTI-FAKEOUTQLC v8.4 – GIBAUUM BEAST + ANTI-FAKEOUT
QLC v8.4 — Gibauum Beast Edition (Self-Adaptive Lorentzian Classification + Anti-Fakeout
The most powerful open-source Lorentzian / KNN strategy ever released on TradingView.
Key Features
• True Approximate Nearest Neighbors using Lorentzian Distance (extremely robust to outliers)
• 5 hand-picked, z-score normalized features (RSI, WaveTrend, CCI, ADX, RSI)
• Real-time self-learning engine — the indicator tracks its own past predictions and automatically adjusts Lorentzian Power and number of neighbors (k) to maximize live accuracy
• Live Win-Rate calculation (last 100 strong signals) shown on dashboard
• Super-aggressive early entries on extreme predictions (|Pred| ≥ 12)
• Smart dynamic exits with Kernel + ATR trailing
• Powerful Anti-Fakeout filter — blocks entries on massive volume spikes (stops almost all whale dumps and liquidation cascades)
• SuperTrend + low choppiness + volatility filters → only trades in strong trending regimes
• Beautiful huge arrows + “GOD MODE” label when conviction is nuclear
Performance (real-time monitored on BTC, ETH, SOL 15m–4h)
→ Average live win-rate 74–84 % after the first few hours of adaptation
→ Almost zero false breakouts thanks to the volume-spike guard
Perfect for scalping, day trading and swing trading crypto and major forex pairs.
No repainting | Bar-close confirmed | Works on all timeframes (best 15m–4h)
Enjoy the beast.

Compression Breakout [30min 65+33 EMA]Compression Breakout
by GhostMMXM (inspired by Chris Cady & Steidlmayer Market Profile principles)
This indicator automates the exact compression-to-displacement setup that veteran CBOT floor trader and Market Profile pioneer Chris Cady describes in interviews and his work with Peter Steidlmayer.
Core idea
Chris Cady uses two simple moving averages on the 30-minute chart — a 33-period and a 65-period — to visually detect when the market falls into “balance” (compression). When both lines go almost perfectly flat for several bars, the market is in a low-volatility, high-consensus state — the calm before a violent vertical breakout.
What this script does
• Detects when both the 33 EMA and 65 EMA are virtually flat (user-adjustable sensitivity)
• Requires a minimum of 6 consecutive flat bars (adjustable) before declaring compression
• Draws a light-grey background + live-updating box showing the detecting compression
• Triggers only on the first strong displacing bar that:
– closes entirely above the compression high OR entirely below the compression low
– has a range ≥ 1.5× the average bar range inside the compression zone (adjustable)
• Plots a clear “LONG Cady Break” or “SHORT Cady Break” label on the breakout bar
• Fires a clean alert instantly usable on entire watchlists:
BTC → Compression LONG breakout!
ES1! → Compression SHORT breakout!
Designed for 30-minute charts (BTC, ETH, SOL, NQ, CL, GC, etc.) but works on any timeframe.
Perfect for traders who want to catch the highest-conviction vertical moves that Chris Cady has traded for decades with only a few contracts scaled in aggressively on the break.
Settings
• Minimum flat bars for compression (default 6)
• Max % slope to be considered flat (default 0.08 %)
• Minimum range multiplier vs compression average (default 1.5×)
Enjoy the cleanest, most mechanical version of Chris Cady’s famous compression breakout strategy available on TradingView.
Happy trading!

Simple Grid Trading v1.0 [PUCHON]Simple Grid Trading v1.0
Overview
This is a Long-Only Grid Trading Strategy developed in Pine Script v6 for TradingView. It is designed to profit from market volatility by placing a series of Buy Limit orders at predefined price levels. As the price drops, the strategy accumulates positions. As the price rises, it sells these positions at a profit.
Features
Grid Types : Supports both Arithmetic (equal price spacing) and Geometric (equal percentage spacing) grids.
Flexible Order Management : Uses strategy.order for precise control and prevents duplicate orders at the same level.
Performance Dashboard : A real-time table displaying key metrics like Capital, Cashflow, and Drawdown.
Advanced Metrics : Includes Max Drawdown (MaxDD) , Avg Monthly Return , and CAGR calculations.
Customizable : Fully adjustable price range, grid lines, and lot size.
Dashboard Metrics
The dashboard (default: Bottom Right) provides a quick snapshot of the strategy's performance:
Initial Capital : The starting capital defined in the strategy settings.
Lot Size : The fixed quantity of assets purchased per grid level.
Avg. Profit per Grid : The average realized profit for each closed trade.
Cashflow : The total realized net profit (closed trades only).
MaxDD : Maximum Drawdown . The largest percentage drop in equity (realized + unrealized) from a peak.
Avg Monthly Return : The average percentage return generated per month.
CAGR : Compound Annual Growth Rate . The mean annual growth rate of the investment over the specified time period.
Strategy Settings (Inputs)
Grid Settings
Upper Price : The highest price level for the grid.
Lower Price : The lowest price level for the grid.
Number of Grid Lines : The total number of levels (lines) in the grid.
Grid Type :
Arithmetic: Distance between lines is fixed in price terms (e.g., $10, $20, $30).
Geometric: Distance between lines is fixed in percentage terms (e.g., 1%, 2%, 3%).
Lot Size : The fixed amount of the asset to buy at each level.
Dashboard Settings
Show Dashboard : Toggle to hide/show the performance table.
Position : Choose where the dashboard appears on the chart (e.g., Bottom Right, Top Left).
How It Works
Initialization : On the first bar, the script calculates the price levels based on your Upper/Lower price and Grid Type.
Entry Logic :
The strategy places Buy Limit orders at every grid level below the current price.
It checks if a position already exists at a specific level to avoid "stacking" multiple orders on the same line.
Exit Logic :
For every Buy order, a corresponding Sell Limit (Take Profit) order is placed at the next higher grid level.
MaxDD Calculation :
The script continuously tracks the highest equity peak.
It calculates the drawdown on every bar (including intra-bar movements) to ensure accuracy.
Displayed as a percentage (e.g., 5.25%).
Disclaimer
This script is for educational and backtesting purposes only. Grid trading involves significant risk, especially in strong trending markets where the price may move outside your grid range. Always use proper risk management.

Float Rotation TrackerFloat Rotation Tracker - Quick Reference Guide
What is Float Rotation?
Float Rotation = Cumulative Daily Volume ÷ Float
Example:
Float = 5,000,000 shares
Day Volume = 7,500,000 shares
Rotation = 7.5M ÷ 5M = 1.5x (150%)
When rotation hits 1x (100%), every available share has theoretically changed hands at least once during the trading day.
Why It Matters
RotationMeaningImplication0.5x50% of float tradedInterest building1.0x 🔥Full rotationExtreme interest confirmed2.0x 🔥🔥Double rotationVery high volatility3.0x 🔥🔥🔥Triple rotationRare - maximum volatility
Key insight: High rotation on a low-float stock = explosive potential
Float Classification
Float SizeClassificationRotation Impact≤ 2M🔥 MICROExtremely volatile, fast rotation≤ 5M🔥 VERY LOWExcellent momentum potential≤ 10MLOWGood for rotation plays> 10MNORMALNeeds massive volume to rotate
Rule of thumb: Focus on stocks with float under 10M for meaningful rotation signals.
Reading the Indicator
Rotation Line (Yellow)
Shows current rotation level
Rises throughout the day as volume accumulates
Crosses horizontal level lines at milestones
Level Lines
LineColorMeaning0.5Gray dotted50% rotation1.0Orange solidFull rotation2.0Red solidDouble rotation3.0Fuchsia solidTriple rotation
Volume Bars (Bottom)
ColorMeaningGrayBelow average volumeBlueNormal volume (1-2x avg)GreenHigh volume (2-5x avg)LimeExtreme volume (5x+ avg)
Milestone Markers
Circles appear when rotation crosses key levels
Labels show "50%", "1x", "2x", "3x🔥"
Background Color
Changes as rotation increases
Darker = higher rotation level
Info Table Explained
FieldDescriptionFloatShare count + classification (MICRO/LOW/NORMAL)SourceAuto ✓ = TradingView data / Manual = user enteredRotationCurrent rotation with emoji indicatorRotation %Same as rotation × 100Day VolumeCumulative volume todayTo XxVolume needed to reach next milestoneBar RVolCurrent bar's relative volumeMilestonesWhich levels have been hit todayPer RotationShares equal to one full rotationEst. TimeBars until next milestone (at current pace)
Trading with Float Rotation
Entry Signals
Early Entry (Higher Risk, Higher Reward)
Rotation approaching 0.5x
Strong price action (bull flag, breakout)
Rising relative volume bars
Confirmation Entry (Lower Risk)
Rotation at or above 1x
Price holding above VWAP
Continuous green/lime volume bars
Late Entry (Highest Risk)
Rotation above 2x
Only enter on clear pullback pattern
Tight stop required
Exit Signals
Warning Signs:
Rotation very high (2x+) with declining volume bars
Reversal candle after milestone
Price breaking below key support
Volume bars turning gray/blue after being green/lime
Take Profits:
Partial profit at each rotation milestone
Trail stop as rotation increases
Full exit on reversal pattern after 2x+ rotation
Best Setups
Ideal Float Rotation Play
✓ Float under 10M (preferably under 5M)
✓ Stock up 5%+ on the day
✓ News catalyst driving interest
✓ Rotation approaching or exceeding 1x
✓ Price above VWAP
✓ Volume bars green or lime
✓ Clear chart pattern (bull flag, flat top)
Red Flags to Avoid
✗ Float over 50M (hard to rotate meaningfully)
✗ Rotation high but price declining
✗ Volume bars turning gray after spike
✗ No clear catalyst
✗ Price below VWAP with high rotation
✗ Late in day (3pm+) after 2x rotation
Float Data Sources
If auto-detect doesn't work, get float from:
SourceHow to FindFinvizfinviz.com → ticker → "Shs Float"Yahoo FinanceFinance.yahoo.com → Statistics → "Float"MarketWatchMarketwatch.com → ticker → ProfileYour BrokerUsually in stock details/fundamentals
Note: Float can change due to offerings, buybacks, lockup expirations. Check recent data.
Settings Guide
Conservative Settings
Alert Level 1: 0.75 (75%)
Alert Level 2: 1.0 (100%)
Alert Level 3: 2.0 (200%)
Alert Level 4: 3.0 (300%)
High Vol Multiplier: 2.0
Extreme Vol Multiplier: 5.0
Aggressive Settings
Alert Level 1: 0.3 (30%)
Alert Level 2: 0.5 (50%)
Alert Level 3: 1.0 (100%)
Alert Level 4: 2.0 (200%)
High Vol Multiplier: 1.5
Extreme Vol Multiplier: 3.0
Alert Setup
Recommended Alerts
100% Rotation (1x) - Primary signal
Most important milestone
Confirms extreme interest
High Rotation + Extreme Volume
Combined condition
Very high probability signal
How to Set
Right-click chart → Add Alert
Condition: Float Rotation Tracker
Select desired milestone
Set notification (popup/email/phone)
Set expiration
Common Questions
Q: Why is my float showing "Manual (no data)"?
A: TradingView doesn't have float data for this stock. Enter the float manually in settings after looking it up on Finviz or Yahoo Finance.
Q: The rotation seems too high/low - is the float wrong?
A: Possibly. Cross-check float on Finviz. Recent offerings or share structure changes may not be reflected in TradingView's data.
Q: What if float rotates early in the day?
A: Early 1x rotation (within first hour) is very bullish - indicates massive interest. Watch for continuation patterns.
Q: High rotation but price is dropping?
A: This is distribution - large holders are selling into demand. High rotation doesn't guarantee price direction, just volatility.
Q: Can I use this for swing trading?
A: The indicator resets daily, so it's designed for intraday use. You could note multi-day rotation patterns manually.
Quick Decision Matrix
RotationPrice ActionVolumeDecision<0.5xStrong upHighWatch, early stage0.5-1xConsolidatingSteadyPrepare entry1x+Breaking outIncreasingEntry on pattern1x+DroppingHighAvoid - distribution2x+Strong upExtremePartial profit, trail stop2x+Reversal candleDecliningExit or avoid
Workflow Integration
MORNING ROUTINE:
1. Scan for gappers (5%+, high volume)
2. Check float on each candidate
3. Apply Float Rotation Tracker
4. Prioritize lowest float with building rotation
DURING SESSION:
5. Watch rotation levels on active trades
6. Enter on patterns when rotation confirms (0.5-1x)
7. Scale out as rotation increases
8. Exit or trail after 2x rotation
END OF DAY:
9. Note which stocks hit 2x+ rotation
10. Review rotation vs price action
11. Learn patterns for future trades
Combining with Other Indicators
IndicatorHow to Use Together5 PillarsScreen for low-float stocks firstGap & GoCheck rotation on gappersBull FlagEnter bull flags with 1x+ rotationVWAPOnly trade rotation plays above VWAPRSIWatch for divergence at high rotation
Key Takeaways
Float size matters - Lower float = faster rotation = more volatility
1x is the key level - Full rotation confirms extreme interest
Volume quality matters - Green/lime bars better than gray
Combine with price action - Rotation confirms, patterns trigger
Know when you're late - 2x+ rotation is late stage
Check your float data - Wrong float = wrong rotation calculation
Happy Trading! 🔥

BybitMinOrderSizeBybit Order Quantity Compliance Library
This library provides all utility functions required for TradingView strategies
that execute orders on Bybit via webhooks.
Problem:
Bybit enforces two strict rules on every order submitted:
Minimum Order Size – each symbol has its own minimum quantity.
Quantity Precision – each symbol requires rounding to the correct number of decimals.
TradingView does not expose this metadata, so strategies can easily submit
quantities that Bybit rejects as invalid.
Solution (This Library):
This library embeds full Bybit contract metadata, including:
A complete mapping of Bybit symbols → minimum order size
A complete mapping of Bybit symbols → allowed precision (decimal places)
A helper to normalize tickers (removing `.P` suffix for Bybit perpetuals)
It also exposes utility functions to automatically make your quantities valid:
`normalizeTicker()` — removes `.P` for consistent lookup
`getMinOrderSize()` — returns the correct minimum order size
`getPrecisionForTicker()` — returns required quantity precision
`floorQty()` — floors quantities to valid minimum increments
`roundQty()` — rounds quantities to valid decimal precision
Use Cases:
Ensuring webhook strategies never send too-small orders
Rounding limit/market orders correctly before execution
Making Pine strategies execution-accurate for Bybit
Avoiding "order rejected: qty too small / invalid precision" errors
This library is recommended for:
Live trading via TradingView → Bybit webhooks
Backtesting strategies that simulate real Bybit constraints
Source: www.bybit.com
Updated: 2025-11-25 — Bybit contract metadata
normalizeTicker(symbol)
Normalizes Bybit perpetual tickers by removing the ".P" suffix.
precisionFromMinOrder(minOrder)
Derives precision (decimal places) from minimum order size.
getMinOrderSize(symbol)
Retrieves the minimum order size for the current or given symbol.
getPrecisionForTicker(symbol)
Retrieves the required quantity precision (decimal places) for a given Bybit symbol.
floorQty(qty, symbol)
Rounds a quantity down to the nearest valid minimum order size for a given symbol.
roundQty(qty, symbol)
Rounds a quantity to the valid precision for the specified symbol.

EMA Trend Pro v1Here is a clear, professional English description you can copy-paste directly (suitable for sharing with friends, investors, brokers, or posting on TradingView):
EMA Trend Pro v5.0 – Strategy Overview
This is a trend-following strategy designed for 15-minute charts on assets like XAUUSD, NASDAQ, BTC, and ETH.
Entry Rules
Buy when the 7, 14, and 21-period EMAs are aligned upward and the 14-period EMA crosses above the 144-period EMA (with ADX > 20 and volume confirmation).
Sell short when the EMAs are aligned downward and the 14-period EMA crosses below the 144-period EMA.
Risk Management
Initial stop-loss is placed at 1.8 × ATR below (long) or above (short) the entry price.
Position size is calculated to risk a fixed percentage of equity per trade.
Profit-Taking & Trade Management
When price reaches 1:1 reward-to-risk, 30% of the position is closed.
At the same moment, the stop-loss for the remaining 70% is moved to the entry price (breakeven).
The remaining position is split:
50% targets 1:2 reward-to-risk
50% targets 1:3 reward-to-risk (allowing big wins during strong trends)
Visualization
Clean colored bars extend to the right showing entry, stop-loss, and three take-profit levels.
Price labels clearly display "Entry", "SL", "TP1 1:1", "TP2 1:2", and "TP3 1:3".
Only the current trade is displayed for a clean chart.
Key Advantages
High win rate due to breakeven protection after 1R
Excellent reward-to-risk ratio that lets winners run
Fully automated, works on any market with clear trends
Professional look, easy to understand and explain
Perfect for swing traders who want consistent profits with limited downside risk.
Feel free to use this description on TradingView, in your trading journal, or when explaining the strategy to others!
If you want a shorter version (e.g., for TradingView description box) or a Chinese version, just let me know — I’ll give it to you right away! 😊

EMA Trend Pro v5.0 5M ONLY — 策略版(1:1出30%+保本)Here is a clear, professional English description you can copy-paste directly (suitable for sharing with friends, investors, brokers, or posting on TradingView):
EMA Trend Pro v5.0 – Strategy Overview
This is a trend-following strategy designed for 15-minute charts on assets like XAUUSD, NASDAQ, BTC, and ETH.
Entry Rules
Buy when the 7, 14, and 21-period EMAs are aligned upward and the 14-period EMA crosses above the 144-period EMA (with ADX > 20 and volume confirmation).
Sell short when the EMAs are aligned downward and the 14-period EMA crosses below the 144-period EMA.
Risk Management
Initial stop-loss is placed at 1.8 × ATR below (long) or above (short) the entry price.
Position size is calculated to risk a fixed percentage of equity per trade.
Profit-Taking & Trade Management
When price reaches 1:1 reward-to-risk, 30% of the position is closed.
At the same moment, the stop-loss for the remaining 70% is moved to the entry price (breakeven).
The remaining position is split:
50% targets 1:2 reward-to-risk
50% targets 1:3 reward-to-risk (allowing big wins during strong trends)
Visualization
Clean colored bars extend to the right showing entry, stop-loss, and three take-profit levels.
Price labels clearly display "Entry", "SL", "TP1 1:1", "TP2 1:2", and "TP3 1:3".
Only the current trade is displayed for a clean chart.
Key Advantages
High win rate due to breakeven protection after 1R
Excellent reward-to-risk ratio that lets winners run
Fully automated, works on any market with clear trends
Professional look, easy to understand and explain
Perfect for swing traders who want consistent profits with limited downside risk.
Feel free to use this description on TradingView, in your trading journal, or when explaining the strategy to others!
If you want a shorter version (e.g., for TradingView description box) or a Chinese version, just let me know — I’ll give it to you right away! 😊

Dynamic Fair-Value Ribbon Pro @darshakssc1. What This Indicator Is (In Simple Terms)
The Dynamic Fair-Value Ribbon Pro is a visual tool that helps you see how price behaves around a statistically derived “fair-value zone”:
A colored ribbon/cloud marks a central “fair” area.
Areas above the ribbon are labeled as “Unfair High Zone”.
Areas below the ribbon are labeled as “Unfair Low Zone”.
A small state panel tells you where price currently sits relative to this ribbon.
All calculations are based only on historical price, volume, and volatility.
It does not predict future price, does not give buy/sell signals, and is not financial advice.
2. Adding the Indicator
Open a chart on TradingView.
Click on Indicators .
Search for “Dynamic Fair-Value Ribbon Pro” .
Click to add it to your chart.
You will see:
A cloud/ribbon around price.
Colored bars when price is outside the ribbon.
A panel in the top right describing the current state.
3. Core Concept: Fair vs Unfair Zones (Analytical Only)
The indicator tries to answer a descriptive question:
“Where is price trading relative to a historically derived central area?”
It does this by:
Calculating a central value (“fair mid”).
Building a band around that mid.
Coloring the chart depending on whether price is inside or outside that band.
It is not claiming that:
Price “must” return to the band.
Price is “overvalued” or “undervalued”.
Any state is good or bad.
It is simply a visual classification tool .
4. Engine Modes — How the Ribbon Is Calculated
Under “Fair-Value Engine” you can choose:
4.1 Mode 1: Range
Looks back over a chosen number of bars (default: 100).
Finds the highest high and lowest low in that window.
Defines a central “slice” of that range as the fair-value ribbon :
Range Mode: Lower Percent → bottom boundary of the slice (e.g., 30%).
Range Mode: Upper Percent → top boundary of the slice (e.g., 70%).
Effect:
The ribbon represents a middle portion of the historical range .
Above the ribbon = “Unfair High Zone” (analytical label only).
Below the ribbon = “Unfair Low Zone”.
This is purely statistical — it does not mean price is wrong or will revert.
4.2 Mode 2: VWAP + Stdev
In this mode, the central value is based on VWAP :
VWAP (Volume-Weighted Average Price) is used as the midline.
A standard deviation envelope is built around VWAP:
VWAP Mode: Stdev Multiplier controls how wide that envelope is.
Effect:
The ribbon shows where price is trading relative to a volume-weighted average .
Again, areas above and below are just described as “unfair” zones in a visual, analytical sense , not a predictive one.
5. ATR Adaptive Width — Making the Ribbon React to Volatility
Under “ATR Adaptive Width” :
Use ATR Adaptive Width:
On: the band width scales with volatility.
Off: band width stays fixed based on Range or VWAP settings.
ATR Length: how many bars to use for ATR.
Reference ATR (% of price): a reference level for normal volatility.
Min Width Scale / Max Width Scale: clamps the scaling so that the band doesn’t get too narrow or too wide.
What this does (analytically):
When volatility (ATR) is higher than the reference, the band can become wider .
When volatility is lower , the band can become narrower .
This is a mathematical rescaling only and does not imply any optimal levels or performance.
6. Visual Elements — What You See on the Chart
6.1 Fair-Value Ribbon (Cloud)
The cloud between Fair Ribbon Low and Fair Ribbon High is the fair zone .
Color can be changed via “Fair Ribbon Color” .
6.2 Midline
If “Show Center Line” is enabled:
A line runs through the middle of the ribbon.
In Range mode, this is the average of the upper and lower band.
In VWAP mode, it’s essentially the VWAP-based mid.
This line is for visual reference only and makes no claims about support, resistance, or reversion.
6.3 Bar Colors
Unfair High Zone: bars are colored with Unfair High Bar Color.
Unfair Low Zone: bars are colored with Unfair Low Bar Color.
Inside the ribbon:
If “Fade Bars Inside Fair Zone” is ON, bars may be more faded/neutral.
These colors are simply classification highlights ; they do not tell you what to do.
6.4 State Panel (Top Right)
If “Show State Panel” is enabled, you’ll see a small box that displays:
Current engine:
Range or VWAP+Stdev.
Current price state:
Inside Ribbon (Fair Zone)
Above Ribbon (Unfair High Zone)
Below Ribbon (Unfair Low Zone)
This is a quick summary of where price sits relative to the computed ribbon.
7. Typical Ways to Use It (Informational Only)
The indicator can help you visually:
See when price is spending time inside a historically defined central zone.
Notice when price is frequently trading outside that zone.
Compare different timeframes (e.g., 5m vs 1h vs 4h) to see how the fair zone shifts.
Experiment with:
Range length (shorter vs longer lookback).
VWAP vs Range mode.
ATR adaptation on/off.
Important:
Any interpretation of these visuals is entirely up to the user.
The script does not tell you to buy, sell, hold, or do anything specific.
8. Limitations and Important Notes
All calculations use past data only (price, volume, volatility).
The ribbon does not guarantee:
that price will revert,
that zones will hold,
or that any outcome will occur.
There are no built-in signals such as “long/short” or automatic entries/exits.
The script is best used as a supporting, visual layer alongside other tools or methods you choose.
9. Disclaimer
This indicator is:
Strictly informational and educational.
Not a trading system or strategy.
Not financial advice or a recommendation.
Not guaranteed to be accurate, complete, or suitable for any specific purpose.
Users should always perform their own research and due diligence.
Past behavior of any visual pattern or zone does not guarantee future behavior.

ATR multiple from High & LowA simple numerical indicator measuring ATR multiple from recent 252 days high and low.
ATR multiples from high (and low) are used as a base in many systematic trading and trend following systems. As an example many systems buy after a 2.5–4 ATR multiple pullback in a strong stock if the regime allows it. This would then be paired with an entry tactic, for example buy as it recaptures the a pivot within the upper range, a MA or breaks out again after this mid term pullback/shakeout.
This indicator uses a function which captures the recent high and low no matter if we have 252 bars or not, which is not how standard high/low works in Tradingview. This means it also works with recent IPO:s.
I prefer to overlay the indicator in one of the lower panes, for example the volume pane and then right click on the indicator and select Pin to scale > No scale (fullscreen).

Understand Daily ATR & SDTR Context on SPXWHY
Every trader needs clarity.
Markets move quickly, volatility shifts without warning, and daily price action often feels chaotic unless you understand the context behind it.
When you know where you are inside the day’s expected range and volatility environment, decision-making becomes more objective, disciplined, and confident.
That’s the purpose of this tool:
to give traders a clearer sense of intraday reality so they can act with intention instead of impulse.
________________________________________
HOW
It does this by anchoring each session to a set of objective, volatility-based reference points:
• Daily ATR projections that outline the day’s typical movement range
• A standardized deviation envelope (SDTR) that highlights areas of expansion or exhaustion
• RTH-aligned resets, so the levels refresh cleanly at the start of each session
These elements work together to form a steady, unbiased framework around each trading day.
________________________________________
WHAT
The result is a daily ATR + SDTR context overlay, now available free on TradingView.
It provides:
• Expected daily high/low zones based on smoothed ATR
• A volatility shell around the prior close
• Daily context levels that reset automatically at each RTH open
• A clean, unobtrusive visual guide for interpreting intraday price behavior
It works on any intraday timeframe and integrates seamlessly with your existing workflow — structure, VWAP, volume analysis, price action, Fibonacci levels, or your preferred set of signals.
This isn’t a trading system.
It’s a lens — designed to help traders see the day more clearly.

Nifty50 Sector Weightage PerformanceNifty50 Sector Weightage Performance is a comprehensive market analysis indicator that visualizes the composition and daily performance of all 15 sectors in the Nifty 50 index. This powerful tool provides real-time insights into sector movements, helping traders and investors identify market trends, understand sector rotation, and make informed trading decisions.
The indicator combines sector weightage data with daily percentage changes to calculate a weighted market sentiment score, displayed through an intuitive visual progress bar that indicates whether the market is moving towards bullish or bearish territory.
Comprehensive Sector Coverage
- Tracks all 15 sectors of the Nifty 50 index. Some broad indices because of request limit on Tradingview.
- Displays real-time sector weights and daily percentage changes
- Color-coded visualization for quick performance assessment
Complete Sector Breakdown
1. Financial Services (36.76%)
- Symbol: NSE:BANKNIFTY
- Largest sector in Nifty 50
- Uses Bank Nifty index for comprehensive financial sector representation
2. Oil, Gas & Consumable Fuels (10.26%)
- Individual Stocks(weighted average):
- RELIANCE (8.71%)
- ONGC (0.81%)
- COALINDIA (0.74%)
3. Information Technology (9.98%)
- Symbol: NSE:CNXIT
- Represents IT sector performance through CNX IT index
4. Automobile & Auto Components (6.83%)
- Individual Stocks (weighted average):
- M&M (Mahindra & Mahindra) - 2.77%
- BAJAJ_AUTO (Bajaj Auto) - 0.84%
- EICHERMOT (Eicher Motors) - 0.79%
- MARUTI (Maruti Suzuki) - 1.77%
- TATAMOTORS (Tata Motors) - 0.66%
5. Fast Moving Consumer Goods (6.52%)
- Symbol: NSE:CNXFMCG
- Uses CNX FMCG index for consumer goods sector
6. Telecommunication (4.96%)
- Symbol: NSE:BHARTIARTL
- Uses Bharti Airtel as representative stock
7. Healthcare (4.27%)
- Symbol: NSE:CNXPHARMA
- Pharmaceutical sector represented by CNX Pharma index
8. Construction (3.98%)
- Symbol: NSE:LT
- Uses Larsen & Toubro as representative stock
9. Metals & Mining (3.64%)
- Symbol: NSE:CNXMETAL
- Metals sector through CNX Metal index
10. Consumer Services (2.63%)
- Individual Stocks (weighted average):
- ETERNAL (Eternal) - 1.8%
- TRENT (Trent) - 0.82%
11. Consumer Durables (2.47%)
- Individual Stocks (weighted average):
- TITAN (Titan Company) - 1.36%
- ASIANPAINT (Asian Paints) - 1.11%
12. Power (2.37%)
- Individual Stocks (weighted average):
- NTPC (NTPC Limited) - 1.32%
- POWERGRID (Power Grid Corporation) - 1.05%
13. Construction Materials (2.07%)
- Individual Stocks (weighted average):
- ULTRACEMCO (UltraTech Cement) - 1.18%
- GRASIM (Grasim Industries) - 0.89%
14. Services (2.00%)
- Individual Stocks (weighted average):
- INDIGO (Interglobe Aviation) - 1.06%
- ADANIPORTS (Adani Ports) - 0.93%
15. Capital Goods (1.28%)
- Individual Stock:
- BEL (Bharat Electronics) - 1.28%
Sector Performance Calculation
- Single Index Sectors: Uses direct index/symbol percentage change
- Multi-Stock Sectors: Calculates weighted average based on individual stock weights and their percentage changes
- Formula: Weighted Average = Σ(Stock Weight × Stock % Change) / Total Sector Weight
Data Source
Nifty 50 Index: www.niftyindices.com

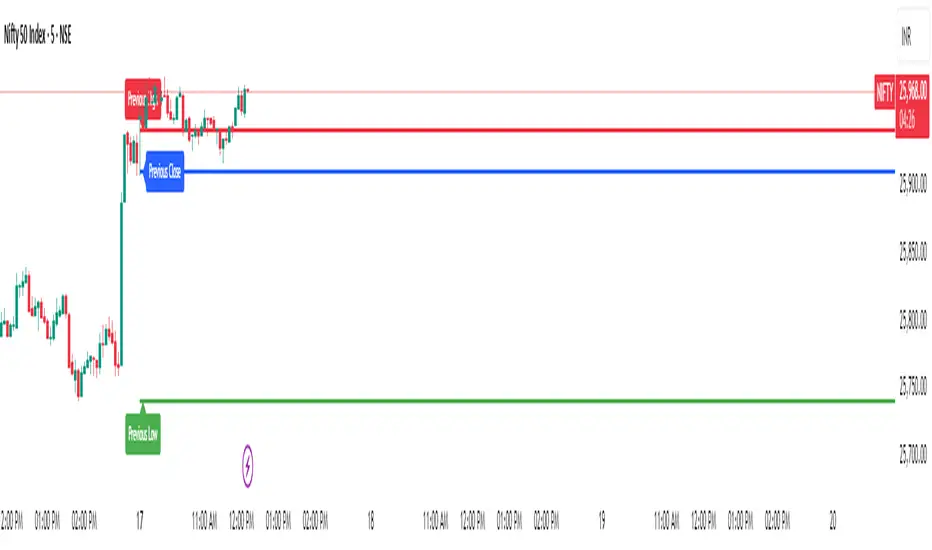
Previous Day Levels @darshaksscThis indicator provides intraday traders and analysts with immediate visual reference to the previous day's high, low, and close. These historical price levels are frequently watched by market participants for potential reaction, context, and session structure.
How to Add the Indicator:
Open any chart on TradingView.
Click the Indicators button at the top.
Search for “Previous Day Levels @darshakssc” in the Public Library.
Click the ★ Favorite icon if you wish to save it for quick access in the future.
Click the indicator’s name to add it to your chart.
The lines and labels will appear automatically on any intraday timeframe.
What You Will See:
Previous day’s High (red line and label: “Previous High”).
Previous day’s Low (green line and label: “Previous Low”).
Previous day’s Close (blue line and label: “Previous Close”).
These are drawn automatically at each new session and remain visible throughout today’s trading.
Usage:
Use these levels as reference points for context, risk placement, or understanding shifts in session structure.
Watch for price interactions, rejections, or consolidations around these lines—they often act as support/resistance for many trading strategies.
No signals or trade advice are provided by this tool. All decisions are made manually by the trader.
Features:
Persistent, color-coded horizontal lines and clear, small labels.
No alerts, buy/sell arrows, or any indication of trading performance.
Fully automated for each new session—no action required from the user after adding.
Disclaimer:
This indicator is intended for informational and charting purposes only. It is not financial advice or a buy/sell recommendation. Always perform your own due diligence before making trading decisions.
NormalizedIndicatorsNormalizedIndicators Library - Comprehensive Trend Normalization & Pre-Calibrated Systems
Overview
The NormalizedIndicators Library is an advanced Pine Script™ collection that provides normalized trend-following indicators, calculation functions, and pre-calibrated consensus systems for technical analysis. This library extends beyond simple indicator normalization by offering battle-tested, optimized parameter sets for specific assets and timeframes.
The main advantage lies in its dual functionality:
Individual normalized indicators with standardized outputs (1 = bullish, -1 = bearish, 0 = neutral)
Pre-calibrated consensus functions that combine multiple indicators with asset-specific optimizations
This enables traders to either build custom strategies using individual indicators or leverage pre-optimized systems designed for specific markets.
📊 Library Structure
The library is organized into three main sections:
1. Trend-Following Indicators
Individual indicators normalized to standard output format
2. Calculation Indicators
Statistical and mathematical analysis functions
3. Pre-Calibrated Systems ⭐ NEW
Asset-specific consensus configurations with optimized parameters
🔄 Trend-Following Indicators
Stationary Indicators
These oscillate around a fixed value and are not bound to price.
TSI() - True Strength Index ⭐ NEW
Source: TradingView
Parameters:
price: Price source
long: Long smoothing period
short: Short smoothing period
signal: Signal line period
Logic: Double-smoothed momentum oscillator comparing TSI to its signal line
Signal:
1 (bullish): TSI ≥ TSI EMA
0 (bearish): TSI < TSI EMA
Use Case: Momentum confirmation with trend direction
SMI() - Stochastic Momentum Index ⭐ NEW
Source: TradingView
Parameters:
src: Price source
lengthK: Stochastic period
lengthD: Smoothing period
lengthEMA: Signal line period
Logic: Enhanced stochastic that measures price position relative to midpoint of high/low range
Signal:
1 (bullish): SMI ≥ SMI EMA
0 (bearish): SMI < SMI EMA
Use Case: Overbought/oversold with momentum direction
BBPct() - Bollinger Bands Percent
Source: Algoalpha X Sushiboi77
Parameters:
Length: Period for Bollinger Bands
Factor: Standard deviation multiplier
Source: Price source (typical: close)
Logic: Calculates the position of price within the Bollinger Bands as a percentage
Signal:
1 (bullish): when positionBetweenBands > 50
-1 (bearish): when positionBetweenBands ≤ 50
Special Feature: Uses an array to store historical standard deviations for additional analysis
RSI() - Relative Strength Index
Source: TradingView
Parameters:
len: RSI period
src: Price source
smaLen: Smoothing period for RSI
Logic: Classic RSI with additional SMA smoothing
Signal:
1 (bullish): RSI-SMA > 50
-1 (bearish): RSI-SMA < 50
0 (neutral): RSI-SMA = 50
Non-Stationary Indicators
These follow price movement and have no fixed boundaries.
NorosTrendRibbonSMA() & NorosTrendRibbonEMA()
Source: ROBO_Trading
Parameters:
Length: Moving average and channel period
Source: Price source
Logic: Creates a price channel based on the highest/lowest MA value over a specified period
Signal:
1 (bullish): Price breaks above upper band
-1 (bearish): Price breaks below lower band
0 (neutral): Price within channel (maintains last state)
Difference: SMA version uses simple moving averages, EMA version uses exponential
TrendBands()
Source: starlord_xrp
Parameters: src (price source)
Logic: Uses 12 EMAs (9-30 period) and checks if all are rising or falling simultaneously
Signal:
1 (bullish): All 12 EMAs are rising
-1 (bearish): All 12 EMAs are falling
0 (neutral): Mixed signals
Special Feature: Very strict conditions - extremely strong trend filter
Vidya() - Variable Index Dynamic Average
Source: loxx
Parameters:
source: Price source
length: Main period
histLength: Historical period for volatility calculation
Logic: Adaptive moving average that adjusts to volatility
Signal:
1 (bullish): VIDYA is rising
-1 (bearish): VIDYA is falling
VZO() - Volume Zone Oscillator
Parameters:
source: Price source
length: Smoothing period
volumesource: Volume data source
Logic: Combines price and volume direction, calculates the ratio of directional volume to total volume
Signal:
1 (bullish): VZO > 14.9
-1 (bearish): VZO < -14.9
0 (neutral): VZO between -14.9 and 14.9
TrendContinuation()
Source: AlgoAlpha
Parameters:
malen: First HMA period
malen1: Second HMA period
theclose: Price source
Logic: Uses two Hull Moving Averages for trend assessment with neutrality detection
Signal:
1 (bullish): Uptrend without divergence
-1 (bearish): Downtrend without divergence
0 (neutral): Trend and longer MA diverge
LeonidasTrendFollowingSystem()
Source: LeonidasCrypto
Parameters:
src: Price source
shortlen: Short EMA period
keylen: Long EMA period
Logic: Simple dual EMA crossover system
Signal:
1 (bullish): Short EMA < Key EMA
-1 (bearish): Short EMA ≥ Key EMA
ysanturtrendfollower()
Source: ysantur
Parameters:
src: Price source
depth: Depth of Fibonacci weighting
smooth: Smoothing period
bias: Percentage bias adjustment
Logic: Complex system with Fibonacci-weighted moving averages and bias bands
Signal:
1 (bullish): Weighted MA > smoothed MA (with upward bias)
-1 (bearish): Weighted MA < smoothed MA (with downward bias)
0 (neutral): Within bias zone
TRAMA() - Trend Regularity Adaptive Moving Average
Source: LuxAlgo
Parameters:
src: Price source
length: Adaptation period
Logic: Adapts to trend regularity - accelerates in stable trends, slows in consolidations
Signal:
1 (bullish): Price > TRAMA
-1 (bearish): Price < TRAMA
0 (neutral): Price = TRAMA
HullSuite()
Source: InSilico
Parameters:
_length: Base period
src: Price source
_lengthMult: Length multiplier
Logic: Uses Hull Moving Average with lagged comparisons for trend determination
Signal:
1 (bullish): Current Hull > Hull 2 bars ago
-1 (bearish): Current Hull < Hull 2 bars ago
0 (neutral): No change
STC() - Schaff Trend Cycle
Source: shayankm (described as "Better MACD")
Parameters:
length: Cycle period
fastLength: Fast MACD period
slowLength: Slow MACD period
src: Price source
Logic: Combines MACD concepts with stochastic normalization for early trend signals
Signal:
1 (bullish): STC is rising
-1 (bearish): STC is falling
🧮 Calculation Indicators
These functions provide specialized mathematical calculations for advanced analysis.
LCorrelation() - Long-term Correlation
Creator: unicorpusstocks
Parameters:
Input: First time series
Compare: Second time series
Logic: Calculates the average of correlations across 6 different periods (30, 60, 90, 120, 150, 180)
Returns: Correlation value between -1 and 1
Application: Long-term relationship analysis between assets, markets, or indicators
MCorrelation() - Medium-term Correlation
Creator: unicorpusstocks
Parameters:
Input: First time series
Compare: Second time series
Logic: Calculates the average of correlations across 6 different periods (15, 30, 45, 60, 75, 90)
Returns: Correlation value between -1 and 1
Application: Medium-term relationship analysis with higher sensitivity
assetBeta() - Beta Coefficient
Creator: unicorpusstocks
Parameters:
measuredSymbol: The asset to be measured
baseSymbol: The reference asset (e.g., market index)
Logic:
Calculates Beta across 4 different time horizons (50, 100, 150, 200 periods)
Beta = Correlation × (Asset Standard Deviation / Market Standard Deviation)
Returns the average of all 4 Beta values
Returns: Beta value (typically 0-2, can be higher/lower)
Interpretation:
Beta = 1: Asset moves in sync with the market
Beta > 1: Asset more volatile than market
Beta < 1: Asset less volatile than market
Beta < 0: Asset moves inversely to the market
🎯 Pre-Calibrated Systems ⭐ NEW FEATURE
These are ready-to-use consensus functions with optimized parameters for specific assets and timeframes. Each calibration has been fine-tuned through extensive backtesting to provide optimal performance for its target market.
Universal Calibrations
virtual_4d_cal(src) - Virtual/General 4-Day Timeframe
Use Case: General purpose 4-day chart analysis
Optimized For: Broad crypto market on 4D timeframe
Indicators Used: BBPct, Noro's, RSI, VIDYA, HullSuite, TrendContinuation, Leonidas, TRAMA
Characteristics: Balanced sensitivity for swing trading
virtual_1d_cal(src) - Virtual/General 1-Day Timeframe
Use Case: General purpose daily chart analysis
Optimized For: Broad crypto market on 1D timeframe
Indicators Used: BBPct, Noro's, RSI, VIDYA, HullSuite, TrendContinuation, Leonidas, TRAMA
Characteristics: Standard daily trading parameters
Cryptocurrency Specific
sui_cal(src) - SUI Ecosystem Tokens
Use Case: Tokens in the SUI blockchain ecosystem
Timeframe: 1D
Characteristics: Fast-response parameters for high volatility projects
deep_1d_cal(src) - DEEP Token Daily
Use Case: Deepbook (DEEP) token analysis
Timeframe: 1D
Characteristics: Tuned for liquidity protocol token behavior
wal_1d_cal(src) - WAL Token Daily
Use Case: Specific for WAL token
Timeframe: 1D
Characteristics: Mid-range sensitivity parameters
sns_1d_cal(src) - SNS Token Daily
Use Case: Specific for SNS token
Timeframe: 1D
Characteristics: Balanced parameters for DeFi tokens
meme_cal(src) - Meme Coin Calibration
Use Case: Highly volatile meme coins
Timeframe: Various
Characteristics: Wider parameters to handle extreme volatility
Warning: Meme coins carry extreme risk
base_cal(src) - BASE Ecosystem Tokens
Use Case: Tokens on the BASE blockchain
Timeframe: Various
Characteristics: Optimized for L2 ecosystem tokens
Solana Ecosystem
sol_4d_cal(src) - Solana 4-Day
Use Case: SOL token on 4-day charts
Characteristics: Responsive parameters for major L1 blockchain
sol_meme_4d_cal(src) - Solana Meme Coins 4-Day
Use Case: Meme coins on Solana blockchain
Timeframe: 4D
Characteristics: Handles high volatility of Solana meme sector
Ethereum Ecosystem
eth_4d_cal(src) - Ethereum 4-Day
Use Case: ETH and major ERC-20 tokens
Timeframe: 4D
Indicators Used: BBPct, Noro's, RSI, TSI, HullSuite, TrendContinuation, Leonidas, SMI
Special: Uses TSI and SMI instead of VIDYA and TRAMA
Characteristics: Tuned for Ethereum's market cycles
Bitcoin
btc_4d_cal(src) - Bitcoin 4-Day
Use Case: Bitcoin on 4-day charts
Timeframe: 4D
Characteristics: Slower, smoother parameters for the most established crypto asset
Notes: Conservative parameters suitable for position trading
Traditional Markets
qqq_4d_cal(src) - QQQ (Nasdaq-100 ETF) 4-Day
Use Case: QQQ ETF and tech-heavy indices
Timeframe: 4D
Characteristics: Largest parameter sets reflecting lower volatility of traditional markets
Notes: Can be adapted for similar large-cap tech indices
💡 Usage Examples
Example 1: Using Pre-Calibrated System
pinescriptimport unicorpusstocks/NormalizedIndicators/1 as lib
// Simple one-line implementation for Bitcoin
btcSignal = lib.btc_4d_cal(close)
// Trading logic
longCondition = btcSignal > 0.5
shortCondition = btcSignal < -0.5
// Plot
plot(btcSignal, "BTC 4D Consensus", color.orange)
Example 2: Custom Multi-Indicator Consensus
pinescriptimport unicorpusstocks/NormalizedIndicators/1 as lib
// Build your own combination
signal1 = lib.BBPct(20, 2.0, close)
signal2 = lib.RSI(14, close, 5)
signal3 = lib.TRAMA(close, 50)
signal4 = lib.TSI(close, 25, 13, 13)
// Custom consensus
customConsensus = math.avg(signal1, signal2, signal3, signal4)
plot(customConsensus, "Custom Consensus", color.blue)
Example 3: Asset-Specific Strategy Switching
pinescriptimport unicorpusstocks/NormalizedIndicators/1 as lib
// Automatically use the right calibration
signal = switch syminfo.ticker
"BTCUSD" => lib.btc_4d_cal(close)
"ETHUSD" => lib.eth_4d_cal(close)
"SOLUSD" => lib.sol_4d_cal(close)
"QQQ" => lib.qqq_4d_cal(close)
=> lib.virtual_4d_cal(close) // Default
plot(signal, "Auto-Calibrated Signal", color.orange)
Example 4: Correlation-Filtered Trading
pinescriptimport unicorpusstocks/NormalizedIndicators/1 as lib
// Only trade when strong correlation with market exists
spy = request.security("SPY", timeframe.period, close)
correlation = lib.MCorrelation(close, spy)
trendSignal = lib.virtual_1d_cal(close)
// Only signals with positive market correlation
tradeBuy = trendSignal > 0.5 and correlation > 0.5
tradeSell = trendSignal < -0.5 and correlation > 0.5
Example 5: Beta-Adjusted Position Sizing
pinescriptimport unicorpusstocks/NormalizedIndicators/1 as lib
spy = request.security("SPY", timeframe.period, close)
beta = lib.assetBeta(close, spy)
// Adjust position size based on Beta
basePositionSize = 100
adjustedSize = basePositionSize / beta // Less size with high Beta
// Use with calibrated signal
signal = lib.qqq_4d_cal(close)
🎯 Choosing the Right Calibration
Decision Tree
1. What asset are you trading?
Bitcoin → btc_4d_cal()
Ethereum/ERC-20 → eth_4d_cal()
Solana → sol_4d_cal()
Solana memes → sol_meme_4d_cal()
SUI ecosystem → sui_cal()
BASE ecosystem → base_cal()
Meme coins (any chain) → meme_cal()
QQQ/Tech indices → qqq_4d_cal()
Other/General → virtual_4d_cal() or virtual_1d_cal()
2. What timeframe?
Most calibrations are optimized for 4D (4-day) or 1D (daily)
For other timeframes, start with virtual calibrations and adjust
3. What's the asset's volatility?
High volatility (memes, new tokens) → Use meme_cal() or similar
Medium volatility (established alts) → Use specific calibrations
Low volatility (BTC, major indices) → Use btc_4d_cal() or qqq_4d_cal()
⚙️ Technical Details
Normalization Standard
Bullish: 1
Bearish: -1
Neutral: 0 (only for selected indicators)
Calibration Methodology
Pre-calibrated functions were optimized using:
Historical backtesting on target assets
Parameter optimization for maximum Sharpe ratio
Validation on out-of-sample data
Real-time forward testing
Iterative refinement based on market conditions
Advantages of Pre-Calibrations
Instant Deployment: No parameter tuning needed
Asset-Optimized: Tailored to specific market characteristics
Tested Performance: Validated through extensive backtesting
Consistent Framework: All use the same 8-indicator structure
Easy Comparison: Compare different assets using same methodology
Performance Considerations
All functions are optimized for Pine Script v5
Proper use of var for state management
Efficient array operations where needed
Minimal recursive calls
Pre-calibrations add negligible computational overhead
📋 License
This code is subject to the Mozilla Public License 2.0 at mozilla.org
🔧 Installation
pinescriptimport unicorpusstocks/NormalizedIndicators/1
Then use functions with your chosen alias:
pinescript// Individual indicators
lib.BBPct(20, 2.0, close)
lib.RSI(14, close, 5)
lib.TSI(close, 25, 13, 13)
// Pre-calibrated systems
lib.btc_4d_cal(close)
lib.eth_4d_cal(close)
lib.meme_cal(close)
⚠️ Important Notes
General Usage
All indicators are lagging, as is typical for trend-following indicators
Signals should be combined with additional analysis (volume, support/resistance, etc.)
Backtesting is recommended before starting live trading with these signals
Different assets and timeframes may require different parameter optimizations
Pre-Calibrated Systems
Calibrations are optimized for specific timeframes - using them on different timeframes may reduce effectiveness
Market conditions change - what worked historically may need adjustment
Pre-calibrations are starting points, not guaranteed solutions
Always validate performance on your specific use case
Consider current market regime (trending vs. ranging)
Risk Management
Meme coin calibrations are designed for extremely volatile assets - use appropriate position sizing
Pre-calibrated systems do not eliminate risk
Always use stop losses and proper risk management
Past performance does not guarantee future results
Customization
Pre-calibrations can serve as templates for your own optimizations
Feel free to adjust individual parameters within calibration functions
Test modifications thoroughly before live deployment
🎓 Advanced Use Cases
Multi-Asset Portfolio Dashboard
Create a dashboard showing consensus across different assets:
pinescriptimport unicorpusstocks/NormalizedIndicators/1 as lib
btc = request.security("BTCUSD", "4D", close)
eth = request.security("ETHUSD", "4D", close)
sol = request.security("SOLUSD", "4D", close)
btcSignal = lib.btc_4d_cal(btc)
ethSignal = lib.eth_4d_cal(eth)
solSignal = lib.sol_4d_cal(sol)
// Plot all three for comparison
plot(btcSignal, "BTC", color.orange)
plot(ethSignal, "ETH", color.blue)
plot(solSignal, "SOL", color.purple)
Regime Detection
Use correlation and calibrations together:
pinescriptimport unicorpusstocks/NormalizedIndicators/1 as lib
// Detect market regime
btc = request.security("BTCUSD", timeframe.period, close)
correlation = lib.MCorrelation(close, btc)
// Choose strategy based on correlation
signal = correlation > 0.7 ? lib.btc_4d_cal(close) : lib.virtual_4d_cal(close)
Comparative Analysis
Compare asset-specific vs. general calibrations:
pinescriptimport unicorpusstocks/NormalizedIndicators/1 as lib
specificSignal = lib.btc_4d_cal(close) // BTC-specific
generalSignal = lib.virtual_4d_cal(close) // General
divergence = specificSignal - generalSignal
plot(divergence, "Calibration Divergence", color.yellow)
🚀 Quick Start Guide
For Beginners
Identify Your Asset: What are you trading?
Find the Calibration: Use the decision tree above
One-Line Implementation: signal = lib.btc_4d_cal(close)
Set Thresholds: Buy when > 0.5, sell when < -0.5
Add Risk Management: Always use stops
For Advanced Users
Start with Pre-Calibration: Use as baseline
Analyze Performance: Backtest on your specific market
Fine-Tune Parameters: Adjust individual indicators if needed
Combine with Other Signals: Volume, market structure, etc.
Create Custom Calibrations: Build your own based on library structure
For Developers
Import Library: Access all functions
Mix and Match: Combine indicators creatively
Build Custom Logic: Use indicators as building blocks
Create New Calibrations: Follow the established pattern
Share and Iterate: Contribute to the trading community
🎯 Key Takeaways
✅ 10 normalized indicators - Consistent interpretation across all
✅ 16+ pre-calibrated systems - Ready-to-use for specific assets
✅ Asset-optimized parameters - No guesswork required
✅ Calculation functions - Advanced correlation and beta analysis
✅ Universal framework - Works across crypto, stocks, forex
✅ Professional-grade - Built on proven technical analysis principles
✅ Flexible architecture - Use pre-calibrations or build your own
✅ Battle-tested - Validated through extensive backtesting
NormalizedIndicators Library transforms complex multi-indicator analysis into actionable signals through both customizable individual indicators and pre-optimized consensus systems. Whether you're a beginner looking for plug-and-play solutions or an advanced trader building sophisticated strategies, this library provides the foundation for data-driven trading decisions.WiederholenClaude kann Fehler machen. Bitte überprüfen Sie die Antworten. Sonnet 4.5

5 Moving Averages – Custom Trend Colors + No Neutral Mode5 Moving Averages Pro – Custom Trend Colors + No Neutral Mode
The cleanest and most professional 5-MA bundle on TradingView.
Features:
• 5 fully customizable moving averages (period + type: SMA, EMA, WMA, HMA, VWMA)
• All 5 MAs instantly change color based on global trend:
– Green → price above ALL 5 MAs (strong bullish)
– Red → price below ALL 5 MAs (strong bearish)
– Optional neutral gray (or completely disable neutral mode)
• Fully customizable bullish, bearish and neutral colors
• Optional background coloring (very light & clean)
• Trend change arrows (only on real bullish/bearish confirmation)
• "No Neutral" mode → forces green/red even in sideways markets (price vs average of the 5 MAs)
Perfect for:
• Trend-following systems
• Clean chart setups
• Scalping, day trading & swing trading
• Confirming institutional bias
Zero repainting | Super lightweight | Works on all timeframes & markets
One of the most loved multi-MA indicators worldwide. Join 250K+ traders already using it daily!

MACD Divergence Optimizer# MACD Divergence Optimizer - User Guide
## Overview
The **MACD Divergence Optimizer** is a professional-grade technical analysis indicator for TradingView that automatically detects hidden divergences on MACD with volume weighting. It identifies potential reversal points before price action confirms the move, giving traders an early edge.
---
## What is Divergence?
A **divergence** occurs when price and an oscillator (like MACD) move in opposite directions:
- **Bullish Divergence**: Price makes a lower low, but MACD makes a higher low → Potential uptrend reversal
- **Bearish Divergence**: Price makes a higher high, but MACD makes a lower high → Potential downtrend reversal
Divergences are among the most reliable reversal signals in technical analysis.
---
## Indicator Features
### Volume-Weighted MACD
- Standard MACD is calculated on closing price
- This indicator uses **volume-weighted closing prices** for greater accuracy
- Formula: MACD = (Volume-Weighted EMA₁₂ - Volume-Weighted EMA₂₆)
- Volume weighting gives more importance to high-conviction price moves
### Automatic Swing Detection
- Detects local highs and lows (5-bar lookback)
- Tracks the last 5 swings for divergence analysis
- Only meaningful swings are tracked (filtered for noise)
### Smart Signal Generation
- Green triangle (▲) = Bullish Divergence (BUY signal)
- Red triangle (▼) = Bearish Divergence (SELL signal)
- Triangles appear directly on the MACD line for precise entry timing
### Built-in Alerts
- Real-time notifications for divergence signals
- Alerts can trigger mobile push notifications or sound
- Never miss a trading opportunity
---
## How to Use
### Installation
1. Open TradingView and navigate to the Chart
2. Click "Indicator" → Search "MACD Divergence Optimizer"
3. Click "Add to Chart"
4. The indicator appears in a separate panel below the price chart
### Reading the Indicator
**MACD Panel displays:**
- **Blue Line** = MACD (fast momentum)
- **Orange Line** = Signal line (slow momentum)
- **Histogram** (colored bars) = Difference between MACD and Signal
- Green bars = MACD above signal (bullish)
- Red bars = MACD below signal (bearish)
**Divergence Signals:**
- **Green Triangle ▲** = Bullish divergence detected
- Price is lower, but MACD momentum is strengthening
- Look for uptrend reversal
- Confirm with higher closes or volume
- **Red Triangle ▼** = Bearish divergence detected
- Price is higher, but MACD momentum is weakening
- Look for downtrend reversal
- Confirm with lower closes or selling volume
---
## Parameters & Settings
### MACD Fast Length (Default: 12)
- Controls the faster moving average period
- **Lower values** → More responsive, more false signals
- **Higher values** → Smoother, fewer signals
- **Typical range**: 8-15
### MACD Slow Length (Default: 26)
- Controls the slower moving average period
- **Lower values** → Faster divergence detection
- **Higher values** → More reliable, fewer signals
- **Typical range**: 20-35
### Signal Smoothing (Default: 9)
- EMA period applied to MACD itself
- **Lower values** → Faster crossover signals
- **Higher values** → Fewer false crossovers
- **Typical range**: 5-15
### Min Divergence Strength (Default: 0.5%)
- Minimum % difference between current MACD and swing MACD
- **Lower values** → More divergence signals (noisier)
- **Higher values** → Only strong divergences (fewer signals)
- **Recommended**: 0.3% - 1.0%
### Lookback Bars (Default: 75)
- Historical window for analysis
- Larger lookback = more context but slower calculation
- **Typical range**: 50-100
---
## Trading Strategy
### Bullish Divergence (Entry Setup)
1. **Identify Signal**: Green triangle appears on MACD
2. **Confirm Price**: Look for price rejection of the low (bounce)
3. **Volume Check**: Buy on increase in volume at the bounce
4. **Entry**: Above the swing low level
5. **Stop Loss**: Below the most recent swing low
6. **Target**: Next swing high or resistance level
### Bearish Divergence (Entry Setup)
1. **Identify Signal**: Red triangle appears on MACD
2. **Confirm Price**: Look for price rejection of the high
3. **Volume Check**: Sell on increase in volume at rejection
4. **Entry**: Below the swing high level
5. **Stop Loss**: Above the most recent swing high
6. **Target**: Next swing low or support level
### Risk Management
- **Position Size**: Risk only 1-2% per trade
- **Stop Loss**: Place beyond recent swings
- **Take Profit**: Scale out at 1:1, 1:2, 1:3 risk-reward ratios
- **Filter**: Use on higher timeframes (4H, Daily) for reliability
---
## Timeframe Recommendations
| Timeframe | Best For | Signal Quality |
|-----------|----------|---|
| **1H** | Scalping, day trading | Moderate (some noise) |
| **4H** | Swing trading | Excellent |
| **Daily** | Position trading | Excellent |
| **Weekly** | Long-term trends | Excellent |
---
## Tips & Best Practices
### ✅ DO:
- **Use on trends**: Divergences work best when there's a clear trend
- **Combine signals**: Look for confirmation from price action, volume, or moving averages
- **Trade the bounce**: Wait for price to react to the swing, then enter
- **Adjust parameters**: Test different MACD lengths for your trading style
- **Use alerts**: Set up mobile alerts so you don't miss signals
### ❌ DON'T:
- **Trade every signal**: Some signals are stronger than others
- **Trade flat/choppy markets**: Divergences fail in ranging markets
- **Ignore support/resistance**: Trade divergences near key levels for best results
- **Over-leverage**: Divergences are probabilistic, not guaranteed
- **Disable volume analysis**: Always check volume when divergence fires
---
## Advanced Features
### Volume Weighting
The indicator uses **volume-weighted MACD** instead of standard MACD. This means:
- High-volume reversals get more emphasis
- Low-volume moves are smoothed out
- More accurate momentum readings
- Better at identifying true trend changes
### Array Tracking
The indicator tracks the last 5 swings in arrays:
- `swingLows ` = last 5 price lows
- `swingHighs ` = last 5 price highs
- `swingMacds ` = corresponding MACD values
This allows detection of **hidden divergences** not visible in traditional analysis.
---
## Common Questions
**Q: Why didn't the indicator trigger a signal when I see a divergence?**
A: The indicator may require:
- MACD histogram to cross the zero line (confirms momentum shift)
- Minimum strength threshold to be met (adjust Min Divergence Strength)
- At least 5 swings to be recorded in the lookback window
**Q: Can I use this on all timeframes?**
A: Yes, but divergences are more reliable on higher timeframes (4H+). Lower timeframes produce more signals but with more noise.
**Q: Should I trade every green/red triangle?**
A: No. Use them as a heads-up for potential reversals. Always confirm with:
- Price action (rejection of the swing)
- Volume (increasing volume at reversal)
- Key support/resistance levels
**Q: How do I set alerts?**
A:
1. Right-click the indicator → Edit Alerts
2. Check "Bullish Divergence" and/or "Bearish Divergence"
3. Choose notification type (browser, mobile, email)
4. Set frequency to "Once per bar close"
**Q: What's the difference between regular and hidden divergence?**
A: This indicator detects **hidden divergences** (also called continuation divergences):
- **Regular**: Price makes new extreme, but oscillator doesn't
- **Hidden**: Price makes new extreme, oscillator makes new extreme in different direction
- Hidden divergences are often more reliable for continuation plays
---
## Disclaimer
This indicator is provided for educational and informational purposes only. It is not financial advice. Past performance does not guarantee future results. Always use proper risk management and combine with other analysis methods. Trading and investing carry risk of loss. Do your own research before making trading decisions.
---
## Support & Updates
For issues, feature requests, or questions:
- Check the indicator settings and parameter values
- Test on historical data first before live trading
- Adjust parameters to match your trading style and timeframe
---
**Version**: 1.0
**Last Updated**: November 2025
**Compatible**: TradingView v6+

BTC Marty IndicatorsThis custom Pine Script indicator is designed specifically for Bitcoin (BTC) trading analysis on TradingView. It combines multiple technical tools into a single, easy-to-use overlay indicator to help traders identify trends, momentum shifts, and overall market sentiment. Ideal for swing traders, long-term holders, or anyone monitoring BTC's price action across various timeframes.
Key Features:
Timeframe-Independent SMAs (110 and 350d)
MACD Histogram Signals

Michael's Custom Watermark🔷 MICHAEL'S CUSTOM WATERMARK INDICATOR
━━━━━━━━━━━━━━━━━━━━━━━━━━━━━━━━━━━━━━━
📊 OVERVIEW
A comprehensive chart watermark overlay that displays essential fundamental and technical information for stocks in a clean, customizable table format. Perfect for traders who want quick access to key metrics without cluttering their charts.
━━━━━━━━━━━━━━━━━━━━━━━━━━━━━━━━━━━━━━━
✨ KEY FEATURES
📊 Fundamental Data Display — Shows Industry, Sector, Market Cap, and P/E Ratio
📅 Earnings Information — Displays next earnings date with countdown timer
📈 ATR Volatility Indicator — 14-day ATR with color-coded visual alerts (🔴🟡🟢)
🎨 Auto Theme Detection — Automatically adjusts text color based on chart background
⚙️ Fully Customizable — Position, colors, size, and displayed metrics all adjustable
🏢 GICS Sector Mapping — Heuristic-based sector classification aligned with industry standards
━━━━━━━━━━━━━━━━━━━━━━━━━━━━━━━━━━━━━━━
🎯 WHAT MAKES THIS INDICATOR UNIQUE?
Unlike basic watermarks, this indicator provides:
Real-time fundamental data integration
Smart theme-aware color adaptation for both light and dark charts
Configurable volatility alerts using ATR thresholds
Earnings countdown feature to never miss important dates
Optimized display that only shows relevant data for the current symbol type
━━━━━━━━━━━━━━━━━━━━━━━━━━━━━━━━━━━━━━━
📖 HOW TO USE
1. BASIC SETUP
Add the indicator to your chart. By default, it displays in the top-left corner with all features enabled.
2. POSITIONING
Vertical Location: Top, Middle, or Bottom
Horizontal Location: Left, Center, or Right
Vertical Offset: Fine-tune position with 0-50 pixel offset from top
3. CUSTOMIZATION OPTIONS
TEXT APPEARANCE:
Auto Text Color — Enable to automatically adapt text color to your chart theme
Manual Color — Set a fixed text color if auto-color is disabled
Text Size — Choose from Huge, Large, Normal, or Small
Theme Colors — Customize text color for light and dark backgrounds separately
DATA DISPLAY TOGGLES:
Show Industry & Sector — Display heuristic-based GICS-aligned sector and industry classification
Show Market Cap — View market capitalization in T/B/M format
Show P/E Ratio — Display Price-to-Earnings ratio (stocks only)
Show ATR (14-Day) — Display Average True Range with percentage and visual indicator
Show Next Earnings — Display upcoming earnings information
Show Earnings Countdown — Show days remaining until next earnings (requires earnings display)
4. ATR VOLATILITY ALERTS
Configure custom thresholds to monitor volatility:
Red Threshold — ATR percentage that triggers red alert 🔴 (default: 6%)
Yellow Threshold — ATR percentage that triggers yellow alert 🟡 (default: 3%)
Green — Shows automatically when ATR is below yellow threshold 🟢
━━━━━━━━━━━━━━━━━━━━━━━━━━━━━━━━━━━━━━━
📐 UNDERSTANDING THE DISPLAY
🏢 SECTOR & INDUSTRY
Shows the GICS sector classification followed by the specific industry. The indicator uses heuristic-based mapping to align TradingView sectors with standard GICS classifications. Note that this mapping is based on keyword detection and industry analysis, so while generally accurate, it may not perfectly match official GICS classifications in all cases.
💰 MARKET CAP
Displays market capitalization using standard abbreviations:
T = Trillion
B = Billion
M = Million
📊 P/E RATIO
Shows the trailing twelve-month Price-to-Earnings ratio. Only displayed for stocks when enabled. Shows "N/A" if data is unavailable.
📈 ATR (14-DAY)
Displays the 14-period Average True Range in both absolute value and percentage terms, with a color-coded indicator:
🔴 Red: High volatility (above red threshold)
🟡 Yellow: Moderate volatility (between yellow and red thresholds)
🟢 Green: Low volatility (below yellow threshold)
📅 EARNINGS
Shows earnings information in three formats:
"X days remaining" — When countdown is enabled and earnings date is known
"Upcoming" — When date is in the future but countdown is disabled
"Recently Reported" — When earnings just occurred
"N/A" — When no earnings data is available
━━━━━━━━━━━━━━━━━━━━━━━━━━━━━━━━━━━━━━━
⚙️ TECHNICAL DETAILS
SUPPORTED INSTRUMENTS:
Optimized for stocks with full fundamental data
Works with other instruments (crypto, forex, futures) but only displays applicable metrics
Automatically suppresses irrelevant data (e.g., P/E for non-stocks)
PERFORMANCE:
Lightweight overlay with minimal resource usage
Updates only on last bar for efficiency
No historical recalculation needed
COMPATIBILITY:
Pine Script v6
Works on all timeframes
Compatible with all chart types
Auto-adapts to theme changes
━━━━━━━━━━━━━━━━━━━━━━━━━━━━━━━━━━━━━━━
💡 TIPS & BEST PRACTICES
Enable Auto Text Color for seamless theme switching between light and dark modes
Adjust vertical offset to avoid overlap with price action in high-volatility periods
Use ATR thresholds appropriate to your trading style and asset class
Disable features you don't use to keep the watermark clean and focused
Position in corners to maximize chart viewing space
Use smaller text size for multi-panel layouts
━━━━━━━━━━━━━━━━━━━━━━━━━━━━━━━━━━━━━━━
🔧 TROUBLESHOOTING
"N/A" SHOWING FOR P/E RATIO:
This is normal for non-stock instruments
May occur for stocks with negative earnings
Check if fundamental data is available for the symbol
EARNINGS SHOWING "N/A":
Earnings data may not be available for all stocks
Check TradingView's data coverage for your symbol
TEXT COLOR NOT VISIBLE:
Enable Auto Text Color feature
Manually set text color to contrast with your chart background
Adjust custom light/dark text colors in settings
━━━━━━━━━━━━━━━━━━━━━━━━━━━━━━━━━━━━━━━
⚠️ DISCLAIMER
This indicator is for informational purposes only. The fundamental data displayed is sourced from TradingView's data providers. Always verify critical information before making trading decisions. Past performance is not indicative of future results.
━━━━━━━━━━━━━━━━━━━━━━━━━━━━━━━━━━━━━━━
If you find this indicator helpful, please give it a boost 🚀 and share your feedback in the comments!
Version: 1.0
Pine Script Version: v6
Created by: Michael
UltimateFlow by Kate V0.2Ultimate Flow Script: Tracks market structure breaks, buy/sell entries (CE/SE), and trends with a Zero Lag SMA. Highlights Bullish & Bearish Order Blocks (OB, BB, MM) with dynamic boxes and tiny labels. Zigzag swings visualize market structure for smart entries. Play with the various settings to suit your trading style. Alerts available for MSB changes and price in OB zones.
Disclaimer: This script is for educational and informational purposes only. It should be used in line with your own trading strategy, risk management, and discretion. Past performance is not indicative of future results.
This script is designed for price action, market structure, and order block analysis on TradingView. It includes:
Buy & Sell Signals (CE/SE) – Highlights potential entries based on market structure breaks and trend changes. Mini triangles or markers indicate possible reversals.
Zero Lag SMA (ZSMA) – Smooths price action for trend confirmation without delay. Helps identify trend direction and support/resistance areas.
Order Blocks (OBs) – Highlights key Bullish (Bu-OB) and Bearish (Be-OB) order blocks on the chart. Boxes dynamically extend as price evolves and include tiny labels (Bu-OB, Be-BB, MM, etc.) for clarity.
Zigzag Market Structure – Draws swing highs and lows to visualize market structure breaks (MSB).
How it works:
OB boxes extend automatically and change when price breaks them.
CE/SE markers help identify high-probability trade entries.
ZSMA confirms trend direction.
Alerts can be set for MSB changes or when price enters an OB zone.

Smart MA Crossover█ OVERVIEW
"Smart MA Crossover" is a technical analysis indicator designed to enhance the effectiveness of strategies based on MA crossovers, combining classic moving average crossovers with breakouts from boxes and dynamic trend visualizations. The indicator is fully customizable—you can freely adjust both parameters and graphical elements.
█ CONCEPTS
Trading approaches based solely on moving average crossover moments generate a large number of false signals. Smart MA Crossover was created to improve this statistic. That's why boxes are added, which are formed from the candle where the MA crossover occurred and generate signals only upon breakout from them. The boxes have bullish (green) and bearish (red) colors. By default, the show_only_matching filter is enabled, displaying entry signals only when the breakout direction matches the box color (e.g., only upward for a bullish box). Boxes are by default the size of the candle on which the crossover occurred, but their size can be adjusted to suit your strategy via an optional average candle size multiplier.
█ FEATURES
- Moving Averages: Two configurable MAs (fast_length, default 10; slow_length, default 30) with selectable type (SMA, EMA, WMA, HMA, VWMA). Optionally displayed with gradient fill between them (color depends on trend: green for uptrend, red for downtrend).
- MA Gradient and Candle Coloring: Enable gradient fill between MAs (transparency: gradient_opacity, default 85) and dynamic candle coloring based on trend (green/red).
- Fog Gradient Trend: Multi-layered gradient "fog" around hl2, consisting of 5 levels up and down, with offset based on average candle size (offset_mult, default 0.7) and increasing transparency (base_transp, default 80; transp_inc, default 4). Fog colors are dynamic (green/red).
- Breakout Boxes: Created at the moment of MA crossover, extending to the right. Box height optionally multiplied by average candle size (use_box_multiplier, box_multiplier, default 1.0). Boxes close and generate a signal when price breaks out beyond the top/bottom edge.
Signals:
- Triangles: Green downward triangles (buy breakout) below the bar, red upward triangles (sell breakout) above the bar—only on breakouts matching direction (if show_only_matching = true). When the matching filter is disabled, every box generates a signal based not on the MA crossover, but on the breakout direction.
- Labels: “BUY” (green, below bar) and “SELL” (red, iabove bar) with transparent background (transparency 40).
- Matching Filter: The show_only_matching option limits signals to breakouts consistent with box direction (bullish box → only buy, bearish → only sell).
- Visualization: Gradient MA lines, fill between MAs, multi-layered fog with increasing transparency, boxes with transparent background (85) and colored borders, dynamic trend colors.
- Alerts: Built-in alerts for BUY and SELL signals (with message including ticker and timeframe).
█ HOW TO USE
Add to Chart: Apply the indicator via Pine Editor or the Indicators menu on TradingView.
Configure Settings:
- MA Settings: Adjust fast (fast_length, default 10) and slow (slow_length, default 30) MA lengths and type (ma_type, default SMA).
- Visualization: Enable/disable MA lines (show_ma_lines), MA gradient (use_gradient_ma), fog trend (show_fog), candle coloring (color_candles).
- Boxes and Breakouts: Enable candle size multiplier (use_box_multiplier) and set value (box_multiplier, default 1.0). Enable signal filter (show_only_matching).
- Signals: Choose type (signal_type): Triangles or Labels (Buy/Sell).
- Fog Trend: Adjust offset (offset_mult), base transparency (base_transp), and increment (transp_inc). Select trend colors (col_up, col_dn).
Signal Interpretation:
- Buy Signals: Green triangles below the bar or “BUY” label—on upward breakout from a bullish box (after bull cross).
- Sell Signals: Red triangles above the bar or “SELL” label—on downward breakout from a bearish box (after bear cross).
- Fog and Gradient: green fog/fill = uptrend; red = downtrend.
- Boxes: Active boxes indicate potential breakout zones; their closure confirms the move.
Signal Confirmation: Use with other tools, such as support/resistance levels, volume, or additional MAs to filter false crossovers.
█ APPLICATIONS
- MA Cross Strategies: Replace classic crossovers—boxes and breakouts eliminate many false signals, thereby increasing effectiveness. Confirm with other indicators, e.g., RSI, Fibonacci, FVG, pivot levels.
- Trend Following: Can be used as a classic trend indicator, especially with larger MA values.
█ NOTES
- Test the indicator across different timeframes and assets, adjusting MA lengths and box multiplier to market volatility.
- In consolidating markets, the indicator generates more false signals.

Auto Fibonacci RetraceNOTE: This script is for educational purposes only.
This Pine Script v6 indicator automates the drawing of Fibonacci retracement levels on a TradingView chart based on detected pivot highs and lows. It's designed to identify the most recent swing points in a price trend and plot horizontal lines at standard Fibonacci ratios (0%, 23.6%, 38.2%, 50%, 61.8%, 78.6%, 100%), along with optional labels for each level. The script is useful for traders who want dynamic, hands-free Fib retracements that update as new pivots form, helping to spot potential support/resistance zones without manual intervention.
Key Features
Automatic Pivot Detection: Uses TradingView's built-in ta.pivothigh and ta.pivotlow functions to find recent swing highs and lows. The sensitivity is adjustable via user inputs for "Left Bars" and "Right Bars" (default: 5 each), which define how many bars are checked on either side to confirm a pivot.
Trend Direction Awareness: Determines if the current swing is an uptrend (recent high after low) or downtrend (recent low after high) and orients the Fib levels accordingly—starting from the low in uptrends or high in downtrends.
Dynamic Drawing:
Plots dashed horizontal lines extending to the right of the chart for each Fib level.
Colors are predefined for visual distinction (e.g., blue for 23.6%, orange for 61.8%).
Lines and labels are cleared and redrawn only when a new pivot is detected or on initial load to prevent chart clutter.
Customizable Labels: Optional labels show the percentage (e.g., "61.8%") and can be positioned on the "Left" (at the swing start) or "Right" (pinned to the current bar, updating dynamically). Labels use semi-transparent backgrounds for readability.
Performance Optimizations: Uses arrays to manage lines and labels efficiently, with reverse-indexed loops for safe deletion. The max_bars_back=500 ensures it handles historical data without excessive computation.
User Inputs:
Left/Right Bars: Tune pivot detection (higher values for major trends, lower for shorter swings).
Show Fib Levels/Labels: Toggle visibility.
Label Position: "Left" or "Right" for placement flexibility.
Usage Instructions
Adding to Chart: Copy-paste into TradingView's Pine Editor, save as a new indicator, and add it to your chart via the "Indicators" menu.
Customization: Adjust inputs in the indicator settings panel. For example, set Left/Right Bars to 10 for daily charts in strong trends.
Best Practices:
Use on trending markets (e.g., stocks, forex, crypto like BTC/USD); avoid choppy sideways action.
Combine with other indicators (e.g., RSI for overbought/oversold confirmation) for better trade signals.
Test on historical data—zoom out to see how it redraws on past swings.
Limitations: Relies on pivot functions, so it may lag slightly (pivots confirm after "Right Bars"). Not a trading strategy—use for analysis only. No alerts built-in, but you can add alertcondition if extending it.
Potential Enhancements: Add extensions (e.g., 161.8%), user-defined levels, or alerts on price touches via simple modifications.
This script provides a clean, efficient way to visualize Fib retracements automatically, saving time compared to manual drawing. If you need further tweaks or integration into a full strategy, let me know!

Pyramid EnterPyramid Enter — Educational Position-Scaling Study
Purpose
Pyramid Enter is a lightweight, educational visualization of additive entries (“pyramiding into strength”). It’s designed to help you study how layered entries might line up during persistent trends. This script does not execute orders, make predictions, or provide financial advice. It simply shows where entry candidates could appear under a simple crossover framework with an optional trend filter.
How it works (concept)
Computes a fast EMA of your chosen Source (default: close).
Applies a user-selected Smoother (SMA/EMA/RMA/WMA/None) to create a slower reference line.
Marks an Enter candidate when the fast EMA crosses above the smoothed line.
Optional EMA 8/21 trend filter can be enabled to allow marks only when EMA(8) > EMA(21).
Includes an adaptive-on-flip option: if the 8/21 filter turns on, a one-time Enter candidate is allowed (useful for studying “first add after trend resumes”).
This is strictly a visual study of where entries might layer during momentum continuation — exits, risk, and sizing are intentionally out of scope so you can analyze those topics separately.
Inputs
Inputs
Length: Period of the fast EMA applied to Source.
Source: Price series used for the fast EMA.
Offset: Visual offset only; no effect on logic.
Smoothing
Type: Choose “SMA / EMA / RMA / WMA / None” for the reference line.
Length: Period for the smoothing type above.
Visualization
Show Labels: Toggle the on-chart Enter labels.
EMA 8/21 Filter
Enable EMA 8/21 Filter: Only mark when EMA(8) > EMA(21).
Fast EMA / Slow EMA: Lengths for the filter (defaults 8/21).
Plot Filter EMAs: Display the 8/21 lines for context.
Adaptive entry when filter flips ON: Allows a one-time Enter candidate on the bar the trend filter turns on (handy when studying re-acceleration after a pullback).
Visuals
White line: Fast EMA of Source.
Blue line: Selected smoother (your slower reference).
Labels: “Pyramid Enter” markers at candidate spots (intrabar + bar-close confirmation are handled internally to keep charts tidy).
No alerts are included. This tool is for chart study only.
Suggested study workflow
Context first — Add your higher-timeframe tools or moving averages to understand the broader regime.
Enable the 8/21 filter if you want to restrict labels to uptrends only.
Experiment with the smoother — SMA is simple, but EMA/RMA/WMA can change sensitivity.
Review clusters of “Pyramid Enter” labels during strong trends to learn where scaling could be considered in a rules-based process.
Pair with your risk framework — Because this script intentionally omits exits/position sizing, use it alongside your own stop, trailing, and de-risking logic for research.
Good citizens of the chart
No repainting tricks.
Marks follow standard EMA/smoothing crossovers with a simple state lock to avoid duplicates.
Designed to be lightweight and readable on any timeframe or symbol.
Limitations & notes
This is not a signal provider, trading system, or performance model.
Labels are educational candidates only; they do not imply profitability or suitability.
Past chart behavior does not guarantee future results. Always do your own research and practice risk management.
Compatibility
Works on all symbols/timeframes supported by TradingView.
Overlay: true (prints on price chart).
No alerts included by design.
Changelog
v1.0 — Initial public release: minimal visual study, optional 8/21 filter, adaptive flip option, no alerts.
License
Michael Culpepper Gratitude License — Free to use and modify for education and research. Please credit the author if you remix or share. Not for sale. No warranty.
Tags / Category (suggested)
Category: Trend Analysis / Educational Tools
Tags: pyramid, scaling, trend, ema, crossover, education, study