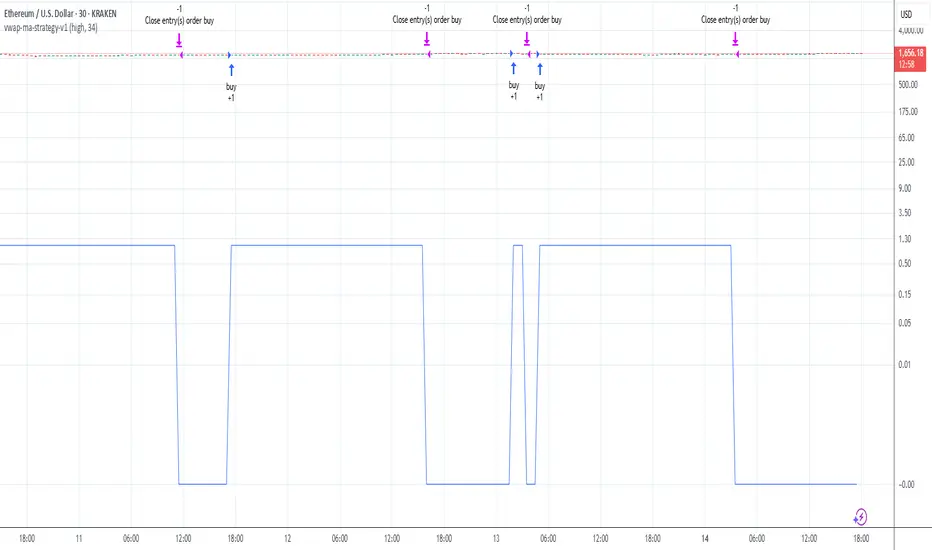
vwap-ma-strategy-v0.7This strategy was inspired by my Israeli fellow iAtiya.
I love it because it's my first pine v3 script that actually works.
Powerful with respect to it's simplicity.
"vwap"に関するスクリプトを検索
Instant Breakout Strategy with RSI & VWAPInstant Breakout Strategy with RSI & VWAP
This TradingView strategy (Pine Script v6) trades breakouts using pivot points, with optional filters for volume, momentum, RSI, and VWAP. It’s optimized for the 1-second timeframe.
Overview
The strategy identifies breakouts when price crosses above resistance (pivot highs) or below support (pivot lows). It can use basic pivot breakouts or add filters for stronger signals. Take-profit and stop-loss levels are set using ATR, and signals are shown on the chart.
Inputs
Left/Right Pivot Bars: Bars to detect pivots (default: 3). Lower values increase sensitivity.
Volume Surge Multiplier: Volume threshold vs. 20-period average (default: 1.5).
Momentum Threshold: Minimum % price change from bar open (default: 1%).
Take-Profit ATR Multiplier: ATR multiplier for take-profit (default: 9.0).
Stop-Loss ATR Multiplier: ATR multiplier for stop-loss (default: 1.0).
Use Filters: Enable/disable volume, momentum, RSI, and VWAP filters (default: off).
How It Works
1. Pivot Detection
Finds pivot highs (resistance) and lows (support) using ta.pivothigh and ta.pivotlow.
Tracks the latest pivot levels.
2. Volume Surge
Compares current volume to a 20-period volume average.
A surge occurs if volume exceeds the average times the multiplier.
3. Momentum
Measures price change from the bar’s open.
Bullish: Price rises >1% from open.
Bearish: Price falls >1% from open.
4. RSI and VWAP
RSI: 3-period RSI. Above 50 is bullish; below 50 is bearish.
VWAP: Price above VWAP is bullish; below is bearish.
5. ATR
14-period ATR sets take-profit (close ± atr * 9.0) and stop-loss (close ± atr * 1.0).
Trading Rules
Breakout Conditions
Bullish Breakout:
Price crosses above the latest pivot high.
With filters: Volume surge, bullish momentum, RSI > 50, price > VWAP.
Without filters: Only the crossover is needed.
Bearish Breakout:
Price crosses below the latest pivot low.
With filters: Volume surge, bearish momentum, RSI < 50, price < VWAP.
Without filters: Only the crossunder is needed.
Entries and Exits
Long: Enter on bullish breakout. Set take-profit and stop-loss. Close any short position.
Short: Enter on bearish breakout. Set take-profit and stop-loss. Close any long position.
Visuals
Signals: Green triangles (bullish) below bars, red triangles (bearish) above bars.
Pivot Levels: Green line (resistance), red line (support).
Indicators: RSI (blue, separate pane), VWAP (purple, on chart).
How to Use
Apply to a 1-second chart in TradingView for best results.
Adjust inputs (e.g., pivot bars, multipliers). Enable filters for stricter signals.
Watch for buy/sell triangles and monitor RSI/VWAP.
Use ATR-based take-profit/stop-loss for risk management.
Notes
Best on 1-second timeframe due to fast RSI and responsiveness.
Disable filters for more signals (less confirmation).
Backtest before live trading to check performance.
This strategy uses pivots, volume, momentum, RSI, and VWAP for clear breakout trades on the 1-second timeframe.

EMA Fractal and vwap - FIMIDOIt is a testing only strategy with alerts - FOR MNQ and MES Futures
This script implements a multi-indicator-based approach to generate long (buy) and short (sell) signals, incorporating elements like Exponential Moving Averages (EMAs), WaveTrend, volume filters, Cumulative Volume Delta (CVD) trends, fractal prime zones, and Volume Weighted Average Price (VWAP) with trend-based coloring. It includes risk management features such as stop-loss, take-profit, position sizing based on account risk, daily loss limits, and trade pauses after losses. The strategy is highly configurable through user inputs, allowing traders to enable/disable various filters and trade types.
Important Note: This script is still in the testing phase. It has not been fully optimized or backtested across various market conditions, instruments, or timeframes. Users should thoroughly test it in a simulated environment before applying it to live trading, as it may contain bugs, inefficiencies, or unintended behaviors. Past performance in backtests does not guarantee future results, and trading involves significant financial risk.
Key Features and Structure
The script is structured into sections: inputs, functions, calculations, trading filters, strategy logic, plots, alerts, and visual elements. It operates as a strategy overlay on price charts, meaning it plots indicators directly on the main chart and executes hypothetical trades based on defined rules.
Strategy Parameters:
Initial capital: Starts with $50,000 (configurable).
Margin: 1% for both long and short positions.
Overlay: True, so it displays on the price chart.
Inputs
The script provides extensive user-configurable inputs grouped by category for ease of use:
Risk Management:
Risk % of Account: Percentage of equity risked per trade (default: 2%).
Risk-Reward Ratio: Multiplier for take-profit relative to stop-loss (default: 1.7).
Max Daily Loss %: Stops trading if daily losses exceed this threshold (default: 0.4%).
Stop-Loss Points Buffer: Adjusts stop-loss placement (default: -8.1 points).
Max Trades per Day: Limits trades per session (default: 3).
Pause Candles After Loss: Halts trading for a set number of bars after a losing trade (default: 19).
Trading Hours:
Start/End Hour: Restricts trading to specific hours (default: 6 AM to 9 AM, in 24-hour format).
Trade Types:
Enable Long/Short Trades: Toggles long (buy) or short (sell) positions (both default: true).
VWAP Filter Settings:
Use VWAP Filter: Requires buys above VWAP and sells below (default: true).
VWAP Trend Length: Period for trend calculation (default: 5 bars).
VWAP Trend Threshold: Minimum change for considering a trend (default: 0.0 points).
Disable Trades on Flat VWAP: Prevents trades when VWAP is gray (flat trend) (default: true).
EMA Settings:
EMA Master Length: A base EMA for general filtering (default: 6).
Separate EMA configurations for long and short trades, including smoothing types (RMA, SMA, EMA, WMA) and fast/slow lengths.
WaveTrend Settings:
Use WaveTrend: Enables momentum-based signals (default: false).
Channel, Average, and MA lengths for customization.
Volume Filter Settings:
Separate filters for long/short with MA lengths and threshold multipliers to ensure high-volume conditions.
CVD Trend Settings:
Use CVD for long/short: Filters based on volume delta trends using ATR multipliers and lengths.
Fractal Prime Zones Settings:
Use Fractal: Enables support/resistance zones based on fractals (default: true).
Length, sensitivity, and options to include volume delta or show labels.
These inputs allow for fine-tuning the strategy to different assets or market conditions.
Functions
Two main helper functions are defined:
f_wavetrend: Calculates WaveTrend values using EMAs on a custom source, producing two lines (WT1 and WT2) for crossover detection.
f_ema: A simple EMA wrapper (though it uses built-in ta.ema).
ma_function: A versatile moving average calculator supporting RMA, SMA, EMA, or WMA based on user selection.
Calculations
The core of the script involves computing multiple indicators:
VWAP: Based on HLC3 (high-low-close average), anchored daily. It's plotted with dynamic coloring: green for upward trend, red for downward, and gray for flat (based on slope over the trend length and threshold).
Volume Filters: SMA-based checks to ensure volume exceeds a threshold multiple.
EMAs: Custom fast/slow EMAs for long/short, with crossovers/crossunders generating signals.
WaveTrend: Momentum oscillator with cross detection for up/down signals.
CVD Trends: Bollinger-like bands using SMA and ATR multiples to detect uptrends (close above upper band) or downtrends.
Fractal Prime Zones: Advanced zones using prime numbers, ATR, and optional CVD. Calculates density-based upper/lower zones, identifies support/resistance, and generates buy/sell signals on zone breaks.
Trading Window and Counters: Checks time of day, resets daily trade counts, and manages pause after losses.
Risk Calculations: Dynamically computes position size based on risk amount, stop-loss distance, and equity.
Entry signals (buyTriangle and sellTriangle) combine these: All enabled filters must pass (e.g., EMA crossover, high volume, CVD trend, fractal signal, VWAP position, and trending VWAP if filtered).
Strategy Logic
Entry Conditions: Triggers long/short entries only if signals align, within trading hours, under max trades/day, not paused, and daily loss not exceeded.
Stop-loss: Placed below low (long) or above high (short) with buffer.
Position Size: Floored to nearest integer based on risk amount divided by per-unit risk.
Take-Profit: Set at entry price plus/minus (risk distance * RR ratio).
Exits: Via strategy.exit with stop and limit orders.
Loss Handling: Updates daily loss on trade close; pauses if loss occurs.
No Trades on Flat VWAP: If enabled, skips entries when VWAP trend is neutral (gray).
Plots and Visuals
Shapes: Triangles for buy (blue, below bar) and sell (red, above bar) signals.
VWAP Line: Colored dynamically.
Fractal Zones: Plotted with fill and optional labels for support/resistance.
Debug Plots: Characters for trading window, pause, and max trades exceeded.
TP/SL Lines: Drawn as arrows on entries.
Daily Loss Table: Displays current loss and limit in a bottom-right table.
Alerts
Generates alerts on entries with details: entry price, SL, TP.
This strategy emphasizes trend-following with filters to reduce false signals, but its complexity may lead to over-optimization. Again, as it is still in the testing phase, users are advised to backtest extensively, forward-test on demo accounts, and monitor for issues like slippage, commissions, or market regime changes before real-world use. If you need modifications or further analysis, let me know!

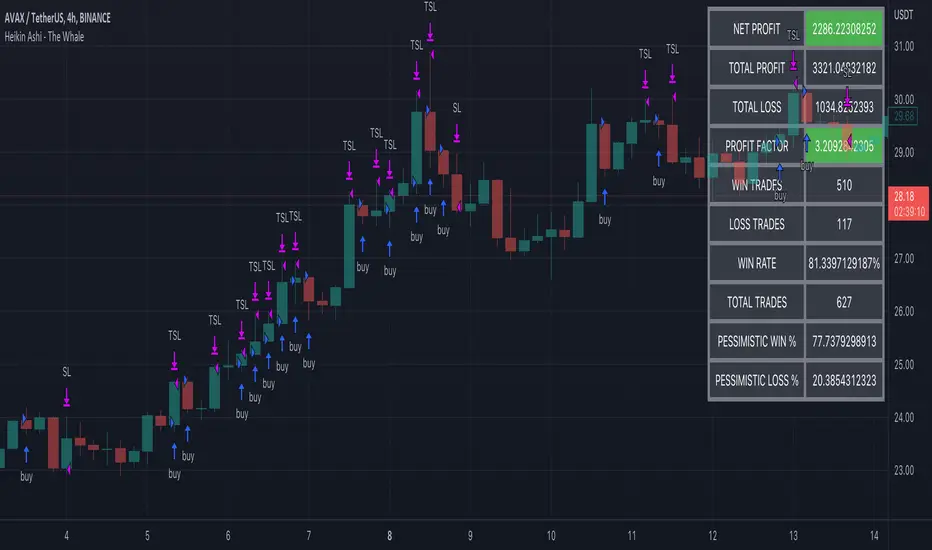
Heikin Ashi - The WhaleThe strategy is based on Heikin Ashi calculation, you do not need to switch the candle to HA.
The HA is used as a base entry, if a candle or two candles are bullish, then is valid to open a position, you can select the validation, one or two candles.
Also, the strategy mainly uses volume indicators as a confluence, you can select VWAP , VWMA , and Volume Oscillator, in addition to ADX which has two ways to validate the entry.
Base entry: One or two bullish HA candles (candles without a lower wick)
Confluence Indicators:
ADX: Will give a positive signal only if ADX is above the threshold, or if +DI is above -DI, or both.
VWAP: will give a positive signal if HA close is above VWAP.
VWMA: composite of 3 MA (20, 25, 50). There are multiple options to set it as confluence, the first option is to check if the short is bigger than the long and long is bigger than the base. The other options are to check the close status, which is bigger than which MA. You can find the description of each option in the strategy box
The sell is based on trailing stop loss (TSL), while the stop loss is based lowest X candle, the strategy will look back to the lowest number of the HA candles and set it as stop loss.
Candles - The WhaleThe strategy is based on candle patterns, with confluence indicators. Note some of the candles are rare, they can be found only a specific timeframe, or within specific stocks.
The added patterns are as follows:
- Bullish Engulfing
It is formed by two candles, the second candlestick engulfing the first candlestick. The first candle is a bearish candle that indicates the continuation of the downtrend.
The second candlestick is a long bullish candle that completely engulfs the first candle and shows that the bulls are back in the market.
- Bullish Harami
It consists of two candlestick charts, the first candlestick being a tall bearish candle, and the second, being a small bullish candle which should be in the range of the first candlestick.
The first bearish candle shows the continuation of the bearish trend and the second candle shows that the bulls are back in the market.
- Piercing Line
Two candles from it, the first candle being a bearish candle which indicates the continuation of the downtrend.
The second candle is a bullish candle that opens the gap down but closes more than 50% of the real body of the previous candle, which shows that the bulls are back in the market and a bullish reversal is going to take place.
- Bullish Belt
A Bullish Belt Hold, known as “yorikiri” in Japanese, is a single Japanese candlestick pattern that suggests a possible reversal of the current downtrend.
- Bullish Kicker
A bullish kicker is a two candlestick pattern that’s usually formed after a significant downtrend, but could also appear after an uptrend.
- Abandoned Baby
The abandoned baby candlestick pattern is a three-bar reversal pattern. It is similar to the morning and evening star formations and is a very reliable reversal signal when it occurs after a sharp rise or drop.
- Homing Pigeon
The bullish homing pigeon is a two-candle bullish reversal pattern that occurs at the end of a bearish trend. Both candles are negative, but the second candle is confined within the range of the previous candle.
- Breakaway
Breakaway patterns are multi-candle formations found on Japanese candlestick charts that suggest a market reversal may be in the offing. An actual breakaway is a five candlestick formation that occurs in either an upward or downward trend.
- Concealing Baby Swallow
The Concealing Baby Swallow candlestick pattern is a four-candlestick pattern that can signal a bullish reversal price movement or a bearish continuation move, depending on where it occurs in the overall market structure. However, the pattern is quite rare, and you may not encounter it in your trading.
- Doji Dragonfly
A dragonfly doji can be an indicator of a reversal in price. When the price of a security has shown a downward trend, it might signal an upcoming price increase.
- Doji Gravestone
The Gravestone Doji forms when the price closes at relatively the same level where it opened, providing that the open coincides with the low or at least the two are very close
- Doji Star
Consists of a long bullish candle, followed by a Doji that gaps up, then a third bearish candle that gaps down and closes well within the body of the first candle. An Evening Doji Star is a three-candle bearish reversal pattern similar to the Evening Star.
- Kicker
A kicker pattern is a two-bar candlestick pattern that predicts a change in the direction of an asset's price trend. This pattern is characterized by a sharp reversal in price over the span of two candlesticks. Traders use it to determine which group of market participants is in control of the direction.
- Ladder Bottom
Is a five-candle bullish reversal pattern that occurs at the end of a bullish trend. The four first candles are bearish and followed by a positive candle that starts with a positive gap.
- MatHold
A bullish pattern begins with a large bullish candle followed by a gap higher and three smaller candles which move lower.
- Matching Low
A matching low is a bullish two-candle reversal pattern that forms in an ongoing downtrend. As to its appearance, a matching low consists of two candlesticks that are negative, but the close at or around the same price.
- Meeting Lines
Bullish meeting lines are a two-candle bullish reversal pattern that occurs in a downtrend and signals a reversal of the trend. The first candle of the bullish meeting lines is bearish, and followed by a positive candle that closes very near the close of the previous candle.
- Morning Doji Star
It is made of 3 candlesticks, the first being a bearish candle, the second, a Doji, and the third being a bullish candle.
The first candle shows the continuation of the downtrend. The second candle being a doji indicates indecision in the market. The third bullish candle shows that the bulls are back in the market and a reversal will take place. The second candle should be completely out of the real bodies of the first and third candles.
- Rising Three Method1
Rising three methods is a bullish continuation pattern that appears in an ongoing uptrend. The Rising three methods pattern consists of five candles. where the first and last candles are long and bullish, with three small bearish candles in between.
- Rising Three Method2
It is the same as "Rising Three Method1" but with a different calculation
- Upside Tasuki Gap1
Is a bullish continuation candlestick pattern that forms in an ongoing uptrend. It consists of three candles, where the two first are bullish with a positive gap in-between, and followed by a negative candle that closes in the gap formed between the first two candles.
- Upside Tasuki Gap2
It is the same as "Upside Tasuki Gap1" but with a different calculation
- Three Line Strike1
Is a four-candle bullish continuation candlestick pattern. It forms a bullish trend and is believed to signal the continuation of the bullish trend.
- Three Line Strike2
It is the same as "Three Line Strike2" but with a different calculation
The confluence indicators:
Movement Averages: multi options checks, you can select what to check to open a position, and the description of each open is in the strategy.
Volume Oscillator: positive signal if the volume is above zero.
EMA: positive signal if the candle source is above EMA.
VWAP: positive signal if the candle source is above VWAP.
BTC Trend: it is an equation to track the BTC price movement
The profit is based on TSL, while the stop loss is based on ATR, or lowest candle.
The recommended time frame is 4 hours.

HMK-2 | PCA-1 + Rejim + Chebyshev + VWAP (Input'lu, v6)📌 HMK-2 | PCA-1 + Regime + Chebyshev + VWAP Strategy
1️⃣ Core Structure
Instead of relying on a single indicator, this system uses the Z-Score normalized average of three oscillators (RSI, MFI, ROC).
Signal (PCA-1):
RSI(14), MFI(14), ROC(5) → each is converted into a z-score.
Their average becomes the “composite signal,” our PCA-1 value.
Trend direction: If the Z-score EMA is rising → trend UP. If falling → trend DOWN.
2️⃣ Side Filters
Regime Filter (ADX + EMA)
ADX is calculated manually.
If ADX > 20 → trend exists → a 50-period EMA of this value smooths it.
This turns “trend regime” into a probability between 0–1.
Chebyshev Filter
A return series is checked against mean ± k*sigma bands.
If the return is within this band → valid signal. Extreme moves are filtered out.
VWAP Filter
Long trades: price must be above VWAP.
Short trades: price must be below VWAP.
Trades are only taken on the correct side of institutional cost averages.
3️⃣ Entry Conditions
Long:
PCA-1 signal crosses above threshold.
Trend Up + Regime OK + Chebyshev OK + Above VWAP.
Short:
PCA-1 signal crosses below threshold.
Trend Down + Regime OK + Chebyshev OK + Below VWAP.
4️⃣ Exit Mechanism
Main Exit: ATR-based stop/target.
Stop = entry price – ATR × (SL factor).
Take profit = entry price + ATR × (TP factor).
Additional Exit:
If price crosses to the opposite side of VWAP.
If PCA-1 signal crosses zero.
👉 Prevents trades from being locked, makes exits adaptive.
5️⃣ Labels / Visualization
AL / SHORT → entry points.
SAT / COVER → exit points.
VWAP line plotted in blue.
🧩 Strategy Features
Optimizable parameters:
Z-window (zWin)
Threshold
Chebyshev factor
ATR stop/target multipliers
This system works with:
Disciplined core (PCA-1 signal)
Triple protection (Regime + Chebyshev + VWAP)
Adaptive exits (ATR + VWAP/signal cross)
👉 Not a “single-indicator robot,” but a multi-filtered trade direction engine.
💡 Final Note
This is a base model of the system — open for further development.
I’ve shared the logic to give you a roadmap.
If you spot errors, fix them → that’s how you’ll improve it.
Don’t waste time asking me questions — refine and build it better yourselves.
Wishing you profitable trades. Stay well 🙏

Stock trending strategy This is a long only strategy designed maily for stock markets and futures. In general it works best with 1h, however it can be optimized with other timeframes as well.
Components:
VWAP
MACD histogram
EMA 9
Rules for entry
Long :
For VWAP: close is above the vwap daily
EMA: close is above the moving average
MACD histogram is above 0
Short:
For VWAP: close is belowthe vwap daily
EMA: close is below the moving average
MACD histogram is below 0
Rules for exit
This strategy does not have any risk management inside. Instead it exits whenver it receives an opposite signal form the original one used for entry.
If you have any questions let me know !

LUX CLARA - EMA + VWAP (No ATR Filter) - v6EMA STRAT SHOUT OUTOUTLIERSSSSS
Overview:
an intraday strategy built around two core principles:
Trend Confirmation using the 50 EMA (Exponential Moving Average) in relation to the VWAP (Volume-Weighted Average Price).
Entry Signals triggered by the 8 EMA crossing the 50 EMA in the direction of that confirmed trend.
Key Logic:
Bullish Trend if the 50 EMA is above VWAP. Only long entries are allowed when the 8 EMA crosses above the 50 EMA during that bullish phase.
Bearish Trend if the 50 EMA is below VWAP. Only short entries are allowed when the 8 EMA crosses below the 50 EMA during that bearish phase.
Intraday Focus: Trades are restricted to a user-defined session window (default 7:30 AM–11:30 AM), aligning entries/exits with peak intraday liquidity.
Exit Rule: Positions close automatically when the 8 EMA crosses back in the opposite direction of the entry.
Why It Works:
EMA + VWAP helps detect both immediate momentum (EMAs) and overall institutional bias (VWAP).
By confining trades to a set intraday window, the strategy aims to capture morning volatility while avoiding choppy afternoon or overnight sessions.
Customization:
Users can adjust EMA lengths, session times, or incorporate stops/targets for additional risk management.
It can be tested on various symbols and intraday timeframes to gauge performance and robustness.

Liquid Pulse Liquid Pulse by Dskyz (DAFE) Trading Systems
Liquid Pulse is a trading algo built by Dskyz (DAFE) Trading Systems for futures markets like NQ1!, designed to snag high-probability trades with tight risk control. it fuses a confluence system—VWAP, MACD, ADX, volume, and liquidity sweeps—with a trade scoring setup, daily limits, and VIX pauses to dodge wild volatility. visuals include simple signals, VWAP bands, and a dashboard with stats.
Core Components for Liquid Pulse
Volume Sensitivity (volumeSensitivity) controls how much volume spikes matter for entries. options: 'Low', 'Medium', 'High' default: 'High' (catches small spikes, good for active markets) tweak it: 'Low' for calm markets, 'High' for chaos.
MACD Speed (macdSpeed) sets the MACD’s pace for momentum. options: 'Fast', 'Medium', 'Slow' default: 'Medium' (solid balance) tweak it: 'Fast' for scalping, 'Slow' for swings.
Daily Trade Limit (dailyTradeLimit) caps trades per day to keep risk in check. range: 1 to 30 default: 20 tweak it: 5-10 for safety, 20-30 for action.
Number of Contracts (numContracts) sets position size. range: 1 to 20 default: 4 tweak it: up for big accounts, down for small.
VIX Pause Level (vixPauseLevel) stops trading if VIX gets too hot. range: 10 to 80 default: 39.0 tweak it: 30 to avoid volatility, 50 to ride it.
Min Confluence Conditions (minConditions) sets how many signals must align. range: 1 to 5 default: 2 tweak it: 3-4 for strict, 1-2 for more trades.
Min Trade Score (Longs/Shorts) (minTradeScoreLongs/minTradeScoreShorts) filters trade quality. longs range: 0 to 100 default: 73 shorts range: 0 to 100 default: 75 tweak it: 80-90 for quality, 60-70 for volume.
Liquidity Sweep Strength (sweepStrength) gauges breakouts. range: 0.1 to 1.0 default: 0.5 tweak it: 0.7-1.0 for strong moves, 0.3-0.5 for small.
ADX Trend Threshold (adxTrendThreshold) confirms trends. range: 10 to 100 default: 41 tweak it: 40-50 for trends, 30-35 for weak ones.
ADX Chop Threshold (adxChopThreshold) avoids chop. range: 5 to 50 default: 20 tweak it: 15-20 to dodge chop, 25-30 to loosen.
VWAP Timeframe (vwapTimeframe) sets VWAP period. options: '15', '30', '60', '240', 'D' default: '60' (1-hour) tweak it: 60 for day, 240 for swing, D for long.
Take Profit Ticks (Longs/Shorts) (takeProfitTicksLongs/takeProfitTicksShorts) sets profit targets. longs range: 5 to 100 default: 25.0 shorts range: 5 to 100 default: 20.0 tweak it: 30-50 for trends, 10-20 for chop.
Max Profit Ticks (maxProfitTicks) caps max gain. range: 10 to 200 default: 60.0 tweak it: 80-100 for big moves, 40-60 for tight.
Min Profit Ticks to Trail (minProfitTicksTrail) triggers trailing. range: 1 to 50 default: 7.0 tweak it: 10-15 for big gains, 5-7 for quick locks.
Trailing Stop Ticks (trailTicks) sets trail distance. range: 1 to 50 default: 5.0 tweak it: 8-10 for room, 3-5 for fast locks.
Trailing Offset Ticks (trailOffsetTicks) sets trail offset. range: 1 to 20 default: 2.0 tweak it: 1-2 for tight, 5-10 for loose.
ATR Period (atrPeriod) measures volatility. range: 5 to 50 default: 9 tweak it: 14-20 for smooth, 5-9 for reactive.
Hardcoded Settings volLookback: 30 ('Low'), 20 ('Medium'), 11 ('High') volThreshold: 1.5 ('Low'), 1.8 ('Medium'), 2 ('High') swingLen: 5
Execution Logic Overview trades trigger when confluence conditions align, entering long or short with set position sizes. exits use dynamic take-profits, trailing stops after a profit threshold, hard stops via ATR, and a time stop after 100 bars.
Features Multi-Signal Confluence: needs VWAP, MACD, volume, sweeps, and ADX to line up.
Risk Control: ATR-based stops (capped 15 ticks), take-profits (scaled by volatility), and trails.
Market Filters: VIX pause, ADX trend/chop checks, volatility gates. Dashboard: shows scores, VIX, ADX, P/L, win %, streak.
Visuals Simple signals (green up triangles for longs, red down for shorts) and VWAP bands with glow. info table (bottom right) with MACD momentum. dashboard (top right) with stats.
Chart and Backtest:
NQ1! futures, 5-minute chart. works best in trending, volatile conditions. tweak inputs for other markets—test thoroughly.
Backtesting: NQ1! Frame: Jan 19, 2025, 09:00 — May 02, 2025, 16:00 Slippage: 3 Commission: $4.60
Fee Typical Range (per side, per contract)
CME Exchange $1.14 – $1.20
Clearing $0.10 – $0.30
NFA Regulatory $0.02
Firm/Broker Commis. $0.25 – $0.80 (retail prop)
TOTAL $1.60 – $2.30 per side
Round Turn: (enter+exit) = $3.20 – $4.60 per contract
Disclaimer this is for education only. past results don’t predict future wins. trading’s risky—only use money you can lose. backtest and validate before going live. (expect moderators to nitpick some random chart symbol rule—i’ll fix and repost if they pull it.)
About the Author Dskyz (DAFE) Trading Systems crafts killer trading algos. Liquid Pulse is pure research and grit, built for smart, bold trading. Use it with discipline. Use it with clarity. Trade smarter. I’ll keep dropping badass strategies ‘til i build a brand or someone signs me up.
2025 Created by Dskyz, powered by DAFE Trading Systems. Trade smart, trade bold.

HYE Combo Market [Strategy] (Vwap Mean Reversion + Trend Hunter)In this strategy, I used a combination of trend hunter and vwap mean reversion strategies that I published before.
Trend Hunter Strategy:
Mean Reversion Vwap Strategy:
The results are quite impressive, especially for bitcoin.
While the hodl return for bitcoin was 13419%, the strategy's return in the same period was about 5 times (65000%) of this.
s3.tradingview.com
In this combo strategy, I made some changes to the original settings of the strategies used together and added some more new features.
Trend Hunter Strategy Settings: (Original / Combo)
- Slow Tenkansen Period : 9 / 9
- Slow Kijunsen Period : 26 / 13
- Fast Tenkansen Period : 5 / 3
- Fast Kijunsen Period : 13 / 7
- BB Length : 20 / 20
- BB Stdev : 2 / 2
- TSV Length : 13 / 20
- TSV Ema Length : 7 / 7
* I also added a "vidya moving average" to be used as a confirmation tool to open a long position. (Candle close must be above the vidya line.)
Vwap Mean Reversion Strategy Settings: (Original / Combo)
- Small Vwap : 2 / 8
- Big Vwap : 5 / 10
- Percent Below to Buy : 3 / 2
- RSI Period : 2 / 2
- RSI Ema Period : 5 / 5
- Maximum RSI Level for Buy : 30
* I also added a "mean vwap line" to be used for exits in this part of the strategy. In the original version, when small vwap crossovers big vwap, we close the position, but in this strategy we will wait for the close above the mean vwap.
TIPS AND WARNINGS
1-) The standard settings of this combo strategy is designed and tested with daily timeframe. For lower timeframes, you should change the strategy settings and find the best value for yourself.
2-) Only the mean vwap line is displayed on the graph. For a detailed view, you can delete the "//" marks from the plot codes in the strategy code.
3-) This is a strategy for educational and experimental purposes. It cannot be considered as investment advice. You should be careful and make your own risk assessment when opening real market trades using this strategy.
________________________________________________________
Bu stratejide, daha önce yayınladığım trend avcısı ve vwap ortalamaya geri dönüş stratejilerinin bir kombinasyonunu kullandım.
Sonuçlar özellikle bitcoin için oldukça etkileyici.
Bitcoin için hodl getirisi %13419 iken, stratejinin aynı dönemdeki getirisi bunun yaklaşık 5 katı (%65000) idi.
Bu kombo stratejide, birlikte kullanılan stratejilerin orijinal ayarlarında bazı değişiklikler yaptım ve bazı yeni özellikler ekledim.
Trend Avcısı Strateji Ayarları: (Orijinal / Combo)
- Yavaş Tenkansen Periyodu : 9 / 9
- Yavaş Kijunsen Periyodu : 26 / 13
- Hızlı Tenkansen Periyodu : 5 / 3
- Hızlı Kijunsen Periyodu : 13 / 7
- BB Uzunluğu : 20 / 20
- BB Standart Sapması : 2 / 2
- TSV Uzunluğu : 13 / 20
- TSV Ema Uzunluğu : 7 / 7
* Ayrıca long pozisyon açmak için onay aracı olarak kullanılmak üzere "vidya hareketli ortalama" ekledim. (Mum kapanışı vidya çizgisinin üzerinde olmalıdır.)
Vwap Ortalamaya Dönüş Stratejisi Ayarları: (Orijinal / Combo)
- Küçük Vwap : 2 / 8
- Büyük Vwap : 5 / 10
- Alış İçin Gerekli Fark Oranı : 3 / 2
- RSI Periyodu : 2 / 2
- RSI Ema Periyodu: 5 / 5
- Alış için gerekli maksimum RSI seviyesi : 30
* Stratejinin bu bölümünde pozisyondan çıkışlar için kullanılacak bir "ortalama vwap çizgisi" de ekledim. Orijinal versiyonda, küçük vwap, büyük vwap'ı yukarı kestiğinde pozisyonu kapatıyoruz, ancak bu stratejide, ortalama vwap'ın üzerindeki kapanışı bekleyeceğiz.
İPUÇLARI VE UYARILAR
1-) Bu birleşik stratejinin standart ayarları, günlük zaman dilimi ile tasarlanmış ve test edilmiştir. Daha düşük zaman dilimleri için strateji ayarlarını değiştirmeli ve kendiniz için en iyi değeri bulmalısınız.
2-) Grafikte sadece ortalama vwap çizgisi görüntülenir. Ayrıntılı bir görünüm için strateji kodundaki "plot" ile başlayan satırlarda grafikte görünmesini istediğiniz özelliğin önündeki "//" işaretlerini silebilirsiniz.
3-) Eğitim ve deneysel amaçlı bir stratejidir. Yatırım tavsiyesi olarak değerlendirilemez. Bu stratejiyi kullanarak gerçek piyasa işlem açarken dikkatli olmalı ve kendi risk değerlendirmenizi yapmalısınız.

SPX EMA 9/21 + VWAP Strategy1. Temporality: 2 minutes.
2. EMA 9 and EMA 21:
• Purchase Call: when EMA 9 crosses up EMA 21 and the price is > VWAP.
• Put : when EMA 9 crosses down EMA 21 and the price is < VWAP.
3. Stop and Take Profit:
• Stop: candle closure on the other side of the VWAP.
• TP: configurable in points (e.g. +10 pts, +20 pts) or up to the opposite crossing of EMAs.
• Long enters when EMA 9 crosses up 21 and the price is above VWAP.
• Short enters when the EMA 9 crosses down the 21 and the price is below VWAP.
• TP and SL in SPX points (configurable in inputs).
• You can run in 2 minutes on SPX.

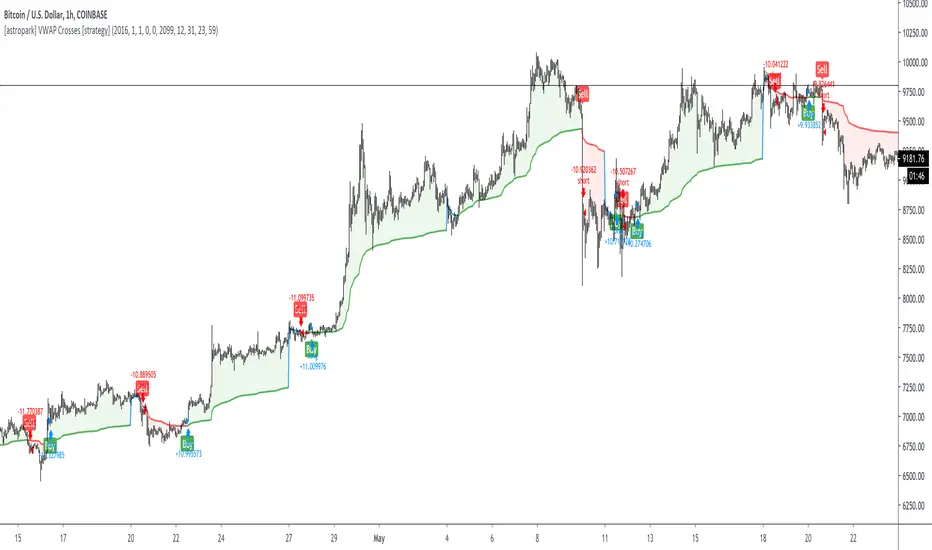
[astropark] VWAP Crosses [strategy]Dear Followers,
today a new Swing and Scalping Strategy based on WVAP , mainly designed for Bitcoin and High-Cap Cryptocurrencies, like Ethereum. It works also on Forex and Stocks.
It works great since 15m and above till 1D. I suggest you to use it on 15m, 30m or 1h timeframes .
VWAP or "Volume Weighted Average Price" is a volume-based indicator similar to a moving average.
This trading indicator is used to identify market resistance and support levels and is represented as a weighted average price for the treaded volumes.
My strategy will help you identify main support-resistance level to be careful of and it will trigger a buy or a sell depending on how price will intereact with vwaps.
green means we are in a bullish trend, in fact it start with a "buy" signal
red means we are in a bearish trend, in fact it start with a "sell" signal
blue means we are in a moment where trend may change, so be careful and always remember that taking profits is awesome and have a stoploss is a must in trading
The user who wants to use this strategy, especially via an automated bot, must always set a stoploss (example 150$ from entry on bitcoin) or use a proper risk management strategy .
This is not the "Holy Grail", so use it with caution. It's highly suggested to use a proper money management .
This script will let you backtest this script and check profitability on your preferred market.
The alarms version of this indicator, which will let you set all notifications you may need in order to be alerted on each triggered signals, can be found by searching for astropark "VWAP Crosses"
This is a premium indicator , so send me a private message in order to get access to this script.
Volatility Stop with Vwap StrategyFirst the credits goes to @TradingView for their release of the volatility stop mtf indicator.
I have took it, and inside I have added a weekly vwap for a better trend direction and at the same time I have added a dynamic risk managment which is calculated from the distance between the volatility line to the close of the candle.
The rules for entry are simple:
For long:We enter when our close of the candle is above the volatility stop line and at the same time the close of the candle is above weekly vwap
For short we enter when our close of the candle is below the volatility stop line and at the same time the close of the candle is below weekly vwap.
We exit when we either have a reverse signal than the one we enterred, or based on the TP/SL which is calculated with the distance from vwap to the close of the candle.
If you have any questions please let me know !

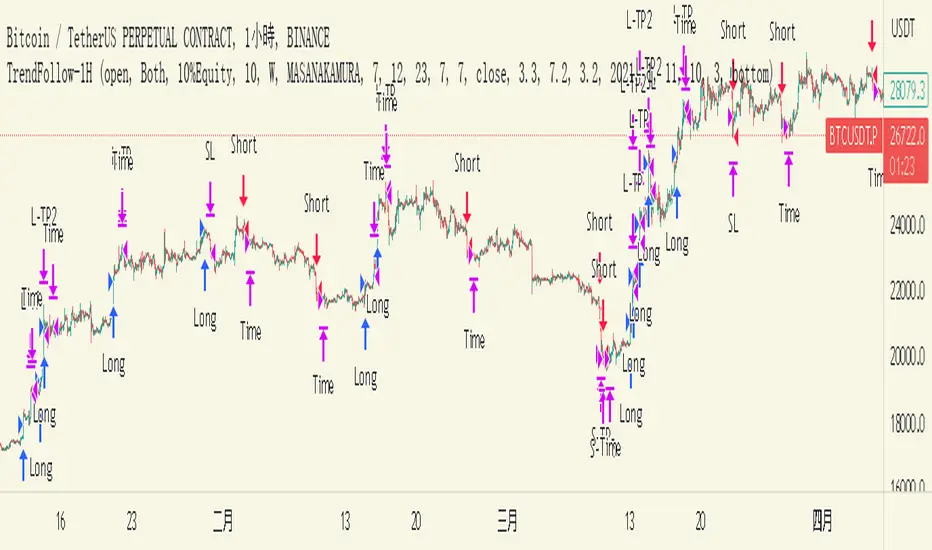
TrendFollow-1HThis is a trading strategy specially used on btcusdtperp in binance 1H chart
The most important part of this strategy is to use Support and Resistance with trading volume
Auxiliary indicators are include Directional Movement Index, trading volume, Commodity Channel Index,volume-weighted average price,Range Filter
Why is it not applicable to other trading varieties or exchanges?
Because the activity of each trading target is different from the trading volume, this strategy is very focused on the change of trading volume, so it may not be applicable to every trading variety
The idea of this strategy is to chase when the trend in the market is clear
Determine whether to break support or resistance to identify trends
But the market is full of false breakouts
Therefore, trading volume is an important indicator for judging the true and false.
Therefore, when the price breaks through support or resistance, accompanied by a huge trading volume, and forms a resonance with auxiliary indicators, the strategy will follow the trend, a time stop loss is also set. After entering the market, if there is no immediate profit to the stop profit, you will leave the market first.
But the market is always random, so the profit and loss ratio must be taken into account
Use a fixed stop loss space in exchange for a larger profit space, and ensure that the expected value is positive to make stable profits in the market
Therefore, this strategy uses 3.2% stop loss, 3.3% Take profit1 and 7.2% take profit2
About 1.5:1 profit and loss ratio to ensure positive expected value
Because the market has a clear trend only about 10% of the time
So the trading frequency of this strategy is very low
According to the backtest of up to 2021-01-01 till now , it takes about 5 days to make a transaction
User can choose their own leverage to obtain higher returns. But be sure to prioritize risk.
In order to prevent you from using this strategy without knowing it, the trading date of this strategy is only executed until the release date, and positions will not be opened and closed for subsequent markets.
You can contact me if you want to know more about this strategy
這是專門用於幣安1H圖表中btcusdtperp的交易策略
本策略最重要的部分是將支撐和阻力與交易量一起使用
輔助指標包括ADX,成交量,CCI,VWAP,Range Filter等
為什麼不適用於其他交易品種或交易所?
由於每個交易標的的活躍度與交易量不同,本策略非常注重交易量的變化,因此不一定適用於每個交易品種
這個策略的方法是在趨勢明朗的時候進行趨勢跟隨
確定是否打破支撐或阻力以識別趨勢
但市場充滿假突破
因此,成交量是判斷真假的重要指標。
當價格突破支撐位或阻力位,伴隨著巨大的成交量,並與輔助指標形成共振時,策略會順勢而為,同時設置時間止損。進場後,如果沒有立即獲利到止盈,就離場。
但市場總是隨機的,所以必須考慮盈虧比
用固定的止損空間換取更大的盈利空間,保證預期值為正,才能在市場中穩定獲利
因此,該策略使用 3.2% 止損、3.3% 止盈1 和 7.2% 止盈2
約1.5:1盈虧比,確保正期望值
因為市場只有大約 10% 的時間有明顯的趨勢
所以這個策略的交易頻率很低
根據2021-01-01至今的回測,交易頻率大約5天一次
用戶也可以選擇適合自己的槓桿以獲得更高的收益。但一定要優先考慮風險。
為防止您在不知情的情況下使用本策略,本策略的運行交易的日期僅至2023-05-30止,後續日期將不開倉和平倉。
如果您想了解更多有關此策略的信息,可以聯繫我。
Anchored VWAP Large Swings Strategy [1H]Customized anchored VWAPs with 50,100,200,500 periods lookbacks. Weekly opens are used as a confluence regarding the trend.
Best use on 1H timeframe. Feel free to ask questions.

VMACD - StrategyUpdated a basic strategy (Same with MACD) these are the results on XBT-USD (It's Version 3 so no Repainting) probably some of my best work.
BUY = Histo > 0
SELL = Histo < 0
uses my VMA formula modified with change to catch see the overall direction of volume compared to price. Much more efficent than VWAP.

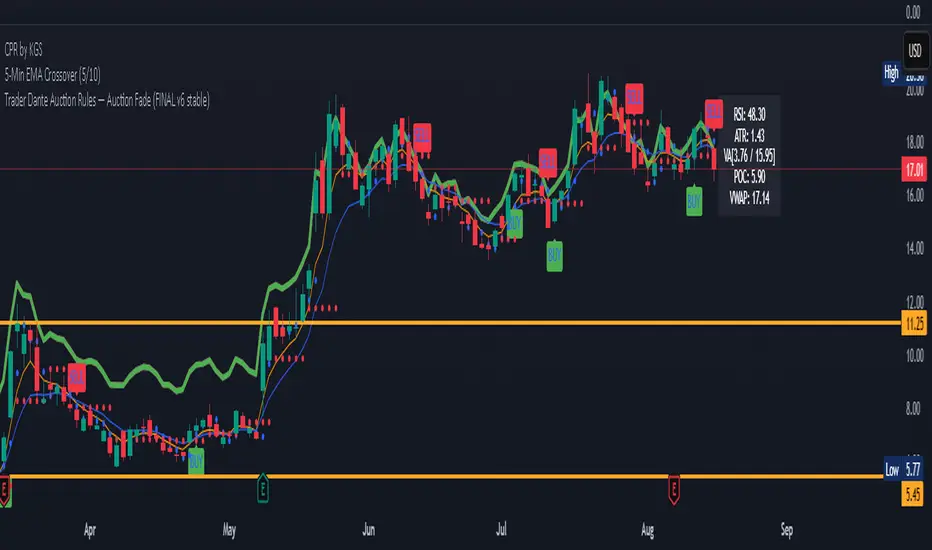
Auction Market Theory: Value Area & VWAP Fade - DashboardAn "Auction Market Theory" dashboard is a visual summary of the market's state according to the principles of Auction Market Theory. It consolidates key metrics like the Value Area (VA), Point of Control (POC), and Volume-Weighted Average Price (VWAP) into a single, easy-to-read panel on your chart.
What a Dashboard Shows
The purpose of the dashboard is to give traders a quick, real-time snapshot of the market's auction process. It helps you answer critical questions like:
Where is the market's "fair value"? This is shown by the Value Area (VA) range.
Where is the most volume concentrated? This is the Point of Control (POC), the price that acts as a gravitational center.
How are market participants currently positioned? The VWAP provides a measure of the average price paid, weighted by volume. Price trading above VWAP suggests a bullish volume bias, while price below suggests a bearish bias.
Is the market in a state of balance or imbalance? The relationship between the current price and these key levels helps to quickly determine if the market is accepting a price range (balance) or rejecting it (imbalance/trend).
How to Interpret the Dashboard
Value Area (VA) & Point of Control (POC)
These metrics are derived from a volume profile and are the foundation of the auction theory dashboard. The dashboard displays the VA's low and high, as well as the POC. These levels define the market's "accepted" price range for a given period.
VWAP
VWAP acts as a real-time moving average that is more responsive to volume than a standard moving average. It's often used as an intraday anchor. When price is significantly stretched from the VWAP (and its standard deviation bands), it's a signal of a potential over-extension and a target for a mean-reversion trade.
Dashboard's Role in Trading
The dashboard is not an entry signal itself, but a contextual tool. It provides the framework for your trading decisions. For a "fade the edge" strategy, you would use the dashboard to:
Identify the edges: See the exact price levels of the VA and VWAP bands.
Wait for the stretch: Look for price to move beyond those edges.
Confirm the reversal: Only then would you look at other indicators (like RSI or volume spikes) for an entry signal.
Manage the trade: Use the POC as a potential take-profit target, as price has a high probability of returning to this point of volume consensus.
Praetor Sentinel V11.2 NOLOOSE BETA📈 Praetor Sentinel V11.2 – "NOLOOSE BETA"
Algorithmic Trading Strategy for Trend Markets with Adaptive Risk Management
Praetor Sentinel V11.2 is an advanced algorithmic trading strategy for TradingView, specifically designed to operate in strong trend conditions. It combines multiple technical systems—including dynamic trend filters, multi-layer EMA structures, ADX-based volatility control, and adaptive trailing stops—into a powerful and automated trading framework.
🔧 Core Features
Multi-EMA Trend Detection: Two EMA pairs (short/long) to identify and confirm directional trends.
XO-EMA Breakout Logic: Fast EMA crossover to detect breakout opportunities.
ADX Trend Filter: Trades only during strong market trends (above custom ADX threshold).
HTF Filter: Optional higher timeframe trend confirmation (e.g. Daily 50 EMA).
VWAP Validation: Ensures entries aren't taken against the volumetric average.
RSI Filter: Adds a momentum filter (e.g. RSI > 50 for long trades).
🎯 Entry Signals
The strategy uses two entry types:
Breakout Entries: Based on XO-EMA cross and multi-EMA trend alignment.
Pullback Entries: Configurable via various methods such as EMA21 reentry, RSI reversal, engulfing candles, or VWAP reclaim.
All entries can be delayed via confirmation candle logic, requiring a bullish or bearish follow-up bar.
🛡️ Risk Management & Exit Logic
Dynamic ATR Trailing Stop: Adjusts stop distance according to market volatility with optional swing high/low protection.
Break-Even Logic: Locks in trades at breakeven once a defined profit is reached.
Hard Stop-Loss: Caps potential loss per trade with a fixed % (e.g. 1%).
Safe Mode ("NOLOOSE"): Exits early if price moves too far against the position — ideal for automated bots that must avoid drawdowns.
🤖 Automation & Alerts
This strategy is fully automatable with services like 3Commas using built-in alert messages for entries and exits.
All parameters are fully configurable to adapt to different assets, timeframes, and trading styles.
⚙️ Additional Features
Configurable leverage & position sizing
Time-based trading window
Built-in Anchored VWAP
Modular design for easy extension
📌 Summary
Praetor Sentinel V11.2 is a professional-grade tool for trend traders who want rule-based entry/exit logic, adaptive stop systems, and robust protection features. When paired with automation tools, it offers a reliable, low-maintenance setup that emphasizes safety, structure, and scalability.
🛠 How to Use Praetor Sentinel V11.2 – NOLOOSE BETA
🔍 1. Basic Configuration (Required)
Setting Description
Enable Long Trades Enables long (buy) positions.
Enable Short Trades Enables short (sell) positions.
Leverage Used for position sizing calculations.
Position Size % Defines % of capital to be used per trade.
⏰ 2. Time Filter (Optional)
Restricts trading to a defined time range.
Setting Description
Start Date Start date for strategy to be active.
End Date End date for strategy to stop.
Time Zone Time zone for above settings.
📊 3. Trend Setup (Essential for Entry Signals)
Setting Description
MA Type Type of moving average: EMA or SMA.
EMA1/2 Short & Long Two EMA-based systems to determine trend.
Fast/Slow EMA (XO) Used for crossover breakout detection.
HTF Filter Uses higher timeframe trend for additional confirmation.
RSI Filter Confirms entries only if momentum (RSI) supports it.
ADX Threshold Ensures trades only occur during strong trends.
🎯 4. Entry Logic
Setting Description
Pullback Entry Type Enables optional entry setups:
"Off"
"EMA21"
"RSI"
"Engulfing"
"VWAP"
| Use Confirmation Candle | Entry is delayed until a confirmation bar appears. |
| VWAP Confirmation | Trade only if price is above/below the VWAP (based on direction). |
Note: You can combine breakout + pullback signals. Only one has to trigger.
🧯 5. Risk Control & Exit Settings
Setting Description
Trailing Stop Mode
"Standard": Classic trailing stop
"Dynamic ATR": Adjusts to current volatility
"Dynamic ATR + Swing": Adds swing high/low buffer
| Enable Break-Even | Moves SL to breakeven once a target % gain is reached. |
| Enable Hard Stop-Loss | Fixed stop-loss (e.g. 1%) to cap trade risk. |
| Enable Safe Mode | Exits trade early if price moves against it beyond defined % (e.g. 0.3%). |
🔔 6. Alerts & Bot Automation
Setting Description
Entry Long/Short Msg Text message sent via alert when a position opens.
Exit Long/Short Msg Alert message for stop-loss/exit logic.
How to automate with 3Commas:
Load the strategy on your chart.
Manually create alerts using "Create Alert" in TradingView.
Use the built-in alert_message values for bot integration.
✅ Recommended Settings (Example for BTC/ETH on 1H)
Long & Short: ✅ Enabled
Leverage: 2.0
Timeframe: 1H
Pullback Entry: "EMA21"
MA Type: EMA
HTF Filter: Enabled (Daily EMA50)
RSI Filter: Enabled
VWAP Filter: Enabled
Break-Even: On at 0.5%
Hard SL: 1.0%
Safe Mode: On at -0.3%
Trailing Stop: "Dynamic ATR + Swing"
📘 Pro Tips for Testing & Customization
Use the Strategy Tester in TradingView to analyze performance over different assets.
Experiment with timeframes and entry modes.
Ideal for trending assets like BTC, ETH, SOL, etc.
You can expand it with take-profit logic, fixed TPs, indicator exits, etc.

BabyShark VWAP Strategy What the code does:
This Pine Script implements a trading strategy based on two indicators: Volume Weighted Average Price (VWAP) and On Balance Volume (OBV) Relative Strength Index (RSI). The strategy aims to identify potential buy and sell signals based on deviations from VWAP and OBV RSI crossing certain threshold levels.
How it does it:
**VWAP Calculation**: The script calculates the VWAP using either standard deviation or average deviation over a specified length. It then plots the VWAP and its upper and lower deviation bands.
**OBV RSI Calculation**: It computes the OBV and then calculates the RSI using the cumulative changes in OBV. The RSI is plotted and compared against predefined levels.
**Table Visibility and Occurrence Counting**: It allows the user to display a table showing the number of occurrences where the price is above Upper Dev 2, below Lower Dev 2, crosses above a higher RSI level, or crosses below a lower RSI level.
**Entries**: Long and short entry conditions are defined based on the position of the price relative to the VWAP deviation bands and the color of the OBV RSI. Entries are made when specific conditions are met, and there hasn't been a recent entry.
**Exit Conditions**: The script includes stop-loss and take-profit mechanisms. It exits positions based on price crossing the VWAP or a certain percentage, and it prevents further trading after a certain number of consecutive losses.
What traders can use it for:
**Trend Identification**: Traders can use the VWAP and its deviation bands to identify potential trend reversals or continuations.
**Volume Confirmation**: The inclusion of OBV RSI provides confirmation of price movements based on volume changes.
**Entry and Exit Signals**: The script generates buy and sell signals based on the specified conditions, allowing traders to enter and exit positions with defined stop-loss and take-profit levels.
**Statistical Analysis**: The visibility of occurrence counts in the table allows traders to perform statistical analysis on the frequency of price movements relative to the VWAP and OBV RSI levels.

RSI of VWAP [SHORT selling]This is SHORT selling version of RSIofVWAP strategy. Settings and Logic are totally different from LONG side version , hence I am publishing it as a new strategy.
Settings
============
VWAP of RSI Length 15
Slow EMA Length 200
Short entry level 25
Cover short level 70
stop loss 5
SHORT Entry
============
condition1 : When RSIofVWAP crossdown below 25 and VWAP is below ema200
condition2: When weekly RSIofVWAP crossdown 70 and VWAP (note : session vwap , not weekly vwap) is below ema200
condition3: Use VIX value , if you want to short when the price is above ema200
vwap RSI crossing down 70 and VIX RSI is cossing up 70
enter short ... This is like falling knife :-)
I need to add the code -- later
if any of above condition is TRUE , SHORT entry will be taken
Take Profit
============
When close less than short entry price and RSIofVWAp is crossing up 25 , take profit ...close 1/3 of the position
Exit
============
When RSIofVWAP crossing up 70 level
Stop Loss
============
Stop Loss is set to 5%
Note:
1. When strategy is in SHORT position , background and bar color changes to gray
2. When strategy is already in short position , possible entries are shown in yellow background
3. RSI Length 15 is working most of the equities on hourly chart. ( RSI length 9 and 14 also works good , but not for all ... You may want to try which setting works for your symbol)
4. weekly VWAP (blue color) is also plotted by default ... you can disable it if you dont want to see it. But there is advantage keeping it on the chart , you can notice whenever weekly VWAP crosses above 70 line , trend is UP ... if you have LONG position you can hold on it ... Hurray :-)
Warning
============
For the educational purposes only

Go_up vwap-rsiIt is the popular RSI indicator with VWAP as a source instead of close.
VWAP (Volume Weighted Average Price) is one of the derived moving average indicators that takes volumes into account in price averaging. VWAP stands for Volume Weighted Average Price.
//LOGIC ENTRY:
Length RSI+VWAP
Oversold - bottom line RSI-VWAP
//EXIT SETTING:
Take profit and stop loss when a certain percentage is reached
//Settings next entry and grid:
Allow signal lower than,% - the next entry into a trade from logic occurs only when a decrease by a certain percentage
Allow grid,% - when the price drops by the percentage specified in the settings, the entry will take place, but only on the next bar.
//DATA RANGE:
-Testing results for any period of time
//PS:
For this strategy, we use pyramiding, we adjust the number of inputs in the "properties" section, by default left 20.
Look at the results in the past and adjust the settings for your capabilities and pitfalls. The default costs 25 entries for $ 400
Change the settings - find better results. share in the comments

QuickSilver Intraday using RSIThis is a simple intraday strategy using very basic intraday super indicators - RSI & VWAP for working on Stocks . You can modify the values on the stock and see what are your best picks. Comment below if you found something with good returns
Strategy:
Indicators used :
The Relative Strength Index (RSI) is one of the most popular and widely used momentum oscillators.The values of the RSI oscillator, typically measured over a 14-day period, fluctuate between zero and 100. The Relative Strength Index indicates oversold market conditions when below 30 and overbought market conditions when above 70
VWAP identifies the true average price of a stock by factoring the volume of transactions at a specific price point and not based on the closing price. VWAP can add more value than your standard 10, 50, or 200 moving average indicators because VWAP reacts to price movements based on the volume during a given period.
Buying happens at VWAP Breakouts which is then validated with RSI to check for overbought & oversold conditions.
Aggressive trade stop can be employed by using the % for long and shorts in the strategy.
Usage & Best setting :
Choose a good volatile stock and a time frame - 10m.
RSI : 9
Overbought & Oversold - can be varied as per user
There is stop loss and take profit that can be used to optimise your trade
Extending this to,
In general guidelines for RSI :
Short-term intraday traders (day trading) often use lower settings with periods in the range of 9-11.
Medium-term swing traders frequently use the default period setting of 14.
Longer-term position traders often set it at a higher period, in the range of 20-30.
The template also includes daily square off based on your time.

BBofVWAP with entry at Pivot PointThis strategy uses BB of VWAP and Pivot point to enter and exit the Long position.
settings
BB length 50
BB Source VWAP
Entry
When VWAP crossing up BB midline and price/close is above weekly PivotPoint ( you can also use Daily pivot point )
Exit
When VWAP is crossing down BB lower band
Stop Loss
Stop loss defaulted to 5%
Note : Long will position will be exited on either VWAP crossing down BB lower band or stop loss is hit - whichever comes first . Being said that some time your stop loss exit is less than 5% which saves from more losses.
Entry is based on weekly Pivot point , so any time frame below weekly will work perfect. I have tested t on 30 min , 1 HR , 4 Hr , Daily charts. Even weekly setting shows good results , that will work for long term investing style.
if you change Pivot period to Daily , chose time frames below Daily.
I also noticed this strategy mostly do not enter Long position in a down trend. Even it finds one , it will be exited with minimal loss.
Warning
For the use of educational purposes only
