CPR PIVOT, 2ST, 5MA, VWAPSUPERTREND 2 supertrend with diffrent patameters. MOVING AVERAGE RIBBON 5 differenT EMA VWAP Simple vwap with bands nothing special every parameters and looks can be change AND CPRPine Script® インジケーターShyHuludの投稿44143
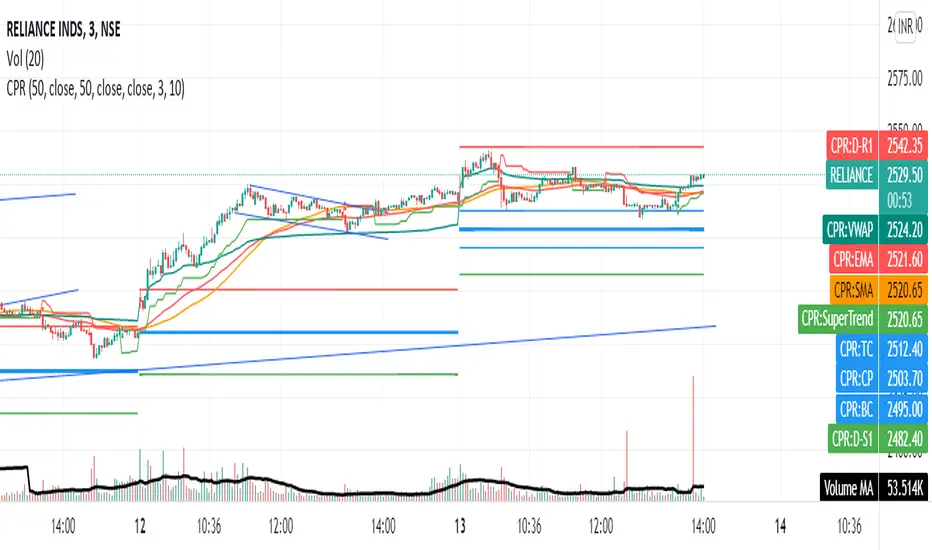
Share market aasan hai CPR with MA & VWAP This script will allow to add CPR with Standard Pivots and 4 Indicators. Standard Pivot has 9 levels of support and 9 levels of resistance lines. It has CPR , 3 levels of Day-wise pivots , 3 levels of Weekly pivots and 3 Levels of Monthly Pivots . In Addition to the CPR and Pivot , this script will allow user to Add 4 more Indicators - SMA , EMA , VWAP and SuperTrend as well. All the Support and resistance levels can be enabled / disabled from settings. It will allow to select multiple combinations of support and resistance levels across 3 levels at any of the 3 time-frames individually and combined. All 4 Indicators can be can be enabled / disabled from settings. This will allow the indicators to be plotted individually and combined along with any combination of CPR & Pivots . These number of combinations will allow user to visualize the charts with desired indicators, pivot support & resistance levels on all or any of the 3 time frames. For Ease of access, listed few points on how the script works.. - CPR and day-wise level 1 & 2 (S1 & R1) enabled by default and can be changed from settings - Day-wise Level 2 & 3 (S2, R2, S3 & L3) can be enabled from settings - Weekly 3 levels and Monthly 3 levels can be enabled from settings - CPR & pivot levels colored in blue lines - All support levels colored in Green - All resistance levels Colored in Red - Day-wise pivot , support & resistance are straight lines - Weekly pivot , support & resistance are cross (+) lines - Weekly pivot , support & resistance are circle (o) lines - SMA , EMA , VWAP and SuperTrend Enabled by Default - SMA - EMA - SuperTrend Pine Script® インジケーターbsbrn0111の投稿120
Hotch v1.02 RSI+Fractals/VWAP Bands/Smoothed Moving Average. In this script the RSI is used the limit number of displayed fractals to only those fractals that are triggered in the RSI Overbought and Oversold areas. This helps keep the chart cleaner looking when combined with other indicators so other icons that are plotted above and below candles are not covered up. For example if the RSI drops below 30 the next fractal would be displayed. If the RSI stays below 30 each fractal would be displayed. If the RSI dips below 30 and returns above 30 before there is a fractal is displayed, the next valid fractal would still be displayed. With optimization of the RSI values this indicator can be used in confluence with the included VWAP bands and Moving average to find trend reversal entry points for trades. Also recommended is to use a divergence identifying lower indicator as a secondary confirmation of trade entry. Example of a potential long entry using the displayed chart. 1) RSI under 30 2) Price was recently outside of your chosen VWAP multiple. 3) a fractal was triggered. Additionaly: 4) Use other indicators or other confluences for a stronger trade signal. 5) Use your preferred method of determining entry price stop loss and take profit. NOTE: Fractals normally paint two bars behind the current bar. In this code, with the combination of the RSI and Fractal Trigger, the fractal paints an icon on the current bar. Pine Script® インジケーターHotchachachaaaの投稿更新済 44151
Multi VWAPMulti VWAP indicator for Wick Hunter For when you are running out of indicator slots Can configure each set for Setting 1/2/3, or for Binance bot 1/Binance bot 2/Bybit bot, etc. By honeybadger, built on original code by STP Todd (see indicator "Wick Hunter VWAP")Pine Script® インジケーターhoneybadgermakesfunnymoneyの投稿更新済 33246
Strongholds - Objective & Accurate Reference Points / StructuresVery early in my trading career, I came across Pivot Points only to find out that there are as many calculations as one pleases. It was hard to find out which ones work. Most of them probably did only out of randomness, so I ditched the strategy and looked for something else. I previously used my Oracle Eye and Reference Points scripts but it is time for an upgrade. Stronghold is a script I have used for quite some time now. I ditched daily and weekly closing prices as not that important. Instead, Strongholds are equipped with: ►Daily High & Low • Azure color ►Weekly High & Low • Dark blue ►Weekly old High & Low • Semi-transparent dark circles ►Monthly High & Low • Wizardly purple There is an option to print: ►4h High & Low • Semi-transparent red ►VWAP • Lovely purple ►Weekly VWAP • Black All of the levels and lines are set for 1m, 5m, 10m, 15m, 30m, 1h, 4h, 1D timeframes. If you use any alien timeframe, you may need to enter the code. You can opt-in and out for certain timeframes. For example, daily levels are visible from 15m or 30, so the indicator won't draw them unless you want to. However, they will not be seen on higher timeframes as there is no reason to show them and oversaturate the chart with lines. ▬▬▬▬▬▬▬▬▬▬▬▬▬▬▬▬▬▬▬▬▬▬ Remember that if you use this script with auto-scale, you need to tick Scale Price Chart Only . Otherwise, your chart will fly to the moon! Good luck & have fun! Pine Script® インジケーターOrcChieftainの投稿更新済 88508
RSI-VWAP Indicator %█ OVERALL Simple and effective script that, as you already know, uses vwap as source of the rsi, and with good results as long as the market has no long-term downtrend. RsiVwap = rsi (vwap (close), Length) The default settings are for BTC in a 30 minute time frame. For other pairs and time frames you just have to play with the settings. █ FEATURES • The option to start trading from a certain date has been added. • To make the profit more progressive, a percentage of your equity is used for entries and a percentage of your position is used for closings. • The option to trade in Spot mode has been added, since, for the TradingView backtest, the money is infinite and if you do not limit it somehow, it would offer you much better profits than the live trading. QuantityOnLong = Spot ? (EquityPercent / 100) * ((strategy.equity / close) - strategy.position_size) : (EquityPercent / 100) * (strategy.equity / close) • The option to stop the system when the drawdown exceeds the fixed limit has been added. Drawdown, as you already know, is a very important measure of risk in trading systems. The maximum drawdown will tell us what the maximum loss of a trading system has been during a period. This maximum loss is determined by: strategy.risk.max_drawdown(Risk, strategy.percent_of_equity) • Leverage plotted on labels added. █ ALERTS To enjoy the benefits of automatic trading, TradingView alerts can be used as direct buy-sell orders on spot, or long-close orders with leverage. Currently there are Chrome extensions that act as a bridge between TradingView and your Exchange or Broker. This is an example of syntax for this type of extensions. Copy and paste a message like this into the alert window: {{strategy.order.action}} @ {{strategy.order.price}} | e = {{exchange}} a = account s = {{ticker}} b = {{strategy.order.action}} {{strategy.order.alert_message}} █ NOTE Certain Risks of Live Algorithmic Trading You Should Know: • Backtesting cannot assure actual results. • The relevant market might fail or behave unexpectedly. • Your broker may experience failures in its infrastructure, fail to execute your orders in a correct or timely fashion or reject your orders. • The system you use for generating trading orders, communicating those orders to your broker, and receiving queries and trading results from your broker may fail. • Time lag at various point in live trading might cause unexpected behavior. • The systems of third parties in addition to those of the provider from which we obtain various services, your broker, and the applicable securities market may fail or malfunction. █ THANKS Thanks to TradingView, its Pine code, its community and especially those Pine wizards who post their ideas that helps us to learn. If the world is heading toward a equitable new world economic order, let's get rich first ... Happy trading!Pine Script® ストラテジーUnknownUnicorn2151907の投稿更新済 3434 2.4 K
Dynamic Sigma VWAP and Volume Sigma LevelsEver Wondered How can you confidently Identify Reversals / and Trend Direction with Volume ? So this Script will help you out with that! What I am talking About? 1. Volume Standard Deviations Spikes being Projected Over the Price 2. Dynamic VWAP being Calculated from the Points of extremities in Volume Action {estimated using Standard Deviation Sigma Level} So, This is how sigma levels of 1sigma, 2sigma and 3sigma will look over the volume Whenever Volume Spikes through these Sigma Levels, Price Projections are Formed by this Indicator, both on Current Timeframes and Higher Timeframes Prices So, This is what price projection of Volume Sigma Levels (1,2,3sigmas crosses) will look if projected on Same Timeframe period And This is how they look on chart using Higher Timeframe Period, (Default Higher Time Frame is 60mins, You can tweak as per your convenience) Once All the Sigmas are projected Over the Price, Dynamic VWAP is calculated from the points where volume crosses current Time Frame 2sigma and 3sigma Levels see, This helps out in figuring a lot of things in the price volume action! Play with it, and Enjoy! Pine Script® インジケーターAnkit_1618の投稿1111475
Long only strategy VWAP with BB and Golden Cross EMA50/200 This is strategy, mainly designed for stock markets It makes uses of the EMA 50/ 200 ( Golden cross) and VWAP and Bollinger bands. It only takes long positions. It can be adapted to all time frames, but preferably to be used with longer timeframes 1h + The rules for entry are the next ones : 1. EMA50 > EMA 200 2. if current close > vwap session value 3. check if price dipped BB lower band for any of last 10 candles EXIT RULE 1. price closes above BB upper STOP LOSS EXIT 1. As configured --- default is set to 1%Pine Script® ストラテジーSoftKill21の投稿22292
Stock Market Strategy : VWAP, MACD, EMA, Breakout, BBHello there, Today I bring you a stock market strategy, specialized in NASDAQ stocks. Its a daytrading strategy, that can only do a max of 1 trade per day. In this case it only trades the first 2 opening hours of the market. The rules are simple : We follow the trend based on a big EMA, in this case 200, after that, we check for VWAP direction , then, we check histogram from MACD. This is the simple logic of the strategy. Inside there is another strategy, that not just do the above, but also uses Bollinger bands, and checks for breakout of bottom or top line. Also it uses Average directional Index, for even a bigger criteria . So for example a long condition it would be : candle is above the ema, and candle is above vwap, and histogram is positive, and candle break the top bb level and ADI < 40 -> long signal . The opposite works for short(ADI > 20). In this case all this criterias are between the first 2 hours of market. So we enter between the first hour, and exit in the next hour. For this we need to use very short time frames. Hope you enjoy it. Let me know if you have any questionsPine Script® ストラテジーSoftKill21の投稿11409
[CP]VWAP + 9 Moving Averages + 3 Jurik MA9 Adjustable EMAs with offsets, with two of them having the option of adjustable 'bands' around them. VWAP line along with an offset and adjustable 'band'. Incredible 3 Jurik Moving Averages! A single indicator giving you infinite options to play around with EMAs, VWAP and the amazing JMA. Note: The bands look best in dark mode.Pine Script® インジケーターpranjalchaubeyの投稿66198
BNF VWAP & MAThe script picks up Bank nifty stocks with their current respective weights and plots a Volume Weighted Average Price ( VWAP ) line along with 2 EMAs of your choice and an alert when the EMAs cross over and also when price crosses VWAP . You can customize the script for MA type and lengths and to remove alert. Basic utility of the script is to analyse volumes driving the Bank Nifty index. Credits to @daytraderph and his script (Custom Volume ) who's code I used to build this script. Also thanks to my friend @Varun who helped me code it.Pine Script® インジケーターWealth_Guideの投稿更新済 88756
WOMBO COMBO: EMA & VWAP & MACD & BB & STCHello my fellow investors, After hours of reading, backtesting, and YouTube video watching I discovered that EMA, VWAP, BB, MACD, and STC produce the most consistent results for investment planning. This strategy allows you to pick between the aforementioned indicators or layer them together. It works on the pricipal of: 1) Always follow the market trend - buy/sell above/below 200EMA 2) Follow corporate investing trends - buy/sell above/below VWAP 3) Apply MACD check - buy--> MACD line above signal line and corssover below histogram \\ sell --> MACD line below signal line and crossover above histogram. 4) Check volitility with price against BB limits upper/Sell or lower/buy 5) When STC crosses about 10 buy and when it drops below 90 sell 6) Exit position when stop loss is triggered or profit target is hit. BB also provides a parameter to exit positions. This code is the product of many hours of hard work on the part of the greater tradingview community. The credit goes to everyone in the community who has put code out there for the greater good.Pine Script® ストラテジーMakeMoneyCoESTB2020の投稿更新済 1111837
Hikkake PatternLifted description from web: Hikkake means to trap, trick, or ensnare. Primarily, this price pattern seeks to identify inside bar breakouts and profit from their failures. An inside bar is a price bar that is entirely within the range of the preceding price bar. Inside bars are typical on price charts of most timeframes. While you’ll often find inside bars in congested markets, they also offer a low-risk entry point for price action traders. The contracted range of an inside bar offers a natural tight stop-loss. Hence, inside bar breakouts seem attractive. However, if you are patient and focus on identifying false breakouts, you might be able to find more reliable trading setups in the form of Hikkakes. In a nutshell, the Hikkake pattern offers a systematic approach to trading false inside bar breakouts. As a filter I incorporated VWAP into the code to only trigger Bullish / Bearish signals when price is Above/Below VWAP respectively. The ATR is used to create a Stop buffer (red cross) for the Entry signal ( green dot ). The R1 and R2 (orange squares) are two possible profit targets that are customizable to different Risk multiples based upon the difference between Entry and Stop.Pine Script® インジケーターnorokの投稿33294
BAT Multi Anchored VWAPMulti Anchored VWAP which includes: BTC Key Pivots SPX Key Pivots Yearly Opens 5 Adjustable Dates Works on all assets, unlike some VWAP calculations.Pine Script® インジケーターbatlethの投稿更新済 3363
Colored Volume Weighted Average PriceSimple addition to the standard VWAP indicator. If price is above VWAP the plot is colored green. If below plot is colored red. Colors are configurable. You can also choose the source for price (i.e. open/low/high etc)Pine Script® インジケーターlvturnerの投稿22472
Multi-Strategy Filter: Pivot/Breakout/VWAP/RSI/MACDStrategy Overview: Multi-Confirmation Technical Scanner This filter is a high-probability trend-following system that combines three core trading methodologies: Pivot Points (for institutional levels), Breakout Trading (for price action momentum), and VWAP (for volume-weighted value tracking). To ensure accuracy and avoid false breakouts, a signal is only generated when at least three of these core strategies align, further validated by a "Sweet Spot" RSI (momentum confirmation without being overbought) and a bullish MACD crossover. This multi-layered approach identifies stocks with strong institutional support and significant upward momentum.Pine Script® インジケーターfimasanの投稿5
Ema+Vwap+ORB4 Ema, Vwap plus the ORB, defined by User. Previous Day, Week and Month Highs and Lows.Pine Script® インジケーターjuliocruz01の投稿4
G&G VWAPSimple VWAP Indicator with green and red shading signaling buyers or sellers in control. Blue line in middle is decision line. Pine Script® インジケーターGridandGrit_Chartingの投稿9
GCM Apex Predator AlgoTitle: GCM Apex Predator Algo Overview The GCM Apex Predator is a high-performance, multi-engine trading system designed for traders who demand precision and clarity. Whether you are a fast-paced scalper or a patient swing trader, this algorithm adapts to market conditions using a sophisticated "Apex Score" momentum engine combined with institutional-grade volume and trend filters. Key Features • Triple Engine Logic: Switch seamlessly between Scalper Mode (Fast), Trend Mode (Swing), or a Hybrid setup that captures both micro-moves and macro-trends. • Apex Score Momentum: A proprietary loop-based engine that calculates the "persistence" of price action. It filters out "fake" moves by ensuring momentum is backed by structural strength. • Institutional Filters: Includes built-in ADX Trend Power and Relative Volume filters to keep you out of "chop" and only in high-probability trades. • Dynamic Risk Management: Automatically calculates and draws Entry, Stop Loss (SL), and Take Profit (TP) zones using ATR-based volatility, giving you a professional "desk" feel. • Corporate Dashboard: A real-time HUD (Heads-Up Display) that monitors Trend Bias, ADX Power, Apex Momentum, and VWAP positioning at a glance. How to Use 1. Select Your Mode: Use the "Scalper Mode" for lower timeframes (1m, 5m) or "Trend Mode" for higher timeframes (1h, 4h). 2. The "Sniper" Signal: Look for the Gold Circle symbols. These represent "Sniper" entries where all engines (Trend, Volume, and Apex) align for a high-conviction move. 3. Market Structure: Pay attention to the dashed reversal lines. These project potential structural shifts based on fast-reversal HMA logic. Alerts This indicator is fully optimized for Any alert() function call. You can set one single alert to receive detailed notifications like: • 🎯 SNIPER LONG: BTCUSD @ 65000 • ⚡ SCALP BUY: EURUSD @ 1.0850 Disclaimer Trading involves significant risk. This tool is for educational and technical analysis purposes. Past performance does not guarantee future results. Pine Script® インジケーターuniGramの投稿更新済 723
ES VWAP + GEX OverlayAI v6 ES VWAP + GEX Overlay. The system seems to want me to add more text for description before I know it it works. Pine Script® インジケーターjdye001の投稿4
Kotegawa Dip ReversalTakashi Kotegawa trading indicator it is meant to buy cheap japanese stocks when they are below vwapPine Script® インジケーターEloniTheの投稿14
Adaptive Pullbacks ML v2.5Adaptive Pullbacks ML - Context-Aware Trend Trading Overview Adaptive Pullbacks ML is a sophisticated trend-following tool that solves the biggest problem in pullback trading: "Is this a dip to buy, or the start of a reversal?" Unlike standard indicators that use fixed percentages or static moving averages, this script uses a 5-Dimensional k-Nearest Neighbors (k-NN) machine learning engine to learn the specific characteristics of successful pullbacks for the asset you are trading. The 5-Dimensional ML Engine The market is dynamic. A pullback depth that works in a low-volatility lunch session might fail during a high-volatility news event. This indicator tracks 5 key dimensions for every pullback: Depth (ATR Normalized): How deep is the pullback relative to volatility? Trend Slope: Is the trend steep (parabolic) or flat (grinding)? ADX: How strong is the directional energy? VWAP Distance: Is price extended or close to value? Time of Day: Is this a morning drive or an afternoon fade? When a new pullback occurs, the k-NN engine finds the 5 most similar historical events across these dimensions and predicts the probability of success. Core Features 1. Fractal Normalization The indicator speaks the language of ATR (Average True Range). It doesn't care if you trade the 15-second chart or the Daily chart. A "1.5 ATR Pullback" is a statistically comparable event across all timeframes, allowing for robust, scale-invariant analysis. 2. HTF Stats Bridge (Higher Timeframe Data) You can trade on lower timeframes (e.g., 1-minute) while using statistics derived from higher timeframes (e.g., 15-minute). This ensures your signals are based on significant market structure, not microstructure noise. 3. Smart Zones The indicator plots dynamic "Value Zones" based on learning: Cyan Zone (Avg Depth): The "Sweet Spot". High probability bounce area. Yellow Zone (Sigma): The "Extension". Price is stretching elastic limits. Red Zone (Deep): The "Danger/Opportunity". Statistical anomaly. 4. PQS & k-NN Filters Two layers of filtering protect your capital: PQS (Probability Qualification Score): Based on raw win-rate of the zone. k-NN Probability: Based on similarity to past winners. Settings Guide Stats Timeframe: The timeframe to learn from (Leave empty for Chart). Trend/Trigger Settings: Define what constitutes a trend for your strategy. k-Neighbors: Number of historical twins to compare (Default: 5). Min PQS / k-NN: Thresholds for filtering weak signals. Disclaimer: This tool is for educational purposes. Past performance of the k-NN engine does not guarantee future results.Pine Script® インジケーターSelfsimilarityの投稿更新済 1125